The Fisheries of Japan - Scientific Publications Officespo.nmfs.noaa.gov/Circulars/CIRC233.pdf ·...
29
The Fisheries of Japan UNITED ST ATES DEPART MENT OF THE INTERIOR FISH AND WILDLIFE SERVICE BUREAU OF COMMERCIAL FISHERIES Circular 233
-
Upload
trinhhuong -
Category
Documents
-
view
215 -
download
0
Transcript of The Fisheries of Japan - Scientific Publications Officespo.nmfs.noaa.gov/Circulars/CIRC233.pdf ·...

The Fisheries of Japan
UNITED ST ATES DEPART MENT OF THE INTERIOR
FISH AND WILDLIFE SERVICE
BUREAU OF COMMERCIAL FISHERIES
Circular 233


I 1 ] \]
The Fisheries of Japan
r
r 1

CONTENTS
Page
Introduction......... ........•... .... ... .•.•..... ..........•....... ....•. ..... .......•..•. 1 Areas of operations ....................•........•............. ..............•......... 2 Fishery catch ...... ....•............ .......•.....•..... ........•........................ 4 Types of fisheries .........•...................................•.................•..... 4
Marine fisheries ............•...........•..........•..................•....•..... 4 Domestic fisheries .•.• ... ..•.................................... .......... 4 Pelagic high-seas fisheries............................................. 5 Aquiculture in shallow seas............................................. 7
Inland fisheries................................................................... 7 Important marine species ........................•......•....................•.•.•.. 7
Tunas and allied species....................................................... 7 Bottomfishes ....... ....... ......•...... ................... ..•.. .... ...... ........• 9 Herring, sardines, and allied species...................................... 10 Salmon ....................................•.•.•.............•....................... 11 Jacks, scads, and allied species............................................. 12 Mackerels..................................... .... ......•... ................ ...•... 12 Saury ................................................................................ 12 Spearfishes ...................................•.................................•.. 12 Squid, cuttlefish, and octopus................................................. 12 Shrimp ..........................................•.............•.............•...•... 13 King crab........................................................................... 13
Whaling ................................................................................... 13 Fishing craft ............................................. . .............................. 14 Fishermen ....... . ....................................................................... 16 Fishing organizations................................................................. 16
Management units................................................................ 16 Fishery cooperatives ........................................................... 16 Fishing unions .............. ~..................................................... 17
Distribution and marketing.... .............. ......................................... 17 Landing facilities................... ............... . ............. ................ 17 Wholesale markets ................................... . ............... . .... . ..... 17 Transportation facilities................. . ..................................... 18
Preservation and processing ....................................................... 18 Icemaking, refrigeration, and freezing facilities •....................•. 18 Processing....................................................... .... .............. 19
International trade . ........................................... ..... .................... 20 Exports ... .... ..... ... ..... ..................... ........ . . ...... ................... . 20 Imports..................................... . ... . ..... . ... ..•.. .... .......•....... . . 22
Government support to the fisheries ........ ................................... . 23 International restrictions and agreements............... ....................... 24
International Convention for the High Seas Fisheries of the North Pacific Ocean.. ........................... .•••••....... ...............• 24
Northwest Pacific Fisheries Convention ..... . ............................ 24 Interim Convention on Conservation of North Pacific Fur Seals ... 25 International Convention for the Regulation of W h aling .•........ •.... 25 Japan-Communist China Fisheries Agreement.......... ..... . .......... 25
iii
The Fisheries of Japan
By
SIDNEY SHAPIRO, Foreign F isheries Specialist
Bureau of Commercial Fisheries, Washington, D.C.
ABSTRACT
Trends, developments, and statistical data are presented on important aspects of Japan's worldwide fisheries. Included are discussions of the prlnClpal types of fish and other aquatic products landed by the Japanese, areas in which species are caught, size and composition of the fishing fleet, fishermen's organlzatlOns, marketing methods, the main uses to which fishery products are put, trends in international trade, and the structure of the Japanese f ishing industry. InformatlOn is also presented on Government support to the fisheries and on lnternational fishery agreements to which Japan is a party.
INTRODUCTION
Long the world's leading fishing nation, Japan lost its prominent position to Peru in 1962 and 1963, but only in regard to quantity of fishery products landed (table 1). In value, Japan continued to be foremost; its fishery catch of 6.7 million metric tons in 1963 was worth $1.3 billion. By contrast, Peru's catch of 6.9 million tons--nearly all anchovy for reduction to meal and oil- -was valued at $70.7 million.
Japan is the foremost whaling nation in the world. In its Antarctic operations alone, it produced 46 percent of the total baleen whale oil produced in that area in 1963 as well as large quantities of whale meat and other products.
Japanese income f:;oom fishing has been going up rapidly. Nevertheless, because the country is becoming so heavily industrialized, the fisher ies ' share of the gross national income has been going down. In 1963 the fishing industry's income was 2.3 percent of the gross national income.
The Japanese consumption of fishery products has been rising steadily. On alive-weight basis, the Japanese consumed about 42 kilograms (92 pounds) of fishery products (including whale meat) per person in 1953. By 1962, consumption had risen to about 55 kg. (l211bs.) per person. Although annual per capita consumption has increased more than 30 percent during the past decade, fishery products now supply only two-thirds of the animal protein in the Japanese diet. Formerly fishery prod-
Note:--Statistical data in this report are presented in metric units. A metric ton equals 2,204.6 pounds; a kilogram equals 2.2 pounds.
ucts provided as much as 90 percent of the animal protein consumed . More mllk, eggs, and meats have become available .
The Japanese fisheries are charactenzed by a diversity of operations, varying from the most primitive to the most modern. Coastal and nearby offshore waters contain an abundance of fish that are used primarily to feed the expanding Japanese POpulatlOn. Distant high-seas operations, especially for more valuable exportable fish and shellfish, have been extended into nearly every body of water in the world. Japan's fisheries now range over almost the entire Pacific Ocean, extending into the eastern Bering Sea and the Northeast Pacific off the coast of the United States. Operations are also carried on in the Indian Ocean, the tropical Atlantic Ocean, and the Northwest Atlantic. In addition, Japanese companies have many agreements wlth foreign governments and companies to conduct joint fishing operations.
Japan's leading exports are industrial products manufactured from imported raw materials, whereas fishery exports are prepared almost entirely from Japanese-caught raw materials. Spurred by the need to earn foreign exchange, Japan has energetically developed its fishery export trade. The country is the world's leading exporter in value of fishery commodities; Peru exceeds Japan In
quantity exported. In 1962, Japanese flshery exports were valued at $315.3 million, or nearly 7 percent of the value of all Japanese exports. Fishery exports dropped in 1963 to $282.7 million, estimated to be between 5 and 6 percent of the value of total exports. At one time, the Japanese imported few fisheryproducts; however, since 1960, imports have grown, principally to supply a heavy demand for fish
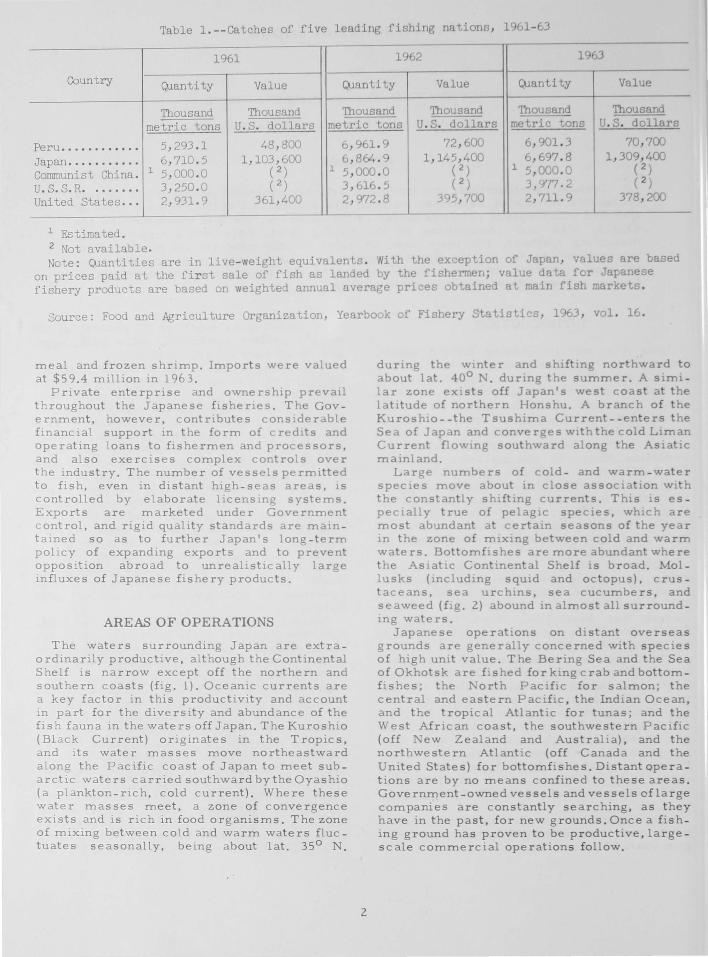
Table l.--Catches of five leading fishing nations, 1961-63
1961 1962 1963
Country (pantity Value (pantity Value C)Janti ty Value
Thousand Thousand Thousand Thousand Thousand Thousand metric tons U. S. dollars metric tons U.S. dollars metric tons U. S. dollars
Peru •..•..•.•... 5,293 . 1 48,800 6,961. 9 72,600 6,901.3 70,700
Japan ..•••..•.•. 6,710 . 5 1,103,600 6,864 . 9 1,145,400 6,697 .8 1,309,400 1 5,000 . 0 ( 2 ) Communist China . 1 5,000 . 0 ( 2) 1 5,000 . 0 ( 2)
( 2 ) U. S.S. R • ...... . 3,250.0 ( 2 ) 3,616 . 5 ( 2 ) 3,'1'17.2 United States ..• 2,931. 9 361,400 2,972 . 8 395,700 2,711. 9 378,200
1 Es tima ted . 2 Not available. Note: Quantities are in live-weight equivalents . With the exception of Japan, values are based
on prices paid at the first sale of fish as landed by the fishermen; value data for Japanese fishery products are based on weighted annual average prices obtained at main fish markets .
Source: Food and Agriculture Organization, Yearbook of Fishery Statistics, 1963, vol. 16.
meal and frozen shrimp. Imports were valued at $59.4 million in 1963.
Private enterprise and ownership prevaIl throughout the Japanese fisheries. The Government, however, contributes consIderable financial support in the form of credits and operating loans to fishermen and processors, and also exercises complex controls over the industry. The number of vessels permitted to fish, even in distant high-seas areas, IS controlled by elaborate licensmg systems. Exports are marketed under Government control, and rigid quality standards are mamtained so as to further Japan's long-term policy of expanding exports and to prevent opposition abroad to unrealistically large influxes of Japanese fishery products.
AREAS OF OPERATIONS
The waters surrounding Japan are extraordinarily productive, although the Continental Shelf is narrow except off the northern and southern coasts (fig. 1). Oceanic currents are a key factor in this productivity and account in part for the diversity and abundance of the fish fauna in the waters off Japan. The Kuroshio (Black Current) originates in the Tropics, and its water masses move northeastward along the Pacific coast of Japan to meet subarctic waters carried southward by the Oyashio (a plankton-rich, cold current ). Where these water masses meet, a zone of convergence exists and is rich in food organisms. The zone of mixing between cold and warm waters fluctuates seasonally, being about lat. 35 0 N.
2
during the WInter and shifting northward to about lat. 40 0 N. during the summer. A similar zone exists off Japan's west coast at the latItude of northern Honshu. A branch of the Kuroshio--the Tsushima Current--enters the Sea of Japan and converges wIththe coldLIman Current flOWIng southward along the ASIatic mamland.
Large numbers of cold - and warm-water specIes move about in close assocIatIon WIth the constantly shifting currents . This IS especIally true of pelagIC species, whIch are most abundant at certain seasons of the year in the zone of mixing between cold and warm waters. BottomfIshes are more abundant where the Asiatic Continental Shelf is broad. Mollusks (mcludIng sqUId and octopus), crustaceans' sea urchIns, sea cucumbers, and seaweed (fIg. 2) abound In almost all surrounding waters.
Japanese operations on dIstant overseas grounds are generally concerned with species of high umt value. The Bering Sea and the Sea of Okhotsk are fished for king crab and bottomfIshes; the North PacifIc for salmon; the central and eastern Pacific, the Indian Ocean, and the tropic al AtlantIc for tunas; and the West African coast, the southwestern Pacific (off New Zealand and Australia), and the northwestern Atlantic (off Canada and the United States) for bottomfishes. Distant opera tions are by no means confined to these areas. Government-owned vessels and vessels cflarge companies are constantly searching, as they have in the past, for new grounds. Once a fishing ground has proven to be productive, largescale commercial operations follow.

440
32
/.: WARM CURRENT '? COLD CURRENT
ZONE OF CONTACT •.••••.• BETWEEN CURRENTS
,-' .... -"" /100 FATHOM LINE
.. , I
/ /" I I rIA I ORTH
: PACIFIC
I I ;:RRE J
~--~
\ I , , • j
/ 132 0 136 0 140 0 144 0
Figure l.--Schematic representation of surface currents off Japan during summer months.
3
440
400
360
320

Figure 2.--Women divers ready to gather tengusa seaweed, the source of agar. Shizuoka Prefecture, Japan, 1947.
FISHERY CATCH
At the end of World War II, the Japanese catch of fish, shellfish, other aquatic anImals (excluding whales), and seaweed was about 1.8 million metric tons (fig. 3), or less than half the prewar catch. Progress in rebuilding the Japanese fishing fleet was rapid, but lt was not until the early 1950'sthatthecatchattained prewar levels. Since 1950, the Japanese fishery catch has more than doubled, reaching an alltime high of 6.9 million tons in 1962 (table 1). During this period all segments ofthe industry increased production, but the most spectacular
rHOUSAND METRIC TONS
Figure 3.--Japanese fishery catch, by type of fisheries, 1945-63.
MARINE
4
advance was in the pelagic hlgh -s eas hshenes. In 1963 the total catch declined to 6.7 million tons because of a smaller take ofbottomflshes.
TYPES OF FISHERIES Predomlnating m the Japanese fisheries are
marine operations, which generally produce more than 98 percent of the total catch. The marine catch was 6 .6 million tons in 1963 (table 2). Japan lacks an extensive river and lake system; also, large land areas are not available for pond culture. Nevertheless, 107,000 tons of fish, shellfish, and aquatic plants were obtained from inland waters in 1963, indicating the intensity with which fishing is done and aquiculture i s practiced.
Marine Fisheries
For statistical and operational purposes, Japan's marine fisheries are divided into three major categories - -domestic fisheries, pelagic fisheries on the high seas, and aquiculture in shallow seas.
Domestic fisheries.--In 1963, the catch in the domestic fisheries was 5.5 million tons (table 3), or 84 percent of the total marine catch. Included in the domestic fisheries are operations conducted from shore or from small and large fishing craft based in Japan. The domestic fishing grounds are mainly

Table 2 .-- Japanese catch of fish, shellfish, and other aquatic products, by type of fisheries, 1950, 1955, and 1960-63
--Narine fisheries Inland fisheries
Year Grand
Domestic Pelagic
Aquicu1ture Total Natural
Aquicu1ture Total total high seas waters
f----
Thousand Thousand Thousand Thousand Thousand Thousand Thousand I Thousand metric metric metric metric metric metric metric metr.<c --- ---
tons tons tons tons tons tons tons tons
1950 .•• • •• 3,251 6 48 3,305 63 5 68 3,373 1955 •••. . . 4,475 185 154 4,814 82 11 93 4,907 1960 •• •... 5,142 677 284 6,103 74 15 89 I 6,::'92 1961 •••••. 5,403 887 322 6,612 81 18 99 6,711 1962 .••.•• 5,585 814 362 6,761 84 20 104
II 6,865
1963 • •• • .. 5,511 689 391 6,591 84 23 107 6,698
Source: Japanese Ministry of Agriculture and Forestry, Annual Report of Catch Statistics on Fishery and Aquicu1ture, 1963.
the coastal and offshore waters around the Japanese islands. No definite outer limit exists, however, and some domestic vessels may fish in areas where pelagic high-seas vessels fish . For example, domestic vessels fish for tunas as far distant as the central and southern Pacific and the IndianOcean; trawlers work on the Asiatic Continental Shelf in the East China Sea and the Sea of Okhotsk; and some drift gill netters from Hokkaido take salmon in the area of the North Pacific worked by factoryship fleets.
The species caught in largest amounts in the domestic fisheries are pelagic surfaceswimming schooling types that migrate close along Japan's coast or through nearby offshore waters. Off eastern Hokkaido andnortheastern Honshu, pelagic catches consist mainly of the cold - water saury, salmon, and squid; herring are taken along the west coast of Hokkaido. Tuna, mackerel, jack mackerel, anchovy, and other subtropical or temperate species are abundant off southern Japan. Where the Kuroshio and Oyashio meet off east-central Japan, both cold- and warm-water species are taken. Fish available in enormous quantities - - for example, jack mackerel, mackerel, anchovy, saury, and skipjack- -are generally found near shore where small craft can operate; at times these species move offshore where larger vessels are needed.
Bottomfishes are plentiful on the Continental Shelf around Japan but mainly off the northern and southern coasts. Alaska pollock, cod, Atka mackerel (a greenling), and rockfish predominate off Hokkaido. Croakers, sea breams, and a large number of miscellaneous species are taken from the East China Sea and the Yellow Sea.
Pelagic high- seas fisheries. --Included in this category are large-scale distant operations, not only for pelagic species but for bot-
5
tomfishes and crustaceans. Before World War II, the Japanese trawledinoverseas area:; and also pioneered and developed the use of floating factoryships for taking and processmg salmon and crab. The largest prewar production from these high- seas activities was obtained in 1938 when about 65,000 tons were caught . After the war, operations were not resumed until 1950 and then only on a small scale. With the Signing of the peace treaty in 1952, the high-seas fisheries expanded to reach a peak production of 887,000 tons in 1961. Production declined to 689,000 tons in 1963, mainly because of curtailed factoryship trawling operations for bottomfishes in the Bering Sea.
The pelagic high-seas fisheries consist of (1) operations in the Sea of Okhotsk and the Be:-ing Sea for bottomfishes, uSing factoryships and catcher boats (trawlers mainly, but including gill netters longliners, and Danish seiners); (2) trawler operations by single vessels (some based at overseas ports) in the Bering Sea, the South Chma Sea, the Northwest Atlantic, and in waters off western Africa, New Zealand, and northwestern Australia; (3) factoryship operations for salmon"n the North Pacific; (4) factoryship operatlOns for crabs in the Sea of Okhotsk and the Bermg Sea (fig. 4); (5) worldwide tuna longline operations by single vessels based at overseas ports or by factoryship fleets operatmg in the Pacific, Indian, and Atlantic Oceans; and (b) pearling in the Arafura Sea.
Overseas fishery agreements for baSing Japanese fishing vessels abroad have been negotiated by large companies as a means of reducing operatmg costs. The agreelT'ents have been negotiated for (1) supply, transshipment, and sales bases; (2) joint fishmg and processing companies With capita furnished by Japanese and local people; (3) contract or concession fishmg to supply fishery products to a loca~ government or c.ompany,
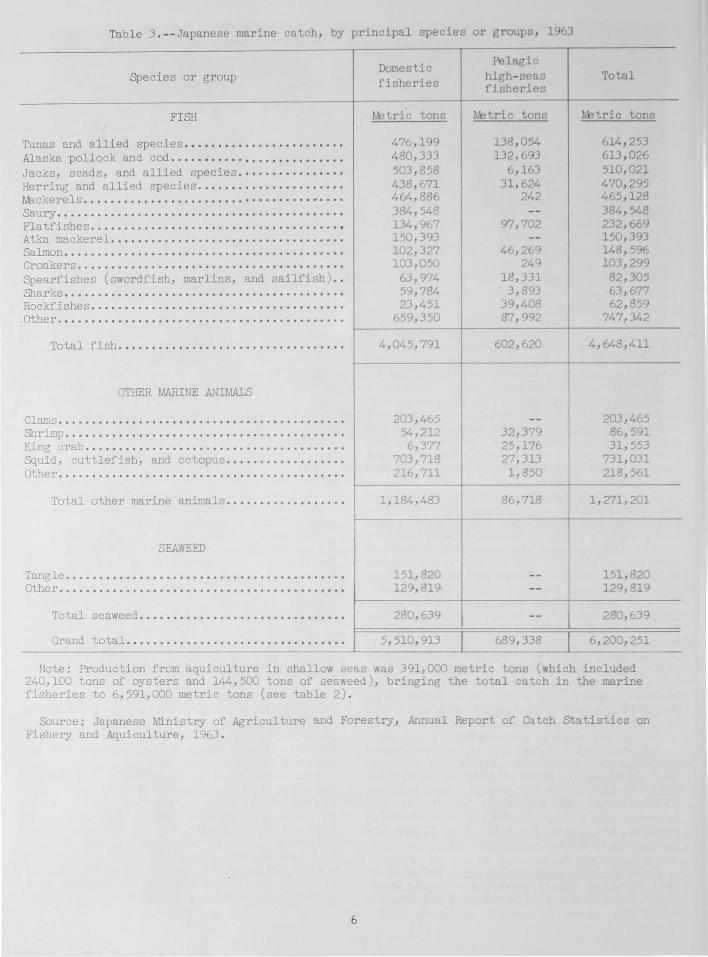
Table 3 .--Japanese marine catch, by principal species or groups, 1963
Species or gr oup
FISH
Tunas and allied spec i es ....................... . Alaska pollock and cod ..•..•.••••.....•••••..... Jacks , scads, and allied species .....•.•.•...... Her ring and allied species ...........•.......... Mickerels ..•••••••••...•.•.•..•..••..•..... ~ •.•. Saury •.•..••••.....••....•••.....••..•.•...••... Fl atfishes • •••........•.....••.••...•.....•.•..• Atka mackerel .••..•..•••....•.•..•.•.........••. Salmon •••.••••••••••••.•.....•...••.....••... · •. Croakers ••••••.••••.•.•...•••..••...•••..•....•• Spearfishes (swordfish, marlins , and sailfish) .• Sharks •.•...•••••••.•...•••..•••.•.•.•• ·.·.··•• • Rockfishes .••.•.•.••.••.•.•..•.•.•.......•..•.•. other • ...••••••••••..•.•.•••.•...•...•..•..•..•.
Total fish •.•.••...••...•....•....•..•....•.
OTHER MARINE ANIMALS
Clams • • • • • • ..••••.•. • .••.•....•••••.•• • .••.•.... Shrimp .••••••••.•.••••••....•••..•• • •••.•.•.•... King crab • • • ••••.••..•.••.••.....•.•.•.......... Squid, cuttlefish, and octopus .......... . ...... . other . ••• •••......•.•....••..•....••.....•..•••.
Total other marine animals ......... . ....... .
SEAWEED
Tangle • • ••••••••.••• • •..•..•...•.•...•..••..• • .. Other •••• ••• • •.•.••••••.•..•..•.•..•..•.•..•..••
Total seaweed •••••••....•........•.••....•••
Grand total .•..•••••.••.•.••••.••.•••••..•••
Domest i c fi sheries
M::! t ri c tons
476 , 199 480, 333 503 , 858 438 , 671 464, 886 384, 548 134,967 150, 393 102, 327 103, 050
63 , 974 59, 784 23 , 451
659, 350
4 , 045,791
203,465 54,212
6,377 703,718 216,711
1, 184,483
t--- - -
151,820 129, 819
280,639
5, 510, 913
-
Pelagic high-seas fisheries
Wetric tons
138, 054 132, 693
6,163 31, 624
242 --
97, 702 --
46, 269 249
18, 331 3, 893
39, 408 87, 992
602, 620
32, 379 25,176 27, 313 1, 850
86 , 718 + --
689, 338
I
,
Total
M::!tric tons
614,253 613, 026 510,021 470,295 465,128 384,548 232, 669 150, 393 148, 596 103 , 299
82,305 63 , 677 62, 859
747, 342
4, 648 , 411
203 , 465 86, 591 31, 553
731, 031 218 , 561
1 , 271,201
151, 820 129, 819
280, 639
6, 200, 251
Note: Production from aquiculture in shallow seas was 391,000 metri c tons (which i nc l uded 240,100 tons of oysters and 144, 500 tons of seaweed) , bringing the total catch in the marine fisheries to 6,591,000 metric tons (see table 2) .
Source: Japanese Ministry of Agricul ture and Forestry, Annual Repor t of Catch statist i cs on Fishery and Aquicul ture, 1963 .
6

Figure 4.--Japanese crab factoryship operating in the Bering Sea. Racks for drying tangle nets are seen midship and on the stern, 1963.
and (4) technical assistanc e requested by a foreign government or company. Overseas agreements increased from 3 1 in 195 6 to 7 8 in 1962. Tr a wling and tuna longlining are the principal types of fishing stipulated In the agreements. Data are. not available on the catches made by the joint companies.
Aquiculture in shallow se as. - - A rt i f icial cul tivat ion in m a rine waters has a long history in Japan and i s practiced widely in bays, coves, lagoons, and brackish-water lake s. T he most successful efforts have been in t he cultivation of oysters a nd edible seaweed (l ave r), although small amounts of fish, shri mp, spiny lobster, and b l ue crab have been r ai sed from larval or juvenile stages. Production from a quiculture has been inc reasing steadily and is now almost four times tha t ofthe bestprewa rye a r . In 1963, about 391,000 tons were obtained --the main output be ing oysters (240,100 tons, shell weight) and laver (144,500 tons, wet weight).
Inland Fisheries
F i shing in natural waters and cultivation in artificial ponds have been c ontributing to a steadily increasing inland cat ch (table 2). In 1963, production reached a peak of 107,000 tons - -84,000 tons from natural waters and 23,000 tons from aquiculture. The principal fresh-water spe cie s are carp, smelt, minnows, eel, sweet smelt (a relative of ' the trouts, known as ayu), clam s, and aquatic plants. The sweet smelt is c ons idered a table delicacy, and the quant ity caught is second only to that of carp. Carp, rainbow trout, and sweet smelt
7
are the main species cultivated. Generally, eggs and fry are raised in sm all ponds and then transferred to large rearing ponds for growth to market size. Young eel and mullet are caught in rivers and estuaries and placed in ponds, where they are fed until ready for market.
IMPORTANT MARINE SPECIES
Tunas and Allied Species
In terms of value , the tunas were the leading group of fishes taken by Japanese fishermen in 1963. The peak year of production was 1962, when 641,200 tons, valued at $71,405,000, were caught. In 1963, production dropped to 614,253 tons, but the value of $75,465,000 was higher; about 70 percent of this catch was taken in the domestic fisheries and the remainder in the pelagic high-seas fisheries. The 1963 tuna catch, by species, is shown in table 4.
The bulk of the Japanese tuna catch comes from coastal and nearby offshore waters. Since 1950, however, the trend has been toward building large vessels that can circle the globe . Tuna close to the Japanese islands are caught mainly with pole and hne (flg. 5), but a variety of other gear are used, for example, fixed nets, longlines, and purse seines and other surrounding nets. In distant high-seas operations, longlines are used solely. Most tuna species are in great demand domestically. They also enter the export trade in large volume; this is espeCially true of those catches made in the high-se as fisher ie s.

Figure 5.--Skipjack pole-and-line fishing with live bait off the coast of Honshu, Japan.
Table 4. -- Japanese t una catch) by species } 1963
Domestic Pelagic Species fisheries high- seas Total
fisheries
Metric Metric Metri c tons tons tons
Yellowfin tuna 78}453 52}42l 130}874 Bigeye tuna ••. 107} 181 22}509 l 29} 690 Albacor e •••••• 64}8l 2 50} 710 115}522 Skipjack •••••• 108} 265 4}622 112}887 Bluefin tuna •. 55} 213 7}792 63} 005 Frigate mackerels •••. 48}339 -- 48}339
Young tuna •.•. 13} 936 -- 13} 936
Total ••••• 476} 199 138}054 614} 253
Source: Japanese Ministry of Agriculture and For estry} Annual Report of Catch Stat istics on Fisher y and Aqui cul t ure} 1963.
In 196 3 the high-seas tuna operation cons i ste d of:
1 . Factoryships with cat c herboats--Nearly 10, 200 tons of tunas were taken in the Pacific Oc ean by 2 factoryships (totaling 13,858 gross tons) ac c ompanied by 112 catcher boats (totalin g 12,488 g ross tons). Also taken were 2,200
8
tons of spearfishes, 1,210 tons of sharks, and 370 tons of other fish.
2. Factoryships that carried small catcher boats on board--This type of operation (fig. 6), carri ed on mainly in the Indian and Atlantic Oceans, has been expanding rapidly. In 1961 longliners associated with four factoryships c aught 4,675 tons of fish. By 1963 the fleet had been enlarged to 38 factoryships (totaling 39,293 gross tons), and the catch was 50,437 tons of tunas, 8,275 tons of spearfishes, 1,986 tons of sharks, and 852 tons of other species.
3. Tuna longliners based at foreign ports -The Japanese have been steadily increasing longline operations based at overseas ports in the Pacific, Indian, and Atlantic Oceans. In 1963 the take of the 299 overseas - based tuna craft was 87,424 tons, consisting of 77,432 tons of tunas, 7,856 tons of spear fishes, 696 tons of sharks, and 1,440 tons of other species. In the Paciflc, most of the catch (15,716 tons out of a total of 28,017 tons) was l anded at American Samoa. Other bases were Espiritu ,Santo, in the New Hebrides Islands, and Noumea, in New Caledonia. In the Atlantic, most of the catch (43,355 tons out of a total of 59,407 tons) was landed at African ports for transshipment to Europe (mainly Italy) and the United States (mainly Puerto RicoL Most of the spearfishes and sharks were presumably shipped to Japan, where they are in great demand.
Figure 6.--A 30-foot Japanese longliner bringing its morning catch to the tuna factoryship. This longliner can be carried on board the factoryship.
Bottomfishes
The principal species or groups taken at or ne ar the se a bottom are the Alaska pollock, cod, Atkamackerel, flatfishes, croakers, rock fishes, sharks, and sea breams. In 1963 these and other bottomfishes accounted for an esti mated 1.6 million tons, or almost 25 percent of the total marine catc h . The domestic catch of bottomfishes was about 1.2 million tons;
9
the pelagic high-seas catch, about 362,000 tons (table 5).
About two-thirds of the domestic bottomfish catch is taken with trawls (fig. 7). Other gear used are mainly lift nets, gill nets, lines, and beach and boat seines. Inthepelagichigh-seas fisheries, trawls are the principal gear, but Danish seines, drift nets, and longlines are also used.
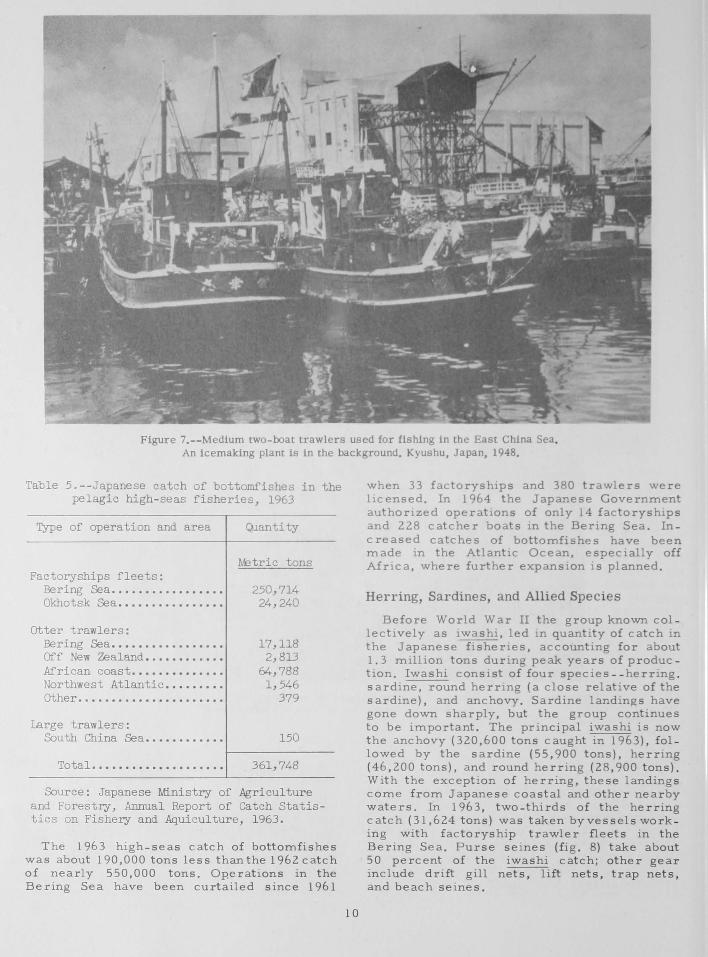
Figure 7.--Medium two-boat trawlers used for fishing in the East China Sea. An icemaldng plant is in the background. Kyushu, Japan, 1948.
Table 5.--Japanese catch of bottomfishes in the pelagic high-seas fisheries, 1963
TYPe of operation and area
Factoryships fleets: Bering Sea ...•••••••••••..• Okhotsk Sea •••.•.•••...•••.
otter trawlers: Bering Sea ••••••••••••.•••• Off New Zealand •••••••••••• African coast ..••...••••••• Northwest Atlantic •••.•.••. Other ..................... .
Large trawlers : South China Sea ........... .
Total ••••••••.•••••••.•••
QJ.antity
M:ltric tons
250,714 24,240
17,118 2, 813
64,788 1,546
379
150
361,748
Source: Japanese Ministry of Agriculture and Forestry, Annual Report of Catch Statistics on Fishery and Aquiculture, 1963.
The 1963 high-seas catch of bottomfishes was about 190,000 tons less than the 1962 catch of nearly 550,000 tons. Op,erations in the Bering Sea have been curtailed since 1961
10
when 33 factoryships and 380 trawlers were licensed. In 1964 the Japanese Government authOrIzed operatlOns of only 14 factoryshlps and 228 catcher boats in the Bering Sea. Increased catches of bottomfishes have been made in the Atlantic Ocean, especially off Africa, where further expansIon IS planned.
Herring, Sardines, and Allied Species
Before World War II the group known collectively as iwashi, led in quantity of catch in the Japanese fisheries, accounting for about 1.3 million tons during peak years of production. Iwashi consist of four species - -herring. sardine, round herring (a close relative of the sardine), and anchovy. Sardine landings have gone down sharply, but the group continues to be important. The principal iwashi is now the anchovy (320,600 tons caught in 1963), followed by the sardine (55,900 tons), herring (46,200 tons), and round herring (28,900 tons). With the exception of herring, these landings corne from Japanese coastal and other nearby waters. In 1963, two-thirds of the herring catch (31,624 tons) was taken byvessels work ing with factoryship trawler fleets in the Bering Sea. Purse se ine s (fig. 8) take about 50 percent of the iwashi catch; other gear include drift gill nets, lift nets, trap nets, and beach seines.

Figure 8.--Small purse seiners surround a school of sardines at the mouth of Tokyo Bay, Japan, 1948.
Salmon
In 1963 the Japanese catch of red, silver, churn, king, pink, and cherry (masu) salmon increased to 148,596 tons--102,327 tons from the domestic fisheries and 46,269 tons from the high-seas fisheries (table 3). The 1963 catch was nearly 30 percent more than the 1962 catch of about 116,000 tons. Almost entirely responsible for this increase were larger catches of pink salm~:m made in Japanese coastal waters by domestic fishermen. The cherry salmon is an Asiatic species. The othe r five salmons inhabit both side s of the North Pacific; the Asiatic and NorthAmerican races of each species are distinct, although they intermingle in the central North Pacific.
Since 1953 the Japanese have not fished for salmon east of long. 175 0 W. (fig. 9), in ac cordance with the terms of the International Convention for the High Sea Fisheries of the North Pacific Ocean. This longitude was provisionally selected in an attempt to divide Asian and North American salmon stocks. Research has shown that this meridian bisects a large area of intermingling. In the area west of long. 1750 W., annual quotas for Japanese salmon catches have been in effect since 1957 under a Japanese-Soviet fishery treaty (table 6). Until 1962 quotas were established onlyfor waters principally north of lat. 45 0 N. (Area A). In 1962 the waters south of lat. 45 0 N (Area B) were brought under regulation.
Japanese factoryship gill net operations are restricted to Area A. These are known as the pelagic high-seas operations. Within Area A, however, land-based gill netters from the domestic fisheries are licensed to fish in a corridor between lat. 45 0 N. and lat. 48 0 N.
11
Figure 9.--Japanese high-seas salmon fishing areas in the North Pacific Ocean, 1963.
Table 6.--Japanese-Soviet treaty quotas for salmon, 1957-65
Year
1957 ••••• 1958 •.••• 1959 ••••• 1960 ••••• 1961 ••••• 1962 •.•.• 1963 ••••• 1964 ••••• 1965 .••••
Area A
~tric tons
120,000 110,000 85,500 67,500 65,000 55,000 57,000 55,000 56,000
Area B
~tric tons
No quota No quota No quota No quota No quota
60,000 63,000 55,000 59,000
The Japanese Fisheries Agency breaks down the treaty quota for Area A into quotas for factoryships and for gill netters. Only landbased gill netters and longliners can fish in Area B. Japanese coastal waters are not under treaty regulation. Small drift netters and longliners take most of the coastal salmon catch; a part of the catch is taken in fIxed nets set near shore. Table 7 presents the catch of salmon in 1963 by areas and type of vessel.
Table 7.-- Japanese salmon catches, by area and type of vessel, 1963
Type of operation QJ.anti ty - ---
Area A: ~tric tons
Pelagic high seas (n factoryships and 369 drift netters) •••••...•..••.•...• 46,269
Land-based drift netters ..... 10,347
Total Area A ....•........ 56,616 -
Area B (drift netters and longliners) : Pacific Ocean .•....•••.•....• 38,864 Sea of Japan •••.•.......••.•. 4,708
Total Area B ••••••••••••• 43,572
Coastal waters •.•.•.•.....•.... 48,408 I--
Grand total •..•••...•.•.• 148,596
Jacks, Scads, and Allied Species
The jack mackerels (mainly Trachurus japonicus) are the principal species in this group, accounting for over 80 percent of the group catch of 510,021 tons m 1963 (table 3). Other important speCIes are mackerel scads and the yellowtail (or amberjack). All are warm-water or temperate species taken along the Pacific and Sea of Japan coasts and in the East China Sea. One- and two-boat purse seines take most ofthecatchofjackmackerels and mackerel scads. Fixed (or set) nets take most of the yellowtail.
Mackerels
In 1963 the mackerel catch was 465,128 tons (table 3), representing a steady increase over the catches of recent years. Mainly inhabiting warm currents, the Japanese mackerel and the southern (or spotted) mackerel are found along both coasts of Japan as far north as the zone of convergence between warm and cold currents. In the summe:r;, large quantities are taken off southeastern Hokkaido. The
12
mackerel fishery is especially important in the waters between South Korea <md southern Japan. Most mackerels are caught by one- and two-boat purse seines; other gear used are pole and line, fixed nets, and hft nets.
Saury
Before World War II, the saury was considered by most Japanese to be an inferior fish eaten only by the poorer people. When food shortages were prevalent immediately after the war, the flsh became widely acceptable, and landings increased rapldly. Recent annual catches have fluctuated sharply, being as high as 575,100 tons in 1958 and as low as 287, lOO tons In 1960. The catch in 1963 was 384,548 tons (table 3). The saury, acold-water species, migrates southward along the Kuril Islands to the east coasts of Hokkatdo and north-central Honshu. Almost the entire catch IS taken in September, October, and 1 'ovember wlth stick-held lift nets.
Spearfishes
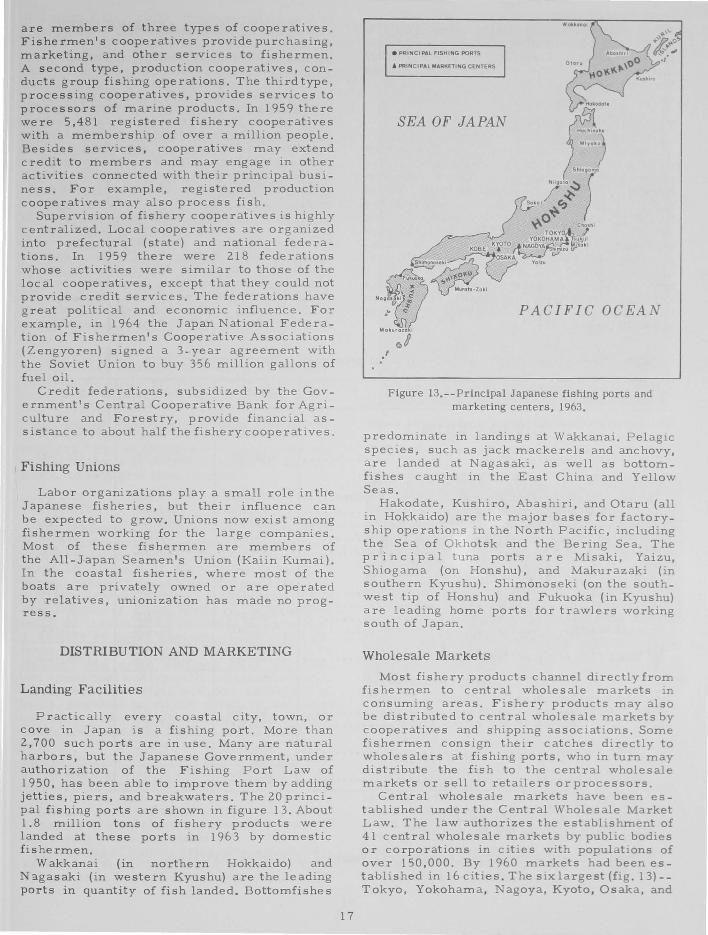
Included In this group- -contatning some of the largest fishes caught by Japanese fishermen- -are the swordflsh (1963 landmgs about 19,300 tons), the striped marhn (20,000 tons), the black and white marlIns (37,200 tons), and the saiUlsh (5,800 tons). More than 75 percent of the total catch of about 82,300 tons was taken in the domestic fisheries (table 3), mainly with longlines; small amounts were taken m fixed nets and with harpoons (fig. 10). The high-seas catch of spearflshes was taken by the tuna longline fleet (see Tunas and Allted Species, above).
Figure lO.--Harpoonlng swordfish along the northeastern coast of Honshu, Japan, 1948.
Squid, cuttlefish, and octopus
In recent years, the cephalopods have been the leading group in quantity caught by the Japanese fishermen. From a little over 100,000 tons in 1945, the annual catch has risen almost continuously to reach 731,031 tons in 1963--703,718 tons in the domestic fisheries and

27,313 tons in the high-seas fisheries (table 3). Over 80 percent of this catch is one species, the common squid, a cold-water form taken principally off eastern Hokkaido and northeastern Honshu. The largest landings are made in late summer and fall by angling with jigs at night and using a light to attract the squid. The octopus is taken with longlines or in earthenware jugs set out on sandybottom; when resting, the octopus seeks a dark hiding place and creeps into the jugs.
Shrimp
Until 1961, shrimp were only caught by domestic fishermen from Japanese inshore and coastal waters and from the East China and Yellow Seas. Since then, high-seas trawlers, especially those associated with factoryship fleets in the Bering Sea, have been taking large quantities ofshrimp--32,379 tons in 1963 (table 3). In this same year, the domestic fisheries took 54,212 tons, to make a total Japanese shrimp catch of 86,591 tons.
King Crab
Although the amount taken is small in comparison with the take of other crustaceans, the king crab is of high unit value, and most of the catch is canned for export. In 1963, the domestic catch of king crab from deep waters off the northern coast of Hokkaido was 6,377 tons (table 3). In the pelagic high-seas fisheries, the catch was 25,176 tons, taken by 7 factoryships accompanied by 67 small and 30 large catcher boats. Two of the factoryship fleets worked in Bristol Bay in the eastern Bering Sea; four in the Sea of Okhotsk, off the west coast of Kamchatka; and one in the western Bering Sea, off the east coast of Kamchatka. T angle nets set on the ocean bottom are mainly used to catch king crabs.
King crab fishing in the Sea of Okhotsk is regulated by the Japanese-Soviet fisherytreaty.
In 1963 and 1964 the quota for each year was 252,000 cases (48 half-pound cans per case) for Japan and 378,000 cases for the U.S.S.R. In 1965 Japan's quota was reduced to 240,000 cases and the U.S.S.R.'s raised to 420,000 case s. Until 1965 the Japanese Fisheries Agency set a limit on the take of king crab from Bristol Bay. In 1963 and 1964 the limit authorized for each year was 235,000 cases. Under a United States-Japanese agreement on king crab f ishing in the eastern Bering Sea, negotiated in 1964, the limit was reduced to 185,000 cases for 1965.
WHALING
Japan has the largest whale fishery in the world. In 1963 it took 22,370 whales, of which 14,142 were caught by intensive pelagic factoryship operations in the Antarctic. Pelagic factoryship operations in the North Pacific took 4,757 whales; land-based operations off the Japanese coast took 3,471 whales. From the whales caught, 366,940 tons of baleen oil, sperm oil, frozen or salted whale meat, and other products were obtained (table 8).
Japanese companies operated 7 whale factoryships and 79 catcher boats during the 1962/63 Antarctic whaling season. The factoryships ranged in size from 16,000 to 27,000 gross tons; the catcher boats averaged about 600 gross tons. Beginning with the 1962/63 season, an international quota system was adopted for Antarctic whaling. Japan received 41 percent of the baleen catch limit of 15,000 blue-whale units. Japanese factoryships produced their quota of 6,150 blue-whale units.
The total Antarctic baleen-oil quota for the 1963/64 se ason, also set by international agreement, was 10,000 blue-whale units; Japan's allotment was 4,600 units, or 46 percent of the total. Japan has been acquiring
Table 8.--Japanese output of whale products) 1963
Whale oil Type of operation
Baleen oil Sperm oil
Metric tons Metric tons
Antarctic pelagic whaling2 ••• 113)277 10)533 North Pacific pelagic whaling 11)994 20)715 Coastal whaling •••....•••••.. 2)267 6)502
Total .•...••••.•.•....•.• 127)538 37)750
1 Includes liver oil) edible blubber) bone meal) etc. 2 December 1962 to April 1963.
other Whale meat products 1 Total
Metric tons Metric tons Metric tons
151)918 8)008 283)736 24)271 264 57)244 10)312 6)879 25)960
186)501 15)151 366)940
Source: Japanese Ministry of Agriculture and Forestry) Annual Report of Catch Statistics on Fishery and Aquiculture) 1963.
13

quotas from other countries. For example, in 1963 the last of United Kingdom's whale factoryships was sold to Japanese interests; Japan did not operate the factoryship but apportioned the newly acquired quota among seven Japanese factoryships. In 1964 a similar event occurred when the Japanese purchased the last of the factoryships operated by the Netherlands. Whale stocks in the Antarctic have been seriously depleted. For the 1964/65 season, the Antarctic quota informally adopted by the participating countries was reduced to 8,000 blue-whale units; Japan's share of this quota was 4,160 units. For the first time, Japan failed to meet its quota, producing 4,125 bluewhale units.
Japanese whaling in the North Pacific is conducted in much the same manner as is Antarctic whaling, but on a smaller scale. In 1963, 3 factoryships, averaging about 13,000 gross tons, and 21 catcher boats, averaging about 700 gross tons, took whales from the Bering Sea and the waters southofthe Aleutian Islands. In contrast to Antarctic operations, where the take is principally baleen whales, North Pacific operations take mostly sperm whales.
Coastal whaling from land-based stations has a long tradition in Japan. In 1963 large whales were taken by 22 catcher boats operating from 15 land stations. The whales--blue, fin, humpback, sei, and sperm--were similar to the species taken in the Antarctic and the North Pacific. Smaller species--minke, pilot, birdbeaked, and killer whales - -were caught primarily by small craft (fig. 11) for their edible meat and blubber. In this small-boat coastal whaling, 19 craft were operated in 1963, the lowest number in many years.
Figure ll.--On board a small coastal whaler. Harpooner is getting set to shoot a whale. Off central Honshu, Japan, 1948.
14
FISHING CRAFT
Japan's fishing fleet is composed of a multitude of small wooden craft as well as of modern, steel fishing vessels andfactoryships. In 1963 this fleet--the world's largest in number--consisted of 398,935 craft, totaling 2.1 million gros s tons (table 9). More than half this fleet (202,820 craft) were nonpowered boats averaging less than 1 gross ton. Most of the powered craft were small; 171,278 were less than 5 gross tons, and only 24,837 were 5 tons or over.
The number of powered vessels over 5 gross tons has been declining, but their average and total gross tonnage has been increasing. Most of the increase since 1957 has been due to the building of about 300 new tuna vessels, including longliners of over 1,000 gross tons. Also, the fleet has many factory trawlers with stern ramps for bringing the net aboard and with equipment for freezing or processing fish; the exact number is not known, but in 1963 there were 105 otter trawlers (including stern trawlers) averaging over 800 gross tons, compared with 64 in 1962. Some of the new factory trawlers are 3,500 gross tons.
Factoryships also are increasing in number and size. In 1963 the Japanese operated 81 factoryships--ll for salmon, 7 for crabs, 23 for bottornfish, and 40 for tuna. Only 2 years previously (1961), 67 factoryships had been operated.
Despite their smaller number, vessels over 50 gross tons have accounted for more than half the gross tonnage in the Japanese fishing fleet. In 1963 these vessels--4,980 innumber-were registered at 1.3 million gross tons. Not all were actual fishing vessels; many of the large vessels were support units, such as crab, salmon, tuna, bottomfish, and whale factoryships, refrigerated fish carriers, whale catchers, and Government survey ships. Actual fishing units over 50 gross tons, operating independently or as part of factoryship flotillas, numbered about 4,000 craft; they caught over 2 million tons of fish and shellfish. A large part of this catch was valuable tuna, shrimp, king crab, and bottomfishes.
Nonpowered craft (fig. 12), generally propelled by a two-piece sculling oar, are used principally for collecting seaweed and shellfish and for many types of inshore operations such as gill netting, beach seining, and simple pole and line fishing. Because many have been motorized recently, the number of nonpowered boats has been declining, whereas the number of powered boats under 5 gross tons has been' increasing. Small nonpowered and powered craft are mostly operated by one or two men or a family group.

Table 9.--Number and gross tonnage of registered Japanese fishing craft, as of December 31, 1963
Type of craft
INLAND
Nontidal ••••••.•••.••••••••••••• Tidal •••••••..••.•••••••••••••••
Total or average, inland •.••
MARINE
Gill netters ••..••••.••••••••••• Purse seiners .•••••••••••••••••• Fixed netters ••..••••••••••••..• Square nettersl ••••••••••••.•••• Small trawlers •••••.•••••.•••.•• Medium trawlers (W. of 1300 E.). otter trawlers ••••••••.••••••••. Drag netters •••••••••••.•.•••••• Skipjack pole-and-line and tuna
longline craft 2 •••••••••••••••
Longliners (except tuna) •••••••• Pole-and-line craft (except
skipjack) ••••••....••••••••..• Whale catchers ••.••••••••.•••••• Government vessels ••.•••...•••.. Fish carriers •.•.••••..••.•••.•• Refrigerated carriers and
factoryships .••••••••••••...•• Miscellaneous, including shell
fish and seaweed craft ••.•.•••
Nonpowered craft
Average Number tonnage
17,624 0 . 5 3,104 0.7
20,728 0 . 5
9,936 1,231 8,289 1,511
6,994
3,461
28,609
24 688
121,349
1.0 5.6 3 . 0 1.6
1.8
0.8
0.7
1.1 1.3
0.6
Powered craft
Average Number tonnage
3,600 1.3 1,038 1.1
4,638 1.3
17,850 2,323 4,746 3,799
19,444 775 105
7,129
2,321 17,350
55,374 117 464
3,507
54
56,119
5.6 21.7 3.4 6.3 6.5
91. 5 807.5
3.7
141.2 5.7
2.5 464.6
69.6 29.3
8,936.1
3.1
Number
21,224 4,142
25,366
27,786 3,554
13,035 5,310
19,444 775 105
14,123
2,321 20,811
83,983 117 488
4,195
54
177,468
191,477 10.0 373,569
Total
Average tonnage
0 . 6 0.8
0.7
4.0 16.1 3.2 4 . 9 6.5
91.5 807.5
2.7
141.2 4.9
1.9 464.6
66.2 24.7
8,936.1
1.4
Total tonnage
13,661 3,250
16,911
109,825 57,368 41,283 26,233
126,404 70,887 84,788 38,638
327,729 10l,850
156,959 54,362 32,316
103,452
482,550
247,293
5.2 2,061,937
5.2 2,078,848
Total or average, marine •••• 182,092 0.8 F====*====~==~====~====F===~======
Grand total or average .••••• 202,820 0.8 196,115 9.8 398,935
l Besides operating square nets, craft used lift nets and stick-held dip nets. 2 Tuna factoryships are believed to be included under tuna long line craft. Note: Craft registered in a fishery may operate in several fisheries, and sometimes a vessel
may not operate in its registered fishery.
Source: Japanese Fisheries Agency, Statistic Tables of Fishing Vessels, General Report No. 16, as of the end of 1963.
15

Figure 12.--Typical nonpowered Japanese fishing craft in foreground. Chiba Prefecture, Japan, 1948.
FISHERMEN Full- and part-time fishermen and other
workers in fisheries made up more than Z percent of the total Japanese working force in 196z. The fishing population, however, has been declining steadily because fishermen, especially in the overcrowded coastal fisheries, have turned to other more remunerative occupations . Also, the number entering the industry has dropped. At one time fishermen numbered well over 1 million, but by 196z the number had de creased to an estimated 870,000. The latter included about 670,000 full-time fishermen and about ZOO,OOO part-time fishermen, who obtained less than half their income from fishing. Another ZOO,OOO were engaged in processing and allied industries . A drop to 6Z6,000 fulltime fishermen was reported in 1963 .
T he fishing industry, which once could c all on an abundance of cheap labor, is now faced with a shortage of workers . To cope with this situation, many companies are eliminating surplus crewmen, salaries have been increased, laborsaving devices have been introduced, and working condltlOns have been improved . Through these and other means, production per fisherman has inC'reased, enabl1ng the total Japanese fishery (atch to remain at a high level.
FISHING ORGANIZATIONS
Management Units
In the . Japanese flshmg lndustry, management unIts are classifIed into three groups: (l) large flshmg companIes; (Z) enterprises of
16
six or more people, designated as small or medium companie s; and (3) fishing households.
Large companies engage in c oastal and offshore fishing and al so operate the fishing vessels and factoryship fleets that work in the distant high -seas f i sheries. Considerable capital inve stment is requi red as well as extensive expe r ience in the operation of inte grated factoryship fleets. The large companies also have land- based f acilit ies, such as freezing, cold -storage, andprocessingplants. Three of the largest fishing c ompanies are among the leadlng ZOO Japanese companies engaged in manufacturing, mining, and fisheries. A large part of the output of the large fishing companies, especially that from their high-seas and overseas -based operations, is exported.
Small- and medium-sized fishing enter prises use powered ve ssels, oftenof.large size. This group provides the bulk of the catch taken in the domestic fisheries.
Fishing households are numerous - -417,600 were reported in a 196Z census--buttheyoperate In crowded c o a stal waters without boats or with small boats, many of which are not powered with engines . T he average daily catch of the fis hermen in this group i s les s than 5 kg. (about 11 Ibs.)"compared with over 100 kg. (ZOOlbs.) per day on large mechanized vessels.
Fishery Cooperatives
The Fisheries Cooperative Association Law of 1948 led to the formation of m any coopera hves. Almost all Japanese fishermen or shore workers not associated with large companies
are members of three types of cooperatives. Fishermen's cooperatives provide purchasing, marketing, and other services to f ishermen. A second type, production cooperatives, conducts group fishing operations. The thirdtype, processing cooperatives, provides services to processors of marine products. In 1959 there were 5,481 registered fishery cooperatives with a membership of over a million people. Besides services, cooperatives may extend credit to members and may engage in other activities connected with their principal busine s s. For example, registered production cooperatives may also process fish.
Supervision of fishery cooperatives is highly centralized. Local cooperatives are organized into prefectural (stat e) and national federations. In 1959 there were 218 federations whose activities were similar to those of the local cooperatives, except that they could not provide credit servic es. The federations have great political and economic influence. For example, in 1964 the Japan National Federation of Fishermen's Cooperative Associations (Zengyoren) signed a 3 .. year agreement with the Soviet Union to buy 356 million gallons of fuel oil.
Credit federations, subsidized by the Government's Central Cooperative Bank forAgriculture and Forestry, provide financial assistance to about half the fishery cooperatives.
Fishing Unions
Labor organizations playa small role in the Japanese fisheries, but their influence can be expected to grow. Unions now exist among fishermen working for the large companies . Most of these fishermen are members of the All-Japan Seamen's Union (Kaiin Kumai). In the coastal fisheries, where most of the boats are privately owned or are operated by relatives, unionization has made no progress.
DISTRIBUTION AND MARKETING
Landing Facilities
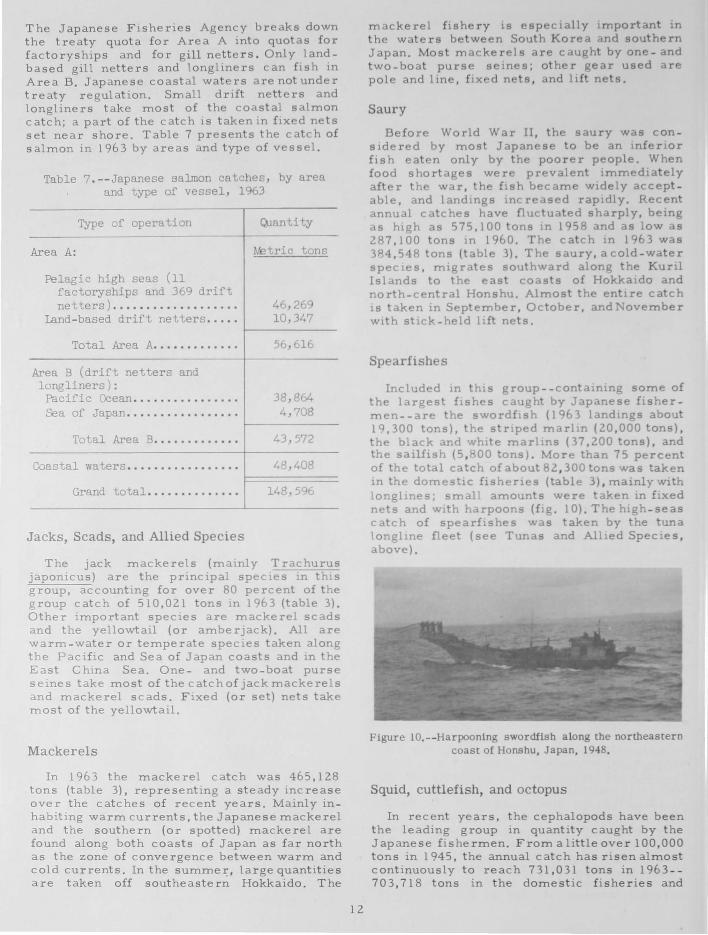
Practically every coastal city, town, or cove in Japan is a fishing port. More than 2,700 such ports are in use. Many are natural harbors, but the Japanese Government, under authorization of the Fishing Port Law of 1950, has been able to improve them by adding jetties, piers, and breakwaters. The 20 principal fishing ports are shown in figure 13. About 1.8 million tons of fishery products were landed at these ports in 1963 by domestic fishermen.
Wakkanai (in northern Hokkaido) and Nagasaki (in western Kyushu) are the leading ports in quantity of fish landed. Bottomfishes
17
• PRINCIPAL FISHING PORTS
.A. PRINCIPAL MARKETING CENTERS
SEA OF JAPAN
Figure 13.--Principa1 Japanese fishing ports and marketing centers, 1963.
predominate in landings at Wakkanai. Pelagic species, such as jack mackerels and anchovy, are landed at Nagasaki, as well as bottomfishes caught in the East China and Yellow Seas.
Hakodate, Kushiro, Abashiri, and Otaru (all in Hokkaido) are the major bases for f actoryship operations in the North Pacific, including the Sea of Okhotsk and the Bering Sea. The p r inc i pal tuna ports are Misaki, Yaizu, Shiogama (on Honshu), and Makurazaki (in southern Kyushu). Shimonoseki (on the southwest tip of Honshu) and Fukuoka (in Kyushu) are leading home ports for trawlers working south of Japan.
Wholesale Markets
Most fishery products channel directly from fishermen to central wholesale markets in consuming areas. Fishery products may also be distributed to central wholesale markets by cooperatives and shipping associations. Some fishermen consign their catches directly to wholesalers at fishing ports, who in turn may distribute the fish to the central wholesale markets or sell to retailers orprocessors .
Central wholesale markets have been established under the Central Wholesale Market Law. The law authorizes the establishment of 41 central wholesale markets by public bodies or corporations in cities with populations of over 150,000. By 1960 markets had been established in 16 cities. The sixlargest (fig. 13)-Tokyo, Yokohama, Nagoya, Kyoto, Osaka, and

Kobe - - di str ib u te about half the fishery products in J apa n . C ompeti t ive auctions determine prices. T he c entr a l markets have cold-storage and i cemaking plants for handling and storing fresh o r p r o c essed f i s h .
Transportation Facilities
Japan has a complex rail, tru c k , and boat s y ste m to carry fi s he r y products from landing ports to t h e major consuming c e nte r s i n c e ntral Hons hu. F i s h corne t o the s e c ent er s fr om as far a w a y as norther n Hokkaid o and s outhern Ky us hu. Bo a ts, known as fis h c a rr iers, a nd rai l c a rs , operated by the Nat ional Railwa y s of Japan, are the principal me ans of t ransportati on over long di s tance s. A bout t h r ee quarters of the rail shipment s are made i n mechanically refrigerat ed freight cars, the rest in freight cars using crus hed i c e . Tru cks are use d mainly t o haul f is h e r y p roducts over s h ort distances .
PRESERVATION AND PROCESSING
Icemaking, Refrigeration, and Freezing Facilities
The Japanese have made great strides in the handling of fresh, frozen, or cured fishery products. Icemaking, refrigeration, and freezing facilities have been expanding to keep pace with (1) increasing domestic consumption of fresh and frozen fishery products and (2) e x pans i on in shipments abroad of frozen products.
About 15 percent of the Japanese fishery c a tch i s now frozen for domestic and foreign markets. Nearly 50 percent of this amount is froz e n on board fishing vessels. The Japanese people are not partial to frozen fish, but the amounts used have been increasing. In 1963 the producti on of frozen fish and shellfish was 1,124,100 tons (net product weight), compared with 434,700 tons in 1957 (table 10). Distribution
Table 10 .-- Japanese output of preserved and processed fishery pr oducts , 1957, 1962, and 1963
Type of product 1957
FISH AND SHELLFISH Metric tons
Frozen . • • . • • • . . . . . • • • . • • • . • . . . . . . . • • • • • • • . • • • • • • . . • . . • • 434, 700
Cured : Boiled , dried, dry- salt ed, wet- salted, or smoked .•••• Fish sausages and hams . • •••.. •• •••••••.•..•..•••••••• Fishcake .•.. . . •• . • •••.••.••• • .• • •• • .••••..•• • ••.•••.• In soy sauce .. ..••• .••.•••... •• •••••...•..••••••••••.
Canned .••••. •.. .••.••• ••...• .• • •• ..• • •••••••••..•••.••.
lvEal : For human consumption •.•.• • .. . ••••••••.•••••••••••... For animal feed or fe r t i l izer • .••••••.•••••..•••••..•
Oil, body and l i ver ••••••.• ..•• • •.••••.••..•••.•.••.••• Miscellaneous . •••.••. ... . • • • •• ••..•• • •.•••.••. • ..•••.•.
Total fish and shellfi sh •••. • •••••••.•.• • .•••••.•••
SEAWEED
Dried seaweed .•• • ••• . •.. •..•••••• • •..••••••.•.• • .••••.• Other (agar, seaweed in soy sauce , etc . ) .•.•.••••••....
Total seaweed ..• . ...••••• .•...•• • •••••....•.••...•.
Grand total . . •. .. ••.. . • .•..••••..•••••....•.•••..•.
1. Not available . 2 Total only of fish and shellf i sh . ~ote: Whale products are not incl uded.
457,200 35, 900
386, 900 74, 500
171,600
700 155, 400 29,200 17, 400
1, 763,500
61,200 56, 500
117, 700
1,881, 200
1962
Metric tons
1, 013 , 700
478, 600 142, 400 498, 800
64, 800 233 , 300
3, 200 390, 900
20, 400 22, 400
2, 898, 500
81, 500 49, 500
131, 000
3 , 029, 500
1963
Metric t ons
1,124,100
507,700 158, 700 514,100 61,100
219, 800
2, 800 328,400
31, 300 32, 600
2, 980, 600
2 2, 890, 600
Source : Food and Agriculture Organizat i on, Yearbook of Fishery Statistics, 1962, vol. 15, and 1963, vol. 17 .
18
of frozen fish locally is hampered by lack of refrige ration facili tie s in retail outlets, e specially in rural areas. Part of the amount frozen is surplus fish caught during peak seasons and kept for processinglater when catches are negligible. In a 1959 survey, it was reported that Japan had freezing plants with a daily capacity of over 10,000 tons. Recent data are not available, but this capacity is believed to have doubled. Also additional freezing capacity has been built into large vessels.
Since 1950 refrigeration and freezing facilities have been installed on many vessels, mainly tuna longliners and large trawlers. Vessels of less than 300 gross tons usually have refrigeration equipment for chilling fish and for keeping them just above the freezing point. Some longliners and trawlers over 300 gross tons have bothfreezing and refrigeration equipment. Factoryships (3,000 to 10,000 gross tons or larger) have both types of equipment. Refrigerated fish carriers (generally about 1,000 gross tons), working withthefactoryship fleets, have only equipment for storing frozen fish.
An estimated 5 million tons of ice is manufactured annually in about 2,000 plants. Between 60 or 70 percent of this quantity is used in the fishing industry by fishing boats, fish carriers, and wholesale and retail establishments. Almost all Japanese fishing craft carry ice; the larger vessels that operate on extended trips to offshore fishing grounds add minute amounts of chlorotetracycline, an antibiotic, to help preserve catches.
Processing
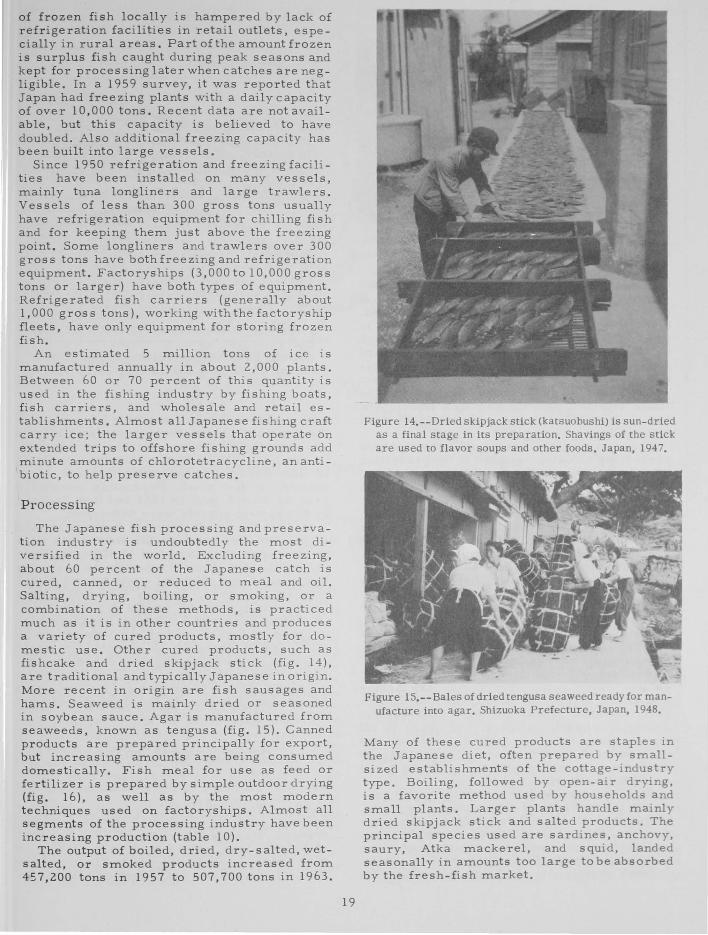
The Japanese fish processing and preservation industry is undoubtedly the most diversified in the world. Excluding freezing, about 60 percent of the Japanese catch is cured, canned, or reduced to meal and oil. Salting, drying, boiling, or smoking, or a combination of these methods, is practiced much as it is in other countries and produces a variety of cured products, mostly for domestic use. Other cured products, such as fishcake and dried skipjack stick (fig. 14), are traditional and typically Japanese in origin. More recent in origin are fish sausages and hams. Seaweed is mainly dried or seasoned in soybean sauce. Agar is manufactured from seaweeds, known as tengusa (fig. 15). Canned products are prepared principally for export, but increasing amounts are being consumed domestically. Fish meal for use as feed or fertilizer is prepared by simple outdoor drying (fig. 16), as well as by the most modern techniques used on factoryships. Almost all segments of the processing industry have been increasing production (table 10).
The output of boiled, dried, dry- salted, wetsalted, or smoked products increased from 457,200 tons in 1957 to 507,700 tons in 1963.
19
Figure 14.--Dried skipjack stick (katsuobushi) is sun-dried as a final stage in its preparation. Shavings of the stick are used to flavor soups and other foods. Japan, 1947.
Figure 15.--Ba1es of dried tengusa seaweed ready for manufacture into agar. Shizuoka Prefecture, Japan, 1948.
Many of these cured products are staples in the Japanese diet, often prepared by smallsized establishments of the cottage-industry type. Boiling, followed by open-air drying, is a favorite method used by households and small plants. Larger plants handle mainly dried skipjack stick and salted products. The principal species used are sardines, anchovy, saury, Atka mackerel, and squid, landed seasonally in amounts too large to be absorbed by the fresh-fish market.

Figure 16.--Waste, obtained from preparation of dried skipjack s tick, being dried for use as fertilizer. Yaizu, Japan, 1947.
Production of fishcake has shown sustained growth in recent years. Fishcake which is ground-up fish, seasoned, and then steamed, boiled, broiled, or fried, is mostly made in thousands of small plants. Bottomfish--such as Alaska pollock, sharks, croakers, lizard fishes, and sharp-toothed eel--are the principal species used. Production increased from 386,900 tons in 1957 to 514,100 tons in 1963 (table 10). Fishcake decomposes rapidly; the use of chlorotetracycline is permitted to inhibit spoilage.
The most spectacular advance in the Japanese processing industry has been in the production of fish sausages (fishcake with a casing) and hams. The proce s s was developed in the 1950 's ; by 1963 production was 158,700 tons (table 10). Large modern plants have been established, some with a daily output of 600,000 pieces of sausage or ham. Tunas and allied species are the principal ingredients; whale or livestock meats often are added to the mixture.
Production of canned fishery products reached a peak of 256,000 tons (net product weight) in 1961, and thereafter declined to 233,300 tons in 1962 and 219,800 tons in 1963 (table 11). Responsible for this decline were smaller packs of salmon and of tuna flakes or chunks. The industry is primarily geared to produce for export. Products of high unit value--canned tuna, salmon, and crab meat-are mainly shipped to United States and European markets . Those of lower unit value-canned mackerel, sardines, and saury in oil or tomato sauce--go mainly to Asian and African markets. For home use, canned fishery products are usually seasoned with soy sauce or other condiments.
In 1963 Japan was the second largest producer (after Peru) of fish meal in the world. Production of 328,400 tons came from many sources. Surplus landings of saury, herring, and anchovy were used to produce most of the fish meal. About 200 large' reduction plants, located mainly in Hokkaido and along the
20
Table ll.--Japanese production of canned fishery products, 1957 and 1963
Canned product 1957 1963
M3tric M3tric ---tons tons
Tuna (including skipjack) : In oil ......•.••......... 10,500 15,300 In brine ...........••.•.• 18,200 24,500 Flakes or chunks ....•••.• 21,700 20,400
Total tuna .......•.••.. 50,400 60,200
SalJnon ..................... 40,500 32,600 Mackeral ................... 14,100 46,700 Sardines ................... 24,000 4,500 Crab meat .................. 6,200 7,200 Oysters .................... 1,700 4,400 Squid and cuttlefish ....... 4,600 9,600 Other ...................... 30,100 54,600
Grand total ...........• 171,600 219,800
Source: Food and Agriculture Organization, Yearbook of Fishery Statistics, 1962, vol. 15, and 1963, vol . 17.
east coast of Honshu, accounted for most of the production. Also, thousands of small plants and households made a sizable contribution. In the late 1950's, factoryship trawler fleets in the Bering Sea began to produce large amounts of fish meal. Production reached a peak of 68,468 tons in 1961 and then declined as licenses to operate were withdrawn.
In 1963 the two factoryship fleets permitted to produce fish meal in the Bering Sea were given a production target of 17,800 tons. Their production and those of other fleets producing fish meal from offal and waste totaled 29,031 tons in that year. Another factoryship fleet licensed to operate off Angola during the 1962/ 63 winter produced 3,500 tons. Japanese curtailment of high-seas fish meal operations is attributed to inability to compete in world markets at prevailing prices. Japan now imports large quantities of fish meal from Peru and South Africa to supplement its production and enable it to supply the domestic demand for mixed feeds in poultry raising.
INT ERNATIONAL TRADE
Exports
After World War II, Japanese exports of fishery products (including whale oil) increased steadily to reach a peak in 1962 of 506,559 tons, valued at $315.3 million. In 1963 fishery exports dropped to $282.7 million (fig. 17), mainly because of curtailed shipments

FIGURES IN MILLIONS OF U .S . DOLLARS
6 .0 T£:S - 9
UNITED STP'
Figure 17.--Japanese for eign trade in fishery products, in value by origin and des tination, 1963.
of canned salmon to the Unite d Ki ngdom and frozen tuna to the United St a t e s. Dat a on exports of selected fisher y prod u c ts in 1957 and 1963 are given in table 12.
Items of high unit value, shi pped mainly to the United States and Weste rn Eur ope, have become the back bone of the Japane s e export trade i n fisher y products. Fou r o f these products--frozen tun a a n d c ann ed salmon, tuna, and crab meat-- accounted for 60 per cent of the value of all fishe r y expo r ts in 1962. Thi s figure d r opped t o a b ou t 50 percent i n 1963. Frozen tuna g oes mo stly t o t he United States and to Italy , t he latte r a marke t outle t fi rst d e veloped i n the l a t e 19 5 0 I S wi t h tuna caught i n the A tlan t i c b y J apane s e longliners . Canned tuna i n b r i ne g o es a l mos t entirely t o the United State s, and c anned t una inoil mainly to West G e rmany and othe r newly developed markets i n Europe . The United Kingdom is the principal marke t for c anned salmon. Canned crab meat goes mai nly t o t he United States and the United Ki ngd om.
21
Items of low unit value, shipped mainly to Asiatic countries, have decre<l'sed in importance in the export trade. Products shipped to these countries, though still sizable in quantity, are mostly cured fish and shellfish, canned macKerel and saury, and seaweed. Oils and fats go mostly to European countries, the Netherlands and the United Kingdom being t he principal buyers. In 1963 oils and fats accounted for nearly 10 percent of the value of all fishery exports .
Cultured pearls earned $47.3 million in 1963, or about 17 percent of the value of all fishery exports .
Semiofficial associations organized by proc es sor s and exporter s control the flo w of most Japanese fishery exports. Prices and quotas, oft en adjusted to prevent dis ruption of overseas markets, are set by the associa tions, subject to the approval of the Ministry of International Trade and Industry. Subsidy funds obtained from an excise tax on imported sugar can be used to support exports of fishery

Table l2.--Japanese exports of selected fishery products, 1957 and 1963
1957 1963 Product
O-lantity Value Olanti ty Value
Thousand Thousand Thousand Thousand
FISH metric tons 1] . S . dollars metric tons U.S. ollars
Fresh, chilled, or frozen .............. . Dried, sal ted, or smoked •.....•....•.... Products and preparations, whether or
not in airtight containersl ......•....
SHELLFISH
Fresh, frozen, dried, salted, etc ...... . Products and preparations, whether or
not in airtight containers1 ••.••...•..
OTHER PRODUCTS
Oils and fats, crude or refined., of aquatic animal origin2 ............... .
?veals, solubles, and sim: lar rrod'l't..::, of aquatic animal origin ..•...........
Total .........•.•.•.................
82 . 9 6 . 1
9 . 2
lC.2
1..,. 1
74-.8
213(.1
~8,500 208 .1 65 ,400 2,400 ::> .1 2,400
71,600 112 . 4 105,100
5,500 11.4 6,900
l4,lW 1 .0 21,700
~2,t.OO 172 . 8 26,600
3. 6 500
546 . 4 22B,6OO
l ~stly canned and sealed hermet.:~a::.1y; mall quar.t.: ies ,ere in containers no herme ically sealed.
2 Includes whale oil. Note: Does not include exports of rearls (valued at 47,JUO,OUC in 1 63); miscellaneo s
products such as shells, frog legs, oys+er spat, and coral val ed a+ 6,4OC,()()C,; and sea"veed ($392,000). O-lantities are not available.
Source: Food and Agriculture Grfanizati0n, Yearbook of Fisher) Statistics, I 3, vol . 17; Japan, Ministry of Agriculture and Forectry, Fishery Statis ics of Japan, ::'963 .
commodities that have difficulty In competing in world markets. Exports of whale oil, canned sardines, vitamin oil, and agar have been subsidized with these funds.
Imports
From a once insignificant amount, Japanese imports have grown recently, reaching a value of $28.8 million in 1962 and then more than doubling to $59.4 million in 1963 (fig. 17). Frozen shrimp--valued at $23.5 million and obtained mainly from Mexico, Communist China, and Hong Kong--was the most important item i~ 1963. Fish meal imports, chiefly from Peru and lesser amounts from South
22
Afnca, have been expanding since 1960, when 19,400 tons we re bought. By 1963 the amount had reached 84,300 tons, valued at Sll.l mIllion. (Preliminary data for 1964 indicate a further lncrease in Japanese fish meal imports to 102,277 tons, valued at S13 . 7 rrullion.) A large number of miscellaneous ltems were also imported In 1963, for example, whale meat principally from 'orway, shells prin cipally from the United States, dned seaweed and fresh or frozen fish from South Korea, and pearls from Hong Kong. On imports of some fishery products (principally ftsh meal , cuttlefish, and fish roe), the Japanes e maintain quantitative controls in the form of quotas . Data on imports of selected fishery products in 1957 and 1963 are given in table 13.

Table 13.-- Japanese imports of selected fishery products, 1957 and 1963
1957 1963 Product
Quantity Value Quantity Value
Thousand Thousand Thousand Thousand FISH metric tons U. S. dollars metric tons U. S. dollars
Fresh, chi lled, or frozen ............... 3 . 2 1,200 19 . 4 5,500 Dried, salted, or smoked .••.••.•.•••••.• 1.1 500 1.7 1,400 Products and preparations, whether or
not in airtight containersl ••••.••••.• .1 100 . 7 1,000
SHELLFISH
Fresh, frozen, dried, salted, etc . ..... 2. 6 1,600 14.1 24,500 Products and preparations, whether or
not in airtight containersl •••.••.•.•• ( 2 ) ( 2) . 1 100
OTHER PRODUCTS
Oils and fats, crude or refined, of aquatic animal origi n3 ..•.•.•.•••••••. . 3 200 .1 200
Meals , solubles, and similar products, of aquatic animal origin ......•....... -- -- 84 . 3 11,100
Total •••..........•.••.•.......•••.. 7 . 3 3,600 120.4 43,800
l Most canned and hermetically sealed; small quantities were in containers not hermetically sealed .
2 Insignificant . 3 Includes whale oil . Note : Does not include imports of pearls ($1,200,000 in 1963); dried seaweed ($1,200, 000);
shells ($2,900, 000) ; whale meat ($2,100,000); and other miscellaneous products ($8,200,000). Quantities are not available .
Source : Food and Agriculture Organization, Yearbook of Fishery Statistics, 1963, vol. 17; Japan, Ministry of Agriculture and ForestFJ, Fisheries Statistics of Japan, 1963.
GOVERNMENT SUPPORT TO THE FISHERIES
The Japanese Government exerts considerable superVlslOn over the fishing industry and through its Fisheries Agency (a bureau in the Ministry of Agriculture and Forestry) a dminis t ers fishing laws . The Government also h as fostered programs to assist fishermen, especially those in the overcrowded coastal fisheries where small- and mediumsized enterprises are encountering financial difficulties. Among the many fishery laws and programs in effect are t he (1) Fisheries Coopel ative Association Law of 1948; (2) Fisheries Law of 1949, which reformed the archaic fishing -rights system; (3) Central Wholesale Marketing Law, enacte d in 1923 and revised
23
in 1956; (4) compulsory insurance program covering accidents, sicknesses, andunemploy ment; (5) labor laws specifically for fishermen; (6) special law providing insurance that compens ate s fi shermen captured by othe r countries; and (7) Law to Promote Coastal and Other Fi s heries, enacted in August 1963.
Long-term loans and subsidies for the construction or conversion of powered vessels to high - seas operations are granted by the Agriculture, Forestry, and Fisheries Finance Corporation, a Government- supported bank. Loans are also made for building icemaking, cold-storage, and freezing plants.
Subsidies and Government credit furnish financial support to fishermen. Commercial bank credit is used mainly by large com panies. The Government-sponsored Central
Cooperative Bank for Agriculture and Forestry provides credit at low cost to fisherITlen by ITlaking loans to local cooperatives. FisherITlen can borrow funds for operating expenses froITl the local cooperatives at 11 to 15 percent interest--rates far less than those charged by private sources of credit.
A GovernITlent reinsurance prograITl absorbs 90 percent of the risk on insured fishing craft under 1,000 gross tons. It also reduces the cost of insurance issued through local fishery cooperatives by the Fishing Boat Insurance Association. About three-quarters of the total gross tonnage of the Japanese fleet is insured against vessel daITlage and loss.
The Fisheries Agency's Research Division has COITlprehensive prograITls of biological research, resource developITlent, and iITlproveITlent of fishing and processing techniques in the dOITlestic and high-seas fisheries. The Division operates 9 regional research stations and 19 branch stations. Including local or prefectural stations, Japan has about 100 fishery res earch laboratories. Also, a nUITlber of colleges and the laboratories of large fishing cOITlpanies engage in fishery research.
INTERNATIONAL RESTRICTIONS AND AGREEMENTS
In certain areas, Japanese fishing has been curtailed by unilateral action of a foreign country, or Japanese fishing craft have been seized for violation of territorial waters. The Rhee Line, proclaiITled in 1952 by South Korea, has prohibited Japanese fishing within an average distance of about 70 ITliles froITl the Korean coast. Japan never recognized this claiITl, and efforts to aITleliorate this controversy were fruitless until recently. In June 1965 Japan and South Korea signed a fisherytreatywhich, when ratified by the two countries, will eliITlinate the Rhee Line. Under the new agreeITlent, both nations ITlay establish exclusive fishing zones 12 nautical ITliles off their coasts for their respective fisherITlen.
Most seizures of Japanese vessels have been ITlade by South Korea and the U.S.S.R. The Soviet seizures have been ITlade ITlainly off northeastern Hokkaido, in the vicinity of the KurU Islands, which were taken froITl Japan by the U.S.S.R . at the end of World War II. Of 104 Japanese vessels and 1,016 creWITlen captured by foreign countries in 1962, the Soviet Union took 72 ves sels and 506 ITlen; South Korea, 15 vessels and 116 ITlen. During the past several years, Japanese fishing vessels have been seized for violation of territorial waters by Ecuador, Spain (off its African possessions), and the United States (off Alaska).
With its fisheries so widespread and in ITlany areas in cOITlpetition with those of other countries, Japan has necessarily becoITle apartyto international agreeITlents est"ablished to con-
24
serve stocks of fish used by two or ITlore countries. Three of the four treaties to which Japan is a party are concerned with the fisheries in the North Pacific. Another is the worldwide whaling treaty. An unofficial agree ITlent exis ts between COITlITlunist China and Japan on fishing in the East China and Yellow Seas.
International Convention for the High Seas Fisheries of the North Pacific Ocean
The North Pacific Convention caITle into force in June 1953 between Japan, the United States, and Canada and established the Inter national North Pacific Fisheries COITlITlission to deal with the conservation of fish stocks in the North Pacific and adjacent seas. Under a new principle, known as abstention, the Japanese agreed not to fish for North AITlerican halibut and herring and for salITlon east of a provisional line established at long. 175 0 W. (fig. 9). The abstention principle provides that when one or ITlore countries are utiiizing a resource and have it under study and scientific ITlanageITlent, the other country or countries shall refrain froITl fishing that resource. In 1959 certain stocks of herring in the eastern Pacific were reITloved froITl the abstention list. In May 1963 halibut in the Bering Sea was also reITloved because the United States and Canada could not deITlonstrate that they were utilizing fully the species in that area. SalITlon research has shown that the provisional line bisects an area of ITlixing between North AITlerican and Asiatic stocks. Efforts to ITlove this line westward so that Japanese fisherITlen do not take North AITlerican salITlon have failed.
In 1963 Japan gave notice to the United States and Canada that it desired to revise the convention and eliITlinate the abstention principle. Three ITleetings have since been held, but agreeITlent has not been reached.
Northwest Pacific Fisheries Convention
Japanese high-seas fishing in t he Northwest Pacific, including the western Bering Sea and the Sea of Okhotsk, is controlled by an agreeITlent signed in 1956 with the Soviet Union. So far, the Japanese-Soviet COITlITlission established to proITlote research and to forITlulate conservation regulations has dealt ITlainly with salITlon, king crab, and herring. The Soviets, exerting considerable pressure on the Japanese; have ITlanaged to end cOITlpletely Japanese salITlon fishing in the Sea of Okhotsk and in the coastal zone off eastern KaITlchat ka. In the treaty zone for salITlon fishing in the Northwest Pacific (fig. 9), salITlon quotas are established each year for pelagic operations conducted by the Japanese. Japanese king crab
fishing in the Sea of Okhotsk has been limited to four factoryship fleets permitted to operate only in certain designated areas. Since 1963 two areas in the treaty zone have been closed to all fishing; these are both east of the Kuril Islands. The Soviet's continuing pressure to reduce Japanese catches of salmon and king crab in the Northwest Pacific is a factor entering into the present negotiations between Japan, Canada, and the United States for revision of the North Pacific Convention.
Interim Convention on Conservation of North Pacific Fur Seals
North Pacific fur seals were exploited nearly to extinction before protection was gi ven them beginning in 1911. The present treaty between the United States, Canada, Japan, and the U.S.S.R. provides for management and investigation of the fur seal resources. Special emphasis is being placed on a coordinated study of the effectiveness of land versus pelagic sealing and their relation to conservation and management. Meanwhile the convention prohibits pelagic sealing. At one time, Japanhad a widely spread pelagic seal fishery in the North Pacific.
Fur seal herds breed in the summer on the Pribilof Islands in the eastern Bering Sea, and then most migrate southward along the Pacific coast of North America; a part of the herds migrate into the western Pacific to waters off Japan. Smaller herds breed on the Sovietcontrolled Commander Islands (in the northwestern Bering Sea) and Robben Island (off eastern Sakhalin). At present, Japan and Canada each receive from the U.S.S.R. 1,500 skins a year, and from the United States a 15 percent share each of the skins from the annual commercial kill on the Pribilof Islands. In 1964 each country received 9,630 skins from the United States.
International Convention for the Regulation of Whaling
Japan is' a party to the whaling convention that entered into force in 1946 and to which 17
25
countries now belong. The International Whaling Commission, established by the convention, holds annual meetings to review research findings, recommend new programs, flX whaling areas, set whaling seasons, and limi tthenumber of whales that can be killed.
So far, the efforts of the Commission have been unsuccessful in preventing depletion of Antarctic whale stocks (see Whaling, above). At its June 1964 meeting, however, the Whaling Commis sion approved a total quota of 4,500 blue-whale units for the 1965/ 66 Antarctic season. It was also recognized that this quota, although considerably lower than those in the past, would not reduce the catch of baleen whales below sustainable yields as shown by scientific evidence. To enable the pelagic whaling countries to adjust to the even lower quotas that will be required, the Commission considers the 1965/ 66 quota as transitional. Members of the Whaling Commission agreed that they will recommend to their governments further reductions for the 1966/ 67 and 1967/ 68 seasons and that by the 1967/ 68 season, they will recommend a quota that will be below the scientifically established sustainable yield of baleen whales.
Japan-Communist China Fisheries Agreement
Because of Communist China's harrassment and seizures of Japanese fishing craft in the East China and Yellow Seas, Japanese fi shi ng companies signed an unofficial I-year agreement with Communist Chinese authorities i n 1957. This agreement expired in 1958, and a new agreement was not renegotiated until 19 63. This 2-year agreeme nt reestablishes six restricte d areas (about 60 miles off the Chinese mainland), where limited numbers of fishing craft from each country are permi tted to fish at certain seasons of the year. Although not stipulated in the agreement, Communist Chi na apparently has exclusive fishing rights up to the 60-mile line.
MS. #1487