THE FIRST CUT IS THE DEEPEST: EFFECTS OF SOCIAL...
22
Social Cognition, Vol. 32, No. 4, 2014, pp. 315–336 315 © 2014 Guilford Publications, Inc. We thank Stefan Herzog and Ralph Hertwig for sharing their data and Johannes Ullrich and Kaylyn Shibata for helpful comments on a draft version of this article. We are grateful to David Freestone for conducting the computer simulation. Leonard Chen is now working toward a Master’s degree in Political Science at the Universidad Autònoma de Barcelona. Correspondence regarding this article may be sent to Joachim I. Krueger, Department of Cognitive, Linguistic and Psychological Sciences, Brown University, Box 1821, 190 Thayer St., Providence, RI 02912; E-mail: [email protected]. KRUEGER AND CHEN PROJECTION AND ACCURACY THE FIRST CUT IS THE DEEPEST: EFFECTS OF SOCIAL PROJECTION AND DIALECTICAL BOOTSTRAPPING ON JUDGMENTAL ACCURACY Joachim I. Krueger and Leonard J. Chen Brown University As a judgmental heuristic, social projection improves the accuracy of social consensus estimates. Aggregating multiple estimates, even within individu- als, also increases accuracy. In the current research we combine these two lines of study and find that, within individuals, second estimates are less projective and less accurate than first estimates. Bootstrapped, or averaged, estimates yield no improvements in correlational measures of accuracy, but do show accuracy gains in deviation-based accuracy scores. We propose an anchoring model to describe how estimates are generated and revised, and we show that further increases in social projection would increase ac- curacy beyond empirically observed levels. Rarely should a forecaster be judged on the basis of a single prediction. —Nate Silver (2012) Sir Francis Galton visited a country fair and found that the average of the farmers’ estimates of an oxen’s weight was close to the mark. Galton (1907) named his dis- covery vox populi, now better known as the “wisdom of the crowd” (Surowiecki, 2004). When independent judges have valid information, aggregating their judg- ments brings the signal into focus, but it also reveals systematic or shared bias, if
Transcript of THE FIRST CUT IS THE DEEPEST: EFFECTS OF SOCIAL...
Social Cognition, Vol. 32, No. 4, 2014, pp. 315–336
315
© 2014 Guilford Publications, Inc.
We thank Stefan Herzog and Ralph Hertwig for sharing their data and Johannes Ullrich and Kaylyn Shibata for helpful comments on a draft version of this article. We are grateful to David Freestone for conducting the computer simulation.
Leonard Chen is now working toward a Master’s degree in Political Science at the Universidad Autònoma de Barcelona.
Correspondence regarding this article may be sent to Joachim I. Krueger, Department of Cognitive, Linguistic and Psychological Sciences, Brown University, Box 1821, 190 Thayer St., Providence, RI 02912; E-mail: [email protected].
KRUEGER AND CHEN
PROJECTION AND ACCURACY
THE FIRST CUT IS THE DEEPEST: EFFECTS OF SOCIAL PROJECTION AND DIALECTICAL BOOTSTRAPPING ON JUDGMENTAL ACCURACY
Joachim I. Krueger and Leonard J. ChenBrown University
As a judgmental heuristic, social projection improves the accuracy of social consensus estimates. Aggregating multiple estimates, even within individu-als, also increases accuracy. In the current research we combine these two lines of study and find that, within individuals, second estimates are less projective and less accurate than first estimates. Bootstrapped, or averaged, estimates yield no improvements in correlational measures of accuracy, but do show accuracy gains in deviation-based accuracy scores. We propose an anchoring model to describe how estimates are generated and revised, and we show that further increases in social projection would increase ac-curacy beyond empirically observed levels.
Rarely should a forecaster be judged on the basis of a single prediction. —Nate Silver (2012)
Sir Francis Galton visited a country fair and found that the average of the farmers’ estimates of an oxen’s weight was close to the mark. Galton (1907) named his dis-covery vox populi, now better known as the “wisdom of the crowd” (Surowiecki, 2004). When independent judges have valid information, aggregating their judg-ments brings the signal into focus, but it also reveals systematic or shared bias, if
316 KRUEGER AND CHEN
there is bias (Larrick, Mannes, & Soll, 2012; Luan, Katsikopoulos, & Reimer, 2012). The accuracy-enhancing properties of aggregation are familiar from measurement theory. Few psychometric tests comprise but one item; likewise, physical scientists routinely take multiple measures and aggregate them (Hansen & Lebedeff, 1987). Dawes (1977), like Galton, noted the similarity between human judgment and physical measurement. Although it is better to measure height with a ruler than it is to rate it from visual inspection, the aggregate of the ratings is (most likely) su-perior to the individual ratings on average. Jenness (1932) provided a compelling demonstration when asking a roomful of people to estimate the number of beans in a jar. Replicating Galton’s finding and anticipating Dawes’s theoretical point, he found that it was better to average estimates first and then compute the differ-ence from the true number, than it was to compute all the individual differences between estimates and the true number and then to average them.
Like the testing industry, the forecasting industry uses the aggregation principle when integrating the results of polls, surveys, or bets. Nate Silver’s success in pre-dicting baseball and election results is a striking example (Silver, 2012). Likewise, a popular TV show allows contestants to poll the audience for advice, a lifeline that usually keeps them in the game.
The average (or majority) of individuals is almost always smarter than the av-erage individual (Arrow, 1963; Condorcet, 1994/1785; Hastie & Kameda, 2005). Given the clear advantages of aggregation and its significant implications for so-cial and political decision making, it is of concern that many individuals fail to appreciate it. Instead, there is extensive evidence of egocentrism, or the tendency to underweight judgments provided by others. Averages, when people compute them, tend to be unevenly weighted, with the greatest weight placed on the indi-vidual’s own judgments (Yaniv & Milyavsky, 2007). Dialectical bootstrapping has been proposed as a strategy to curtail egocentrism by encouraging the individual judges themselves to generate multiple judgments. As Winkler and Clemen (2004) noted, “these judgments can be averaged just as we average judgments from mul-tiple experts” (p. 167).
DIALECTICAL BOOTSTRAPPING
While abating the problem of egocentrism, dialectical bootstrapping faces the challenge of non-independence. The aggregation of multiple judgments into one average works well inasmuch as these judgments are generated independently of one another. Any correlation among the errors of the individual judgments will crystallize as a systematic bias. When the same individual makes two or more judgments, full independence is unlikely. Yet, the degree of non-independence in a given person’s judgment is an empirical question. It may be small enough so that aggregation still produces accuracy gains.
In an empirical test of within-person aggregation, Vul and Pashler (2008) asked the same judges to provide repeated estimates of the same quantity. As predicted, the averages of these judgments were more accurate than the individual judg-
PROJECTION AND ACCURACY 317
ments on average. Herzog and Hertwig (2009) then introduced the term “dialectial bootstrapping” when replicating and extending the findings of Vul and Pashler. Their innovation was to explicitly instruct respondents to question their first esti-mates before making second ones.
Herzog and Hertwig’s (2009) method reduces the redundancy of within-per-son judgments because the judges are encouraged to “consider the opposite” when generating a second estimate (Lord, Lepper, & Preston, 1984). The invita-tion to consider the opposite prompts respondents to break whatever mental set they may have initially activated. The term “bootstrapping” places this strategy in a statistical tradition that achieves a reduction of random measurement error through resampling (Efron, 1979). The strategy is self-sufficient in the sense that it introduces no new external information, much like the notorious Freiherr von Münchhausen who claimed to have pulled himself out of a swamp by his boot-straps. The term “dialectical” is a nod to the philosopher Georg Wilhelm Friedrich Hegel, who saw (historical) progress as arising from a dialectical process where a thesis is countered by an antithesis, and where a synthesis resolves the tension be-tween the two. In the hands of Herzog and Hertwig (2009), the first and the second estimate respectively represent thesis and antithesis, and their average represents the synthesis.
Accuracy gains are not guaranteed. For aggregation to improve accuracy, the sec-ond estimate must lie within a “gain range.” To one side of the true value, the gain range is bounded by the first estimate. On the other side, the gain range is bound-ed by the second estimate, which lies at a distance from the true value just small enough for averaging the two estimates to still yield an accuracy gain. To illustrate, Herzog and Hertwig (2009) asked readers to imagine a judgment task, in which “the true value is 100. If the first estimate is 110 and the dialectical [i.e., the second] estimate is 70 (i.e., identical with the lower boundary), the average will be 90” (p. 232). Note that the absolute error obtained after averaging the first and the second estimate is the same as the error obtained with the first estimate alone. Hence, an estimate of 70 is the lower bound of the gain range. As this example shows, the sec-ond estimates can be considerably worse than the first estimates, while still yield-ing an accuracy benefit. As a general rule, averaging increases accuracy when the two estimates bracket the true value and when the error of the second estimate is no more than three times as large as the error of the first estimate.1
Herzog and Hertwig (2009) had respondents date 40 historical events (e.g., the last time the Swiss burnt an alleged witch).2 After providing a year as a first es-timate for each event, respondents generated a second estimate either without further instructions or under the explicit request to produce different estimates. Herzog and Hertwig (2009) observed accuracy gains, but provided no explicit pro-cess model to describe how individuals generated their first or second estimates. Without a process model, the best one can do is to model each estimate descrip-
1. To simplify, assume that the true value, T, is 0, that the first estimate, E1, is positive, and that the second estimate, E2, is negative. Accuracy neither increases nor decreases if the average of the two estimates, 5E1 + (-.5E2), equals the first estimate, E1. This equality can be rewritten as E2 = E1 + 2E1.
2. The study was conducted in Basel and the answer is 1782.
318 KRUEGER AND CHEN
tively as the sum of Truth (valid information), Bias (systematic distortion), and Error (random noise; Lord & Novick, 1968).
The goal of the present study is to replicate and extend Herzog and Hertwig’s (2009) findings in a context of social perception. To do justice to the complexity of the measurement issues, we approach the data from two statistical perspectives: one perspective focuses on the correlations between estimates and true values over items, and the other focuses on the deviations between the estimates and the true values after averaging over items (i.e., Herzog & Hertwig’s method). In the context of social judgment, we seek to articulate a sequential process model to describe how judges generate and revise estimates of social consensus.
SOCIAL PROJECTION
The social judgments of interest are consensus estimates, that is, percentage es-timates for the level of agreement with an item (statement, preference, opinion, etc.). Lacking perfect information, most individuals generate consensus estimates by using their own responses as anchors from which they project to the group or population (Ames, 2004; Cadinu & Rothbart, 1996; Krueger, 2000). The process of social projection was long considered an irrational bias in social perception (Ross, Greene, & House, 1977), which attracted the attention of many researchers seeking to debias their participants.3 The failure of these efforts is no longer deplored, as projection is now recognized as a useful inference strategy (Dawes, 1989; Hoch, 1987; Krueger, 1998). Individuals who project make more accurate estimates than those who do not. This is so because most individuals’ personal responses are—by statistical necessity—correlated with the aggregated group responses (i.e., actual consensus rates); any estimate that is anchored on one’s own response is likely to be better than an estimate that is not.
These considerations motivate our principal hypothesis: Being largely driven by social projection, first consensus estimates will be rather accurate. If second esti-mates are dialectical as requested, they will be less projective than first estimates and thus less accurate. We then explore the implications of the loss of accuracy in the second estimates for the accuracy of the bootstrapped estimates (i.e., the aver-ages of the first and the second estimates).
We model accuracy in the first estimates and the loss of accuracy in the second estimates as a case of statistical regression to the mean (Fiedler & Krueger, 2012; Galton, 1886). Consensus estimates will tend to be lower than actual consensus when actual consensus is very high. Conversely, estimates will tend to be higher than actual consensus when actual consensus is very low. If accuracy drops be-cause of a drop in projection, these under- and overestimates for high and low actual consensus will become larger.
3. In our laboratory, we tried to debias projective estimates by asking one half of the respondents to predict the average of the estimates made by the other half. This device affected neither projection nor accuracy (Krueger, 2012, unpublished data).
PROJECTION AND ACCURACY 319
To visualize this pattern, consider the following example. Edna is among the 80% of people who would rather watch George Clooney than Nicholas Cage at the movies. As Edna prefers Clooney, and assuming that she has no idea how others feel, she may generate a consensus estimate of 2/3 in favor of Clooney (i.e., as-suming that all estimates seem equally good to her before she considers her own preference; Dawes, 1989). Confronted with the request to generate an alternative estimate, Edna must either move up or down on the percentage scale. The pos-sible range for an upward revision is half as wide (from 67% to 100) as the range available for a downward revision (from 67% to 0). At the psychological level, an upward revision may also conflict with a general reluctance to make extreme judgments. The invitation to “think differently” may embolden Edna to provide an estimate below 50%, which would involve a qualitative shift toward believing that most others disagree with her. Any one of these asymmetries is sufficient to make her second estimate more regressive (i.e., closer to the midpoint of the scale) than her first estimate. The more Edna’s second estimate regresses to the mean, or even beyond, the resulting error will be larger than the error of the first estimate. We therefore hypothesize that both projection and accuracy will be lower for the second than for the first estimates.
We first explore the implications of the projection hypothesis for the accuracy of the bootstrapped (i.e., aggregated) estimates using the correlational methods typical of projection research. We then examine accuracy with the deviation mea-
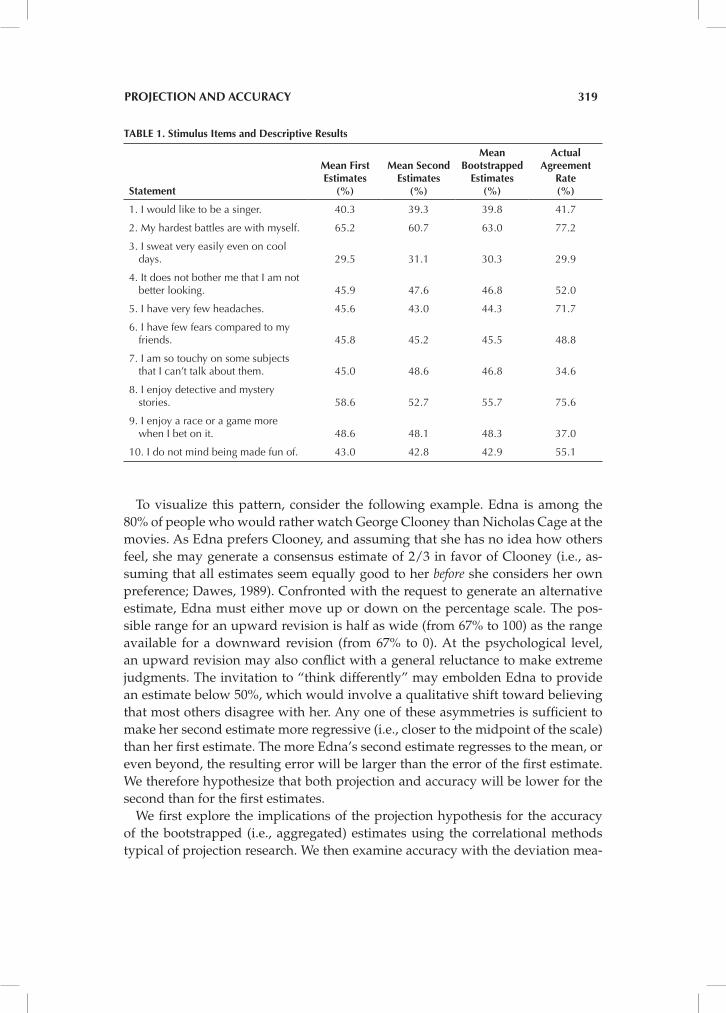
TABLE 1. Stimulus Items and Descriptive Results
Statement
Mean First Estimates
(%)
Mean Second Estimates
(%)
Mean Bootstrapped
Estimates (%)
Actual Agreement
Rate (%)
1. I would like to be a singer. 40.3 39.3 39.8 41.7
2. My hardest battles are with myself. 65.2 60.7 63.0 77.2
3. I sweat very easily even on cool days. 29.5 31.1 30.3 29.9
4. It does not bother me that I am not better looking. 45.9 47.6 46.8 52.0
5. I have very few headaches. 45.6 43.0 44.3 71.7
6. I have few fears compared to my friends. 45.8 45.2 45.5 48.8
7. I am so touchy on some subjects that I can’t talk about them. 45.0 48.6 46.8 34.6
8. I enjoy detective and mystery stories. 58.6 52.7 55.7 75.6
9. I enjoy a race or a game more when I bet on it. 48.6 48.1 48.3 37.0
10. I do not mind being made fun of. 43.0 42.8 42.9 55.1
320 KRUEGER AND CHEN
sure used by Herzog and Hertwig (2009) and note the differences between these approaches. For a complete comparison across studies, we revisit Herzog and Her-twig’s data to perform correlational analyses of the type used with our own data. We close with a computer simulation to shed light on the regularities of dialectical bootstrapping for correlational measures.
METHOD
Sixty-five women and 62 men (mean age = 20.7 years, SD = 1.14) were approached in various locations on the university campus. All agreed to complete a survey on attitudes and social judgments.
Materials and Procedure. Stimulus materials were 10 MMPI-2 statements, which were previously selected for research on social projection (Krueger & Clement, 1994). The statements are nonclinical in content (see Table 1). In the present sam-ple, the mean proportion of endorsement was 52.35% with a standard deviation of 17.36.
Respondents made three sets of judgments for the 10 stimulus items. First, they indicated their own personal agreement by circling the word “yes” (coded as 1) or “no” (coded as 0). Then, they estimated the percentage of students at their uni-versity who would agree with a given statement. Finally, respondents received instructions to generate a second set of consensus estimates. Using a slight modi-fication of the induction method suggested by Herzog and Hertwig (2009), we asked respondents to
Consider the following four steps for each estimate. First, assume that your first estimate was off the mark. Second, think about a few reasons why that could be. Which assumptions and considerations could have been wrong? Third, what do these new considerations imply? Was the first estimate rather too high or too low? Fourth, based on this new perspective—without looking back at your previous estimates—make a second set of alternative estimates. Again, be sure to take this new perspective for each of the 10 estimates.
The order of the items was constant, and the procedure took less than 15 minutes. Respondents were not compensated for their contribution.
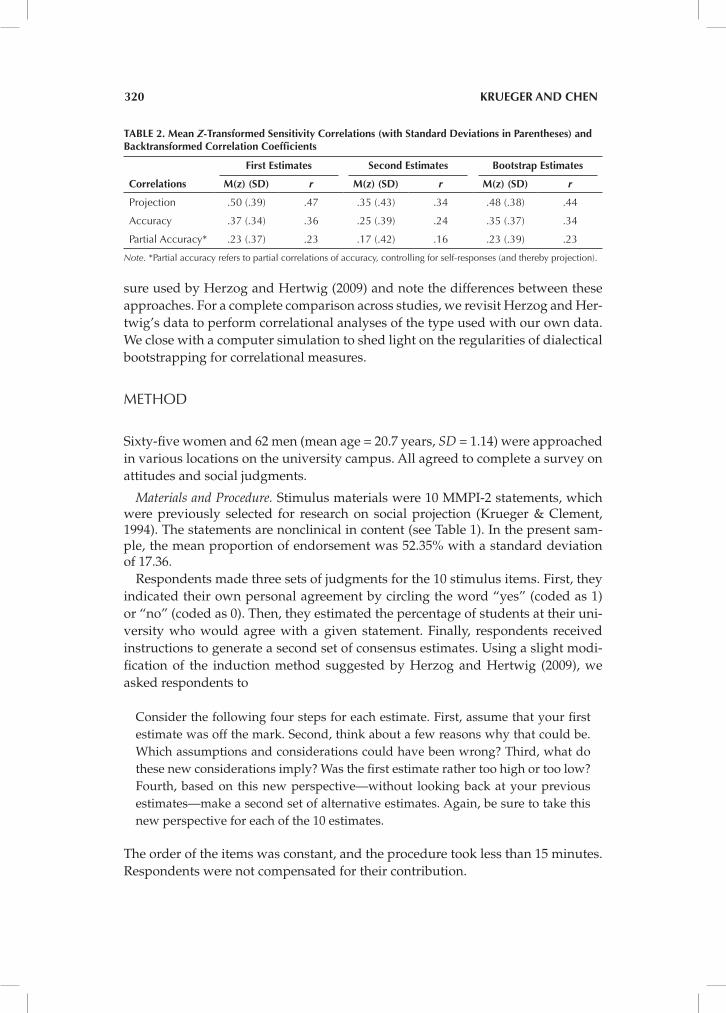
TABLE 2. Mean Z-Transformed Sensitivity Correlations (with Standard Deviations in Parentheses) and Backtransformed Correlation Coefficients
First Estimates Second Estimates Bootstrap Estimates
Correlations M(z) (SD) r M(z) (SD) r M(z) (SD) r
Projection .50 (.39) .47 .35 (.43) .34 .48 (.38) .44
Accuracy .37 (.34) .36 .25 (.39) .24 .35 (.37) .34
Partial Accuracy* .23 (.37) .23 .17 (.42) .16 .23 (.39) .23
Note. *Partial accuracy refers to partial correlations of accuracy, controlling for self-responses (and thereby projection).

PROJECTION AND ACCURACY 321
RESULTS
FIRST ESTIMATES
We first averaged, for each item separately, the first estimates over respondents. Table 1 displays the results. The grand mean of these averages (M = 46.76) was close to the mean of the actual endorsement rates (M = 52.35), but the standard de-viation over items was smaller (SD = 9.69 vs. 17.36, respectively for the estimates and the actual rates). This result is likely due to the large variation of estimates for individual items (mean SD per item = 22.17).4 We then correlated the averages of the first estimates with the actual correspondence rates over the 10 personality items. The result, r(8) = .77, p = .0007, suggested that, at the group level, respon-dents were able to discriminate between popular items (those with high endorse-ment rates) and unpopular ones. This correlation could also be interpreted, how-ever, as a group-level index of projection, such that high endorsement rates in the group were projected and hence resulted in high average estimates.
To see how projection contributed to accuracy, it was necessary to have separate measures. To this end, we computed sensitivity correlations over items for each in-dividual respondent (Judd, Ryan, & Park, 1991). Following Hoch (1987), we com-puted three types of correlation. For further analysis, each respondent’s correla-tions were transformed to Fisher Z scores. These Z scores were then averaged over respondents and the averages were transformed back to correlation coefficients. Table 2 provides a survey of the results.
The first correlation represents the representativeness of a respondent’s self-judgments for the group. This point-biserial correlation is computed between the
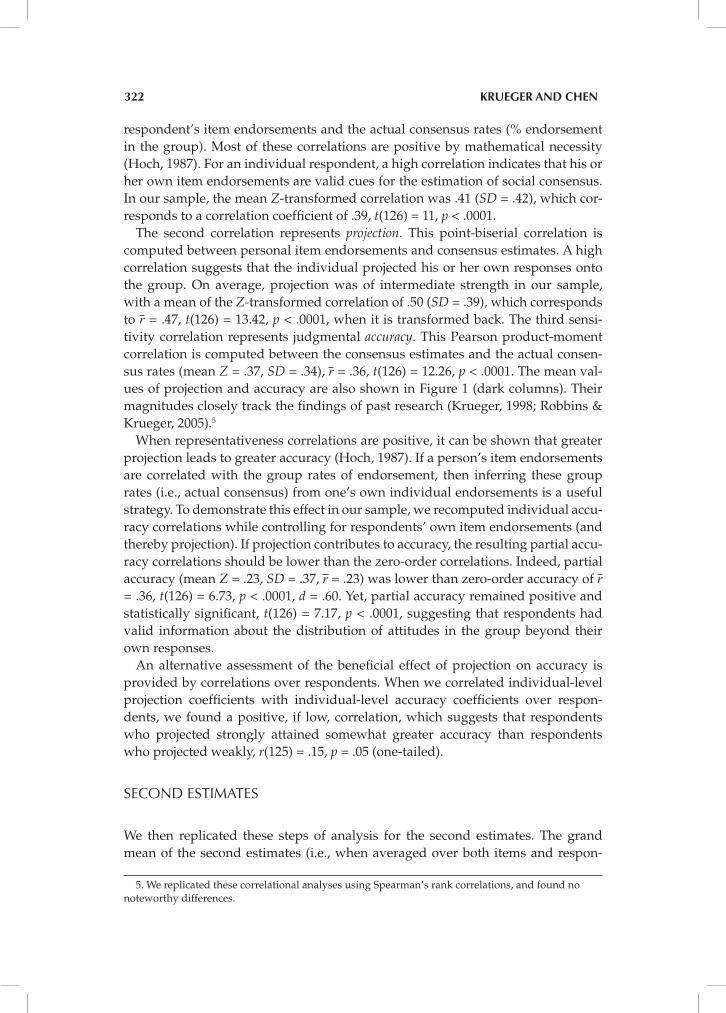
FIGURE 1. Average projection and accuracy for the first and the second estimates with standard error bars.
4. At the limit, if the per-item distributions of estimates were symmetrical and bimodal, all average estimates would be 50%, and their standard deviation would be zero.
322 KRUEGER AND CHEN
respondent’s item endorsements and the actual consensus rates (% endorsement in the group). Most of these correlations are positive by mathematical necessity (Hoch, 1987). For an individual respondent, a high correlation indicates that his or her own item endorsements are valid cues for the estimation of social consensus. In our sample, the mean Z-transformed correlation was .41 (SD = .42), which cor-responds to a correlation coefficient of .39, t(126) = 11, p < .0001.
The second correlation represents projection. This point-biserial correlation is computed between personal item endorsements and consensus estimates. A high correlation suggests that the individual projected his or her own responses onto the group. On average, projection was of intermediate strength in our sample, with a mean of the Z-transformed correlation of .50 (SD = .39), which corresponds to U = .47, t(126) = 13.42, p < .0001, when it is transformed back. The third sensi-tivity correlation represents judgmental accuracy. This Pearson product-moment correlation is computed between the consensus estimates and the actual consen-sus rates (mean Z = .37, SD = .34), U = .36, t(126) = 12.26, p < .0001. The mean val-ues of projection and accuracy are also shown in Figure 1 (dark columns). Their magnitudes closely track the findings of past research (Krueger, 1998; Robbins & Krueger, 2005).5
When representativeness correlations are positive, it can be shown that greater projection leads to greater accuracy (Hoch, 1987). If a person’s item endorsements are correlated with the group rates of endorsement, then inferring these group rates (i.e., actual consensus) from one’s own individual endorsements is a useful strategy. To demonstrate this effect in our sample, we recomputed individual accu-racy correlations while controlling for respondents’ own item endorsements (and thereby projection). If projection contributes to accuracy, the resulting partial accu-racy correlations should be lower than the zero-order correlations. Indeed, partial accuracy (mean Z = .23, SD = .37, U = .23) was lower than zero-order accuracy of U = .36, t(126) = 6.73, p < .0001, d = .60. Yet, partial accuracy remained positive and statistically significant, t(126) = 7.17, p < .0001, suggesting that respondents had valid information about the distribution of attitudes in the group beyond their own responses.
An alternative assessment of the beneficial effect of projection on accuracy is provided by correlations over respondents. When we correlated individual-level projection coefficients with individual-level accuracy coefficients over respon-dents, we found a positive, if low, correlation, which suggests that respondents who projected strongly attained somewhat greater accuracy than respondents who projected weakly, r(125) = .15, p = .05 (one-tailed).
SECOND ESTIMATES
We then replicated these steps of analysis for the second estimates. The grand mean of the second estimates (i.e., when averaged over both items and respon-
5. We replicated these correlational analyses using Spearman’s rank correlations, and found no noteworthy differences.
PROJECTION AND ACCURACY 323
dents) was also close (M = 45.92) to the mean of the actual endorsement rates (M = 52.35), and the standard deviation (SD = 7.90) was small. Again, there was a high correlation between the average estimates and the actual endorsement rates over the 10 items, r(8) = .63, p = .017. When we compared this correlation with the corre-lation obtained with the first estimates (i.e., .77), we found a significant drop, t(7) = 2.82, p = .026. This difference is first evidence for the idea that the second estimates were less calibrated than the first estimates.
Proceeding to within-person sensitivity correlations, we found a replication of the overall pattern obtained with the first estimates, but a general attenuation of the effect sizes. Representativeness correlations remained unchanged because re-spondents provided item endorsements only once. The second estimates again yielded strong evidence of projection (mean Z = .35, SD = .43), U = .34, t(126) = 9.17, p < .0001, but the effect was weaker than it was for the first estimates, t(126) = 3.81, p = .0002, d = .34. Likewise, there was again evidence of accuracy (mean Z = .25, SD = .39), U = .24, t(126) = 7.22, p < .0001, but it was attenuated relative to the level of accuracy obtained with the first estimates, t(126) = 3.91, p = .0001, d = .35 (see Figure 1 and Table 2).
The beneficial effect of projection on accuracy was again revealed by two analy-ses. At the level of within-person sensitivity correlations, partial accuracy coeffi-cients (correlating estimates with actual consensus, and controlling for own item endorsements) were lower (mean Z = .17, SD = .42, U = .16) than zero-order accu-racy coefficients (U = .24), t(126) = 3.96, p = .0001, d = .35. As before, partial accuracy remained positive and statistically significant, t(126) = 4.49, p < .0001. In the analy-sis across participants, the association between projection and accuracy was also positive, r(125) = .25, p = .003 (one-tailed).
Finally, we explored the stability of the individual differences in projection and accuracy. Both the projection coefficients, r(125) = .38, p < .0001, and accuracy coef-ficients, r(125) = .51, p < .0001, of the first and the second estimates were positively correlated over respondents. This result is first evidence for the idea that second estimates were not radically different from first estimates.
BOOTSTRAPPED ESTIMATES
We next averaged each respondent’s first and second estimates for each item to examine the potential benefits of dialectical bootstrapping. When correlating the averages of the bootstrapped estimates with actual endorsement rates over the 10 items, we again found a highly positive result, r(8) = .71, p = .0034, which lay be-tween the correlations obtained with the first (.77) and with the second estimates (.63) alone. Hence, there was no evidence of an accuracy gain.
The person-specific sensitivity correlations corroborated this conclusion. The mean projection correlation (mean Z = .48, SD = .38, U = .44) was not significantly different from the mean obtained with the first estimates (i.e., U = .47, t[126] = 1.32, p = .19, d = .12, for the difference). Likewise, the mean accuracy correlation (mean Z = .35, SD = .37, U = .34) was not distinguishable from the one obtained with the first

324 KRUEGER AND CHEN
estimates (i.e., U = .36, t[126] = 1.17, p = .25, d = .10, for the difference). The reduced accuracy observed with the second estimates appears to have been sufficient to offset any advantage that comes from averaging two estimates.6
As our analyses have shown that, on average, the second estimates were not ac-curate enough to produce an accuracy gain when they were averaged with the first estimates, the question arose of how accurate the second estimates would have had to be in order to yield such a gain. We regressed the (Z-transformed) accuracy correlations obtained with the first estimates and the accuracy correlations of the bootstrapped estimates on the accuracy correlations obtained with the second es-timates. The regression line was steeper for the bootstrapped accuracy correlations (y = .82x + .15, r = .85) than for the accuracy correlations obtained with the first estimates (y = .45x + .26, r = .51). This had to be so because the bootstrapped values contained the criterion (i.e., the second estimates). Of interest was the crossover point of the two regression lines. When the accuracy correlation for the second estimates was greater than Z = .30 (i.e., U = .29), the bootstrapped estimates were more accurate than the first estimates. In our sample, about half of the respondents (48.8%) benefited from bootstrapping, whereas the other half suffered.
EXPLORING A PROCESS MODEL
Having described the findings obtained with the first, the second, and the boot-strapped estimates, we now turn to the exploration of two related issues. First, we describe a process model of sequential estimation, and ask whether the data fit this model. Second, we ask how respondents could have increased the accuracy of second estimates (and thereby the accuracy of the bootstrapped estimates) beyond the empirically observed levels.
How did respondents approach the invitation to reconsider and revise their first estimates? When instructed to think dialectically and to question their first esti-mates before generating new ones, they had little guidance as to how to do it. One simple strategy would be to subtract the first estimate from 100. However, this strategy would leave accuracy correlations undefined because all bootstrapped estimates would be 50%. With random error added, the result would be U = 0. An alternative strategy would be to discard one’s first estimates, return to one’s own item endorsements, and generate a fresh round of estimates by social projection. To the extent that projection is probabilistic, this strategy should not duplicate first estimates. That is, the first and the second estimates could be independent of one another, even when both sets of estimates remain equally strongly correlated with own item endorsements.7
A third strategy, which is psychologically more plausible, involves a sequen-tial process of estimation. Research on social projection has shown that self-judg-
6. Investigating accuracy in a mixed regression model yielded similar results. With actual endorsement rates as the predictor and estimates over items grouped by respondents, the first estimates were most accurate, Mb = .43, SE = .038, followed by the bootstrapped estimates, Mb = .36, SE = .034, and the second estimates, Mb = .29, SE = .041.
7. This holds true unless the projection correlation is very high.
PROJECTION AND ACCURACY 325
ments have a temporal advantage over consensus estimates. This needs to be so if correlations between the two are to reflect projection and not self-stereotyping (DiDonato, Ullrich, & Krueger, 2011; Epley, Keysar, van Boven, & Gilovich, 2004; Krueger, 2003). The hypothesis of sequential estimation suggests that at any given stage, a set of judgments depends most strongly on whatever set of judgments was performed most recently. If the first estimates are anchored on self-judgments, the second estimates are most likely anchored on the first estimates.8
Consistent with this hypothesis, the correlations between the first and the sec-ond estimates were high in our sample (mean Z = .72, SD = .58, U = .62), p < .001. When statistically controlling for the respondents’ own item endorsements (and thus projection), there was a small but significant drop in the average correlation (mean Z = .65, SD = .57, U = .57, p < .001), t(126) = 3.28, p = .001 (two-tailed), d = .29. Conversely, own item endorsements predicted the second estimates only weakly when the first estimates were controlled (mean Z = .09, SD = .45, U = .09, p = .03). Moreover, own endorsements and the first estimates remained correlated when the second estimates were controlled (M = .36, SD = .44, U = .35, p < .001). Taken together, this pattern of results corroborates the idea that respondents based their first estimates on their own item endorsements and based their second estimates on their first estimates.
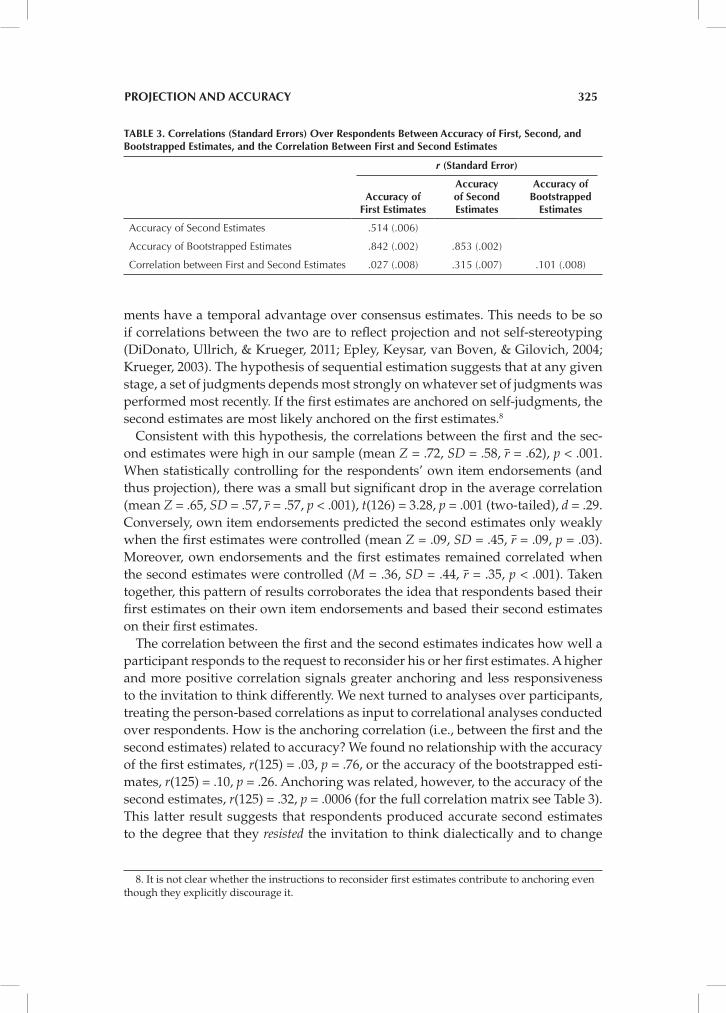
The correlation between the first and the second estimates indicates how well a participant responds to the request to reconsider his or her first estimates. A higher and more positive correlation signals greater anchoring and less responsiveness to the invitation to think differently. We next turned to analyses over participants, treating the person-based correlations as input to correlational analyses conducted over respondents. How is the anchoring correlation (i.e., between the first and the second estimates) related to accuracy? We found no relationship with the accuracy of the first estimates, r(125) = .03, p = .76, or the accuracy of the bootstrapped esti-mates, r(125) = .10, p = .26. Anchoring was related, however, to the accuracy of the second estimates, r(125) = .32, p = .0006 (for the full correlation matrix see Table 3). This latter result suggests that respondents produced accurate second estimates to the degree that they resisted the invitation to think dialectically and to change
TABLE 3. Correlations (Standard Errors) Over Respondents Between Accuracy of First, Second, and Bootstrapped Estimates, and the Correlation Between First and Second Estimates
r (Standard Error)
Accuracy of First Estimates
Accuracy of Second Estimates
Accuracy of Bootstrapped
Estimates
Accuracy of Second Estimates .514 (.006)
Accuracy of Bootstrapped Estimates .842 (.002) .853 (.002)
Correlation between First and Second Estimates .027 (.008) .315 (.007) .101 (.008)
8. It is not clear whether the instructions to reconsider first estimates contribute to anchoring even though they explicitly discourage it.
326 KRUEGER AND CHEN
their estimates. From the perspective of social projection, this pattern makes sense. Because projection facilitates accuracy, a decrease in projection yields no benefit.
The implication of this conclusion is that an increase in social projection could benefit dialectical bootstrapping. Respondents could realize accuracy gains by projecting more rather than less. At the limit, they could exclusively rely on projec-tion when generating second estimates. To illustrate the effects of this strategy, we assumed that respondents might construct all second estimates by predicting that two-thirds of others respond to the judgment item as they themselves do. Recall that the figure of 2/3 is an optimal Bayesian prediction if no other information is available (Colman, Pulford, & Lawrence, 2014; Dawes, 1989; Krueger, 1998). With such a rigorously projective strategy, each respondent’s set of second estimates would yield an accuracy correlation that would be identical to that respondent’s representativeness correlation (i.e., the correlation between own item endorsements and actual consensus rates in the group). In our sample, this average correlation was U = .39. The question is how such fully projective second estimates would af-fect the accuracy of bootstrapped estimates. In our sample, we found room for a substantial accuracy gain. Bootstrapped accuracy correlations (mean Z = .47, SD = .37, U = .44, p < .001) could be significantly higher than the accuracy correlations obtained with the first estimates (i.e, U = .36), t(126) = 5.42, p < .0001, d = .48.
Without introducing additional valid information, fully projective second esti-mates maximize the bootstrapped accuracy correlations. It is useful to compare the gains achievable with projection with the gains attained by averaging the es-timates of different (i.e., independent) judges. To address this question, we drew 50 random pairs of judges from our sample, averaged their first estimates for each item, and correlated these averages with actual consensus rates (cf. Müller-Trede,
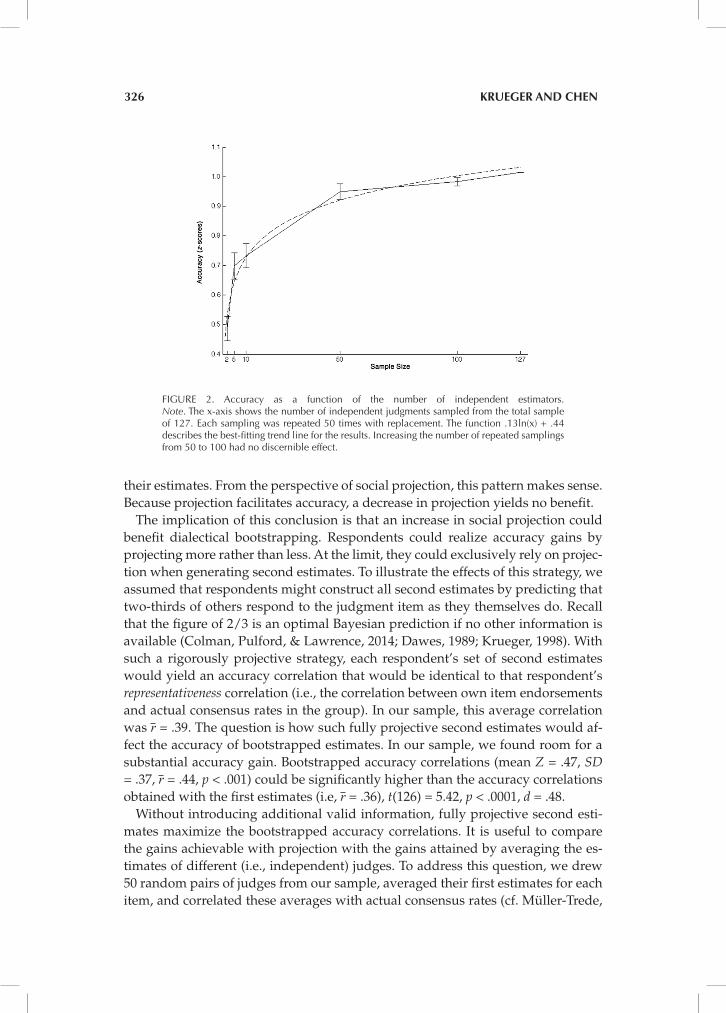
FIGURE 2. Accuracy as a function of the number of independent estimators. Note. The x-axis shows the number of independent judgments sampled from the total sample of 127. Each sampling was repeated 50 times with replacement. The function .13ln(x) + .44 describes the best-fitting trend line for the results. Increasing the number of repeated samplings from 50 to 100 had no discernible effect.

PROJECTION AND ACCURACY 327
2011). When we averaged the 50 correlations, we found that the accuracy gain was as large (mean Z = .49, SD = .29, U = .45, p < .001) as the gain obtained with most optimistic case of within-person aggregation (i.e., .47), t(175) = .25, p = .80, d = .04.
The accuracy gains obtained from aggregating independent judgments stem from increases in reliability (Brown, 1910; Spearman, 1910), which raises the ceil-ing available for accuracy correlations. It follows that any further increase in the number of aggregated judgments further increases reliability and accuracy. Figure 2 shows that using more than two independent estimates increases reliability, as indicated by the diminishing standard error bars from left to right. At the same time, accuracy rises, as indicated by the upward trend of the means (Hogarth, 1978; Winkler & Clemen, 2004; see Stroop, 1932, for an early demonstration).
DEVIATION-BASED ANALYSES
In their original report, Herzog and Hertwig (2009) focused on accuracy gains at the item level. This focus has been prevalent in studies of information aggregation since Galton (1907), and is commonly applied in studies on advice taking (Larrick et al., 2012). Herzog and Hertwig calculated the increases in accuracy obtained with bootstrapping as the percentage improvement relative to the deviations be-tween criterion values and first estimates (see Müller-Trede, 2011, for additional item-based scoring methods). Using this method, we calculated the accuracy gain for each participant, defined as the median decrease in error of the bootstrapped estimates relative to the first estimates, across items. We then averaged the accu-racy gains over participants. This analysis supported the dialectical bootstrapping hypothesis (M = 2.79, SD = 11.90). Figure 3 shows that the 95% confidence inter-val of this result (.72; 4.86) includes the value obtained by Herzog and Hertwig
FIGURE 3. Proportionate accuracy gains in deviation-based analyses.
328 KRUEGER AND CHEN
(4.1). Even though half of the second estimates lay outside of the gain range (M = 49.4%, SD = 6.98), their distribution still allowed bootstrapping to work on aver-age. If, however, first estimates were averaged with perfectly projective second estimates (that is, estimates that 67% of others would agree with the respondent’s own item endorsement), the mean accuracy gain would be larger (M = 12.60, SD = 11.62; CI: 10.58; 14.62). The figure also shows that the accuracy gains obtained by aggregating the first estimates of different respondents would be greater than the gains obtained with dialectical bootstrapping. Unlike the correlational analy-sis, the deviation-based analysis suggests that averaging the first estimates with perfectly projective estimates would yield the greatest accuracy gain. This finding underscores the inductive power of self-referent information and Hoch’s (1987) early claim that people fail to fully exploit it.9, 10
REVISITING HERZOG AND HERTWIG
Being on a percentage scale, consensus estimates are vulnerable to ceiling and floor effects. These boundary effects may contribute to regression effects such that the second estimates are less extreme than the first estimates if these first estimates are close to the endpoints of the scale. Judgments of historical dates do not face this constraint. It is possible that the second estimates of historical dates are as strongly correlated with criterion dates as are the first estimates. A re-analysis of Herzog and Hertwig’s data shows that the mean accuracy correlations, that is, correlations between estimated and actual historical dates over the 40 tasks, were identical for the first and the second estimates (U = .36). As in our own study, the bootstrapped estimates were no more accurate than first estimates alone (U = .36). In other words, the reduced accuracy of second estimates we observed in our data set may not be a necessary condition for the finding that bootstrapped estimates do not yield cor-relational accuracy gains.
The projection hypothesis accounted for our finding that the second (but not the first) estimates were accurate inasmuch as the correlation between the first and the second estimates was high. As projection played no role in the estimation of his-torical dates, there was no reason to expect this pattern. Indeed, in the Herzog and Hertwig data, the similarity of the first and the second estimate predicted neither the accuracy of the first, r(48) = .20, p = .17, nor of the second estimates, r(48) = .09, p = .53.
Taken together, the findings reported by Herzog and Hertwig (2009) and the present results are remarkably consistent. Dialectical bootstrapping yields accu-
9. White and Antonakis (2013) challenge Herzog and Hertwig’s proportional measure (see Herzog & Hertwig, 2013, for a reply), and instead compute pairs of median deviation scores. Using this method, we found that the median absolute errors of the bootstrapped estimates (M = 16.88, SD = 5.68) were smaller than median absolute error of first estimates (M = 18.76, SD = 6.20), F(1, 252) = 6.34, p = .01.
10. Additional analyses of Herzog and Hertwig’s (2009) data as well as our own are posted on a blog post. http://www.psychologytoday.com/blog/one-among-many/201212/visualizing-the-wisdom-the-inner-crowd
PROJECTION AND ACCURACY 329
racy gains when accuracy is computed as deviations between judgment and truth but not when it is computed as sensitivity correlations over stimulus items. We focused our work on the correlational measures because such measures have pre-dominated in research on social perception and prediction. An appeal to tradition is not a sufficient justification, however. Returning to Hoch’s (1987) seminal analy-sis, we note that only correlations over items reveal a person’s similarity to the group for which consensus is being estimated, and that this similarity (here called representativeness) is the cue that makes projection work (Brunswik, 1952). Hence, a person’s projection coefficient can be used as a prediction weight. In contrast, aggregate deviations over items hide the interdependence of representativeness, projection, and accuracy.
DISCUSSION
Social projection is a useful judgmental heuristic in an uncertain world. Projection exploits the representativeness of a judge’s own responses for the aggregated en-dorsement rates in the group to raise accuracy above levels that would be obtained if judges were merely guessing. Any projective consensus estimate carries some random error, which repeated estimation or dialectical estimation might reduce. However, in correlational analyses, we found no evidence for accuracy gains. In-stead, there was a drop in the accuracy of the second estimates, which may have contributed to this negative finding. We proposed, and found evidence for, the idea that second estimates show regression to the scale mean because respondents anchor their second estimates on their first estimates instead of anchoring them on their own item endorsements.
Our data replicated the benefits of dialectical bootstrapping when accuracy was measured in terms of the differences between estimates and true scores. We now propose a thought experiment to discuss how people might generate second es-timates in a task in which social projection is of no help. Suppose Edna estimates the number of beans in a jar to be 750 when the true number is 800. When her estimate is modeled as truth plus error, or T + ei, her second estimate will be re-gressive relative to the first. That is, her second estimate will more likely be closer to the true number of 800 than to be farther away. On the assumption that errors are independent of one another, the best statistical prediction of Edna’s second es-timate is the true value of 800. This prediction implies that the best prediction for the average of the first and second estimate is T + .5ei or 775. For bootstrapping to improve over the benefits of repeated guessing, the second estimate must be worse than the estimate expected to emerge from resampling. In other words, the error of the second estimate must compensate (as opposed to merely dilute) the error of the first estimate. Stated differently, bootstrapping works if it gets respondents to produce negatively correlated errors.
Having made an estimate of 750, Edna must now provide an estimate greater than T = 800 so that her bootstrapped estimate is closer to the true value of 800 than an aggregated estimate of 775. To succeed, she must adjust her initial esti-

330 KRUEGER AND CHEN
mate in the right direction (up) and beyond the true value. There is no generally accepted psychological account of how she might accomplish this. In a bean jar experiment, it is not clear how a request to “consider the opposite” might help her understand that her first estimate was too low and that, in order to benefit from aggregation, her second estimate would have to be much higher. If the numbers to be estimated are historical dates (as in Herzog & Hertwig, 2009), the situation is similar. From the perspective of the anchoring heuristic, one might speculate that first estimates are already the product of anchoring and adjustment (Epley & Gilovich, 2001). Edna’s initial intuition may have been to offer the number 700, but, to the extent that the true value of 800 sent a weak signal, felt that this estimate was too low. Her recorded first estimate of 750 already incorporated an adjustment by 50, which turned out to be insufficient. If Edna is cognizant of the direction of the adjustment she made, her continued effort to provide more accurate estimates may lead her to make further adjustments in the same direction as her earlier ad-justment. This strategy would lead her to move toward the true value and perhaps beyond it.
Recall that in the area of consensus estimation, the percentage scale is bounded and that the midpoint of the scale is a natural focal point for regressive estimates. If true values and first estimates lie near the endpoints of the scale, second esti-mates are more likely to lie farther away from the endpoint. It is therefore more likely that second estimates lie within the gain range if the true values are near the midpoint of the scale. In our data, there was a suggestive correlation between the
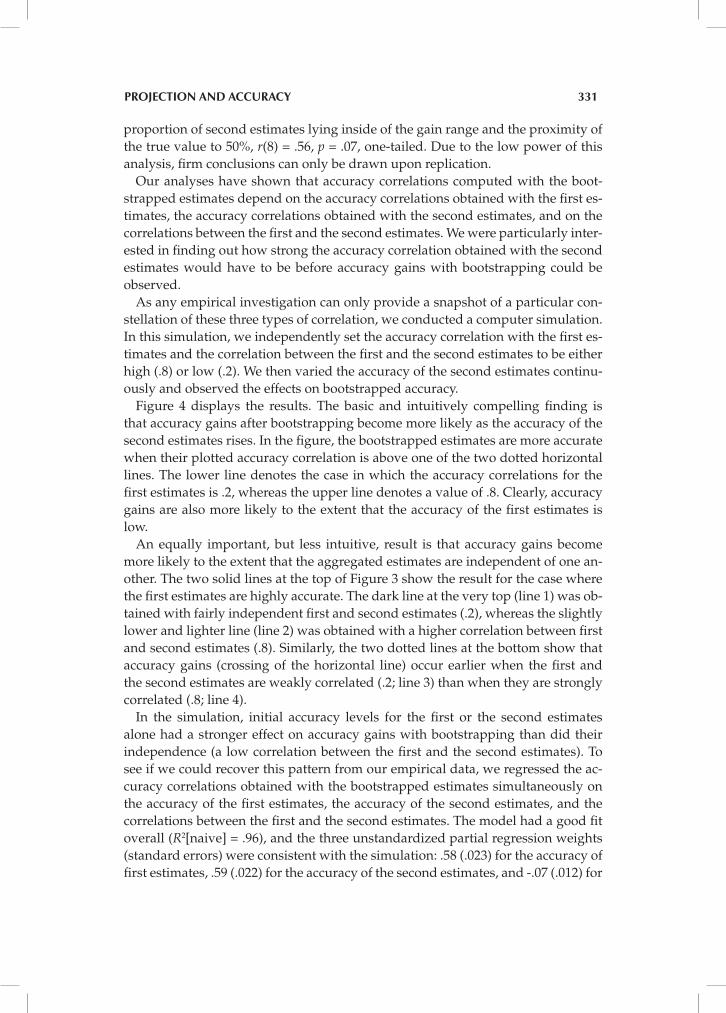
FIGURE 4. The accuracy of the bootstrapped estimates as a function of the accuracy of the first estimates and the correlations between the first and the second estimates. The accuracy correlation for the second estimates progresses in steps of 0.01 along the x-axis. At each step, the simulation comprises one million values. Lines are truncated if the correlation matrix is not possible, that is, if it is not positive semi-definite. Note. Line 1 is the case of high accuracy of the first estimates (.8) and low dependence of the first and the second estimates (.2).Line 2 is the case of high accuracy of the first estimates (.8) and high dependence (.8). Line 3 is the case of low accuracy of the first estimates (.2) and low dependence (.2). Line 4 is the case of low accuracy of the first estimates (.2) and high dependence (.8).
PROJECTION AND ACCURACY 331
proportion of second estimates lying inside of the gain range and the proximity of the true value to 50%, r(8) = .56, p = .07, one-tailed. Due to the low power of this analysis, firm conclusions can only be drawn upon replication.
Our analyses have shown that accuracy correlations computed with the boot-strapped estimates depend on the accuracy correlations obtained with the first es-timates, the accuracy correlations obtained with the second estimates, and on the correlations between the first and the second estimates. We were particularly inter-ested in finding out how strong the accuracy correlation obtained with the second estimates would have to be before accuracy gains with bootstrapping could be observed.
As any empirical investigation can only provide a snapshot of a particular con-stellation of these three types of correlation, we conducted a computer simulation. In this simulation, we independently set the accuracy correlation with the first es-timates and the correlation between the first and the second estimates to be either high (.8) or low (.2). We then varied the accuracy of the second estimates continu-ously and observed the effects on bootstrapped accuracy.
Figure 4 displays the results. The basic and intuitively compelling finding is that accuracy gains after bootstrapping become more likely as the accuracy of the second estimates rises. In the figure, the bootstrapped estimates are more accurate when their plotted accuracy correlation is above one of the two dotted horizontal lines. The lower line denotes the case in which the accuracy correlations for the first estimates is .2, whereas the upper line denotes a value of .8. Clearly, accuracy gains are also more likely to the extent that the accuracy of the first estimates is low.
An equally important, but less intuitive, result is that accuracy gains become more likely to the extent that the aggregated estimates are independent of one an-other. The two solid lines at the top of Figure 3 show the result for the case where the first estimates are highly accurate. The dark line at the very top (line 1) was ob-tained with fairly independent first and second estimates (.2), whereas the slightly lower and lighter line (line 2) was obtained with a higher correlation between first and second estimates (.8). Similarly, the two dotted lines at the bottom show that accuracy gains (crossing of the horizontal line) occur earlier when the first and the second estimates are weakly correlated (.2; line 3) than when they are strongly correlated (.8; line 4).
In the simulation, initial accuracy levels for the first or the second estimates alone had a stronger effect on accuracy gains with bootstrapping than did their independence (a low correlation between the first and the second estimates). To see if we could recover this pattern from our empirical data, we regressed the ac-curacy correlations obtained with the bootstrapped estimates simultaneously on the accuracy of the first estimates, the accuracy of the second estimates, and the correlations between the first and the second estimates. The model had a good fit overall (R2[naive] = .96), and the three unstandardized partial regression weights (standard errors) were consistent with the simulation: .58 (.023) for the accuracy of first estimates, .59 (.022) for the accuracy of the second estimates, and -.07 (.012) for
332 KRUEGER AND CHEN
the similarity of the two sets of estimates (all p < .001). Consistent with the simula-tion results, the last coefficient was smaller than the first two and negative in size.
Returning to the theoretical implications of the work, we conclude that the self is a good source of information for social judgment (Alicke, Dunning, & Krueger, 2005; Moore & Healy, 2008; Windschitl, Rose, Stalkfleet, & Smith, 2008). Self-focus becomes a problem only when people overweight their own perceptions and pref-erences while neglecting information or advice provided by knowledgeable others (Yaniv & Milyavsky, 2007). Social projection is egocentric in the sense that people anchor their social estimates on their own perceptions and preferences, but the evidence suggests that they often fail to fully exploit the potential of this strategy. Under many circumstances, the accuracy of social perception could be increased if people were encouraged to project more.
As a practical example, consider outgroup stereotypes, which are often, though not always, inaccurate. At the same time, projection to outgroups is consistently low (Robbins & Krueger, 2005). It follows that perceptions of outgroups can ben-efit from social projection to the degree that the perceiver’s own responses to the judgment items are valid cues to how outgroup members respond. Dialectical bootstrapping can play a beneficial role if perceivers can be persuaded to assume that outgroup members respond, by and large, as they themselves do. Stated dif-ferently, taking the outgroup’s perspective turns out to be taking and projecting one’s own.
Encouraging perceivers to project more can have beneficial effects beyond ac-curacy. Consider one example relevant for social perception and another example relevant for social behavior. In social perception, the phenomenon of self-enhance-ment is known as a robust bias, and is generally considered an egocentric fallacy. The most prevalent definition of self-enhancement refers to a positive social com-parison between the self and the average person (Alicke & Govorun, 2005). As such, self-enhancement appears to be logically opposed to social projection. Indeed, ana-lytical work and empirical findings point to a negative correlation between the two phenomena (Krueger, Freestone, & MacInnis, 2013). The current results suggest that attempts to increase projection in the context of dialectial reasoning may have the side effect of decreasing individuals’ sense of relative superiority.
In social behavior, social projection can have beneficial effects on individuals’ willingness to cooperate with others in social dilemmas (Krueger, 2013). To the extent that they believe that others will act as they themselves do, the outcomes of mutual cooperation or mutual defection appear more probable than the outcomes associated with unilateral choices (i.e., being able to free-ride or being suckered). Faced with the two likely outcomes of mutual cooperation and mutual defection, rational individuals choose to cooperate (Krueger, DiDonato, & Freestone, 2012). This finding also suggests that social perceivers should be encouraged to project more rather than less when thinking dialectically and revising their predictions of what others will do. Questions remain about how to make people project more. Whereas to our knowledge little progress has been made to strengthen projec-tion through procedural priming, there is good evidence for the efficacy of more explicit methods. Similarities between the self and another person or group can be
PROJECTION AND ACCURACY 333
highlighted with the provision of information about shared characteristics (Ames, Weber, & Zhou, 2012) or through social categorization emphasizing membership in the same large groups (Krueger & Clement, 1996).
It is instructive to consider the issues of social projection and dialectical boot-strapping from the meta-theoretical point of view of dual-systems models of mind (if only metaphorically, as Kahneman, 2011, does). From this perspective, it is note-worthy that it does not take much to project. The process is engaged easily and swiftly, which suggests it is a task performed by the intuitive system. Determin-ing how estimates provided by projection may be wrong and how they might be improved is a more demanding task, requiring deliberative thought and the deployment of scarce cognitive resources (Evans, 2010). This would be even more so if respondents themselves were to attempt to integrate their first and second estimates. The findings reported in this article suggest that thoughtfulness is not always the best attitude when making social judgments (Wilson & Schooler, 1991, see also Dane, Rockmann, & Pratt, 2012, for recent research).
CONCLUSION
In this article, we investigated the uses and limitations of information aggregation within individuals. Building on previous work on dialectical bootstrapping and social projection, we analyzed two data sets from two distinctive statistical per-spectives. Both our own original data and Herzog and Hertwig’s (2009) prior data showed benefits of aggregation using deviation scores, but no advantages using correlations. Use of correlations is, however, uniquely suited to the study of social projection and consensus estimation. Consistent with prior work, we found that social projection is a powerful and beneficial judgmental heuristic. If it were used more fully, it could lead to greater accuracy gains. We proposed a simple model of sequential anchoring to explain why explicit instructions to dialectically revise estimates may work against a full exploitation of this heuristic’s potential.
REFERENCES
Alicke, M. D., Dunning, D., & Krueger, J. I. (2005). The self in social judgment. New York: Psychology Press.
Alicke, M. D., & Govorun, O. (2005). The bet-ter-than-average effect. In M. D. Alicke, D. Dunning, & J. I. Krueger (Eds.), The self in social perception (pp. 85-106). New York: Psychology Press.
Ames, D. R. (2004). Inside the mind-reader’s toolkit: Projection and stereotyping in mental state inference. Journal of Perso-nality and Social Psychology, 87, 340-353. doi: 10.1037/0022-3514.87.3.340
Ames, D. R., Weber, E. U., & Zou, X. (2012). Mind-reading in strategic interaction: The impact of perceived similarity on projection and stereotyping. Organi-zational Behavior and Human Decision Processes, 117, 96-110. doi: 10.1016/j.ob-hdp.2011.07.007
Arrow, K. J. (1963). Social choice and individual values (2nd ed.). New Haven, CT: Yale University Press.
Brown, W. (1910). Some experimental results in the correlation of mental abilities. Bri-tish Journal of Psychology, 3, 296-322.
334 KRUEGER AND CHEN
Brunswik, E. (1952). The conceptual framework of psychology. Chicago: University of Chi-cago Press.
Cadinu, M. R., & Rothbart, M. (1996). Self-anchoring and differentiation processes in the minimal group setting. Journal of Personality and Social Psychology, 70, 661-677. doi: 10.1037/0022-3514.70.4.661
Colman, A. M., Pulford, B. D., & Lawrence, C. L. (2014). Explaining strategic coordina-tion: Cognitive hierarchy theory, strong Stackelberg reasoning, and team rea-soning. Decision, 1, 35-58. doi:10.1037/dec0000001
Condorcet, M. (1994/1785). Essay on the ap-plication of probability analyses to deci-sions returned by a plurality of people. In I. McLean & F. Hewitt (Eds. & Trans.), Condorcet: Foundations of social choice and political theory (pp. 11-36). Brookfield, VT: Edward Elgar.
Dane, E., Rockmann, K. W., & Pratt, M. G. (2012). When should I trust my gut? Linking domain expertise to intuitive decision-making effectiveness. Orga-nizational Behavior and Human Decision Processes, 119, 187-194. doi: 10.1016/j.obhdp.2012.07.009
Dawes, R. M. (1977). Suppose we mea-sured height with rating scales in-stead of rulers. Applied Psycholo-gical Measurement, 1, 267-273. doi: 10.1177/014662167700100213
Dawes, R. M. (1989). Statistical criteria for establishing a truly false consensus ef-fect. Journal of Experimental Social Psy-chology, 25, 1-17. doi: 10.1016/0022-1031(89)90036-X
DiDonato, T. E., Ullrich, J., & Krueger, J. I. (2011). Social perception as induction and inference: An integrative model of intergroup differentiation, ingroup fa-voritism, and differential accuracy. Jour-nal of Personality and Social Psychology, 100, 66-83. doi: 10.1037/a0021051
Efron, B. (1979). Bootstrap methods: Another look at the jackknife. The Annals of Sta-tistics, 7, 1-26.
Epley, N., & Gilovich, T. (2001). Putting adjust-ment back in the anchoring and adjust-ment heuristic: Differential processing of self-generated and experimenter-pro-vided anchors. Psychological Science, 12, 391-396. doi: 10.1111/1467-9280.00372
Epley, N., Keysar, B., van Boven, L., & Gilovich, T. (2004). Perspective taking as egocen-tric anchoring and adjustment. Journal of Personality and Social Psychology, 87, 327-339. doi: 10.1037/0022-3514.87.3.327
Evans, J. St. B. T. (2010). Thinking twice: Two minds in one brain. Oxford, UK: Oxford University Press.
Fiedler, K., & Krueger, J. I. (2012). More than an artifact: Regression as a theoretical con-struct. In J. I. Krueger (Ed.), Social judg-ment and decision-making (pp. 171-189). New York: Psychology Press.
Galton, F. (1886). Regression towards medioc-rity in hereditary stature. The Journal of the Anthropological Institute of Britain and Ireland, 15, 246-263. doi: 10.2307/2841583
Galton, F. (1907). Vox populi. Nature, 75, 450-451.
Hansen, J. E., & Lebedeff, S. (1987). Global trends of measured surface air tem-perature. Journal of Geophysical Re-search, 92, 13345-13372. doi: 10.1029/JD092iD11p13345
Hastie, R., & Kameda, T. (2005). The robust beauty of majority rules in group deci-sions. Psychological Review, 112, 494-508. doi: 10.1037/0033-295X.112.2.494
Herzog, S. M., & Hertwig, R. (2009). The wis-dom of many in one mind: Improving individual judgments with dialecti-cal bootstrapping. Psychological Sci-ence, 20, 231-237. doi: 10.1111/j.1467-9280.2009.02271.x
Herzog, S. M., & Hertwig, R. (2013). The crowd within and the benefits of dialectical bootstrapping: A reply to White and An-tonakis (2013). Psychological Science, 24, 117-119. doi: 10.1177/0956797612457399
Hoch, S. J. (1987). Perceived consensus and predictive accuracy: The pros and cons of projection. Journal of Personality and Social Psychology, 53, 221-234. doi: 10.1037/0022-3514.53.2.221
Hogarth, R. M. (1978). A note on aggregat-ing opinion. Organizational Behavior and Human Performance, 21, 40-46. doi: 10.1016/0030-5073(78)90037-5
Jenness, A. (1932). The role of discussion in changing opinion regarding a matter of fact. Journal of Abnormal and Social Psychology, 27, 279-296. doi: 10.1037/h0074620
Judd, C. M., Ryan, C. C., & Park, B. (1991). Ac-curacy in the judgment of in-group and
PROJECTION AND ACCURACY 335
out-group variability. Journal of Perso-nality and Social Psychology, 61, 366-379. doi: 10.1037/0022-3514.61.3.366
Kahneman, D. (2011). Thinking, fast and slow. New York: Farrar, Straus, and Giroux.
Krueger, J. (1998). On the perception of social consensus. In M. P. Zanna (Ed.), Advan-ces in experimental social psychology (Vol. 30, pp. 163-240). San Diego: Academic. doi: 10.1016/S0065-2601(08)60384-6
Krueger, J. (2000). The projective perception of the social world: A building block of social comparison processes. In J. Suls & L. Wheeler (Eds.), Handbook of social com-parison: Theory and research (pp. 323-351). New York: Plenum/Kluwer.
Krueger, J. I. (2003). Return of the ego—Self-referent information as a filter for social prediction: Comment on Karniol (2003). Psychological Review, 110, 585-590. doi: 10.1037/0033-295X.110.3.585
Krueger, J. I. (2012). Unpublished data. Brown University. Providence, Rhode Island.
Krueger, J. I. (2013). Social projection as a source of cooperation. Current Directions in Psychological Science, 22, 289-294. doi: 10.1177/0963721413481352.
Krueger, J., & Clement, R. W. (1994). The truly false consensus effect: An ineradicable and egocentric bias in social perception. Journal of Personality and Social Psycho-logy, 67, 596-610. doi: 10.1037/0022-3514.67.4.596
Krueger, J., & Clement, R. W. (1996). Inferring category characteristics from sample characteristics: Inductive reasoning and social projection. Journal of Experimen-tal Psychology: General, 125, 52-68. doi: 10.1037/0096-3445.125.1.52
Krueger, J. I., DiDonato, T. E., & Freestone, D. (2012). Social projection can solve social dilemmas. Psychological Inquiry, 23, 1-27. doi: 10.1080/1047840X.2012.641167
Krueger, J. I., Freestone, D., & McInnis, M. L. (2013). Comparisons in research and reasoning: Toward an integrative theory of social induction. New Ideas in Psycho-logy, 31, 73-86. doi: 10.1016/j.newidea-psych.2012.11.002
Krueger, J., & Stanke, D. (2001). The role of self-referent and other-referent knowledge in perceptions of group characteristics. Personality and Social Psychology Bulletin, 27, 878-888. doi: 10.1177/0146167201277010
Larrick, R. P., Mannes, A. E., & Soll, J. B. (2012). The social psychology of the wisdom of crowds. In J. I. Krueger (Ed.), Social judg-ment and decision making (pp. 227-242). New York: Psychology Press.
Lord, C. G., Lepper, M. R., & Preston, E. (1984). Considering the opposite: A corrective strategy for social judgment. Journal of Personality and Social Psycho-logy, 47, 1231-1243. doi: 10.1037/0022-3514.47.6.1231
Lord, F. M., & Novick, M. R. (1968). Statistical theories of mental test scores. Oxford, Eng-land: Addison-Wesley.
Luan, S., Katsikopoulos, K. V., & Reimer, T. (2012). The “less-is-more” effect in group decision making. In R. Hertwig, U. Hoffrage, and the ABC Research Group (Eds.), Simple heuristics in a social world (pp. 319-342). New York: Oxford.
Moore, D. A., & Healy, P J. (2008). The trouble with overconfidence. Psychological Re-view, 115, 102-117. doi: 10.1037/0033-295X.115.2.502
Müller-Trede, J. (2011). Repeated judgment sampling: Boundaries. Judgment and Decision Making, 6, 283-294. http://jour-nal.sjdm.org/11/101217a/jdm101217a.html
Robbins, J. M., & Krueger, J. I. (2005). Social projection to ingroups and outgroups: A review and meta-analysis. Personali-ty and Social Psychology Review, 9, 32-47. doi: 10.1207/s15327957pspr0901_3
Ross, L., Greene, D., & House, P. (1977). The “false consensus effect”: An egocentric bias in social perception and attribu-tion processes. Journal of Experimen-tal Social Psychology, 13, 279-301. doi: 10.1016/0022-1031(77)90049-X
Silver, N. (2012). The signal and the noise: Why most predictions fail but some don’t. New York: Penguin.
Spearman, C. (1910). Correlation calculated from faulty data. British Journal of Psy-chology, 3, 271-295.
Stroop, J. (1932). Is the judgment of the group better than that of the average member of the group? Journal of Experimental Psychology, 15, 550-562. doi: 10.1037/h0070482
Surowiecki, J. (2004). The wisdom of crowds. New York: Random House.
Vul, E., & Pashler, H. (2008). Measuring the crowd within: Probabilistic representa-

336 KRUEGER AND CHEN
tions within individuals. Psychological Science, 19, 645-647. doi: 10.1111/j.1467-9280.2008.02136.x
White, C. M., & Antonakis, J. (2013). Quanti-fying accuracy improvement in sets of pooled judgments: Does dialectical boot-strapping work? Psychological Science, 24, 115-116. doi: 10.1177/0956797612449174
Wilson, T. D., & Schooler, J. W. (1991). Think-ing too much: Introspection can reduce the quality of preferences and decisions. Journal of Personality and Social Psycho-logy, 60, 181-192. doi: 10.1037/0022-3514.60.2.181
Windschitl, P. D., Rose, J. P., Stalkfleet, M. T., & Smith, A. R. (2008). Are people exces-sive or judicious in their egocentrism?
A modeling approach to understand-ing bias and accuracy in people’s opti-mism. Journal of Experimental Psychology: General, 95, 253-273. doi: 10.1037/0022-3514.95.2.253
Winkler, R. L., & Clemen, R. T. (2004). Multiple experts vs. multiple methods: Com-bining correlation assessments. Deci-sion Analysis, 1, 167-176. doi: 10.1287/deca.1030.0008
Yaniv, I., & Milyavsky, M. (2007). Using ad-vice from multiple sources to revise and improve judgments. Organizatio-nal Behavior and Human Decision Pro-cesses, 103, 104-120. doi: 10.1016/j.ob-hdp.2006.05.006


![The Effects of Compulsory Military Service Exemption on ... · veterans has diminished quickly over time [Angrist and Chen (2011), Angrist, Chen, and Song (2011)]. Angrist and Krueger](https://static.fdocuments.in/doc/165x107/60c1dec32f107f6d86766956/the-eiects-of-compulsory-military-service-exemption-on-veterans-has-diminished.jpg)