The financial statement analysis and cost reduction program
67
A PROJECT REPORT ON The Financial Statement Analysis and Cost Reduction Program AT TATA MOTORS LIMITED, PUNE Submitted To Pune University In Partial Fulfillment of the Requirement of Master of Business Administration Submitted By Mr. Chetan G. Aher M.B.A Under the Guidance of Prof. Mr. Mahesh Halale THROUGH THE DIRECTOR OF Visahwakarma Institute of Management 2005 - 2007
Transcript of The financial statement analysis and cost reduction program

A
PROJECT REPORT ON
The Financia l Sta tement Analysis and Cost Reduct ion Program
AT
TATA MOTORS LIMITED, PUNE
Submitted To Pune University
In Partial Fulfillment of the Requirement of Master of Business Administration
Submitted By Mr. Chetan G. Aher
M.B.A
Under the Guidance of
Prof. Mr. Mahesh Halale
THROUGH THE DIRECTOR OF
Visahwakarma Institute of Management 2005 - 2007
The Financial Statement Analysis and Cost Reduction Program.
MBA Program 2005-2007 2
Acknowledgement
I hereby take the opportunity to express my gratitude towards those who have made great
contribution in completion of this project work. I feel immense pleasure to thanks
Mr. A.A.Phalke, Head of shared services Tata Motors, and Mr. D.N.Kulkarni Senior
finance Manager of shared services, who very kindly helped me in providing necessary
information and guidance from time to time. Mr. Prabhakar Panchbhai, HR Manager
Tata Motors, who has given me the opportunity to work with Tata Motors as project
trainee. I am immensely thankful to my external project guide Mr. D.N.Kulkarni and
internal project guide Prof. Mahesh Halale who has been a constant source of inspiration.
Both are them keen interest and encouraging guidance, which lead to completion of this
project in time, is hard to express in words. I will take the opportunity to convey my
thankfulness to our Director Prof. Dr. Mr. Sharad Joshi for his kind help and warm
treatment. This is place to express my gratitude towards them who have directly and
indirectly helped me and made my work enjoyable.

The Financial Statement Analysis and Cost Reduction Program.
MBA Program 2005-2007 3
Contents
Chapter - 1 Introduction 1.1 TATA Motors Profile
1.2 Subsidiaries of TATA Motors
1.3 Milestone
1.4 Objective
1.5 Methodology Collection of Data
Chapter 2 2.1 Executive Summary of project
2.2 Financial Performance of company2005-2006
Chapter - 3 Financial Statement of analysis 3.1 Meaning
3.2 Trend Analysis - Meaning
3.3 Reason for loss in 2000-2001
3.4 Ratio Analyses - Meaning 3.5 Types of Ratio
3.6 Calculation & Analyses of Ratios
Chapter- 4 Cost Reduction Progamme 4.1 Cost Reduction process
4. 2 Cost reduction Programme of TATA Motors
Chapter- 5 5.1 Finding
5.2 Conclusion 5. 3 Bibliography
The Financial Statement Analysis and Cost Reduction Program.
MBA Program 2005-2007 4
Chapter
1
1.1TATA MOTORS Profile
1.2 Subsidiaries of Tata Motors
1.3 Milestone
1.4 Objective
1.5 Methodology
Collection of data
Company Profile
TATA Motors formerly known as TELCO (TATA engineering and Locomotive
Company) fully integrated automobile manufacturer with a portfolio that covers trucks,
buses, utility vehicles and passenger cars, which is now being famous for giving. TELCO
is established in 1945. In July 2003 TELCO changed its name into TATA Motors
Ltd . TATA Motors Limited is India's largest automobile company, with revenues of US
$ 6.0 billion in 2005-06. TATA Motors is the leader in commercial vehicles in each
segment, and the second largest in the passenger vehicles market with winning products
in the compact, midsize car and utility vehicle segments. The company is the world's fifth
largest medium and heavy commercial vehicle manufacturer.
The company's 22,000 employees are guided by the vision to be best in the
manner in which we operate, best in the products we deliver, and best in our value
system and ethics.
TATA Motors' presence indeed cuts across the length and breadth of India. Over 3.5
million TATA vehicles ply on Indian roads, since the first rolled out in 1954. The
company's manufacturing base is spread across Jamshedpur, Pune and Lucknow, supported
by a nation-wide dealership; sales, services and spare parts network comprising about
1,200 touch points.

The Financial Statement Analysis and Cost Reduction Program.
MBA Program 2005-2007 6
ABOUT THE VARIOUS PLANTS:
JAMSHEDPUR: Area: 700+ Acres - Strength: 14000
Oldest plant of Tata Motors.
Initially manufacturing Locomotive Engines.
Collaboration with Mercedes Benz.
Started production of Trucks and Bus Chassis.
Recently collaborated with M/s. Daewoo of Korea and manufacturing
Heavy Commercial Vehicles -Trucks/Buses/Tippers under the brand name
of Novas.
LUCKNOW: Area: 600 Acres Strength: 3500
Tata Sumo was initially assembled at Lucknow Plant.
Now the production of Sumo has been stopped and Trucks and Buses are
now manufactured/assembled at Lucknow.
The production is same as Jamshedpur. Except Daewoo collaboration
vehicles.
Lucknow plant is under the Head - Jamshedpur Plant.
DHARWAD: Area: Around 530 Acres
A big piece of land has acquired in Dharwad.
No plan finalized yet for any production/Assembly line.
PUNE: Area: 600 + 600 (Residential) Acres Strength: 12000
Flagship plant of Tata Motors.
Manufacturing various types of Heavy Commercial Vehicles, Medium
Commercial Vehicles, Light Commercial Vehicles-Tata Sumo, Tata Safari,
Mini truck
ACE and indigenously developed Small Car - Indica, Indigo and
Marina.
CHINCHWAD: Area 325 Acres.
Casting & Aluminum Foundry as well as Tata Automation Ltd.

The Financial Statement Analysis and Cost Reduction Program.
MBA Program 2005-2007 7
CAR PLANT (PIMPRI): Area: 150 Acres Strength: 6500
Production of Small Car started in 1999.
Daily production at present is 750 Cars.
Tata Indica, Indigo and Marina are manufactured at Car Plant (K Block). It is
one of the ultra modern plants in India
Global Scenario:
The company's commercial and passenger vehicles are already being marketed in
several countries in Europe, Africa, the Middle East, Australia, South East Asia and South
Asia. It has assembly operations in Malaysia, Kenya, Bangladesh, Spain, Ukraine, Russia
and Senegal.
Tata Motors, the first company from India's engineering sector to be listed
in the New York Stock Exchange (September 2004), has also emerged as a global
automotive company.
In 2004, it acquired the Daewoo Commercial Vehicles Company, Korea's second
largest truck maker. The rechristened Tata Daewoo Commercial Vehicles
Company has already begun to launch new products.
In 2005, Tata Motors acquired a 21% stake in Hispano Carrocera, a reputed
Spanish bus and coach manufacturer, with an option to acquire the remaining stake
as well. Hispano's presence is being expanded in other markets.

The Financial Statement Analysis and Cost Reduction Program.
MBA Program 2005-2007 8
Subsidiaries
Through its subsidiaries, the company is engaged in engineering and automotive solutions,
construction equipment manufacturing, automotive vehicle components manufacturing and
supply chain activities, machine tools and factory automation solutions, high-precision
tooling and plastic and electronic components for automotive and computer applications,
and automotive retailing and service operations.
Over the years, Tata Motors has made substantial investments in building
companies that add value, facilitate and support its diverse range of business activities.
1) Telco Construction Equipment Co. Ltd. (Telcon)
2) Tata Technologies Ltd. (TTL) and Tata Technologies Ltd., USA (TTUS)
3) HV Axles Ltd. (HVAL)
4) HV Transmissions Ltd. (HVTL)
5) TAL Manufacturing Solutions Ltd. (TAL)
6) Sheba Properties Ltd. (Sheba)
7) Concorde Motors (India) Ltd. (Concorde) [formerly known as Minicar (India) Ltd.]
8) Tata Daewoo Commercial Vehicle Company Ltd (TDWCV)
9) Tata Motors Insurance Services Ltd. (TMISL) [formerly known as Concorde Motors Ltd.]
10) Tata Motors European Technical Centre plc
The Financial Statement Analysis and Cost Reduction Program.
MBA Program 2005-2007 9
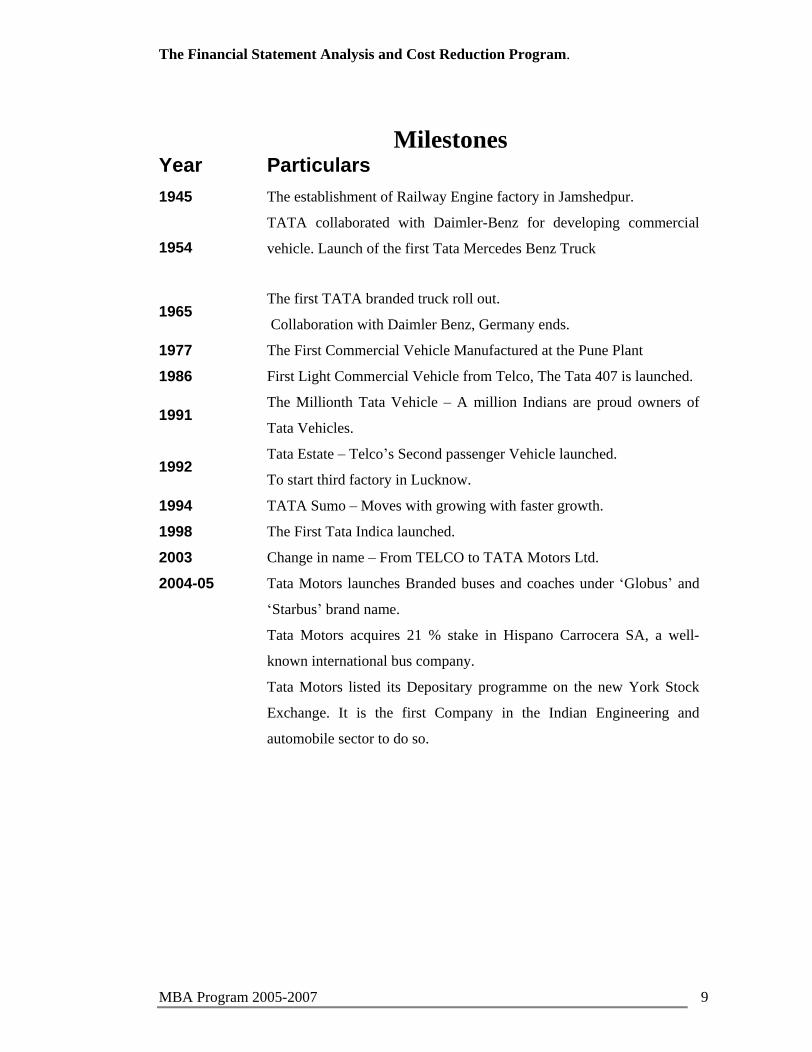
Milestones
Year Particulars
1945 The establishment of Railway Engine factory in Jamshedpur.
1954
TATA collaborated with Daimler-Benz for developing commercial
vehicle. Launch of the first Tata Mercedes Benz Truck
1965 The first TATA branded truck roll out.
Collaboration with Daimler Benz, Germany ends.
1977 The First Commercial Vehicle Manufactured at the Pune Plant
1986 First Light Commercial Vehicle from Telco, The Tata 407 is launched.
1991 The Millionth Tata Vehicle
A million Indians are proud owners of
Tata Vehicles.
1992 Tata Estate
Telco s Second passenger Vehicle launched.
To start third factory in Lucknow.
1994 TATA Sumo Moves with growing with faster growth.
1998 The First Tata Indica launched.
2003 Change in name From TELCO to TATA Motors Ltd.
2004-05 Tata Motors launches Branded buses and coaches under Globus and
Starbus brand name.
Tata Motors acquires 21 % stake in Hispano Carrocera SA, a well-
known international bus company.
Tata Motors listed its Depositary programme on the new York Stock
Exchange. It is the first Company in the Indian Engineering and
automobile sector to do so.

The Financial Statement Analysis and Cost Reduction Program.
MBA Program 2005-2007 10
Objectives
There are different objectives for which the study has been completed. They are as
follows:-
1) To Analysis the loss of TATA Motors in the year 2000-2001
2) To understand the importance of financial statement analysis, calculate the ratios,
and also analyze them.
3) To study the Tata motors financial position and market standing through the ratio
analysis
4) To study the Tata motors cost reduction programme.
5) To find out profitability, liquidity of Tata motors
The Financial Statement Analysis and Cost Reduction Program.
MBA Program 2005-2007 11
METHODOLOGY
The main objective of the study is to determine and analyze the financial position and
Cost reduction of the Tata Motors Ltd. For this purpose, the information was collected
by two ways:
1. Primary Data:
Primary data is that which is not published but it is very useful data.
So the information was collected by discussion held with the executives of accountsand
finance department.
2. Secondary Data:
Secondary data consist of the information that already exists or someone has
collected it for specific purpose. This data was collected by:
A) The company profile was collected from website of Tata Motors Ltd. (TML),
www.tatamotors.com
B) The other analytical information was collected from annual report and books and
discussion with finance manager.

The Financial Statement Analysis and Cost Reduction Program.
MBA Program 2005-2007 12
Chapter
2
2.1 Executive summary of project report
2.2 Financial Performance of company in 2005-2006

The Financial Statement Analysis and Cost Reduction Program.
MBA Program 2005-2007 13
EXECUTIVE SUMMARY
A Tata motors, with revenues of over US $ 6.0 billion (FY 2005-06), is a flagship
company of the Tata group. It is the world s largest company of the Tata group, it is
world s largest medium and heavy commercial vehicles model with the range of light
vehicle manufacturer and producers more than range of light, medium to heavy duty
trucks, buses and tractor and trainers. Tata motor is the second largest player in the
domestic passenger car market in India. Two of its five passenger vehicle brands are
among top ten.
Income statements of the Tata motors for years 99-00 to 05-06 are the business
mirrors, which reflect the financial position and operating strength and weakness of the
concern. Income statement analysis which is done by using ratio analysis and trend
analysis give the true picture of the company during1999-2000 to2005-2006. Cost
reduction is the true medicine for the revival of the company during the decline of the
company which is studied in this project.
Year 2000-01which was the black year Tata motor s history, which suffered from huge
loss. It wasn t any one factor that fueled Tata engineering s fall. The market for
commercial vehicles, the core of the company s business.
Tata motor which was running thorough bad phase during the gestation period
preferred cost reduction which was the best terminology at India s largest automobile
company.
The cost reduction initiative, which began in April 2000, is arguably the most
important element in the remarkable revival that has seen the Tata motor recover from
the loss of Rs 28 crores in the first quarter 2002-2003.
A quality improvement program based on the six sigma model, and the other
components of this revival, but it is in the cost reduction that the gains have come
thickest and fastest.
The big positive of the cost reduction initiative goes beyond the statistics of money
saved. The crisis unified the company. Companies have emerged from this as phoenix.

The Financial Statement Analysis and Cost Reduction Program.
MBA Program 2005-2007 14
Financial Performance of company in 2005-2006
The company s financial performance continued to improve in this financial year
owing to a good volume growth of 13.7 % and continued efforts by the company to
maintain its margins, driven mainly by cost reduction efforts. The following points to be
noted down:
1) Sales Volume: This year was an outstanding year for the company, which recorded peak
performance on all major financial parameters. Overall sales volume at 454129 and
turnover at Rs. 24293.23 crores were higher at 14 % and 18 % respectively than previous
year 2004-05.
SALES VOLUME 2004-05 2005-06 CV 189993 214836 PV 179076 189070 EXPORTS 30497 50223 TOTAL 399566 454129
190 179
30
400
215189
50
454
0
50000
100000
150000
200000
250000
300000
350000
400000
450000
500000
CV PV EXPORTS TOTAL
2004-052005-06

The Financial Statement Analysis and Cost Reduction Program.
MBA Program 2005-2007 15
2. SOURCES OF REVENUE:
Sales Turnover has increased by 18.8 % to another record high of Rs. 20891.31 crores from Rs. 17585.22 crores in 2004-05.
PARTICULARS 2004-05 % 2005-06 % Domestic Vehicle Sales 17636.46 85.41 19649.29 80.88 Exports 1518.08 7.35 2395.34 9.86 Vehicle spare parts 783.46 3.79 984.74 4.05 Hire purchase 159.47 0.77 432.67 1.78 Dividend 166.09 0.80 289.11 1.19 Others 385.10 1.87 542.08 2.23
20648.66 100 24293.23 100
(9.86 %)
(4.05 %)
(80.88 %)
Domestic Vehicle
SALES
Exports
Vehicle Spare Parts
Hire Purchase
Dividend /Other
Income
Others
The Financial Statement Analysis and Cost Reduction Program.
MBA Program 2005-2007 16
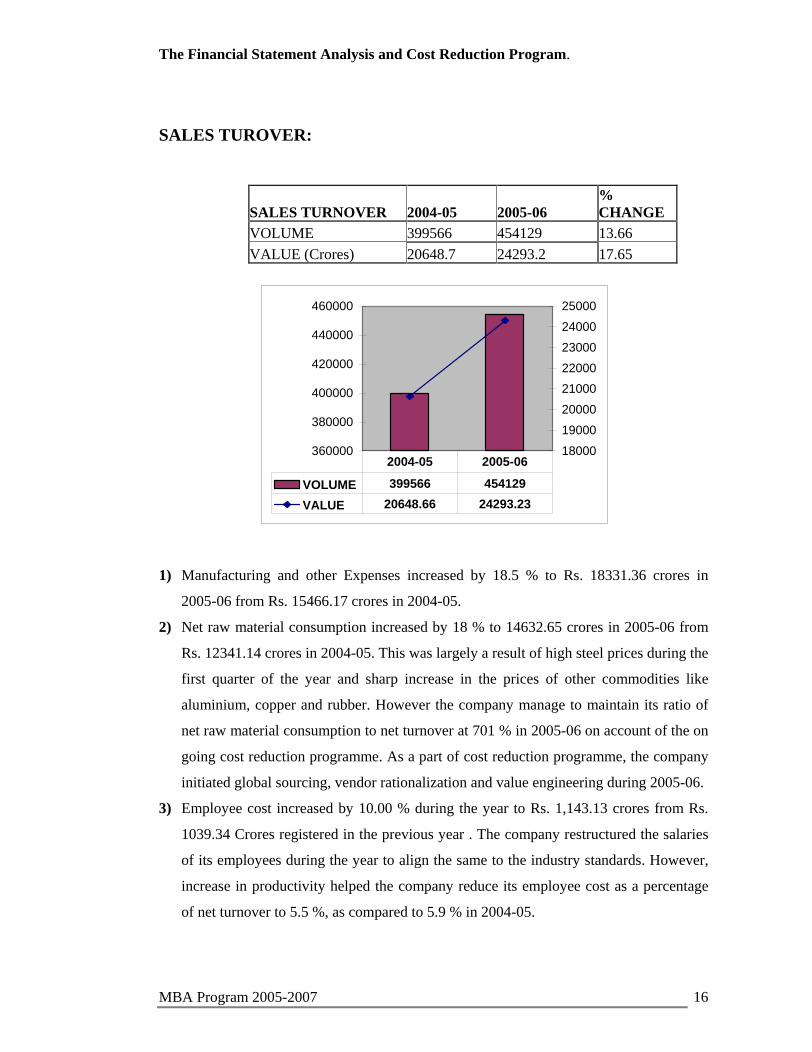
SALES TUROVER:
SALES TURNOVER 2004-05 2005-06 % CHANGE
VOLUME 399566 454129 13.66
VALUE (Crores) 20648.7 24293.2 17.65
360000
380000
400000
420000
440000
460000
18000
19000
20000
21000
22000
23000
24000
25000
VOLUME 399566 454129
VALUE 20648.66 24293.23
2004-05 2005-06
1) Manufacturing and other Expenses increased by 18.5 % to Rs. 18331.36 crores in
2005-06 from Rs. 15466.17 crores in 2004-05.
2) Net raw material consumption increased by 18 % to 14632.65 crores in 2005-06 from
Rs. 12341.14 crores in 2004-05. This was largely a result of high steel prices during the
first quarter of the year and sharp increase in the prices of other commodities like
aluminium, copper and rubber. However the company manage to maintain its ratio of
net raw material consumption to net turnover at 701 % in 2005-06 on account of the on
going cost reduction programme. As a part of cost reduction programme, the company
initiated global sourcing, vendor rationalization and value engineering during 2005-06.
3) Employee cost increased by 10.00 % during the year to Rs. 1,143.13 crores from Rs.
1039.34 Crores registered in the previous year . The company restructured the salaries
of its employees during the year to align the same to the industry standards. However,
increase in productivity helped the company reduce its employee cost as a percentage
of net turnover to 5.5 %, as compared to 5.9 % in 2004-05.

The Financial Statement Analysis and Cost Reduction Program.
MBA Program 2005-2007 17
4) Profit before depreciation interest, exceptional items and tax increased by 22.7 % to
Rs. 2337.18 crores in 2004-05. the margin increased to 13.7 % from 13.3 % in 2004-
05.
5) Depreciation for 2005-06 increased by 15.7 % to Rs. 520.94 crores from Rs. 450.16
crores in 2004-05 on a account of increase in fixed assets.
6) Net interest cost increased to Rs. 226.35 crores in 2005-06 from Rs. 154.15 crores in
2004-05. The increase in interest cost was on account of significant increase in
working capital requirement for vehicle financing business and hardening of interest
rates during the year. The company also issued foreign currency convertible Notes
aggregating to JPY 11.76 Billion during 2005-06.
7) Profit After Tax of the company increased by 24.3 % to Rs. 2053.38 Crores from Rs.
1651.90 crores in 2004-05.
8) Earning per share increased by 18 % to Rs. 40.57 as compared to Rs. 34.38 last year.
9) Balance sheet size of the company increased to Rs. 9096.45 crores in 2005-06 from Rs.
7172.09 crores in 2004-05. this increase in attributed to significant capital expenditure
insured by the company for its new product introduction programme and substantial
increase in our vehicle financing business.
10) As on 31st march 2006, the ordinary shares Capital of the company stood at Rs. 382.87
crores as compared to Rs. 361.79 crores as on 31st March 2005. this was on account of
allotment of ordinary shares of the company to the shareholders of the erstwhile Tata
Finance Limited consequent upon its amalgamation with the company and the
conversion of 1 % convertible Notes ( USD 100million due 2008 ) to the extent of 91.4
% and the zero coupon Convertible Notes ( USD 100 mn due 2009 ) to the extent of
81.9 % during the year.
11) Gross Debt stood at Rs. 2936.84 crores as on March 31St 2006 as compared to Rs.
2495.42 crores as on 31st march 2005.
12) Fixed assets of the company increased to Rs. 4521.23 Crores in 2005-06 from Rs.
3696.51 crores in 2004-05. This is largely on account of additional capacity set up for
manufacturing Tata Ace during the year, product development expenditure for the on
going new product development programme.
13) Investment of the company reduced to Rs. 2015.15 crores in 2005-06 from Rs. 2912.12
crores in 2004-05 to fund the capital expenditure and the vehicle financing operations
during the year.

The Financial Statement Analysis and Cost Reduction Program.
MBA Program 2005-2007 18
14) Net current Asset of the company increased to Rs. 2545.95 crores in 2005-06 from Rs.
545.36 crores in 2004-05. this increase is on account of vehicle financing loans and
advances increasing to Rs. 4582.80 crores in 2005-06 from Rs. 1583.80 crores in 2004-
05 and increase in inventories to Rs. 2012.24 crores in 2005-06.
15) The cash generated from operations before working capital changes and before
considering the development in the vehicle financing business was Rs. 2536.60 crores
as compared to the previous year figures of Rs. 2092.73 crores.
16) During the year under review, the company expanded its vehicle financing business
significantly with the merger of TATA Finance Limited, effective from 1st April 2005
and Rs. 1995.80 crores of Cash generated from operation was used in this business.

The Financial Statement Analysis and Cost Reduction Program.
MBA Program 2005-2007 19
Chapter - 3
Financial statement of analysis
3.1Trend analysis
3.2 Reason for loss in 2000-2001
3.3 Ratio analysis
3.4Theoretical part of Ratio Analysis
3.5 Meaning and Graphical Representations of Ratio

The Financial Statement Analysis and Cost Reduction Program.
MBA Program 2005-2007 20
Financial Statement Analyses
The term financial statements are used in business refers to two
statement the balance sheet or statement of financial position reflecting the assets,
liabilities, capital and reserve as on a particular date and income statement or profit and
loss statement showing the results achieved during a certain period which are prepared at
the end of accounting period for a business enterprises. Financial statement also called, as
financial reports are account balances arranged in effective and meaningful order so that
the facts and concepts they portray may be readily interpreted and used as bases for
decision by all who are interested in the affairs of business.
The purpose of preparing financial statement is to convey to owners,
creditors and the general public about the financial position of the enterprises. Financial
statement used by the management as the basis for decision making, planning operations
like procurement of adequate financial and as a means exercising control over financial
position of the business and efficient and profitable use of assets.
According to American institute of certified public Accounts the
financial statement have been declared to process the following nature: the financial
statements are prepared for the purpose of presenting a periodical reviews or report on the
progress by the managements and deal with the status of investment in the business and
results achieved during the period under review. They reflect a combination of recorded
facts; accounting conventions applied affect them materially.
THE USEFULNESS OF FINANCIAL STATEMENT
The usefulness statement is the business mirror, which reflect the
financial position and operating strength and weakness of the concern. These statements
are useful to management, investors, bankers, workers, and government and public at
large.
The major uses of financial statements are:
As a report of stewardship.
As a basis of fiscal policies.
As a basis of granting credit.

The Financial Statement Analysis and Cost Reduction Program.
MBA Program 2005-2007 21
As an information to prospective investors.
As a basis for price
As an aid government
As a basis for taxation.
USES AND OBJECTIVE OF FINANCIAL STATEMENT ANALYSIS
Financial Statement Analysis seeks to spotlight the significant facts
and relationship concerning managerial performance, corporate efficiency, financial
strength & weakness and credit worthiness of the company. With the help of the financial
analysis the manager can rationlise his decision and reach the business goal easily.
TOOLS AND TECHNIQUES OF FINANCIAL STATEMENT
ANALYSIS
The analysis of financial statement consists of a study of relationship
and trends to determine whether or not the financial position and results of operating as
well as the financial progress of the company are satisfactory or unsatisfactory. The
analysis of facts
And related data was important and a number of techniques of analysis are:
1) Comparative statement
2) Common size statement
3) Trend analysis
4) Fund flow analysis
5) Ratio analysis

The Financial Statement Analysis and Cost Reduction Program.
MBA Program 2005-2007 22
COMPARATIVE STATEMENT
Comparative financial statements are those statements, which have
been designed in a way to provide time perspective to the consideration of various
elements of financial position embodied in such a statements. This is done to make the
financial data more meaningful. The statements of two or more years are prepared to show
absolute data of more years, increase or decreases in absolute data and in terms of
percentages.
Advantages:
These statements have some advantages. They summarized as under.
a) Inter period and/or firm comparison, are very much facilitated by such comparative
statement.
b) These statements are highlights upon the trends in a number of accounting
variables relating to performance and financial position.
c) With the help of comparative statements weakness in the operating cycle, financial
health, etc can easily identify and suitable remedial steps may be taken.
COMMON SIZE STATEMENT
In the comparative financial statements it is difficult to comprehend
the changes over the years in the relation to total assets, total liabilities and capital or total
net sales. Because of this limitation, it is impossible to make comparison between two or
more firms of an industry. The reason is that there is no common base of comparison of
absolute figures. Hence in common base for comparison is provided common size income
statement.
A statement in which balance sheet items are expressed as the ratio
of each asset and the ratio of each liabilities are called common size balance sheet. The
common size income statement, which established relationship between sales and other
items in income statement, which established the relationship between sales and other
items in income statement and this relationship, is helpful in evaluation operational
activities of the enterprise.

The Financial Statement Analysis and Cost Reduction Program.
MBA Program 2005-2007 23
TREND ANALYSIS
Trend percentage is immensely helpful in making a comparative
study of the financial statements for several years. Trend in general term signifies a
tendency. In other words the reviews and appraisal of tendency in accounting variables are
nothing but trends analysis. Such an analysis of business facts is very significant from the
point of view of forecasting or budget. Analysis of the trend in business facts may be made
in by calculating the trend ratio or percentage or by plotting points on a graphs paper or
chart. Trend analysis is calculated only for some important items, which can be logically
connected with each other. Unless the figure is connected with each other figures they are
not as much meaningful.
For example, trend analysis for sales, though shows a clear-cut increasing or decreasing
tendency. Becomes meaningful in the real sense when it is compared.
The following Trend analyses of balance sheet and profit
and loss A/c
Trend analyses of profit and loss a/c
Profit and loss a/c 1999-2000
2000-01
2001-02
2002-03
2003-04
2004-05
INCOME SALE OF PRODUCT AND OTHER INCOME 100 91.08 99.49 121.1 173.51
230.37
LESS- EXICSE DUTY 100 86.88 93.41 117.25 152.65 205.98
EXPENDITURE
Mfg.& other Cost 100 91.48 97.62 95.39 135.11 182.68
Exps.TRANSFERRED TO CAPITAL A/C 100 49.57 63.83 69.05 63.94
124.64

The Financial Statement Analysis and Cost Reduction Program.
MBA Program 2005-2007 24
Trend analysis of balance sheet 1999-2000 to 2004-2005
YEAR 1999-2000
2000-2001
2001-2002.
2002--2003
2003-2004 2004-2005
SOURCES OF FUNDS 1.SHARE HOLDERS FUNDS (a) CAPITAL 100 100 124.97 124.71 139.44 141.37 (b) RESERVES & SURPLUS 100 85.69 61.32 65.09 92.52 107.18
SHARE HOLDERS FUNDS 100 86.67 65.66 69.18 95.72 109.51 2.LOAN FUNDS (a) SECURED 100 109.88 81.48 62.85 57.12 29.68 (b) UNSECURED 100 87.55 71.11 31.09 23.42 148.12
LOAN FUNDS 100 99.82 76.81 48.54 41.93 83.06
3.DEFERRED TAX LIBILITIES ( NET) 100 - - 105.3 514.15 565.28 3.TOTAL FUNDS EMPLOYED 100 92.51 70.61 61.56 79.41 106.12
APPLICATION OF FUNDS 4.FIXED ASSETS (a) GROSS BLOCK 100 104.01 106.43 108.11 110.42 121.98 (b) Less DEPRICIATION 100 114.35 133.01 148.25 165.39 188.94 (c) NET BLOCK 100 98.75 92.91 87.67 82.44 87.9 (d) CAPITAL WORK IN PROGRESS 100 70.5 35.86 40.04 73 137.49
100 95.97 87.3 82.99 81.51 92.78
5.INVESTMENT 100 115.52 99.09 99.6 254.57 242.52
6.DEFERRED TAX ASSET ( NET) 100 - 95 - - -
7.CURRENT ASSETS, LOAN AND ADVANCES (a) INTEREST ACCRUED ON INVESSTMENT 100 100 100 - - 6.12 (b)INVENTORIES 100 111.52 99.66 116.99 115.8 161.61 (C ) SUNDRY DEBTORS 100 84.99 90.6 106.58 69.28 91.61 (d) CASH AND BANK BALANCES 100 176.89 500.29 375.9 1180.46
91.4 (e) LOAN AND ADVANCES 100 73.09 59.05 62.28 107.48 3071.91
CURRENT ASSETS, LOAN AND ADVANCES 100 91.41 91.12 99.96 122.14 236.18
8.CURRENT LIABILITIES AND PROVISIONS (a) CURRENT LIABILITIES 100 123.18 128.92 158.71 213.38 276.55 (b) PROVISIONS 100 68.23 75.22 121.66 165.85 433.68
CURRENT LIABILITIES AND PROVISIONS 100 116.81 122.69 154.41 207.87 294.77
9.NET CURENT ASSETS 100 19.07 1.21 55.11 121.99 69.35
10. MISC. EXPENDITURE 100 113.3 - 11.63 2.81 2.3
11. TOTAL ASSETS 100 92.21 70.61 61.56 79.41 106.12

The Financial Statement Analysis and Cost Reduction Program.
MBA Program 2005-2007 25
REASON FOR LOSS
1. Decrease in sales: -
With the help of Trend Analyses, we come to know that the sales is decrease by
8.92% in the year 200-2001 (in the year 1999-2000) i.e. 100 %
( as base year) and it is 91.08% in year 2000-2001.
2. Increase in loan (secured loan): -
In the year 2000-2001 company took extra loan i.e.9.88% and
because of this they had to paid extras interest and hence loss increase
3. Increase in miscellaneous expenses: -
If we considered in 1999-2000 the miscellaneous expenses were
100%, the next year 2000-2001 was 113.30%.
For the help of trend analyses we can see that miscellaneous expenses also
increased by 13.30% it was another reason for losses.

The Financial Statement Analysis and Cost Reduction Program.
MBA Program 2005-2007 26
Ratio analysis
Introduction
The financial statement i.e. the income statement, the balance sheet. The
income statement, the statement of retained and the statement of changes in financial
position report what has actually happened to earnings during a specified period. The
balance sheet presents a summary of financial position of the company at a given point of
time. The statement of retained earnings reconciles income earned during the year and any
dividends distributed with the change in retained earnings between the start and end of the
financial year under study. The statement of changes in financial position provides a
summary of funds flow during the period of financial statement.
A ratio analysis is a very powerful analytical tool for measuring
performance of an organization. The ratio analyses concentrates on inter-relationship
among the figures appearing in the aforementioned four financial statements. The ratio
analysis helps the management to analyses the past performance of the firm and to make
further projection. Ratio analysis allows interested parties like shareholder, investors,
creditors, Government and analysts to make an evaluation of certain aspects of a firm s
performance.
Ratio analysis is a process of comparison of one figure against another,
which make a ratio and the appraisal of the ratios to make proper analyses about the
strength and weakness of the firms operations. The calculation of ratios is a relatively easy
and simple task but the proper analyses and interpretation of the ratios can be made only
by the skilled analyst. While interpreting the financial information, the analyst has to be
careful in limitations imposed by the accounting concepts and methods of valuation.
Information of non-financial nature will also be taken into consideration before a
meaningful analyses is made.
Ratio analysis is extremely helpful in providing valuable insight into a company s
financial picture. Ratios normally pinpoint a business strength and weakness in two ways:
Ratios provide an easy way to compare today performance with past
Ratios depict the areas in which a particular business is competitively advantaged
or disadvantages through comparing ratios to those of other business of the same
size within the same industry.

The Financial Statement Analysis and Cost Reduction Program.
MBA Program 2005-2007 27
CLASSIFICATION OF RATIOS
Ratio may be classified in a number of ways keeping in view the particular
purpose. Ratio indicating profitability is calculated on the basis of the profit and loss A/
C; those indicating financial are computed on the basis of balance sheet. To achieve
analysis effective understanding of the profitability and financial position of business, ratio
may be classified as:
A) LIQUIDITY RATIO:
The short-term liquidity ratio, which measures the liquidity of the firm and its
ability to meet it maturing short term obligations. Liquidity is defined as the ability to
realize value in money, the most liquid of assets. It refers to the ability to pay n cash, the
obligations that are due. Following are the main types of the liquidity ratio.
1) Current Ratio
2) Quick Ratio`
3) Net-Working Capital Ratio
B) LEVERAGE RATIO:
The long-term financial stability of the firm may be consider upon its ability to meet
all its liabilities, including those not currently payable. The ratios which are important in
measuring the long term solvency ratio are as follows:-
1) Total Debt to Equity Ratio
2) Debt to total Capital Ratio
3) Interest Coverage Ratio
C) PROFITABILITY RATIO:
The purpose of study and analysis of profitability ratios are to help assess the adequacy
of profits earned by the company and also to discover weather the Profitability is
increasing or declining. The profitability of the firm is the net result of a large number
of the policies and decisions. The profitability ratios show the combined effects of
liquidity, asset management and debt management on operating results. Profitability
ratios are measured with reference to sales, capital employed, total assets employed,
shareholders fund etc. The major profitability rates are as follows:-

The Financial Statement Analysis and Cost Reduction Program.
MBA Program 2005-2007 28
1) Ebit To Sales Ratio
2) Eat To Sales
3) Working Capital To Net Assets
4) Return On Capital
D) TURNOVER RATIO:
Activity ratio or turnover ratio measure how effectively the firm employs its resources.
These ratios are called turnover ratios which involve comparison between the level of
sales and investment in various accounts inventories, debtors, fixed assets, etc, activity
ratios are used to measure the speed with which various accounts are converted into sales
or cash. The following activity ratios are calculated for analysis.
1) Inventory Ratio
2) Fixed Assets Turnover Ratio
3) Fixed Assets Turnover Ratio
4) Debtors Turnover Ratio
5) Debtor Collection Period

The Financial Statement Analysis and Cost Reduction Program.
MBA Program 2005-2007 29
Meaning and Graphically Representation of Each Types of Ratio
1) Current ratio-:
This ratio measures the solvency of the company in the short term.
Current assets are those assets, which can be converted in to cash within a year. Current
liabilities and provision are those liabilities that are payable within a year. A current ratio
2:1 indicates a highly solvent position. Banks consider a current ratio 1.33:1 as the
minimum acceptable level for providing working capital finance. The constituents of the
current assets are as important as the current assets themselves for evaluation of a company
solvency position.
A very high current ratio will have adverse impact on the
profitability of the origination. A high current ratio may be due to the pilling up of
inventory, inefficiency in collection of debtors, high balances in cash and bank A/C. proper
investment. The formula of ratio is=
Current Assets loan & advances
Current liabilities & provision
Year Current Asset Current Liabilities Current Ratio
1999-2000 3025.61 2239.3 1.35 2000-2001 2765.8 2615.8 1.057 2001-2002 2757.13 2747.61 1.003 2002-2003 3024.54 3457.88 0.87 2003-2004 3695.7 4654.94 0.79
2004-2005 7146.19 6600.83 1.08 2005-2006 9661.31 7115.36 1.36

The Financial Statement Analysis and Cost Reduction Program.
MBA Program 2005-2007 30
1.35
1.057 1.0030.87
0.79
1.08
1.36
0
2000
4000
6000
8000
10000
12000
1999-2000
2000-2001
2001-2002
2002-2003
2003-2004
2004-2005
2005-2006
00.20.40.60.811.21.41.6
CURRENT ASSET CURRRNT LIABILITIES CURRENT RATIO
2. Quick Ratio & Liquid Ratio: - Quick ratio is used, as a measure of the company s ability to meet is
current obligation. Since BOD is secured by the inventories. The other current assets must
be sufficient to meet other current liabilities. A quick ratio of 1:1 indicates highly solvent
position. This ratio is also called acid test ratio. This ratio serves as a supplement to the
current ratio in analyzing liquidity. The formula of ratio is=
Current Assets - Inventories
Current liabilities BOD Year Current Asset-stock Current Liabilities Quick Ratio
1999-2000 3025.61 - 990.56 2239.30 0.90 2000-2001 2765.80 - 1105.10 2615.80 0.63 2001-2002 2757.13 - 987.51 2747.61 0.64 2002-2003 3024.54 - 1159.29 3457.88 0.53 2003-2004 3695.70 - 1147.44 4654.95 0.54 2004-2005 7146.19 - 1601.36 6600.83 0.84 2005-2006 9661.31-2012.24 7115.36 1.075

The Financial Statement Analysis and Cost Reduction Program.
MBA Program 2005-2007 31
0.91
0.63
0.64
0.54 0.55
9
0.84
1.07
5
0100020003000400050006000700080009000
1999-00
2000-01
2001-02
2002-03
2003-04
2004-05
2005-06
0
0.2
0.4
0.6
0.8
1
1.2
CURRET ASSETS CURENT LIABILITIES CURRENT RATIO
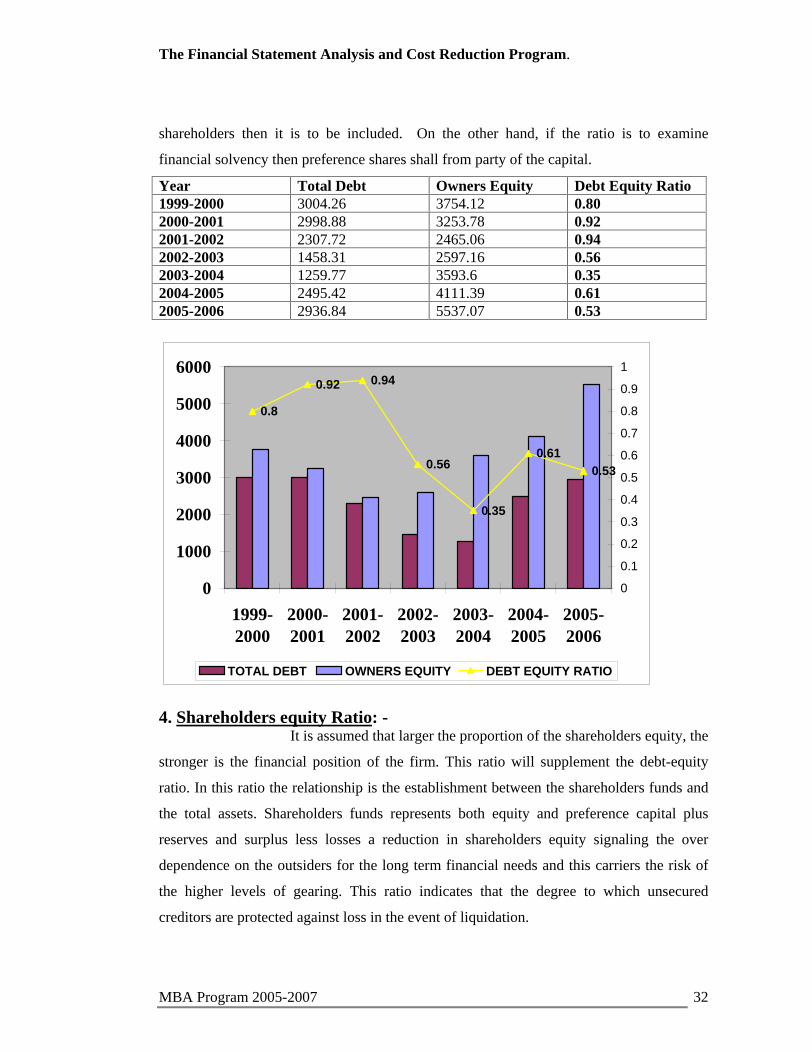
3. Debt Equity Ratios: - Capital is derived from two sources shares and loans. It is quite
likely for only shares to be issued when the company is formed but loans are invariably
raised at some later date. There are numerous reasons for issuing loan capital. The formula
of ratio is =
Long Term Debt
Shareholders funds
The ratio indicates the relationship between loan funds and net worth of the company,
which is known as gearing. If the proportion of debt to equity is low, a company is said to
be low geared, and vice versa. A debt equity ratio of 2:1 is the norm accepted by financial
institutions for financing of projects. Higher debt- equity ratio may be permitted for highly
capital intensive industries like petrochemicals, fertilizers, powers etc. the higher the
gearing, the more volatile the return to the shareholders.
A debt equity ratio, which shows a declines trend over the years, is
usually taken as a positive sign reflecting on increased cash accrual and debt and debt
repayment in act, one of the indicatory a unit turning sick is a risky debt equity ratio.
Usually when calculating ratio, the preference share capital is excluded from debt, but if
the ratio is show effect of use of fixed interest sources on earnings available to the
The Financial Statement Analysis and Cost Reduction Program.
MBA Program 2005-2007 32
shareholders then it is to be included. On the other hand, if the ratio is to examine
financial solvency then preference shares shall from party of the capital.
Year Total Debt Owners Equity Debt Equity Ratio 1999-2000 3004.26 3754.12 0.80 2000-2001 2998.88 3253.78 0.92 2001-2002 2307.72 2465.06 0.94 2002-2003 1458.31 2597.16 0.56 2003-2004 1259.77 3593.6 0.35 2004-2005 2495.42 4111.39 0.61 2005-2006 2936.84 5537.07 0.53
0.8
0.92 0.94
0.56
0.35
0.610.53
0
1000
2000
3000
4000
5000
6000
1999-2000
2000-2001
2001-2002
2002-2003
2003-2004
2004-2005
2005-2006
0
0.1
0.2
0.3
0.4
0.5
0.6
0.7
0.8
0.9
1
TOTAL DEBT OWNERS EQUITY DEBT EQUITY RATIO
4. Shareholders equity Ratio: - It is assumed that larger the proportion of the shareholders equity, the
stronger is the financial position of the firm. This ratio will supplement the debt-equity
ratio. In this ratio the relationship is the establishment between the shareholders funds and
the total assets. Shareholders funds represents both equity and preference capital plus
reserves and surplus less losses a reduction in shareholders equity signaling the over
dependence on the outsiders for the long term financial needs and this carriers the risk of
the higher levels of gearing. This ratio indicates that the degree to which unsecured
creditors are protected against loss in the event of liquidation.

The Financial Statement Analysis and Cost Reduction Program.
MBA Program 2005-2007 33
The formula of ratio is =
Shareholders equity
Total asset
Year Share Holders Equity
Total Assets (Tangible)
Share Holders Equity Ratio
1999-2000 3754.12 8210.5 0.45 2000-2001 3253.78 7976.58 0.40 2001-2002 2465.06 7425.39 0.33 2002-2003 2597.16 7527.1 0.34 2003-2004 3593.60 10000.27 0.35 2004-2005 411.39 13754.76 0.29 2005-2006 5537.07 16197.69 0.34
0.45
0.4
0.33 0.34 0.35
0.29
0.34
02000400060008000
1000012000140001600018000
1999-2000
2000-2001
2001-2002
2002-2003
2003-2004
2004-2005
2005-2006
0
0.05
0.1
0.15
0.2
0.25
0.3
0.35
0.4
0.45
0.5
SHARE HOLDERS EQUITY TOTAL ASSETS
SHARE HOLDERS EQUITY RATIO

The Financial Statement Analysis and Cost Reduction Program.
MBA Program 2005-2007 34
5) Interest coverage Ratio: - The interest coverage ratio shows how many times interest charges are covered by funds
that are available for payment of interest. An interest cover 2:1 is considered reasonable by
financial institution. A very high ratio indicates that the firm is conservative in using debt
and a very low ratio indicates excessive use of debt. The formula of ratio is=
Profit before interest depreciation & tax
Interest
The inventory turnover ratio measures hoe many times a company
inventory has been sold during the year. If the inventory turnover ratio has decreased from
past, it means that either inventory is growing or sales are dropping. In addition to that, if a
firm has a turnover that is slower than for its industry, then there may be obsolete goods on
hand, or inventory turnover has impact on the liquidity of the business.
Year Profit Before Int,Tax & Dep
Interest Interest Coverage Ratio
1999-2000 345.60 404.74 0.85 2000-2001 497.87 443.58 1.12 2001-2002 763.35 382.23 2.1 2002-2003 1157.45 278.95 4.14 2003-2004 1940.70 161.26 12.03 2004-2005 2337.18 154.15 15.16 2005-2006 2868.8 226.35 12.67
0.85 1.122.1
4.14
12.03
15.16
12.67
0
500
1000
1500
2000
2500
3000
3500
1999-2000
2000-2001
2001-2002
2002-2003
2003-2004
2004-2005
2005-2006
0
2
4
6
8
10
12
14
16
PROFIT BEFORE INT,TAX & DEPINTERESTINTEREST COVERAGE RATIO
The Financial Statement Analysis and Cost Reduction Program.
MBA Program 2005-2007 35
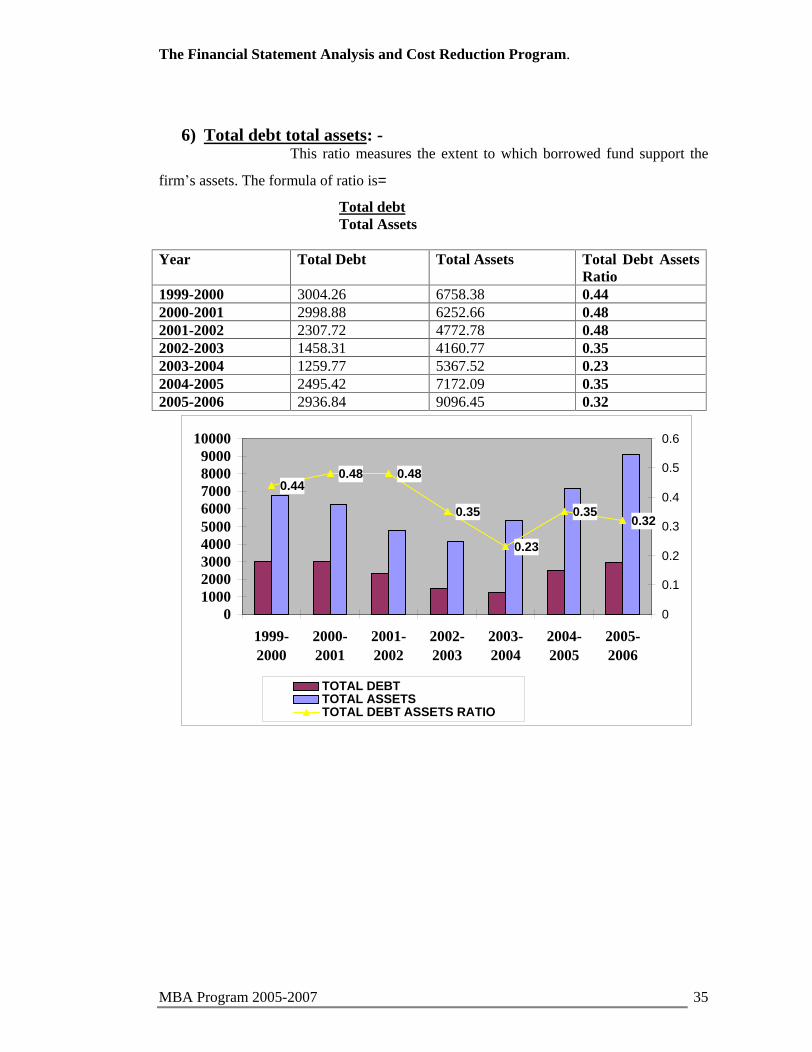
6) Total debt total assets: -
This ratio measures the extent to which borrowed fund support the
firm s assets. The formula of ratio is=
Total debt
Total Assets
Year Total Debt Total Assets Total Debt Assets Ratio
1999-2000 3004.26 6758.38 0.44 2000-2001 2998.88 6252.66 0.48 2001-2002 2307.72 4772.78 0.48 2002-2003 1458.31 4160.77 0.35 2003-2004 1259.77 5367.52 0.23 2004-2005 2495.42 7172.09 0.35 2005-2006 2936.84 9096.45 0.32
0.440.48 0.48
0.35
0.23
0.350.32
0100020003000400050006000700080009000
10000
1999-2000
2000-2001
2001-2002
2002-2003
2003-2004
2004-2005
2005-2006
0
0.1
0.2
0.3
0.4
0.5
0.6
TOTAL DEBTTOTAL ASSETSTOTAL DEBT ASSETS RATIO

The Financial Statement Analysis and Cost Reduction Program.
MBA Program 2005-2007 36
7) EBIT to Sales: -
The ratio is designed to focus attention on the profit margin arising
from business operations before interest and is deducted. The convention is to express
profit after tax and interest as a percentage of sales.
This ratio reflects net profit margin on the total sales after deducting
all expenses but before deducting interest and taxation. This ratio measures the efficiency
of operation of the company. The net profit is arrived at from gross profit after deducting
administration, selling and distribution expenses. The non operating incomes and expenses
are ignored in computation of net profit before tax, depreciation and interest. The formula
of ratio is=
Net profit before interest and tax
100 Sales
Year EBIT Sales EBIt To Sales 1999-2000 345.60 7475.8 4% 2000-2001 497.87 6871.98 7.24% 2001-2002 763.35 7528.77 10.14% 2002-2003 1157.45 9111.26 12.70% 2003-2004 1940.70 13282.12 14.6% 2004-2005 2337.18 17585.22 13.29% 2005-2006 2868.8 20891.31 13.73%
4%
7.24%
10.14%
12.70%14.60%
13.29%13.73%
0
5000
10000
15000
20000
25000
1999-2000
2000-2001
2001-2002
2002-2003
2003-2004
2004-2005
2005-2006
0%
2%
4%
6%
8%
10%
12%
14%
16%
EBIT SALES EBIT TO SALES

The Financial Statement Analysis and Cost Reduction Program.
MBA Program 2005-2007 37
7) Working capital to net Sales: This ratio calculated by the following way
= Working capital
Sales
Year Working Capital Net Sales Net Working Capital Ratio
1999-2000 786.31 7475.8 0.10 2000-2001 150 8164.22 0.01 2001-2002 9.52 7528.77 0.001 2002-2003 433.34 9111.26 0.04 2003-2004 959.24 13282.12 0.07 2004-2005 545.36 17585.22 0.03 2005-2006 2545.95 20891.31 0.12
0.1
0.010.001
0.04
0.07
0.03
0.12
0
5000
10000
15000
20000
25000
1999-2000
2000-2001
2001-2002
2002-2003
2003-2004
2004-2005
2005-2006
0
0.02
0.04
0.06
0.08
0.1
0.12
0.14
WORKING CAPITAL NET SALES NET WORKING CAPITAL RATIO
9) Return on capital employed: -
The strategic aim of business enterprises is to earn a return on
capital. If any particular case, the return in the long run is not satisfactory, then the
deficiency should be corrected or the activity be abandoned for a more favorable one. The
rate of return on investment is determined by dividing net profit or income by the capital
employed or investment made to achieve that profit.
ROCE consists of two components i.e.
I) Profit margin. II) Investment turnover.

The Financial Statement Analysis and Cost Reduction Program.
MBA Program 2005-2007 38
It will be seen from the following formula that ROCE can be improved by
increasing one or both of its components i.e. the profit margin and the investment
turnover in any of the following ways:
- Increasing the profit margin
- Increasing the investment turnover
- Increasing both profit margin and investment turnover.
Return on investment analyses provides a strong incentive for optimal utilisation of the
assets of the company. This encourages managers to obtain assets that will provide a
satisfactory return on investment. The formula of ratio is=
Earning after Tax
Total funds employed Year EAT Total Funds
Employed Return On Capital Employed
1999-2000 71.20 6758.38 0.010 2000-2001 -500.34 6252.66 -0.08 2001-2002 -53.73 4772.78 -0.01 2002-2003 300.11 4160.77 0.072 2003-2004 810.34 5367.52 0.15 2004-2005 1236.95 7172.09 0.17 2005-2006 1528.88 9096.45 0.16
0.01
-0.08
-0.01
0.072
0.150.17 0.16
-2000
0
2000
4000
6000
8000
10000
1999-2000
2000-2001
2001-2002
2002-2003
2003-2004
2004-2005
2005-2006
-0.1
-0.05
0
0.05
0.1
0.15
0.2
EAT TOTAL FUNDS EMPLOYEDRETURN ON CAPITAL EMPLOYED

The Financial Statement Analysis and Cost Reduction Program.
MBA Program 2005-2007 39
10) EAT TO SALES:
This ratio shows the earning left for shareholders (both equity and
preference) as a percentage of net sales. It measures the overall efficiency of production,
administration, selling, financing, pricing and tax management. Jointly considered, EBIT
& EAT Ratio provide a valuable understanding of the cost and profit structure of the firm
and enable analyst to identify the source of business efficiency / inefficiency. The formula
of ratio is=
EARNIG AFTER TAX
NET SALES
Year EAT Net Sales
EAT To Sales Ratio
1999-2000 71.2. 7475.8 0.95
2000-2001 -500.34 6871.98 -7.28
2001-2002 -53.73 7528.77 -0.71
2002-2003 300.11 9111.26 3.29
2003-2004 810.34 13282.12 6.10
2004-2005 1236.95 17585.22 7.03
2005-2006 1528.88 20891.31 7.32
0.95
-7.28
-0.71
3.29
6.17.03 7.32
-5000
0
5000
10000
15000
20000
25000
1999-2000
2000-2001
2001-2002
2002-2003
2003-2004
2004-2005
2005-2006
-10
-8
-6
-4
-2
0
2
4
6
8
10
EAT NET SALES EAT TO SALES RATIO

The Financial Statement Analysis and Cost Reduction Program.
MBA Program 2005-2007 40
10) Inventory Turnover ratio:
Inventory turnover ratio measures how many times the companies
inventory has been sold. A considerable amount of a company capital may be tied up in the
financing of raw materials, work-in-progress and finished goods. It is important to ensure
that the level of stock is kept as low as possible, consistent with the need to fulfill
customers order in time. The formula of ratio is= Sales
Average Inventory
Year Sales Average Inventories
Inventories Turnover Ratio
1999-2000 7475.8 957.17 7.81
2000-2001 6871.98 1047.98 6.56
2001-2002 7528.77 1046.30 7.20
2002-2003 9111.26 1073.40 8.49
2003-2004 13282.12 1153.36 11.52
2004-2005 17585.22 1374.4 12.79
2005-2006 20891.31 1806.80 11.56
7.816.56 7.2
8.49
11.5212.79
11.56
0
5000
10000
15000
20000
25000
1999-2000
2000-2001
2001-2002
2002-2003
2003-2004
2004-2005
2005-2006
0
2
4
6
8
10
12
14
SALES
AVERAGE INVENTORI

The Financial Statement Analysis and Cost Reduction Program.
MBA Program 2005-2007 41
12) Fixed assets turnover ratio:-
This ratio will be analyses further with ratios for each main category
of assets. This is a difficult set of ratios to interpret as asset values are based on historic
cost .An increase in the fixed figure may result from the replacement of an asset at
increased price or the purchase of an additional asset intended to increases production
capacity. The ratio of the accumulated depreciation provision to the total of fixed asset at
cost might be used as an indicator of the average age of the assets; particularly when
depreciation rates are noted in the accounts. The formula of ratio is=
Sales
Average Fixed Assets Year Sales Fixed Assets Fixed Assets To
Turnover Ratio 1999-2000 7475.8 3984.15 1.87 2000-2001 6871.98 3823.60 1.79 2001-2002 7528.77 3478.34 2.16 2002-2003 9111.26 3306.58 2.75 2003-2004 13282.12 3247.80 4.08 2004-2005 17585.22 3696.51 2.45 2005-2006 20891.31 4521.23 4.62
1.87 1.792.16
2.75
4.08
2.45
4.62
0
5000
10000
15000
20000
25000
1999-2000
2000-2001
2001-2002
2002-2003
2003-2004
2004-2005
2005-2006
00.511.522.533.544.55
SALES FIXED ASSETS FIXED ASSETS TO TURNOVER RATIO

The Financial Statement Analysis and Cost Reduction Program.
MBA Program 2005-2007 42
13) Total assets turnover ratio: -
This ratio indicates the number of times total assets are being turned over in a year. The
formula of ratio is= Sales
Average Total Assets
The higher the ratio indicates overtrading of total assets while a low ratio indicates idle
capacity.
Year Sales total asset total assets turnover ratio
1999-2000 7475.8 6982.28 1.07 2000-2001 6871.98 6505.52 1.06 2001-2002 7528.77 5512.72 1.37 2002-2003 9111.26 4466.775 2.04 2003-2004 13282.12 4764.145 2.79 2004-2005 17585.22 6269.805 2.80 2005-2006 20891.31 8134.27 2.57
1.07 1.06
1.37
2.04
2.79 2.82.57
0
5000
10000
15000
20000
25000
1999-2000
2000-2001
2001-2002
2002-2003
2003-2004
2004-2005
2005-2006
0
0.5
1
1.5
2
2.5
3
SALES TOTAL ASSET TOTAL ASSETE TURNOVER RATIO

The Financial Statement Analysis and Cost Reduction Program.
MBA Program 2005-2007 43
14) Debtor turnover ratio: -
Debtor turnover, which measures whether the amount of resources
tied up in debtors, is reasonable and whether the company has been efficient in converting
debtors into cash. The formula is; = sales
Avg. Debtors
Year Credit Sales Avg, Debtors Debtor Turnover Ratio
1999-2000 7475.8 1220.615 6.12
2000-2001 8164.22 821.055 8.37
2001-2002 7528.77 779.345 9.66
2002-2003 9111.260 875.165 10.41
2003-2004 13282.12 780.545 17.02
2004-2005 17585.22 713.155 24.66
2005-2006 20891.31 1527.1 13.68
6.128.37
9.66 10.41
17.02
24.66
13.68
0
5000
10000
15000
20000
25000
1999-2000
2000-2001
2001-2002
2002-2003
2003-2004
2004-2005
2005-2006
0
5
10
15
20
25
30
CREDIT SALES AVG DEBTORS DEBTOR TURNOVER RATIO
The Financial Statement Analysis and Cost Reduction Program.
MBA Program 2005-2007 44
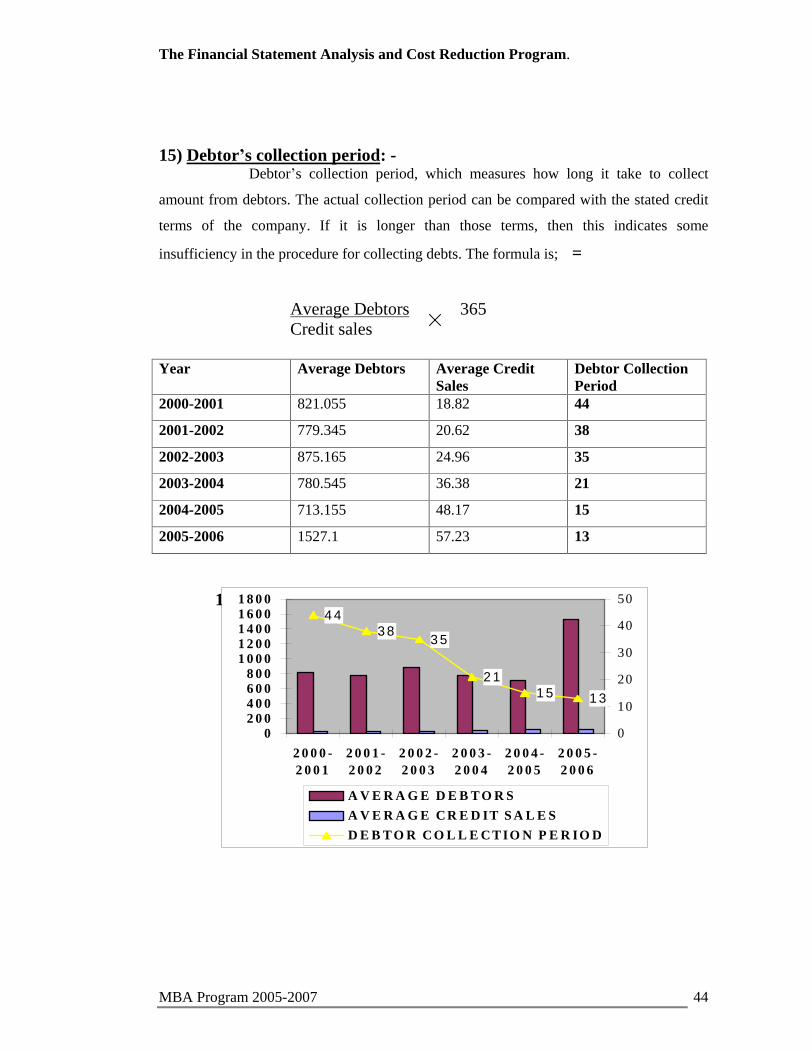
15) Debtor s collection period: -
Debtor s collection period, which measures how long it take to collect
amount from debtors. The actual collection period can be compared with the stated credit
terms of the company. If it is longer than those terms, then this indicates some
insufficiency in the procedure for collecting debts. The formula is; =
Average Debtors
365 Credit sales
Year Average Debtors Average Credit Sales
Debtor Collection Period
2000-2001 821.055 18.82 44
2001-2002 779.345 20.62 38
2002-2003 875.165 24.96 35
2003-2004 780.545 36.38 21
2004-2005 713.155 48.17 15
2005-2006 1527.1 57.23 13
1.1.1.1 4 4
3 83 5
2 11 5 1 3
02 0 04 0 06 0 08 0 0
1 0 0 01 2 0 01 4 0 01 6 0 01 8 0 0
2 0 0 0 -2 0 0 1
2 0 0 1 -2 0 0 2
2 0 0 2 -2 0 0 3
2 0 0 3 -2 0 0 4
2 0 0 4 -2 0 0 5
2 0 0 5 -2 0 0 6
0
10
20
30
40
50
A V E R A G E D E B T O R S
A V E R A G E C R E D IT S A L E S
D E B T O R C O L L E C T IO N P E R IO D

The Financial Statement Analysis and Cost Reduction Program.
MBA Program 2005-2007 45
Chapter- 5
1) Cost reduction program - theoretical part
2) Cost Reduction Programme of Tata Motors.

The Financial Statement Analysis and Cost Reduction Program.
MBA Program 2005-2007 46
Cost Reduction process
The achievement of real and permanent reduction in the unit cost of goods
manufactured or services rendered without impairing their suitability for the use intended.
Reduction in the cost of product must be brought about by the elimination of wasteful and
resources employed in its design, manufacture, sale and distribution. Reduction in quality
of a product or the range of its uses cannot be regarded as fitting cost reduction.
Cost reduction must be an attitude of mind throughout the organization. it must be
organised and controlled by a senior manager, with a team of skilled people able to analyse
and record business activity and find ways improves the methods used. So that costs are
reduced and output increased. Cost reduction process contains the following sequences of
steps-:
Analyses:
Every activity, whether in the office, factory, or warehouse, can be analysed and in
to number of separate steps. This is done by asking questions and gathering and recording
answers given. From this process of data collection, it is possible to draw a picture of the
activity that enables it to be examined and improvements developed.
Examination:
Each activity is now examined in some detail to established whether it is
a) Vital
b) Secondary
c) Unnecessary
Vital activities are those, which directly lead to achieving the objective previously
established. They become fundamental to subsequent improvement.
Secondary activities do not contributed directly to achieve the objective but necessary
to support and serve that vital activity.
The reminder of the activities concerned is almost always necessary. As they neither
contributes directly nor indirectly in achieving objective and they can not be considered
necessary.
When activities or components have been examined. It is possible to consider whether
they should be:

The Financial Statement Analysis and Cost Reduction Program.
MBA Program 2005-2007 47
a) Eliminated
b) Combined
c) Simplified.
Elimination of activities and components, the most ambitious and most problematic
step. The greatest saving often arises from elimination of unnecessary activities and
components, and this should always be the first line of attack in spite of the problem
included. Combining activities is one way of making savings in areas where the activity be
eliminated. Considerable improvements can be achieved by combining activities.
Developing solution:
Detailed analyses and examination should lead to the development of
a number of possible solutions. No solution should be overlooked or ignored because it
does not seem practical. The evaluation of a solution will depend upon the knowledge of
the analyst. The evaluation process matches each solution against the following
requirements:
Does it achieve the objectives in full?
Is it practical?
Does it fall within the constraints, if any, such as finance, time, physical
resources, human resources etc?
Is it a better way of doing the job?
Does it reduce cost, if so, by hoe much?
Will be acceptable to customer, employees and management?
Will it stand the test of time?
Selecting a solution:
The choice between several solutions will depend on numerous factors including company
policies, personal preferences, aesthetic appeal, and other subjective criteria. This is stage
where the analyst has to make sure that everyone fully understands the advantages and
disadvantages of various solutions so that a rational choice can be made.
Obtaining agreement:
In the evaluation stage, one of the questions asked was; will be acceptable to customers,
employees and management?
The answer to this must have been yes; otherwise the
solution would not have passed the evaluation test. This means that final agreement to the
selected solution has to be obtained by the analyst.
The Financial Statement Analysis and Cost Reduction Program.
MBA Program 2005-2007 48
Cost Reduction Programme of
Tata Motors The major cost reduction ideas implemented in all parts of the TATA Motors. Listed below
are some cost reduction approaches commonly deployed.
Nature of cost
A) Direct material cost-
Product related
Tear- Down
Zero based costing
Value engineering
Process related
Supplier cost reduction programs
e- Procurement
Supplier base rationalization
Volume negotiations
B) Variable conversion cost
Power consumption
Fuel consumption
Indirect material consumption
Tools consumptions
C) Fixed cost
Working capital reduction
Converting fixed cost to variable cost
Productivity improvement
Other methods

The Financial Statement Analysis and Cost Reduction Program.
MBA Program 2005-2007 49
D) Other approaches (impacting all / most of the above areas)
Process improvement
Complexity management/ variety reduction
Waste elimination- use of Kaizen principles
Interest cost reduction.
A) Direct material cost reduction
a.Product related approaches: -
i) Tear-Down
The tear down approach is undertaken to facilitate structured analyses of all components
on the vehicle by involving from diverse backgrounds to question existing assumption
(design/ non-design) and further generate ideas
It is basically involves tearing down of a vehicle or aggregate of a competitor, in
order to identify special features/ attributes of each system / aggregate/ component as
compared to TATA Motors vehicles. The basic purpose of this process is to identify areas
of cost reductions in tata motors designs and process. Ideally it should be done at the
design stage, however, as an on going process it can be done on established vehicles also.
Methodology of teardown
Identify/ study competitors on (information from the annual report etc.)
Financial and cost parameters
Sales volume and revenue
Investment
Make or buy
Technology
Conduct static tear-down collect information on
Total number of parts
Total weight
Units
Part details (length, thickness, weight, weld spots, validity etc)
Number of fixing parts.

The Financial Statement Analysis and Cost Reduction Program.
MBA Program 2005-2007 50
Conduct dynamic teardown collect data on
Manufacturing method
Number of process
Man hours
Assembling
Process parameters
Benefits for using the teardown method
Cost reduction
Information and awareness on latest trends
Supports make Vs Buy decision making
Reduction in development lead-time, process time etc.
B) Zero based costing
The following steps are used for conducting zero based costing
Priorities components groups / sub aggregates for ZBC.
Dismantle the selected aggregates/ sub assembly.
Weight the components.
Arrive at the input weight based on the finished weight and analysis of the
manufacturing process for that component.
Calculate the material cost by multiplying the weight the weighted average cost.
Add to this, the conversion cost for that material group (e.g. machined components,
casting, forging, rubber, plastic etc.)
Add to this the intellectual cost, if any e.g. design and development of component/
tooling by the supplier.
Compare this total cost with the price offered by the supplier.
Identified potential and build case for discussion with suppliers for cost reduction.
Renegotiate for price reduction
Discuss with supplier to jointly work towards achieving potential identified

The Financial Statement Analysis and Cost Reduction Program.
MBA Program 2005-2007 51
C) Value engineering:
Value engineering is a methodology, which can be applied for value improvement
in any area. It is an approach, which analyses all the functions of a product or service and
the related costs involved . based on this analysis, several alternatives are identified, which
can perform the same functions, while reducing the cost the product or service.
Value engineering methodology consists of following steps
1. Orientation phase
Select Projects to be handled by VE team
Appoint The team
2 Information phase
Locate Data from different sources
Identify Facts
Assimilate Facts in the required form
3. Functional analysis phase
List The component of the hardware
Prepare verb- noun description of the function for each
Assembly and component
Established Cost of basic functions
Estimate Worth of each basic function
Determine Value improvement potential
4 Creative phase
Conduct Creative problem solving session
Generate ideas, combine and rearrange them to provide
Ways to accomplish basic function
5 Evaluation phase
Decide Criteria
Evaluate Ideas according to the pre-fix criteria
6 Development phase
Develop New components/ assemblies for acceptance of ideas.
Arrange Trials/ test runs

The Financial Statement Analysis and Cost Reduction Program.
MBA Program 2005-2007 52
7 Recommendation phase
Present To the management for approval
8 Implementation phase
Implement Change in production
9 Follow up & audit phase
Resolve Problems identified during implementation.
Problem reported from the field, if any, to establish the
change into a smooth flow up to the customer.
Audit Savings and compare results with original
Report Actual value improvement to the management.
Following are some projects implemented by value engineering teams.
1) Fan drive arrangement-
This project was successfully implemented by the engine team, which resulted in
optimizing the fan drive arrangement. In this particular case, two separate belt drives were
combined into one. In addition to a saving of Rs 2000, benefits of productivity
improvement, variety reduction and standerdisation were also achieved.
2) Air filter assembly-
Air filter assembly on a vehicle consisted of a hose and hose clip assembled on the inlet of
air filter. The VE team proposed to integrate these in to one assembly. A sheet metal tube
replaced the hose and it was made an integral of the air filter.
b) Process related approaches:
IV.Supplier cost reduction programmes-
Direct material cost reduction achieved by obtaining price reductions from suppliers
without reduction in either fixed or variable cost at suppliers end will result in:
Reduction in bought- out for company
Reduction in profit margin for the suppliers
Increase in break-even volumes for the suppliers

The Financial Statement Analysis and Cost Reduction Program.
MBA Program 2005-2007 53
The key characteristics of the supplier cost reduction programmes are as follows:
Target driven
Clearly defined targets
Targets for suppliers as well as internal targets
Targets in terms of number of proposal or ideas, savings achieved etc,
Partnership approach
High involvement of supplier in generation of ideas for cost reduction
High involvement from company side in providing assistance to suppliers to
achieve cost reduction.
Benefits to both supplier and TATA Motors
Win-Win situation
Sharing of gains achieved through cost reduction
Reward to suppliers
Supplier margins protected and or improved
II. e- procurement-
e- procurement is internet based interactive platform for procuring any type of
goods or services through the medium of reverse auction. The e- procurement tool brings
tremendous benefits to the procurement process in terms of reduced cycle time, greater
efficiency and transparency.
e- procurement allows a buyer to invite any supplier across the world to a reverse
bidding auction, the sole requirement being access to the internet. Reverse binding auction
are open for a defined and limited period of time, with market price feedback available to
participating suppliers. Bidding times can be extended automatically to allow for frenetic
bidding activity towards the close of the auction. the system allows the highest degree of
fairness to all the participants.
e- procurement process has the following steps
Identifying aggregate component or raw material for the auction.

The Financial Statement Analysis and Cost Reduction Program.
MBA Program 2005-2007 54
Pre-auction preparations
new supplier identification (if required), sending
drawings to invited vendors concerned and resolving queries.
Plan for auction fix date and time.
Finalising and floating request for questions.
Manual round for quotations.
Conduct event.
Finalise post bid allocation and raise purchase orders.
Approval and development of new suppliers, if required.
Tata motors tied up with a consulting firm, for conducting
e- procurement through two streams i.e. full source and quick source.
Under full source, Tata Motors have access to the full range of consulting services
including event management and market making.
Under quick source projects are managed end to end by our and involve relatively
lower degree of purchase complexity.
Using this process Tata Motors has procured several products such as tyres, bearings,
castings or forgings, leaf springs, eat belts and services such as transportation.
III. Supplier base rationalization-
Supplier base rationalization consist of the following steps:
1. Categorisation of material group-
Categorisation of each part in the material category in to sub- categories based on
type and manufacturing process.
2. Removal of tail of supplier base:
Elimination of non performing or low business value suppliers, supplying few
numbers of parts.
3. Masop elimination-
Elimination of Masop and identification of potential bought out suppliers.
4. Tearing of suppliers/ of loading assemblies:
Identification of sub- assemblies and aggregates to be outsourced from a tier 1
supplier.
5. Supplier base consolidation-
Elimination of small direct suppliers arising from outsourcing of sub- assemblies.

The Financial Statement Analysis and Cost Reduction Program.
MBA Program 2005-2007 55
6. Removal of multi sourcing-
Reduction in part- supplier combinations by moving to dual sourcing.
Process of Tail removal
Identify and priorities suppliers in Tail for deletion
Identify c class supplier supplying. e.g. last 1 for 2% of purchase value.
Priorities the suppliers for elimination based on value of business and number of
parts supplied to ensure ease of capability/ capacity transfer.
Suppliers with low value of business and low number of parts to be considered first
for elimination.
Identify potential alternative sources to which the business of the suppliers to be
deleted can be transferred.
IV. Volume negotiations:
Though the approach appears to be useful only to the materials department, all of
Tata Motors should be alert to the possibilities of negotiating a better price with existing or
alternative suppliers as soon the opportunity presents itself.
Some essential of a Good negotiation are:
Check out price and quality of the material at some other sources company must
have good knowledge of what is available from where.
Based on the suppliers capacity, capability and past performance, offer him more
share of business for a reduction in price.
The analysis of zero based costing and product, aggregate benchmarking should be
used to negotiate a reduced price.

The Financial Statement Analysis and Cost Reduction Program.
MBA Program 2005-2007 56
B) Variable conversion cost reduction-
I. Power Consumption-
In Tata Motors, there are many methods by which power consumption can be controlled
in plants and offices. One may take help of a third party, to find out areas of energy losses.
Examples of power consumption-
Electricity at unity power factor drawn from electricity boards.
Optimization of capacities of various equipment through innovation.
Use of furnascote special paint for heat treatment furnace.
Use of timer control for machines and utilities to reduce idling losses.
Purchase of wind power electricity from third party.
Optimization of chilling plants and air conditioning plants in paint shops.
Modification of pneumatic lines to reduce load on centralised air compressors.
II.Fuel consumption-
Examples of fuel consumption
Use of light diesel oil (LDO) instead of certifigured LDO in paint shops.
Modification of surface oven air heater to reduce hot air leakage or losses.
Fine tuning of oven burners to increase efficiency of combustion.
Installation of high temperature resistant sensors for operation of oven doors in
automatic mode.
III.Indirect material consumption-
Examples of Indirect material consumption
Use of belt type oil skimmer units to enhance life of coolant.
Exploring of reverse auctioning opportunities for the purchase of consumables
IV. Tools consumption-
Examples of reduction in direct material consumption in Tata Motors plants are
given as below:
Use of carbide indexable tips in place of brazed carbide tools for stub axle gap
milling to eliminate breakage.

The Financial Statement Analysis and Cost Reduction Program.
MBA Program 2005-2007 57
Use of solid carbide drills in place of brazed carbide drills for front Axle beam to
enhance tool life.
C) Fixed cost Reduction-
I. Working capital reduction-
The investment in working capital is influenced by four key events in the
production and sales cycle:
Purchase of raw of material.
Payment of raw material.
Sales of finished goods.
Collection of cash for sales.
Tata Motors begin with the purchase of raw material or bought out, which is paid for after
a certain time frame. This material is converted into finished goods and then sold to the
customer. Customer pay their bills some time after the sales. The cycle completes with
payment made by the customer for the goods.
The faster the cycle is completed, faster are profits generated. Thus, main purpose
of working capital reduction is to have shorter inventory and receivable periods.
Example of How to reduce inventory in Tata Motors -
Standardising the stocking norms at factories for all items.
Undertaking kaizen events, which includes one piece of floe, layout changes, two
bin system.
Salving non-moving or slow moving inventory.
Established a central receipt and documentation office (CRDO)
Just in time delivers to line.
II. Converting fixed cost to variable cost:
In the Tata Motors, company utilized the surplus capacity (fixed cost) available in
company shops, without detracting from the main responsibility of producing vehicles and
in the process, converted some of the fixed costs into variable nature. In fact, these
products from an important part of the non-vehicle business,
The Financial Statement Analysis and Cost Reduction Program.
MBA Program 2005-2007 58
Some examples are given below-
In addition to vehicle engines, Tata Motors engine shops also manufacture engines
for industrial applications.
Divisions like production engineering, forge and foundry manufacture products for
external customers, to utilize their capacities.
IV. Productivity improvement:
In TATA Motors the manpower cost is generally at number two , only after material cost.
Tata motors looking at productivity of both direct as well as indirect men..
Direct men-
Direct men are those who are responsible for changing the shape of the part or
assembly. thus, members of the company who are working on machines, assemblies may
be group in direct men category.
Example
if in every production cycle the machine operator is required to wait for the
previous operation to complete, the company will be forced idleness because of which
company costs will go up. In such case company find ways to eliminate idleness.
Similarly if the supervisor asks operators to produce parts irrespective whether required by
the next machine or not, will result in increased inventories and thus additional costs.
TATA Motors nave been deploying Kaizen methodology to improve productivity on the
shop floor and have achieved results.
The kaizen methodology employs a cross functional approach to observe
wastage or Non-value adding activities in the men machine environment. at the end of
two week productivity improvements, reduction in the defects, and inventories reduction of
the order of 30 to 40% are achieved.
IV. Other method-
a) Welfare:
Restructuring of reimbursement scheme for medical expenses on hospitalisation.
Reduction in canteen expenses.
b) Rent, rate and Taxes:
Re- validation of regional offices and stockyards.

The Financial Statement Analysis and Cost Reduction Program.
MBA Program 2005-2007 59
Discussion with competent authorities to pay optimum property tax.
c) Repairs:
Control on civil and electrical repairs.
d) Work operation and others:
Reviewed annual contracts of hardware maintenance and software contracts, work
contracts for scope of work and terms operation.
Reduction in travel expenses through optimizing guesthouse, rationalization of
employee stay in hotels and travel discounts etc.
Reduction in communication expenses through bulk discount from telephone
companies and mobile service center.
Reduction also available from courier companies.
D) Other approach
I. Process improvement-
It is one of the most scientific and satisfying methods of cost reduction. it involves the
redesigning of all the processes, by eliminating non value adding activities and work flow
simplification, thus reducing cycle time and increasing manpower productivity.
Some processes which involve disproportionate manpower and paperwork are:
Ordering material and incoming inspection.
Procedures for payment to supplier or contractors.
Delivery, invoicing and receivables collection for product sold.
Stock control and perpetual inventory methods.
Production scheduling.
II. Complexity management/ variety reduction-
TATA Motors have added many varieties to the original list of models. this addition of
varieties adds cost to the product or inventory and also occupies large space on the shop
floor. This also crates confusion while assembling the products and maintaining the Bill of
Materials.

The Financial Statement Analysis and Cost Reduction Program.
MBA Program 2005-2007 60
The main purpose of complexity management is the elimination of variants that do not
generate a net positive income or do not have any strategic purpose
III. Waste elimination-
Use of kaizen principles-
Present capacity = Work (value adding)+ Waste (Non value adding)
Value adding means performing work the customers are willing to pay. Customers
are willing to pay for only those activities that transform materials or information to
meet their demands and expectations.
Wastes are those activities that take time, resources, or occupy space but do not
add the value of the product. Waste leads to adding costs, but not adding value.
Kaizen identifies six categories of waste:
1) Over production
2) Inventories
3) Defective product, scrap, repair, rework,
4) Time wasted in process.
5) Unnecessary motion and movements.
6) Wastages during processing and transportation.
IV Interest cost reduction:
The following approaches used to reduce the interest burden by TATA Motors
1) Restruring or pre- payment of costly debt.
2) Reduction in borrowing.
3) Divestment of non- core investment.
4) Reduction in net working capital.
5) Reduction in capital employed.

The Financial Statement Analysis and Cost Reduction Program.
MBA Program 2005-2007 61
FINDING
This study has been taken up with main intention of analyzing the profitability and
financial soundness of TML. The finding is results of analyzing the data of five years with
respect to the financial position operational efficiency and profitability of the company.
The brief description of the finding of the study is given below:
1) Regarding financial Position
A) Current Ratio: The Current Ratio measures the solvency of the firm in short term.
The current Ratio is not constant and changing each year. The current Ratio for F.Y. 2005-
06 has increased to 1.36: 1. It indicate increasing trend on liquidity. This is due to
increase on account of vehicle financing business and advances increasing to Rs. 4582.80
from Rs. 1583.80 in 2004-05.
Internationally, the general norm for ideal current ratio is 2: 1. But in India, the
1.33: 1 is mostly accepted. So, the Current Ratio for F.Y. 2005-06 is sufficient to support
the current liabilities.
B) Quick Ratio: Quick Ratio is used to the company s ability to meet its current
obligation. It has decreased to 0.63 in 200-01 from 0.91 in 1999-00. But It has shown
upward movement from the F.Y. 2002-03 to F.Y. 2005-06. It has reached to 1.075 in the
F.Y. 2005-06.
The general norm for Ideal Liquid Ratio is 1:1. As TML has shown the Quick Ratio of
1.075, it is indicating highly solvent position. In other words, it is indicating the
availability of sufficient Quick assets to manage the current liabilities. It is also cleared that
there is no over stocking of materials. The major part of working capital is blocked in
material, goods.

The Financial Statement Analysis and Cost Reduction Program.
MBA Program 2005-2007 62
2) Regarding Capital Structure or leverage:
A) The Debt- Equity Ratio is showing decreasing trend from 0.94 in FY 2000-01 to
0.35 in FY 2003-04. then it rises to 0.61 in FY 2004-05 and once again decreased to 0.53
in FY 2005-06.The Debt to Equity Ratio shows that for Every Rs. 1 /- of shareholders
funds in 2005-06, there is Rupee 0.53 of Debt. In general, lower the Debt Equity Ratio,
then the higher degree of protection enjoyed by creditors. As company was recovering
from heavy loss of Rs. 500/- crores in FY 2000-01, it finds itself in safe position while
implementing the Cost Reduction measures It is to be noted that Debt Equity Ratio should
be low in those company where demand is volatile and profit is subject of fluctuation.
B) Debt to Asset Ratio is satisfactory. It has decreased from 0.48 in FY 2000-01 to
0.32 FY 2005-06. It indicates that there are enough assets to support the borrowed loan.
The creditors are more concern to this ratio.
C) Interest Coverage Ratio of TML was very low i.e. 1.12 in the year 2000-01 which
increased to 15.16 in FY 2004-06. But there is decrease in this ratio upto 12.67 in FY
2005-06. It indicates the extent to which a fall in EBIT is tolerable. In other words, it
shows the ability of the company to service the interest payment from EBIT. As TML has
Interest Coverage Ratio of 12.67, which is a indication of good position.
3) Profitability Ratios
A) The graph of EBIT TO Sales has shown upward movement from 7.24 in 2000-01
to 13.73 in 2005-06. It indicate that rate of increase in cost of goods sold are less than rate
of increase in sales, hence the increased efficiency.
B) The Ratio of EAT to Sales is increasing trend from 7.28 in 2000-01 to 7.32 in
2005-06. I t shows that TML has effectively recovered from the Serious Crisis of heavy
loss. It is to be noted that this ratio has shown continuous growth in profit from 02-03 to
05-06.

The Financial Statement Analysis and Cost Reduction Program.
MBA Program 2005-2007 63
C) During FY 2000-01 & 2001-02, the ROCE was negative i.e. 8.0 & -1.1 respectively,
as due to huge loss observed by the company. But the company has came up from this
crisis by using many measures like cost reduction, 0process Improvement etc. ROCE has
shown good result from last four years, as it is increasing from 7.2 in 2002-03 to 17.2 in
FY 2004-05. But there is slight decrease in 17.2 to 16.8 in FY 2005-06. ROCE can be
increased by one of the following way :- increase profit margin, decrease in capital
employed. ROI can be improved by boosting sales, reducing invested capital or reducing
cost.
D) Earning per share is one of the most important factors, which affects the dividend
policy of the firm and market price of shares of company. The shareholders are particularly
interested in knowing this ratio. The Earning per Share was negative i.e. Rs. 18.45 in FY
2000-01, which has increased to Rs. 40.57 in FY 2005-06. it is showing continuous
increase in the Earning Per share. It is a sign of efficient way of managing the business.
5) Regarding Activity Ratios:
A) Inventory Ratio shows increasing trend, which is good for TML. Inventory Turnover
Ratio has increased from 6.56 in 2000-01 to 12.59 in 04-05. It indicates that inventory is
handled efficiently by the company. There is slight decrease in the Ratio from 12.79 to
11.56 in FY 2005-06. But, it is acceptable, as inventory is remained 11 times for that year.
As it is high inventory ratio, it indicates positive impact on liquidity position of company.
B) Fix Asset Turnover Ratio has increased from 1.80 in FY 2000-01 to 4.62 in FY 2005-
06. It indicates that fix assets are utilized in better way to cope with the increasing
production and sale of vehicles.
C) Debtor s turnover Graph has shown upward movement from the Fy 2000-01 to 2005-
06. Through Graphical presentation of Debtors turnover Ratio, we can observe that It has
increasing consistently from 8.37 to 27.5 in FY 2005-06. As it is higher in 2005-06, it has
resulted from efficient credit management system.

The Financial Statement Analysis and Cost Reduction Program.
MBA Program 2005-2007 64
D) Debtor s collection period has shown continuous decrease in collection period from
44 days in 2000-01 to 13 days in 2005-06. As the shorter the average collection period,
better the quality of debtors. It implied prompt payment by debtors. As The delay in
collection from debtors impairs the firm s liquidity. But, In case of TML, the collection
period is shows signs of efficient collection work from credit control managers.

The Financial Statement Analysis and Cost Reduction Program.
MBA Program 2005-2007 65
CONCLUSION
The performance of the company during last Six years signified successful
culmination of the corporate Turnaround plan vigorously pursued since 2001-02. The
various initiatives which focused on aggressive Cost Reduction, right sizing the
organization, volume / market share gains, product / process quality improvement and
launch of new products have enabled the company to achieve an operating profit
(EBIDTA) margin of
23 %, highest in the last five years. These initiatives, combined with improved economic
conditions which led to market growth in commercial vehicles and the continued
improvement in the sale of TATA Indica, resulted in the company s income from
operations crossing the 10000 / - crore marks and reached to a new peak at Rs. 10837
Crore in FY 2002-03.
Thus, by implementing various turnaround strategic programmes in last five years,
company has recovered from the financial crisis in the year 200-01 reached to safe and
sound position through the cost reduction process.. The company s profitability ratios have
shown great improvement in last five years and continuing the same.
Overall financial condition of the company as on 31st March 2006 is looking sound.
The cost Reduction, Better Cash management, Quality Improvement and reduction in
development time for new product, have been among the major points of focus in the
company which enable it to retain its leadership position as a major Indian automotive
company actively participating countries prosperity and carrying the banner of India to
oversea markets with a sense of great pride.
The Financial Statement Analysis and Cost Reduction Program.
MBA Program 2005-2007 66
BIBLOGRPHY
1) ANNUAL REPORT 1999-2000
2) ANNUAL REPORT 2000-2001
3) ANNUAL REPORT 2001-2002
4) ANNUAL REPORT 2002-2003
5) ANNUAL REPORT 2003-2004
6) ANNUAL REPORT 2004-2005
7) ANNUAL REPORT 2005-2006
8) www.tatamotors.com
9) COST ACCOUNTING AND FINANCIAL MANAGEMENT- R.M.Kishore
10) COST REDUCTION HANDBOOK

This document was created with Win2PDF available at http://www.daneprairie.com.The unregistered version of Win2PDF is for evaluation or non-commercial use only.