The Financial Planning Association Managed Futures 17 November 2005 Raymond E. Ix, Jr.
16
The Financial Planning Association Managed Futures 17 November 2005 Raymond E. Ix, Jr.
-
Upload
alyson-skinner -
Category
Documents
-
view
215 -
download
0
Transcript of The Financial Planning Association Managed Futures 17 November 2005 Raymond E. Ix, Jr.
The Financial Planning Association
Managed Futures
17 November 2005
Raymond E. Ix, Jr.

2
Industry Overview
Brief History
Managed Futures Investors
Industry Benchmarks and Indexes
3
Regulated Securities
Exchange traded
Futures Example - Crude Oil• 1,000 barrels @ $60.00 = $60,000.00
What Are Futures?
4
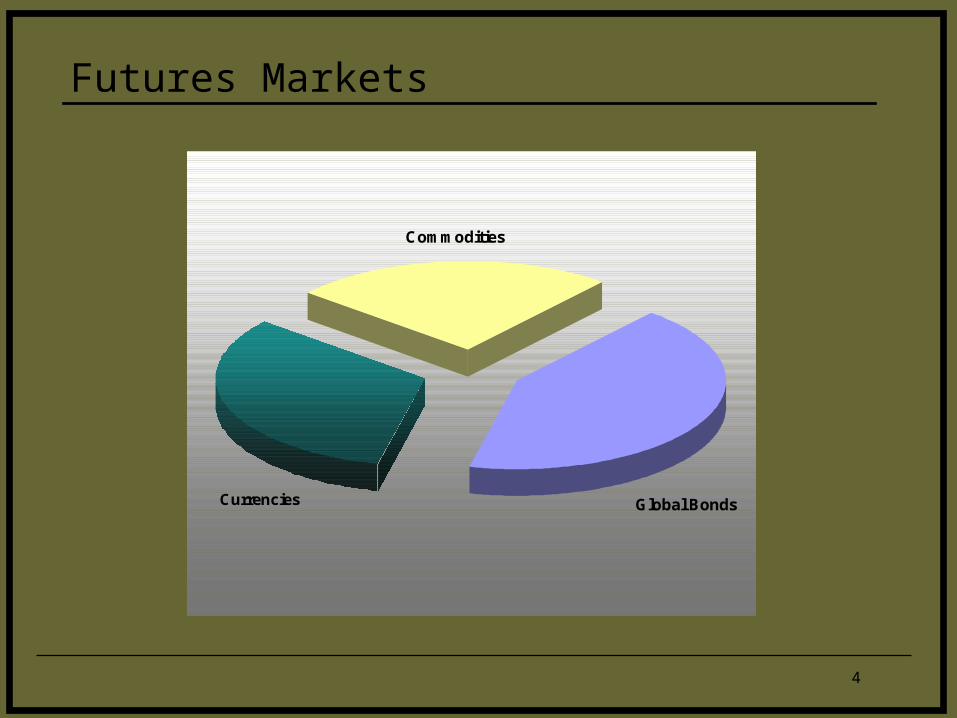
Futures Markets
Commodities
Global BondsCurrencies
Natural GasSoybeansSugarUnleaded GasWheat
Australian DollarBritish PoundCanadian DollarEuro CurrencyJapanese YenSwiss Franc
Canadian Govt BondEuro BundJapanese Govt BondLong GiltTen Year Notes
CornCrude OilCopperGoldHeating OilLive Cattle
5
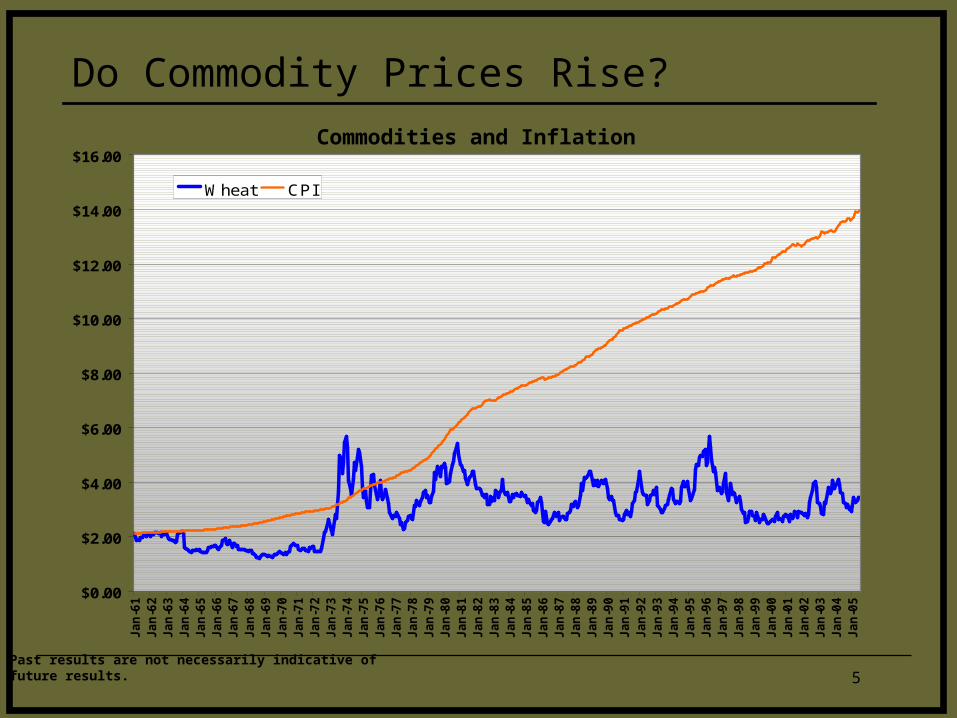
Commodities and Inflation
Do Commodity Prices Rise?
Past results are not necessarily indicative of future results.
$0.00
$2.00
$4.00
$6.00
$8.00
$10.00
$12.00
$14.00
$16.00
Ja
n-6
1J
an
-62
Ja
n-6
3J
an
-64
Ja
n-6
5J
an
-66
Ja
n-6
7J
an
-68
Ja
n-6
9J
an
-70
Ja
n-7
1J
an
-72
Ja
n-7
3J
an
-74
Ja
n-7
5J
an
-76
Ja
n-7
7J
an
-78
Ja
n-7
9J
an
-80
Ja
n-8
1J
an
-82
Ja
n-8
3J
an
-84
Ja
n-8
5J
an
-86
Ja
n-8
7J
an
-88
Ja
n-8
9J
an
-90
Ja
n-9
1J
an
-92
Ja
n-9
3J
an
-94
Ja
n-9
5J
an
-96
Ja
n-9
7J
an
-98
Ja
n-9
9J
an
-00
Ja
n-0
1J
an
-02
Ja
n-0
3J
an
-04
Ja
n-0
5
Wheat CPI
6
Futures markets are good for business and the economy.
Futures investments are good for a portfolio.
Futures Are Good

7
Problem – volatile prices and rates
Desired outcome• Minimize price risk
• Maximize certainty of business margin
• Indifference
Action – use futures markets to hedge exposure
The Business Person
8
Familiar Example• S&P 500
Requirements• Measures the economic return of the activity
• The return can be earned in the marketplace by replicating the Index
• Free of manager skill – or passive
• Robust
Building a Priced Based Index

9
• 22 futures markets
• Volatility Weighted Baskets
• Unleveraged
• Rebalanced monthly
• Positions can be long or short
• Transparent
MLM Index™ Construction
10
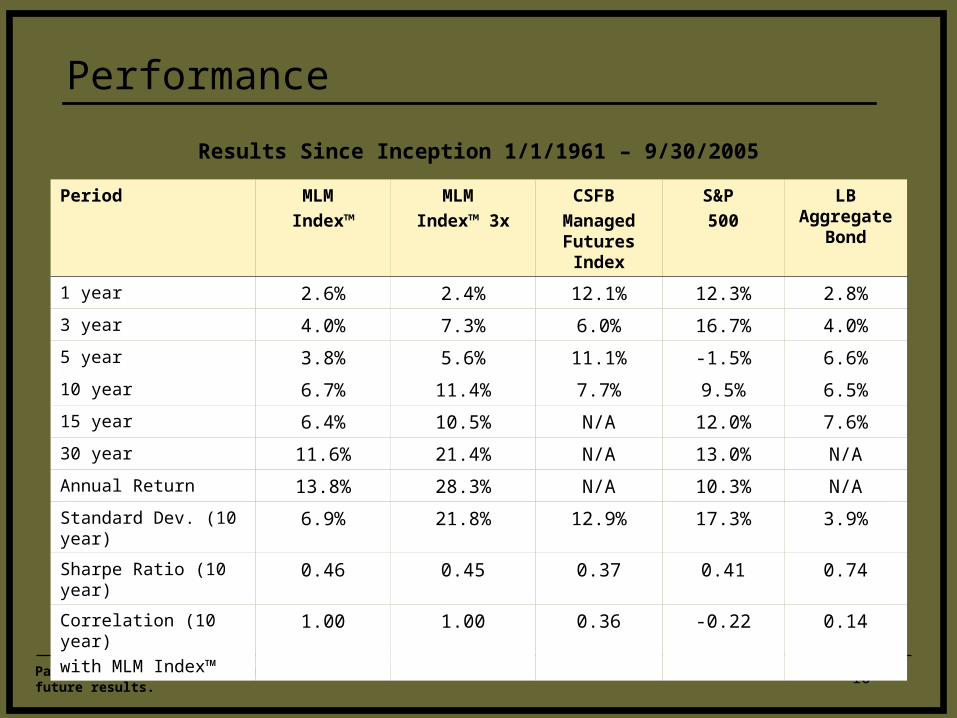
Performance
Results Since Inception 1/1/1961 – 9/30/2005
Past results are not necessarily indicative of future results.
Period MLM
Index™
MLM
Index™ 3x
CSFB
Managed Futures Index
S&P
500
LB Aggregate Bond
1 year 2.6% 2.4% 12.1% 12.3% 2.8%
3 year 4.0% 7.3% 6.0% 16.7% 4.0%
5 year 3.8% 5.6% 11.1% -1.5% 6.6%
10 year 6.7% 11.4% 7.7% 9.5% 6.5%
15 year 6.4% 10.5% N/A 12.0% 7.6%
30 year 11.6% 21.4% N/A 13.0% N/A
Annual Return 13.8% 28.3% N/A 10.3% N/A
Standard Dev. (10 year) 6.9% 21.8% 12.9% 17.3% 3.9%
Sharpe Ratio (10 year) 0.46 0.45 0.37 0.41 0.74
Correlation (10 year)
with MLM Index™1.00 1.00 0.36 -0.22 0.14
11
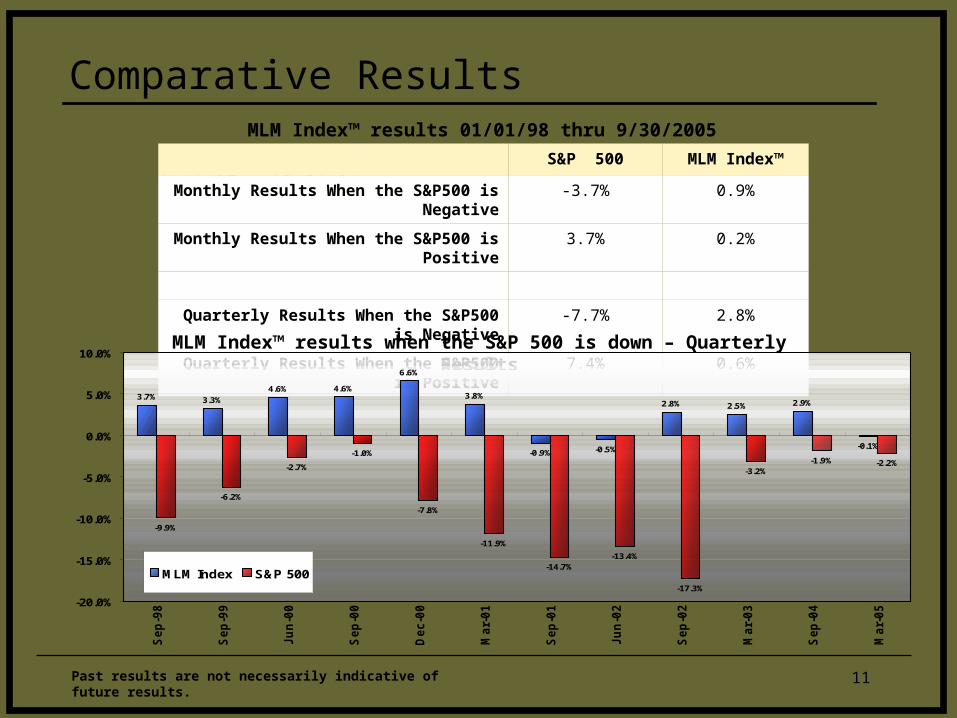
11/1/97 – 12/31/01S&P 500 MLM Index™
Monthly Results When the S&P500 is Negative -3.7% 0.9%
Monthly Results When the S&P500 is Positive 3.7% 0.2%
Quarterly Results When the S&P500 is Negative -7.7% 2.8%
Quarterly Results When the S&P500 is Positive 7.4% 0.6%
MLM Index™ results when the S&P 500 is down – Quarterly Results
Past results are not necessarily indicative of future results.
Comparative Results MLM Index™ results 01/01/98 thru 9/30/2005
3.7% 3.3%
4.6% 4.6%
6.6%
3.8%
-0.9% -0.5%
2.8% 2.5% 2.9%
-0.1%
-9.9%
-6.2%
-2.7%
-1.0%
-7.8%
-11.9%
-14.7%-13.4%
-17.3%
-3.2%-1.9% -2.2%
-20.0%
-15.0%
-10.0%
-5.0%
0.0%
5.0%
10.0%
Se
p-9
8
Se
p-9
9
Ju
n-0
0
Se
p-0
0
De
c-0
0
Ma
r-01
Se
p-0
1
Ju
n-0
2
Se
p-0
2
Ma
r-03
Se
p-0
4
Ma
r-05
MLM Index S&P 500

12Past results are not necessarily indicative of future results.
Comparative Results
MLM Index™ Performance in Rising and Falling Interest Rate Environments: Date for 1/1/80 – 9/30/05
LB Aggregate Bond MLM Index™
Monthly Return in Rising Interest Rate Environments -1.1% 0.8%
Monthly Return in Falling Interest Rate Environments 1.6% 0.9%
Quarterly Return in Rising Interest Rate Environments -2.0% 1.9%
Quarterly Return in Falling Interest Rate Environments
3.4% 2.8%
Monthly Correlation to MLM Index™ 0.02 1.00
Quarterly Correlation to MLM Index™ 0.11 1.00
13
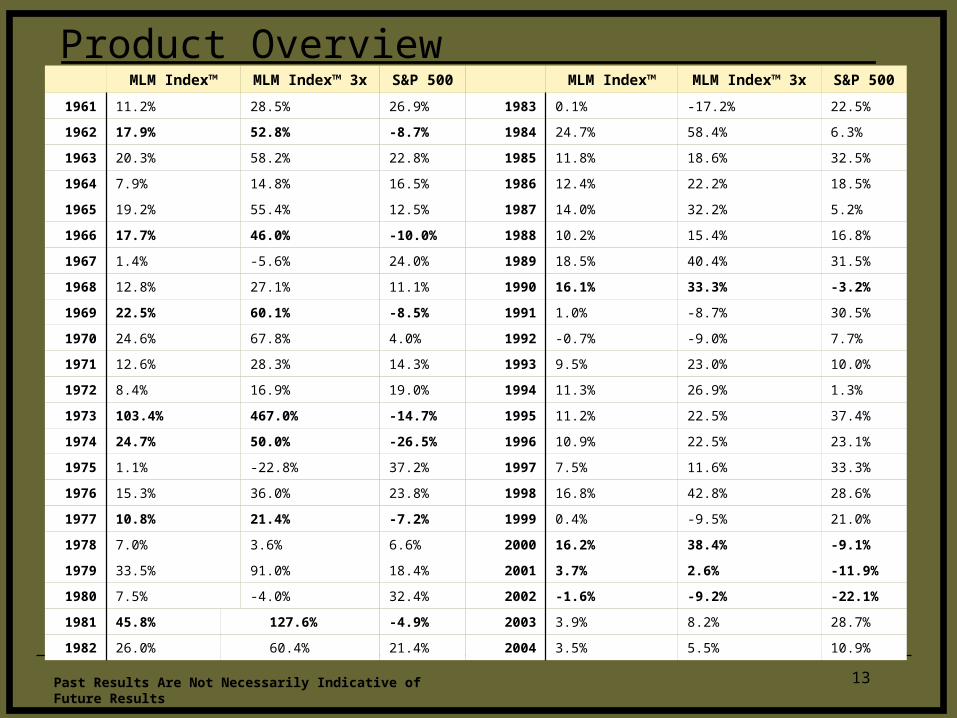
Product Overview
Past Results Are Not Necessarily Indicative of Future Results
MLM Index™ MLM Index™ 3x S&P 500 MLM Index™ MLM Index™ 3x S&P 500
1961 11.2% 28.5% 26.9% 1983 0.1% -17.2% 22.5%
1962 17.9% 52.8% -8.7% 1984 24.7% 58.4% 6.3%
1963 20.3% 58.2% 22.8% 1985 11.8% 18.6% 32.5%
1964 7.9% 14.8% 16.5% 1986 12.4% 22.2% 18.5%
1965 19.2% 55.4% 12.5% 1987 14.0% 32.2% 5.2%
1966 17.7% 46.0% -10.0% 1988 10.2% 15.4% 16.8%
1967 1.4% -5.6% 24.0% 1989 18.5% 40.4% 31.5%
1968 12.8% 27.1% 11.1% 1990 16.1% 33.3% -3.2%
1969 22.5% 60.1% -8.5% 1991 1.0% -8.7% 30.5%
1970 24.6% 67.8% 4.0% 1992 -0.7% -9.0% 7.7%
1971 12.6% 28.3% 14.3% 1993 9.5% 23.0% 10.0%
1972 8.4% 16.9% 19.0% 1994 11.3% 26.9% 1.3%
1973 103.4% 467.0% -14.7% 1995 11.2% 22.5% 37.4%
1974 24.7% 50.0% -26.5% 1996 10.9% 22.5% 23.1%
1975 1.1% -22.8% 37.2% 1997 7.5% 11.6% 33.3%
1976 15.3% 36.0% 23.8% 1998 16.8% 42.8% 28.6%
1977 10.8% 21.4% -7.2% 1999 0.4% -9.5% 21.0%
1978 7.0% 3.6% 6.6% 2000 16.2% 38.4% -9.1%
1979 33.5% 91.0% 18.4% 2001 3.7% 2.6% -11.9%
1980 7.5% -4.0% 32.4% 2002 -1.6% -9.2% -22.1%
1981 45.8% 127.6% -4.9% 2003 3.9% 8.2% 28.7%
1982 26.0% 60.4% 21.4% 2004 3.5% 5.5% 10.9%
14
Frank L. Vannerson – Frank has more than thirty years experience as an investor in commodity markets, especially those for grains, oilseeds, and livestock. He was a co-founder both of Mount Lucas (with Tim Rudderow), where he serves as chairman, and, before that, of Commodities Corporation where he served as a member of its Board of Directors. Frank holds a B.A. from Wichita State and a Ph.D. in Economics from Princeton University.
Timothy J. Rudderow – Tim was a co-founder of Mount Lucas in 1986 and presently serves as the firm’s president, overseeing all of its activities. He has been in the investment business for more than twenty years, beginning in the late 1970s at Commodities Corporation where he worked with Frank on the grain markets and on the design and management of technical trading systems. Tim holds a B.A. in Mathematics from Rutgers University and an M.B.A. in Management Analysis from Drexel University.
Raymond E. Ix, Jr. – Ray joined Mount Lucas in 1992. He plans and directs Mount Lucas Management’s marketing and client service efforts. Prior to Mount Lucas, he was employed by Little Brook Corporation, where he implemented technical trading systems operated by the firm. Before joining Little Brook, Ray was the Fixed Income Administrative Manager at Delaware Management Company. He received a B.S. in Accounting from Saint Joseph’s University in 1986.
Principals’ Biographies

15
Roger E. Alcaly – Roger has been involved in equity investing and leveraged acquisitions for more than 20 years. He was a partner at Kellner, DiLeo & Co., has served in the Carter Administration and worked at the Federal Reserve Bank of New York, and was an Assistant Professor of Economics at Columbia University. He holds a B.A. from Amherst College and a Ph.D. in Economics from Princeton University and is the author of The New Economy: What it is, How it Happened, and Why it is Likely to Last, which was published by Farrar, Straus and Giroux in June 2003.
Paul R. DeRosa – Paul has been in the investment business for more than twenty-five years with a broad specialization in fixed income markets. He began his career in Citibank’s bond trading division and later became the bank’s chief proprietary bond trader and, subsequently, head of its financial derivatives and capital markets businesses in North America. He also worked at E.F. Hutton Co. as co-head of bond trading and was a co-founder of Eastbridge Holdings Inc., a bond and currency trading company. Paul received a B.A. in Economics from Hobart College and a Ph.D. in Economics from Columbia University.
Principals’ Biographies
16
James A. Mehling – Prior to Mount Lucas, Jim was President and Chief Investment Officer of Monitor Capital Advisors. He started his career in financial services with Merrill Lynch in 1976, where he eventually managed a trading desk for Merrill Lynch Government Securities. He has over 21 years of trading experience in the cash and derivatives markets. He has also contributed to books on fixed income securities, options and futures strategies. Jim is a Chartered Financial Analyst and has served as a volunteer on the CFA examination grading committee. He received a B.S. in Aviation Engineering at Western Michigan University in 1970.
John R. Oberkofler – John came to Mount Lucas from Little Brook Corporation, where he
was a Senior Trader. He received a B.S. in Finance from Seton Hall University in 1982.
Principals’ Biographies