THE FINANCIAL IMPACT OF LEAN · PDF filesupposedly traditional style of management with ......
22
Camuffo and Gerli The Financial Impact of Lean Transformations 669294-1 THE FINANCIAL IMPACT OF LEAN TRANSFORMATIONS: A FUZZY-SET ANALYSIS Arnaldo Camuffo, Bocconi University, Department of Management, Via Roentgen 1, 20136 Milan, Italy, e-mail: [email protected], tel. +39 02 58362630 Fabrizio Gerli, Università Ca’ Foscari Venezia, Department of Management, Cannaregio 873, 30121 Venice, Italy, email: [email protected], tel. +39 041 2348735 ABSTRACT This research, by examining a sample composed by some of the best Italian SMEs that are engaged in a lean effort and by adopting a multi-method approach, investigates the relationship between the level of implementation of lean systems, the adoption of a set of “high involvement” management behaviors and a sustained financial performance, controlling for such variables as the duration of the “lean journey” and the size of the firm. Through fuzzy-set analysis, this study focuses on the process of financial value creation within a firm due to the lean transformation and on the complex relation among its determinants. Keywords: Lean transformation, management behaviors, financial performance, configuration, fuzzy-set analysis INTRODUCTION During the last two decades, as the principles and tools of lean thinking (Womack & Jones, 1996) were increasingly adopted by organizations in a variety of industries, research widely investigated the relationship between such adoption and the organizational performance. Several studies analyzed the effects on performance of lean practices’ adoption, with particular focus on operational performance (Hart & Schlesinger, 1991; Powell, 1995; Youndt et al., 1996; Chandler & McEvoy, 2000; Shah & Ward, 2003; Wood, 2004). Instead, comparatively less research was conducted on if, to what extent and under which conditions the adoption of “lean” principles and tools leads to better and more sustainable financial performance. This research gap is obviously grounded in the difficulty to identify and isolate the differential contribution of lean implementation on a firm’s financial performance. However, it also derives from the fact that research on the performance effects of the application of lean thinking practices has been traditionally segregated within the field of operations management where scholars have converged in conceptualizing lean systems as complex and integrated socio-technical systems composed by a set of complementary production practices and routines (Shah & Ward, 2003, 2007). The adoption of lean thinking practices has been recently studied from broader, strategic and organizational perspectives, and interpreted as a process of organizational learning (Emiliani et al., 2007; Rother, 2009), as a process of knowledge transfer and diffusion (Liker & Hoseus, 2008; Liker & Meier, 2007; Liker & Franz, 2011), and as a dynamic capability (Fujimoto, 1999; Anand et al., 2009) constituted by a comprehensive set of operational and managerial routines and behaviors that can lead to sustained competitive advantages. This increasing strategic “reading” of lean practices also relates to the fact that, lured by the
-
Upload
phungthien -
Category
Documents
-
view
215 -
download
1
Transcript of THE FINANCIAL IMPACT OF LEAN · PDF filesupposedly traditional style of management with ......

Camuffo and Gerli The Financial Impact of Lean Transformations
669294-1
THE FINANCIAL IMPACT OF LEAN TRANSFORMATIONS: A FUZZY-SET ANALYSIS
Arnaldo Camuffo, Bocconi University, Department of Management, Via Roentgen 1,
20136 Milan, Italy, e-mail: [email protected], tel. +39 02 58362630
Fabrizio Gerli, Università Ca’ Foscari Venezia, Department of Management, Cannaregio 873, 30121 Venice, Italy, email: [email protected], tel. +39 041 2348735
ABSTRACT
This research, by examining a sample composed by some of the best Italian SMEs that are engaged in a lean effort and by adopting a multi-method approach, investigates the relationship between the level of implementation of lean systems, the adoption of a set of “high involvement” management behaviors and a sustained financial performance, controlling for such variables as the duration of the “lean journey” and the size of the firm. Through fuzzy-set analysis, this study focuses on the process of financial value creation within a firm due to the lean transformation and on the complex relation among its determinants. Keywords: Lean transformation, management behaviors, financial performance, configuration, fuzzy-set analysis
INTRODUCTION
During the last two decades, as the principles and tools of lean thinking (Womack & Jones, 1996) were increasingly adopted by organizations in a variety of industries, research widely investigated the relationship between such adoption and the organizational performance. Several studies analyzed the effects on performance of lean practices’ adoption, with particular focus on operational performance (Hart & Schlesinger, 1991; Powell, 1995; Youndt et al., 1996; Chandler & McEvoy, 2000; Shah & Ward, 2003; Wood, 2004). Instead, comparatively less research was conducted on if, to what extent and under which conditions the adoption of “lean” principles and tools leads to better and more sustainable financial performance. This research gap is obviously grounded in the difficulty to identify and isolate the differential contribution of lean implementation on a firm’s financial performance. However, it also derives from the fact that research on the performance effects of the application of lean thinking practices has been traditionally segregated within the field of operations management where scholars have converged in conceptualizing lean systems as complex and integrated socio-technical systems composed by a set of complementary production practices and routines (Shah & Ward, 2003, 2007). The adoption of lean thinking practices has been recently studied from broader, strategic and organizational perspectives, and interpreted as a process of organizational learning (Emiliani et al., 2007; Rother, 2009), as a process of knowledge transfer and diffusion (Liker & Hoseus, 2008; Liker & Meier, 2007; Liker & Franz, 2011), and as a dynamic capability (Fujimoto, 1999; Anand et al., 2009) constituted by a comprehensive set of operational and managerial routines and behaviors that can lead to sustained competitive advantages. This increasing strategic “reading” of lean practices also relates to the fact that, lured by the

Camuffo and Gerli The Financial Impact of Lean Transformations
669294-2
successful examples of organizations adopting lean principles and tools in a variety of industries, an increasing number of firms have embarked in processes of “lean transformations”, i.e. in complex processes of strategic and organizational change based on the principles of lean thinking. As part of this trend, more emphasis has recently also been given to the role of management behaviors and leadership in lean environments as powerful determinants of the successful adoption of lean principles and tools (Shook, 2008; Rother, 2009; Mann, 2005, 2009; Found & Harvey, 2006; Lucey et al., 2005). Spear and Bowen (1999) were the first to assert that lean tools and practices are effective only if applied in a lean environment in which managers use and teach them consistently. Since then, many other studies on Toyota and other companies adopting lean thinking principles and tools have showed the importance of managers’ role in connecting people development and processes improvement to drive innovation, productivity and quality (Spear, 2004; Liker & Franz, 2011; Liker & Convis, 2012). Building on Ghoshal and Bartlett (1994), Womack (2011) recently elaborated on the role of management in lean environments describing it as the activity of constantly aligning processes and people to a common purpose. Similarly, Rother (2009), following Fujimoto’s (1999) perspective on lean as an emergent management system made up of routines that shape organizational behaviors, conceives lean management systems as sets of routines and patterns of behaviors (kata) geared towards keeping organizations in a learning mode, avoiding bureaucratization and rigidity, allowing adaptation and change to pursue its goals in a changing environment. An even greater emphasis on the centrality of the role of management behaviors in lean environments is offered by studies on the sustainability of performance improvements deriving by lean initiatives (Bateman, 2005; Lucey, Bateman & Hines, 2005). These studies concur in identifying poor leadership and failures to change leadership practices (Found & Harvey, 2006; Lucey et al., 2005; Mann, 2005) as the main cause of non-sustainability of lean initiatives. However, despite all these studies underlying the importance of certain management behaviors as a condition for the successful adoption of lean practices in organizations, no one has hypothesized and tested if, to what extent and under which circumstances a given set of management behaviors might facilitate, support or complement the adoption of lean thinking principles and tools, thus driving better and sustainable financial performance. This study, adopting a multi-method approach and building on previous research conducted by the authors, investigates the relationship between the level of implementation of lean systems, the adoption of a set of “high involvement” management behaviors and sustained financial performance, controlling for such variables as the duration of the “lean journey” and the size of the firm.
THEORY AND RESEARCH CONSTRUCTS As already mentioned, management behaviors in lean environments have been increasingly investigated by scholars interested in understanding the distinctive characteristics of lean management systems and in explaining what drives sustainable performance improvements over time.
Camuffo and Gerli The Financial Impact of Lean Transformations
669294-3
They play different roles according to the different stages of lean thinking principles and tools adoption. At the beginning of the lean transformation process they represent key enablers of the transformation process (De Menezes et al., 2010) but their importance is also significant when lean initiatives are at an advanced stage, when appropriate management behaviors might become a source of culture reinforcement and, hence, become complementary with increasingly better and more complete implementation of lean thinking principles and tools, and prevent regression to traditional habits (Mann, 2009). Mann (2009) points out that leadership is the bridge between lean tools and lean principles and stresses the fact that lean tools implementation represents just 20% of a lean transformation, whereas the remaining 80% consists in changing leaders’ mindset and, consequently, their behaviors, habits and practices. Existing studies on this topic approach this problem by contrasting a supposedly traditional style of management with a supposedly lean style of management (Mann, 2005; Womack, 2011; Womack et al. 1990). More specifically, Womack (2008) identifies a set of differences between the two styles, by comparing the “modern management” approach and the “lean management” approach, which he described as follows: “By modern management I mean the set of interlocking ideas on management pioneered by Alfred Sloan at General Motors early in the 20th century and progressively refined by many organizations across the world, perhaps most strikingly by General Electric in the 1980s and 90s. And by lean management I mean a different set of interlocking ideas on management pioneered by Eiji Toyoda and his colleagues at Toyota in the 1950s and 60s and spread across the world by Toyota’s example in recent years” (Womack, 2008, p.1). According to this perspective, these two managerial styles present several differences, among them: the process of value creation (horizontal vs. vertical), the kind of managerial responsibility (over processes and cross-functional vs. vertical delegation), the problem solving approach (through the research of the root causes vs. by providing solutions and imposing decisions), the decision making approach (decisions made at the point of value creation vs. decisions taken by analyzing data far from the point of value creation), the development of standards (by line managers and work teams vs. by staff with little interaction), the planning methods (Plan-Do-Check-Act approach vs. top-down approach), the managerial development process (through in-company gemba learning vs. formal/external development), and the knowledge sharing methods (managers as teachers and coaches vs. formal learning paths). Consistently with this perspective, Mann (2009) defines which role managers should play in order to guarantee the success of a lean transformation process. This role is focused on: a) creating commitment towards a common purpose that overcomes internal boundaries, establishing cross-functional processes and structures and promoting collaboration among departments; b) sustaining the lean behaviors and practices guaranteeing that the improved processes become ongoing routines; c) implementing a reporting system based on process measures; d) creating a context that promotes a continuous improvement culture. In order to understand how these managerial behaviors impact on the attainment of a successful organizational performance, it is necessary to study their effects in combination with the adoption of the lean practices and tools, according to a holistic and configuration-based approach. For this reason, this study adopts a holistic perspective, that takes into account not only the application of a set of “lean” practices, but also how these practices are integrated into a business philosophy that creates a learning organization which constantly strives for

Camuffo and Gerli The Financial Impact of Lean Transformations
669294-4
perfection. From this standpoint, lean management is viewed as an integrated and complex socio-technical system (Shah & Ward, 2007), or, alternatively, as a configuration. Configurations have been defined by Meyer, Tsui and Hinings (1993) as “any multidimensional constellation of conceptually distinct characteristics that commonly occur together”. According to Shah and Ward (2007, p. 791) “lean production may be viewed as a configuration of practices/tools because the relationships among the elements of lean production are neither explicit nor precise in terms of linearity or causality. […] From a theoretical standpoint, lean production is seen as a tightly coupled system where the constituent elements hold together in mutual dependence. It is the self-reinforcing effects of this kind of mutual dependence that contribute to the superior performance associated with lean production on the one hand and make it rare, valuable and difficult to imitate by competitors on the other hand”. The same authors also suggested that lean production is better understood if studied with a configurational perspective because it helps to explain how a lean systems works, considering its underlying elements as a whole, not examining each of them separately. Thus this configurational approach implies a different view on organizations, in which profiles (combination of causal conditions) rather than analytically independent variables are connected to performance (Fiss, 2007; Delery & Doty, 1996). This research, examining a sample composed by some of the best Italian SMEs that are engaged in a lean effort, wishes to explore and validate the organizational configuration vision of lean management as a complex integrated system. Drawing upon the outstanding literature on lean management systems and the hypothesized corresponding management behaviors, this study focuses on the process of financial value creation within a firm due to the lean transformation and on the complex relation among its determinants. First, this study explores the dynamics of value creation during a lean transformation. Even if it has been already demonstrated that the implementation of lean systems lead to improvements in every internal process, it has been under-investigated how the value created by the implementation of lean systems is delivered over the years. So this study analyzes the trend of some KPIs to see how they are affected by the lean transformation and how they evolve over the years, verifying if the process of value creation is linear or not. Then, this study, adopting a multi-method approach, tests whether or not companies that embrace lean thinking, making it their vision, improve their financial performance at a faster pace and even constantly outperform their specific industry. By doing this, we try to understand the role of the lean practices and tools and of the “high involvement” management behaviors in determining an improvement in the firms’ financial performance, according to the above mentioned configurational perspective. Our research questions are the following: 1) Is the value created by the lean transformation linear? Should the companies that start a lean journey expect a decline in financial performances in the first years? 2) Are the “high involvement” management behaviors depicted by the literature correlated with a higher financial performance? 3) Is there any configuration of variables that characterizes the companies that have obtained a particularly successful financial performance?
Camuffo and Gerli The Financial Impact of Lean Transformations
669294-5
DATA, MEASURES AND METHOD
The Sample To answer the research questions identified above this study analyses the same sample of firms examined by the authors in a previous research (Camuffo & Gerli, 2012). This sample is made up of 26 North Italian small and medium manufacturing enterprises. These firms have been selected among the ones that had already started a lean transformation process, picking the companies that were more seriously committed to adopt a lean system in the last years. The sampled companies have been engaged in the lean transformation for a different number of years: 19% of them are “early adopters”, meaning that they have been implementing lean for more than 6 years; 46% of them have been lean for 3 up to 5 years (“followers”); and 35% of them are “late adopters” having started to implement lean in 2009 or 2010. Even if these firms are at different stage in their transformation process, they are successfully doing their lean journey, thus they can be considered a sample of “the best lean Italian SMEs” (Camuffo & Gerli, 2012). Most of the firms in the sample (61%) have sales revenues ranging from €10 to €50 million, while 35% of the companies present sales revenues above €50 million and the remaining 4% are small firms with sales ranging from €2 to €10 million. In addition, most of the firms (65%) have a number of employees between 50 and 250, 31% of them employs more than 250 people and only 4% has less than 50 employees. These firms belong to many industrial sectors, such as mechanics, furniture, electronics, packaging, motor vehicles, domotics, child equipment, wine, laundry-home care, plastics, industrial gases. Finally, about 35% of them are part of a larger multinational group. Independent Variables The independent variables for this study are taken directly from Camuffo and Gerli (2012) and are: the Lean Advancement Score and the “High involvement” Management Behaviors. The Lean Advancement Score (LAS) represents the degree of advancement in the lean transformation process. We measured it from an on-site assessment (an extensive “gemba walk”) conducted by a sub-team of researchers on a set of 30 lean management systems characteristics. Researchers visited the main production plants of every firm and interviewed the personnel involved in the design, industrialization and production activities in order to have an insight on the technologies and the processes applied. Sub-teams’ members’ assessments were then compared to test their inter-rater reliability and converge on an univocal evaluation. The 30 parameters of the assessment summarize the tools, routines, artifacts and practices that typically characterize a lean management system and are derived from the reviewed literature. These characteristics were grouped into seven clusters: 1) Just in Time Tools; 2) Continuous Improvement Tools; 3) Lean People Management; 4) Management Commitment; 5) Lean in Strategy; 6) Material Management; and 7) Supplier Management. We computed the LAS as the average of the parameters’ score, which ranges from 1 to 5, where 1 represents a low degree of advancement and 5 a high degree of advancement.

Camuffo and Gerli The Financial Impact of Lean Transformations
669294-6
The Lean Advancement Score measure follows: LAS = ∑ 𝑉𝑖𝑛
𝑖𝑛
(1) where Vi is the value of advancement of lean item i, and n is the number of items.
The second independent variable was the degree of adoption of “High involvement” Management Behaviors, i.e. the behaviors the literature hypothesize to be consistent and complementary with lean thinking adoption. To measure it we considered 14 behaviors identified from the relevant literature on lean management and lean leadership. We started from the repertoire of lean management behaviors pioneered by Womack (2008, 2011) who lists a set of “lean management” behaviors contrasting them with “modern management” behaviors. Then we operationalized and integrated them with others (Ohno, 1988; Liker, 2004; Rother, 2009; Liker & Hoseus, 2008; Sato, 2008), and obtained the following “high involvement” behaviors: 1) Organizational horizontality; 2) Managerial responsibility; 3) Process-Based Evaluation; 4) Iterative Planning; 5) Managerial versatility; 6) Gemba-based management development; 7) Fact-based decision making; 8) Scientific method-based problem solving; 9) Standards development; 10) De-hierarchization; 11) Managerial reflexibility; 12) Teaching; 13) Open-mindedness; 14) Challenge. Each behavior was then operationalized by defining a set of corresponding actions, which represent the presence or absence of application of each behavior. Some behaviors presented only two actions (one referable to the presence of that behavior, that is the coherence with a lean management approach, and another referable to the absence of that behavior, that is the coherence with a modern management approach). In order to offer a fine grained analytical scheme, for some behaviors in the list that presented a wider variety of adoption, we detailed a scale able to capture the different degree of application of these behaviors through a wider set of corresponding actions, according to the “just noticeable differences scales” (JNDS) approach, whose adoption in social sciences, and in particular in economics and psychology, has been widely acknowledged (Spencer & Spencer, 1993; Stevens & Stone, 1959; Luce, 1956). Then to each action has been given a weight, from -1 to +1, depending on their coherence with the modern management or the lean management approach, where -1 identifies actions completely consistent with the modern management approach and +1 actions completely consistent with the lean management approach. Intermediate behaviors were weighted in between –/+1. To detect the degree of presence of these behaviors, a different sub-team of researchers (to avoid problems of endogeneity and single respondent bias) conducted a series of structured and standardized interviews with the top lean agent or the chief of the kaizen promotion office of each firm. The interview aimed at exploring the lean transformation process and some specific events in which the firm obtained significant results through the implementation of lean tools. The interview protocol largely drew upon the critical incident interview technique (Flanagan, 1954), where the attention of the interviewer is focused on gathering information on specific and real cases and events and not on the interviewee’s opinions. The potential of the critical incident interview and of its developments, as an efficient substitute for direct observation of real events, has been recognized also in the

Camuffo and Gerli The Financial Impact of Lean Transformations
669294-7
process of analysis of organizational competencies and in the elicitation of tacit knowledge (Ambrosini & Bowman, 2001). The overall presence of these “high involvement” behaviors (HIB) in the firm j has been measured as the weighted frequency of each behavior, as shown as follows.
∑=n
iij FHIB (2)
Where:
: Weighted frequency of behavior ; : Number of management behaviors.
The weighted frequency was calculated as follows:
(3)
Where: : Frequency of management behavior detected in the firm ;
: Coded Behaviors – number of times that the action associated to behavior was detected in the interview conducted in the firm ;
: Weight associated to the action (from -1 to +1 according to the consistency to a modern management approach or to a lean management approach) associated to behavior ;
: Potential Behaviors – the maximum number of weighted actions associated to behavior detectable in the interview conducted in the firm ;
: Analyzed firms (from 1 to 26); : Analyzed Behaviors (from 1 to 14); : Actions associated to that analyzed behavior.
Dependent Variables As dependent variables we selected two financial metrics that are tightly linked to the internal processes and dimensions that are more directly affected by a lean transformation (Maskell and Baggaley, 2003), that is: a) EBITDA (Earnings before interest, taxes, depreciation and amortization) Margin, which is a measure of the firm’s profitability and is a proxy of the cash flow generated per Euro of sales; b) ROIC (Return on invested capital), which is a profitability measure that takes into account the capital, the firm’s cash flow generation and its operating and structural efficiency. They can be measured as follows: EBITDA Margin = EBITDA/Sales Revenue (%); ROIC = NOPAT/Net Invested Capital (%). In order to be able to compare all the firms of the sample directly, since they operate in different industries, characterized by different trends and levels of profitability, we analyzed if each firm of the sample over/under-performed its industry according to the above profitability measures. To do this, we transformed each dependent variable into an index number which highlights the differential performance of each company compared with industry peers, by using the following formula:
Camuffo and Gerli The Financial Impact of Lean Transformations
669294-8
1,,
,,,,,, +
−=
tfv
tfvtfvtfv m
mXD (4)
where:
Dv,f,t : Dependent Variable transformed into index number; tfvX ,, : Value of the dependent variable v in the firm f in the year t;
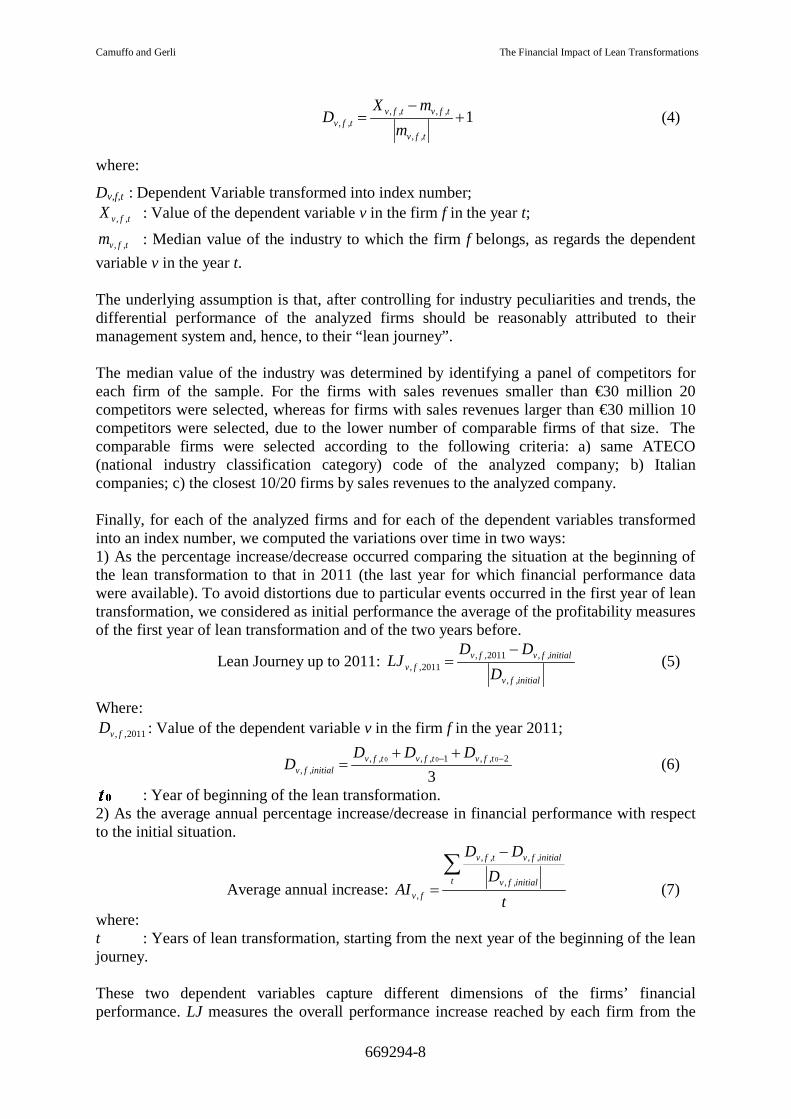
tfvm ,, : Median value of the industry to which the firm f belongs, as regards the dependent variable v in the year t. The underlying assumption is that, after controlling for industry peculiarities and trends, the differential performance of the analyzed firms should be reasonably attributed to their management system and, hence, to their “lean journey”. The median value of the industry was determined by identifying a panel of competitors for each firm of the sample. For the firms with sales revenues smaller than €30 million 20 competitors were selected, whereas for firms with sales revenues larger than €30 million 10 competitors were selected, due to the lower number of comparable firms of that size. The comparable firms were selected according to the following criteria: a) same ATECO (national industry classification category) code of the analyzed company; b) Italian companies; c) the closest 10/20 firms by sales revenues to the analyzed company. Finally, for each of the analyzed firms and for each of the dependent variables transformed into an index number, we computed the variations over time in two ways: 1) As the percentage increase/decrease occurred comparing the situation at the beginning of the lean transformation to that in 2011 (the last year for which financial performance data were available). To avoid distortions due to particular events occurred in the first year of lean transformation, we considered as initial performance the average of the profitability measures of the first year of lean transformation and of the two years before.
Lean Journey up to 2011: initialfv
initialfvfvfv D
DDLJ
,,
,,2011,,2011,,
−= (5)
Where:
2011,, fvD : Value of the dependent variable v in the firm f in the year 2011;
3
2,,1,,,,,,
000 −− ++= tfvtfvtfv
initialfv
DDDD (6)
: Year of beginning of the lean transformation. 2) As the average annual percentage increase/decrease in financial performance with respect
to the initial situation.
Average annual increase: t
DDD
AIt initialfv
initialfvtfv
fv
∑−
= ,,
,,,,
, (7)
where: t : Years of lean transformation, starting from the next year of the beginning of the lean journey.
These two dependent variables capture different dimensions of the firms’ financial performance. LJ measures the overall performance increase reached by each firm from the

Camuffo and Gerli The Financial Impact of Lean Transformations
669294-9
start of its process of lean transformation to 2011, whereas AI takes into account the financial value generated every year during the whole transformation, and for this reason considers also the variance occurred in the financial results during the whole process. At the same time, LJ might be influenced by particular events occurred in the last year of lean transformation, whereas AI might be influenced by the typical performance decrease that companies experience in the first years of lean transformation, and this might be particularly significant for those firms that have started their transformation only recently.
RESEARCH METHOD
Consistently with our theoretical framework, which considers the organization according to a holistic perspective and lean management as a configuration of practices and tools, where the relationships among the elements are not linear neither causal (Shah and Ward, 2007), our research tries to explore and validate this configurational vision by testing the relationships among the above defined variables, with the specific aim to test whether or not companies that embrace lean thinking can improve their performance and even outperform their specific industry. First, we explored the dataset of dependent and independent variables in terms of their correlations and, about the financial performance, their trend over time. The longitudinal analysis of the financial performance allowed us to verify the presence or the absence of a typical trend in the financial results due to the implementation of lean transformation. Secondly, in order to test the adequacy of the configurational perspective to our case, we started our analysis by exploring the relationships among independent and dependent variables, according to a traditional linear perspective, based on singular causation relations. Traditional OLS regression was used to test the model. The classic linear regression model considers each variable as competing in explaining variation in outcomes rather than showing how variables combine to create outcomes, since it focuses on the unique contribution of a variable while holding constant all the others (Fiss, 2007). For this reason, according to the adopted configurational theoretical framework, in our case this analysis should show unsatisfactory results in explaining the relation between dependent and independent variables. First of all, OLS analysis was applied to test the relationship between the independent variables (Lean Advancement Score and “High involvement” management behaviors) and the financial performance improvements achieved during the lean transformation journey, considering both the financial measures (EBITDA margin and ROIC) and both their indicators (LJ and AI). These models included two control variables: Years of lean transformation (a variable that measures the duration of the lean transformation journey and is supposed to be positively related to the financial performance improvements achieved by the firms during their lean transformation process) and Size of the firm, measured by the number of employees of the companies in the sample. These models were intended to test if the independent variables had separate and linear effects on the firms’ financial performance and if these two variables contribute to explain the performance variability. In addition, we further examined the role of the “High involvement” management behaviors. Our conceptual framework hypothesizes that they have a sort of bridging function between the lean tools and the lean principles, and that they contribute to the creation of an environment where the lean techniques and processes can be effectively applied (Mann, 2009). Consequently, from this perspective, they are expected to have an influence on the relation between the variable that measures the “hard” part of the lean systems (Lean

Camuffo and Gerli The Financial Impact of Lean Transformations
669294-10
Advancement Score) and the financial performance achieved by the companies during their transformation. Thus, we tested the hypothesis that the “High involvement” management behaviors act as a moderator variable with a positive effect on the relationship between the Lean Advancement Score and the financial performance. Finally, consistently with a configurational perspective and a systemic view to lean management, we conducted a fuzzy set analysis (using the software fs/QCA), which is a set-theoretic method that makes it possible to analyze and evaluate different configurations characterized by causal complexity. The strength of this method is that, unlike traditional research methods, it considers observations as various kinds of cases and does not divide them into separate, analytically autonomous elements/variables (Fiss, 2011). So it helps to build different and sharp causal explanations and, with a holistic approach, allows to identify successful typologies/profiles that summarize the complex relationships between several characteristics (Fiss, 2011). In this research, this methodology has been used to compare various companies and simplify their complex nature on the basis of their commonalities. In addition, it is a case-oriented analysis technique, particularly recommended to study small samples, it takes into account interactive and nonlinear effects focusing on the joint distributions of the causal variables, and is based on the concept of equifinality, that is the belief that “a system can reach the same final state, from different initial conditions and by a variety of different paths” (Katz & Kahn, 1978, p.30) and consequently that “two or more organizational configurations can be equally effective in achieving high performance” (Fiss, 2007, p. 1181). Moreover, this method allows to analyze the presence of causal asymmetry, namely the fact that the conditions/causes that lead to the presence of the outcome are often different from the ones that lead to its absence (Fiss, 2011). Summing up, it is possible to state the fs/QCA is useful “to explore evidence descriptively and configurationally, with an eye towards the different ways causally relevant conditions may combine to produce a given outcome” (Ragin, 2008, p.141).
FINDINGS
Descriptive Statistics and Performance Trends Table 1 presents the descriptive statistics and the bivariate correlations between the analyzed variables for our sample. It is possible to note that some variables present a significant correlation: the Lean Advancement Score (LAS) is correlated to the High Involvement management behaviors (HIB), the duration of the lean journey is correlated to LAS, HIB and the size of the firm, and some financial performance variables are correlated each other. However, in spite of the strong correlation between some independent variables, this study does not suffer from problems of endogeneity: as explained above, the Lean Advancement Score and the High Involvement management behaviors have been evaluated independently by different sub-teams of researchers who used different sources and tools. In addition to the descriptive statistics, in this section we also show the results of the analysis conducted longitudinally on the financial performance measures, in order to understand the presence of a typical financial performance trend due to the process of lean transformation. These trends were tracked by calculating the increase/decrease of the performance measures, with respect to the initial situation, in three different moments: after the first, third and fifth year since the beginning of the lean journey. The results presented in Table 2 show that the financial performances tend to decrease in the first year of lean transformation and then quickly improve in the subsequent years.

Camuffo and Gerli The Financial Impact of Lean Transformations
669294-11
TABLE 1. DESCRIPTIVE STATISTICS
Mean Std. Dev. 1 2 3 4 5 6 7 8
Lean Advancement Score (LAS) 2.436 0.476 1 .660** .257 .667** -.025 .037 .221 .114
High Involvement Management Behaviors (HIB) 245.097 198.161 .660** 1 .227 .537** -.187 .085 .071 .157
Size 320.423 589.629 .257 .227 1 .643** .243 .145 .273 .118 Years 4.038 2.676 .667** .537** .643** 1 .280 .407* .432* .389* LJ2011 EBITDA 0.164 0.791 -.025 -.187 .243 .280 1 .616** .834** .395* LJ2011 ROIC 1.334 2.770 .037 .085 .145 .407* .616** 1 .586** .805** AI2011 EBITDA 0.018 0.572 .221 .071 .273 .432* .834** .586** 1 .550** AI2011 ROIC 0.881 2.295 .114 .157 .118 .389* .395* .805** .550** 1
TABLE 2. FINANCIAL TRENDS OVER TIME
Year 1 Year 3 Year 5 EBITDA Margin Percentage increase (mean value) -14.74 -1.07 26.74 EBITDA Margin Percentage increase (Std. Dev.) 45.31 73.45 105.72 ROIC Percentage increase (mean value) -1.86 66.21 153.35 ROIC Percentage increase (Std. Dev.) 117.75 423.41 244.83 The performance reduction that is shown in the first year of lean journey, that is particularly strong referring to the EBITDA margin, is probably due to the investments needed to start the lean transformation and to some accounting effects linked to the stock reduction which is usually one of the first outcomes of the lean implementation. Indeed, firms at the beginning of their lean journey obtain a drastic reduction of their stocks thanks to value stream improvements. A consequence of this is that a variety of indirect and general costs that are usually incorporated in the value of inventories (because they are attributed, through cost accounting techniques, to the goods in stock) and for this reason have been considered as assets in the balance sheet, after the implementation of lean systems emerge as pure costs, with the consequence of reducing the company earnings. The combined effect of these two factors (higher investments and lower earnings) reduces the short-term financial performances of the companies that have started a lean journey. Anyway, the results obtained in the subsequent years are, on average, extremely noticeable. This means that the firms that do not interrupt the lean implementation process after the first difficulties and maintain their commitment over the years, tend to succeed in outperforming their industry, in particular in the last years of lean transformation, by improving their profitability ratios at a faster pace than that of their competitors.

Camuffo and Gerli The Financial Impact of Lean Transformations
669294-12
The Impact of Lean Tools and Behaviors on the Financial Performance In order to answer our research questions, we analyzed the impact of the adoption of lean tools and high involvement management behaviors on the financial performance of the firms. As explained in the method section, we started our analysis by testing this relation through linear regressions, with the purpose of verifying weather the lean tools and the management behaviors act separately and independently on the firms’ performance improvements. In the regression models we considered as dependent variable EBITDA Margin (Table 3) and ROIC (Table 4), both of them measured through the Lean Journey (LJ) and Average Annual Increase (AI) indicators. The two main independent variables are the Lean Advancement Score (LAS) and the High Involvement Management Behaviors (HIB). Some models also included two control variables: Years (the length of the lean transformation process) and Size (the number of employees of the sampled companies in 2011).
TABLE 3. OLS RESULTS. Lean Journey up 2011 (EBITDA) and Average annual Increase (EBITDA) as dependent variables. N=22. Dependent Variable: LJ EBITDA Dependent Variable: AI EBITDA
Model 1 Model 2 Model 3 Model 4 Model 5 Model 6
Std. Beta Std. Beta Std. Beta Std. Beta Std. Beta Std. Beta
(sig.) (sig.) (sig.) (sig.) (sig.) (sig.) LAS 0.283 0.008 -0.482 0.395 0.191 -0.218
(0.327) (0.979) (0.237) (0.116) (0.491) (0.550) HIB 0.154 0.041 -1.652 0.287 0.204 -1.208
(0.590) (0.879) (0.108) (0.246) (0.400) (0.190)
LAS × HIB
2.160
1.801
(0.090)
(0.117)
Size 0.188 0.341 0.112 0.240
(0.487) (0.212) (0.643) (0.330)
Years 0.447 0.256 0.341 0.182
(0.221) (0.471) (0.294) (0.572)
Adjusted R2 0.073 0.227 0.318 0.324 0.377 0.435
In addition, as explained above, we considered the particular role of the management behaviors, in terms of their potential influence on the relation between the tools and the performance. Consequently, we tested the hypothesis that the management behaviors act as a moderator variable with a positive effect on the relationship between the LAS and the dependent variables. In this case, the moderation effect is verified when the regression coefficient of variable LAS × HIB is positive and significant in the corresponding model.

Camuffo and Gerli The Financial Impact of Lean Transformations
669294-13
TABLE 4. OLS RESULTS. Lean Journey up 2011 (ROIC) and Average annual Increase (ROIC) as dependent variables. N=22. Dependent Variable: LJ ROIC Dependent Variable: AI ROIC
Model 7 Model 8 Model 9 Model 10 Model 11 Model 12
Std. Beta Std. Beta Std. Beta Std. Beta Std. Beta Std. Beta
(sig.) (sig.) (sig.) (sig.) (sig.) (sig.) LAS 0.185 -0.218 -0.355 0.150 -0.158 -0.400
(0.504) (0.449) (0.386) (0.608) (0.635) (0.398) HIB 0.325 0.179 -0.295 0.229 0.119 -0.714
(0.245) (0.475) (0.768) (0.435) (0.683) (0.538)
LAS × HIB
0.605
1.062
(0.625)
(0.459)
Size -0.350 -0.307 -0.299 -0.224
(0.173) (0.266) (0.312) (0.477)
Years 0.878 0.825 0.684 0.590
(0.016) (0.032) (0.091) (0.165)
Adjusted R2 0.137 0.328 0.297 0.028 0.088 0.064
To make sure that the results were not distorted by few influent observations, the data homogeneity was checked. Four outlying observations were identified and excluded from the sample for this type of analysis. In particular two of them presented extremely high values for the year 2011, whereas the other two outliers presented extremely low values. The sample for this analysis was then reduced from 26 to 22 observations. Our results show no significant variables in the regression models, except for the moderating variable LAS × HIB in model 3 and for the variable Years in models 8, 9 and 11 (p < 0.10). In these cases the significant variables present a positive sign, as expected. However, the adjusted R2 is overall low. In model 6, which presents the highest R2, the variable LAS × HIB shows a significance only slightly lower than 90%. The failure of the models in explaining the variability of the dependent variables suggests that the analyzed variables LAS and HIB do not present independent effects on the firms’ performances and that their impact cannot be observed through the additive approach typical of the OLS regressions. On the opposite, the result about the moderating variable means that the management behaviors seem to have a positive effect on the relation between the application of the lean tools and the firms’ financial performances. Since the product of HIB and LAS is significant and positive, it means that they are mutually influenced and they present a combined effect (at least by analyzing the metric EBITDA margin) on the companies’ performances. However, the moderating effect is not demonstrated for the metric ROIC. In addition, the variable Years must be taken into consideration, since it presents an impact on the financial performance in almost all the models which consider ROIC as the dependent variable. These findings are only partially satisfactory: on the one side they suggest that the adoption of lean behaviors has a positive effect in achieving a higher financial performance in those

Camuffo and Gerli The Financial Impact of Lean Transformations
669294-14
companies that properly apply the lean techniques and that there is a positive relationship between the management behaviors, the lean tools and the performance improvements obtained during the lean journey. This is consistent with the configurational approach and the systemic view to lean management, which requires the variables’ effects to be analyzed holistically, as a whole, taking into account the synergetic effects and interactions between the variables (Shah & Ward, 2007). On the other side these results are mainly limited to one metric (EBITDA Margin) and present contradictory evidence about the role of the control variables. For this reason the next step of our analysis used the fuzzy set analysis as a tool to evaluate the role of different configurations of variables, instead of separate and autonomous variables. A Configurational Analysis through Fs/QCA Consistently with a configurational perspective to the lean systems, we used the fuzzy set qualitative comparative analysis (fs/QCA) (Ragin, 2000, 2006, 2008; Ragin & Fiss, 2008, Fiss, 2007, 2009, 2011) to analyze our sample. It is a set-theoretic method that is particularly effective to study different configurations characterized by causal complexity and non-linear relationships (Fiss, 2007), where “variables found to be causally related in one configuration may be unrelated or even inversely related in another” (Meyer et al., 1993: 1178). Differently from traditional methods, it analyses asymmetric relationships and synergistic effects, accordingly with an equifinality perspective, where more organizational configurations may have the same impact on the firm’s performance. Set-theoretic approaches are particularly appropriate for configurational theory since they conceptualize cases as combinations of attributes and highlight that these combinations give cases their unique nature (Fiss, 2007; Ragin, 1987, 2000). For these reasons, it is possible to conclude that the fs/QCA’s advantage is “to explore evidence descriptively and configurationally, with an eye towards the different ways casually relevant conditions may combine to produce a given outcome” (Ragin, 2008, p.141). In addition, it is a case-oriented technique, and for this reason it is particularly recommended to study small-N samples. In our case, each configuration is represented by the different combinations of independent variables and controls. Using this type of analysis we tested one model where the conditions/variables were: Lean Advancement Score (LAS), High Involvement Management Behaviors (HIB), duration of the lean jouney (Years) and number of employees (Size). These variables were considered related to the research outcome, represented by the financial performance improvements achieved during the lean transformation process. Consequently, in this analysis, the hypothesis we tested regards which combination of elements of a configuration are sufficient conditions to obtain an outcome in terms of firms’ financial outperformance. The underlying assumptions consider that, in order to obtain a better financial performance, a firm should: a) have implemented the lean tools and methods at an advanced stage (LAS); b) have applied continuously the appropriate high involvement management behaviors (HIB); c) have sustained lean transformation efforts for a long time (Years); d) have reached an appropriate dimension to implement the lean tools and behaviors (Size). In particular, the assumption about the duration of the lean journey comes from Mann (2009, p.24) that highlights that “the longer an organization pursue Lean, the more opportunities for improvement it sees”.

Camuffo and Gerli The Financial Impact of Lean Transformations
669294-15
In order to apply the fs/QCA method, we followed these steps, by using the software fs/QCA version 2.5: 1. transformation of the variables into fuzzy sets through a calibration process; 2. construction of a Truth Table that includes the list of all possible configurations; 3. identification of the subset of configurations that lead to a higher outcome and are internally consistent; 4. identification of the solutions in terms of consistent configurations.
The first step of this analysis required to identify three thresholds, for each variable, that correspond to: full membership, full non-membership and the cross-over point, “the point of maximum ambiguity in the assessment of whether a case is more in or out of a set” (Ragin, 2000, p.30). Membership is intended as the definition of the conditions under which one of the sampled firm can be considered as belonging to a given set (in our case, the outperforming firms). The definition of these thresholds makes it possible to calibrate the variables and obtain the fuzzy sets which range from 0 to 1. Although a set-theoretic analysis does not require the assumption that data are drawn from a given probability distribution and usually the calibration process is based on personal knowledge, we used standard distribution values for the calibration. For each variable, we identified the 20th, 50th and 80th percentiles as thresholds, where the 20th percentile is the threshold for full non-membership, the 80th percentile is the threshold for full membership and the 50th percentile represents the crossover point. The choice of using standard distribution values was made to avoid distortions due to subjective and arbitrary choices, since it is not possible to find any benchmark to refer to. The second step was the construction of the truth table, which lists all the possible configurations that can be obtained by combining the causal conditions/variables. The number of all possible configurations is 2k, where is the number of causal conditions, that is 4 in our case. In addition, the truth table shows how many cases fall into any particular configuration (frequency) and their consistency, which “refers to the degree to which cases correspond to the set-theoretic relationships (i.e., configurations) expressed in a solution” (Fiss, 2011, p.402). The third step was conducted selecting the configurations, among those listed in the truth table, which presented at least one solution frequency (since the research is based on a small sample) and at least the lowest acceptable level of consistency, which Ragin (2000, 2006, 2008) recommended at the level of 75%. The final step consisted in the identification of the solutions. The truth table algorithm uses Boolean algebra and a process known as counterfactual analysis of causal conditions to identify complex, intermediate and parsimonious solutions. The complex solution lists all the configurations leading to the presence of the outcome, whereas the intermediate and parsimonious solutions present other configurations, which derive from the ones listed in the complex solution, but include some simplifying assumptions. The configurations in the intermediate solution only include simplifying assumptions based on “easy counterfactual”, whereas the configurations in the parsimonious solution include all simplifying assumptions regardless of whether they are based on “easy” or “difficult counterfactual” (Fiss, 2011). As explained by Fiss (2011), easy counterfactuals answer the question “Would adding another condition make a difference?” (Fiss, 2011, p.403); difficult counterfactuals instead answer the question “Would removing a causal condition make a difference?” (Fiss, 2011, p.403). Consequently, “core conditions” are defined as those that are part of both parsimonious and intermediate solutions, whereas “peripheral conditions” are those that only compose the
Camuffo and Gerli The Financial Impact of Lean Transformations
669294-16
intermediate solutions. Core elements are those for which the evidence indicates a strong causal relationship with the outcome, whereas peripheral elements are those for which the evidence for a causal relationship with the outcome is weaker (Fiss, 2011). Table 5 shows the results for all the outcome variables considered in this research: LJ EBITDA, LJ ROIC, AI EBITDA, AI ROIC (one outlying firm was removed from the sample). The solutions table shows which elements of the configuration, marked with “Yes” are required to obtain the outcome; blank spaces in a solution indicate a “don’t care” situation in which the causal condition may be either present or absent. The same table also reports, for each solution, the Consistency score and the Solution Coverage score. The consistency has been defined above, whereas the coverage of a solution represents the percentage of membership in the outcome that is accounted by the complete solution (Ragin, 2008). Most of the solutions exhibit a high consistency degree and an acceptable overall coverage score, meaning that the chosen causal conditions explain well the companies’ membership to the high performing groups. By accepting only the solutions with a consistency degree higher than 0.75, the performance variable which better explains the configuration of elements seems to be the average increase in EBITDA and ROIC. On the opposite, the LJ variable seems to offer less consistent results (this is probably due to the fact that the values of the LJ variable depend only on the financial performances of the year 2011 and do not consider what happened during the whole lean journey). However, focusing on the valid solutions according to this consistency criterion, it is interesting to note that we obtain two kinds of configurations: the first one (outcome: AI Ebitda) includes all the considered variables (LAS, HIB, Years, Size), where LAS and Size can be considered as core variables and HIB and Years as peripheral. The second one (outcome: AI ROIC) includes HIB, Years and Size as core variables and does not consider LAS. Interestingly, none of the variables considered in our model has been explicitly excluded from the configurations, meaning that their contribution to the financial performance is confirmed. In addition, all the complex and intermediate solutions are identical, and so no “easy counterfactuals” were applied. This is probably due to the low number of causal conditions we used and to the fact that the complex solutions included all or almost all the elements. However, the identified solutions are consistent with the hypotheses of the model and with the configurational perspective of lean management. In fact, these results highlight the importance of all the elements we identified to obtain a higher financial performance. These solutions point out that the adoption, in a piecemeal fashion, of the techniques, tools and management practices typical of the lean management is not sufficient to achieve high performances, but has to be combined with the adoption of coherent management behaviors and with a constant application over time. The role of the size of the firm seems to emphasize the positive effect of a greater dimension on a correct and rigorous implementation of tools and behaviors, probably due to the impact of greater investments. Surprisingly, in the second analyzed solution, the role of tools and methods, represented by the LAS variable, appears even smaller. This may be a signal that even if a firm does not reach the highest level in terms of implementation of lean tools, it can effectively support its lean efforts through the adoption of coherent lean behaviors over an adequate period of time.

Camuffo and Gerli The Financial Impact of Lean Transformations
669294-17
TABLE 5. FS/QCA RESULTS. N=25.
Outcome: LJ EBITDA SOLUTIONS LAS HIB SIZE YEARS Solution Coverage Solution Consistency
Complex Yes Yes Yes Yes 0.41 0.73 Parsimonious Yes
Yes
0.49 0.68
Intermediate Yes Yes Yes Yes 0.41 0.73 Outcome: LJ ROIC
SOLUTIONS LAS HIB SIZE YEARS Solution Coverage Solution Consistency Complex
Yes Yes Yes 0.46 0.76
Parsimonious a
Yes Yes 0.53 0.69
Parsimonious b
Yes Yes Intermediate
Yes Yes Yes 0.46 0.76
Outcome: AI EBITDA SOLUTIONS LAS HIB SIZE YEARS Solution Coverage Solution Consistency
Complex Yes Yes Yes Yes 0.43 0.81 Parsimonious Yes
Yes
0.52 0.75
Intermediate Yes Yes Yes Yes 0.43 0.81 Outcome: AI ROIC
SOLUTIONS LAS HIB SIZE YEARS Solution Coverage Solution Consistency Complex
Yes Yes Yes 0.54 0.82
Parsimonious a
Yes Yes 0.66 0.75
Parsimonious b
Yes Yes Intermediate
Yes Yes Yes 0.54 0.82
Blank spaces in a solution indicate a “don’t care” situation in which the causal condition may be either present or absent
DISCUSSION AND CONCLUSIONS
Our results corroborate the perspective of lean environments as complex and integrated sociotechnical systems, confirming that the configurational approach is the most appropriate to analyze them. From this study emerges that the best performing lean companies, according to the adopted financial criteria, are those that wholly embrace the lean philosophy, follow its principles and apply its tools for years. This result confirms what has been described in many studies: lean tools and principles cannot be implemented in a fragmentary manner (Mann, 2005; 2009; Shah & Ward, 2003; 2007; Lucey et al., 2005). Firms truly committed in pursuing a lean transformation need to embrace its philosophy completely and persist with this choice for years. This implies that the partial adoption of a lean system does not make sense because it does not guarantee any performance improvement. The role of the “high involvement” management behaviors appears to be essential, as emerged from both our analysis (regression and fuzzy-set): the variable “high involvement” management behaviors resulted statistically significant as moderator in the regression analysis and was part of all the configurations leading to a high performance in the fuzzy-set analysis. Consequently, high involvement management behaviors create an environment where the lean techniques and tools can be more effective.

Camuffo and Gerli The Financial Impact of Lean Transformations
669294-18
Our results also show that the firms that have been committed to the adoption of lean principles for a longer time tend to outperform their industry, in particular in the last years of transformation, improving their profitability ratios at a faster pace than that of their competitors. Our data show a typical performance worsening that occurs during the very first years of lean transformation, that can represent a source of discouragement for the firms and that, together with poor leadership and cultural resistances to change, may be a significant reason of failure of lean initiatives. On the other side, we also show that the companies that keep investing in lean tools and processes are the ones that in the long run outperform their industries on a regular basis and gain a remarkable competitive advantage. The importance of maintaining a lasting and strong commitment towards the lean principles throughout the whole lean journey is highlighted also by many other facts: the strong correlation of the variable Years with the other independent variables that measure the degree of implementation of a lean system and its related managerial behaviors, and the presence of the variable Years in the configurations leading to high performances identified with the fuzzy-set analysis. The most successful firms are the ones committed for five years or more in their transformation, namely the companies that did not give up the continuous improvement process after the first difficulties. As a matter of fact, the longer a company lean effort the higher its mastery of the lean techniques and tools. Moreover, a lasting commitment to the lean principles helps to reinforce the company culture. This study also presents some strong managerial implications. Indeed, it underlines the importance of: a) taking a serious and lasting commitment to change and keep investing in improving the processes throughout the whole lean journey, since lean investments start to repay after a couple of years; b) embracing completely the lean philosophy adopting not only the visible and hard tools and techniques, but giving particular attention to the invisible and soft part of the system: lean principles and management behaviors; c) adopting the list of high involvement management behaviors as a guide, since they are behaviors that are the foundations of the lean management. Finally, this study presents some limitations. First of all, it is based on a small sample that strongly limited the results of the traditional quantitative methods, which usually require far larger samples. Moreover, 35% of the companies in the sample are late adopters, so for these companies it was impossible to study the evolution of their performance over a five-years period. Consequently these data have been used only to evaluate the performance in the first couple of years of lean transformation. In addition, this study takes into consideration the financial performances of a period of time characterized by the economic crisis and for this reason, even if the dependent variables of this study have been adjusted according to the industry dynamics, their value might have been biased. Furthermore, a couple of firms in the sample were harshly hit by the economic juncture and ended up in a company crisis. Future research should try to work with larger cross-national samples, studying the performance evolution over a longer period of time, and should focus on specific industries studying the dynamics of lean systems adoption and the performance trends of homogeneous groups of companies.
REFERENCES
Ambrosini, V., & Bowman, C. (2001). Tacit knowledge: some suggestions for operationalization. Journal of Management Studies, 38, 811–829.

Camuffo and Gerli The Financial Impact of Lean Transformations
669294-19
Anand, G., Ward, P., Tatikonda, M., & Schilling, D. (2009). Dynamic capabilities through continuous improvement infrastructure. Journal of Operations Management, 27(6), 444-461.
Bateman N. (2005). Sustainability: the elusive element of process improvement. International Journal of Operations & Production Management, 25(3), 261–276.
Camuffo, A., & Gerli, F. (2012). Modeling management in lean production environments: a study of Italian SMEs. Decision Sciences Institute Annual Meeting, Conference Proceedings, San Francisco, 17-20 November.
Chandler, G. N., & McEvoy, G. M. (2000). Human Resource Management, TQM, and Firm Performance in Small and Medium-Size Enterprises. Entrepreneurship: Theory and Practice, 25(1), 43-57.
De Menezes, L.M., Wood, S., & Gelade, G. (2010). The integration of human resource and operation management practices and its link with performance: a longitudinal latent class study. Journal of Operations Management, 28(6), 455-471.
Delery, J.E., & Doty, D.H. (1996). Modes of theorizing in strategic human resource management: Tests of universalistic, contingency, and configurational performance predictions. Academy of Management Journal, 39(1), 802–835.
Emiliani, B., Stec, D. J., Grasso, L., & Stodder, J. (2007). Better thinking, better results: case study and analysis of an enterprise-wide lean transformation. Center for Lean Business Management, Kensington, Conn.
Fiss, P.C. (2007). A set-theoretic approach to organizational configurations. Academy of Management Review, 32(1), 1180–1198.
Fiss, P. C. (2009). Case studies and the configurational analysis of organizational phenomena. In C. Ragin & D. Byrne (Eds.), Handbook of case study methods:424–440. Thousand Oaks, CA: Sage.
Fiss, P.C. (2011). Building Better Causal Theories: A Fuzzy Set Approach to Typologies in Organization Research. Academy of Management Journal, 54(2), 393–420.
Flanagan, J. C. (1954). The critical incident technique. Psychological Bulletin, 51, 327-335.
Found, P.A., & Harvey, R. (2006). The role of leaders in the initiation and implementation of manufacturing process change. The International Journal of Knowledge, Culture and Change management, 6(1), 35-46.
Fujimoto, T. (1999). The evolution of a manufacturing system at Toyota. New York: Oxford University Press.
Ghoshal, S., & Bartlett, C. A. (1994). Linking organizational context and managerial action: the dimensions of quality of management. Strategic Management Journal, 15, 91-112.

Camuffo and Gerli The Financial Impact of Lean Transformations
669294-20
Hart, C., & Schlesinger, L. (1991). Total quality management and the human resource professional: Applying the baldrige framework to human resources. Human Resource Management, 30, 433–454.
Katz, D., & Kahn, R.L. (1978). The social psychology of organizations. New York: Wiley.
Liker, J.K. (2004). The Toyota Way: 14 management principles from the world’s greatest manufacturer. New York: McGraw-Hill.
Liker, J.L, & Convis, G.R. (2012). The Toyota way to lean leadership: achieving and sustaining excellence through leadership development. New York: McGraw-Hill.
Liker, J.K., & Franz, J.K. (2011). The Toyota way to continuous improvement. New York: McGraw-Hill.
Liker, J.K., & Hoseus, M. (2008). Toyota culture. The heart and soul of the Toyota way. McGraw-Hill: New York.
Liker, J.K., & Meier, D.P. (2007). Toyota talent: developing your people the Toyota way. New York: McGraw-Hill.
Luce, R. D. (1956). Semiorder and a theory of utility discrimination. Econometrica, 24(2), 178-191.
Lucey, J., Bateman, N., & Hines, P. (2005). Why major lean transitions have not been sustained. Management Services, 49(2), 9-13.
Mann, D. (2005). Creating a Lean Culture: Tools to Sustain Lean Conversions. New York: Productivity Press.
Mann, D. (2009). The Missing Link: Lean Leadership. Frontiers of Health Services Management, 26(1), 15-26.
Maskell, B., & Baggaley, B. (2003). Practical Lean Accounting. New York: Productivity Press.
Meyer, A., Tsui, A., & Hinings, C. R. (1993). Configurational approached to organizational analysis. Academy of Management Journal, 36(10), 1175-1195.
Ohno, T. (1988). Toyota Production System: Beyond large scale production. Cambridge (MA): Productivity Press.
Powell, T. (1995). Total quality management as competitive advantage: A review and empirical study. Strategic Management Journal, 16, 15-37.
Ragin, C. C. (1987). The comparative method: Moving beyond qualitative and quantitative strategies. Berkeley: University of California Press.
Ragin, C.C. (2000). Fuzzy set social science. Working Paper. Chicago: University of Chicago Press.

Camuffo and Gerli The Financial Impact of Lean Transformations
669294-21
Ragin, C.C. (2006). Set relations in social research: Evaluating their consistency and courage. Political Analysis, 14(1), 291–310.
Ragin, C. C. (2008). Redesigning Social Inquiry: Fuzzy Sets and Beyond. Working Paper. Chicago: University of Chicago Press.
Ragin, C. C., & Fiss, P. C. (2008). Net effects analysis versus configurational analysis: An empirical demonstration. In C. C. Ragin (Ed.), Redesigning social inquiry: Set relations in social research. University of Chicago Press, Chicago, 190-212.
Rother, M. (2009). Toyota Kata: Managing people for improvement, adaptiveness and superior results. New York: McGraw Hill.
Sato, M. (2008). The Toyota leaders. An executive guide. New York: Vertical.
Shah, R., & Ward, P.T. (2003). Lean Manufacturing: Context, practice bundles, and performance. Journal of Operations Management, 21(2), 129–150.
Shah, R., & Ward, P.T. (2007). Defining and developing measures of lean production. Journal of Operations Management, 25(4), 785-805.
Shook, J. (2008). Managing to learn: Using the A3 management process to solve problems, gain agreement, mentor, and lead. Working Paper. Cambridge: The Lean Enterprise Institute.
Spear, S. (2004). Learning to lead at Toyota. Harvard Business Review, May, 78-86.
Spear, S., & Bowen, H. K. (1999). Decoding the DNA of the Toyota Production System. Harvard Business Review, 77(9 and 10), 97-106.
Spencer, L. M. Jr., & Spencer, S. M. (1993). Competence at work: models for superior performance. New York: John Wiley and Sons.
Stevens, S., & Stone, G. (1959). Ratio scale, category scale, and JND scale. Journal of Experimental Psychology 57(2), 91-95.
Womack, J.P. (2008). Modern Management versus Lean Management. http://www.leanuk.org/downloads/jim/jim_eletter_200810.pdf
Womack, J.P. (2011). Gemba walks. Cambridge: Lean Enterprise Institute.
Womack, J.P., & Jones, D.T. (1996). Lean Thinking. Banish waste and create wealth in your corporation. New York: Simon and Schuster.
Womack, J.P., Jones, D.T., & Roos, D. (1990). The machine that changed the world. New York: MacMillan Press.
Wood, N. (2004). Making it stick: Sustaining your improvements. Management Services, 48(7), 20-23.

Camuffo and Gerli The Financial Impact of Lean Transformations
669294-22
Youndt, M. A., Snell, S. A., Dean, J. W., & Lepak, D. P. (1996) Human resource management, manufacturing strategy, and performance. Academy of Management Journal, 39, 836–866.