THE FINANCIAL BENEFITS OF WATER CONSERVATION: THE TUCSON STORY · the financial benefits of water...
27
THE FINANCIAL BENEFITS OF WATER CONSERVATION: THE TUCSON STORY CANDICE RUPPRECHT WATER CONSERVATION MANAGER TUCSON WATER PETER MAYER, P.E. PRINCIPAL WaterDM MARY ALLEN, P.E. BUSINESS PROCESS IMPROVEMENT PIMA COUNTY REGIONAL WASTEWATER RECLAMATION
Transcript of THE FINANCIAL BENEFITS OF WATER CONSERVATION: THE TUCSON STORY · the financial benefits of water...

THE FINANCIAL BENEFITS OF WATER CONSERVATION: THE TUCSON STORY
CANDICE RUPPRECHT
WATER CONSERVATION
MANAGER
TUCSON WATER
PETER MAYER, P.E.
PRINCIPAL
WaterDM
MARY ALLEN, P.E.
BUSINESS PROCESS IMPROVEMENT
PIMA COUNTY REGIONAL WASTEWATER
RECLAMATION

AWE AVOIDED COST STUDY
• Alliance for Water Efficiency grant funds from Walton
Family Foundation focused on Colorado River Basin
Initiative
• WaterDM and City of Westminster Study
• Tucson, AZ and Gilbert, AZ selected to participate
• Goal of the study is to examine the impact of increased
water use efficiency on customer rates

WATER USE IN THE US, 1900 - 2010
Includes fresh and saline
water. Source USGS and
Pacific Institute 2015

M&I WATER USE IN THE US, 1900 - 2010
Source USGS and
Pacific Institute 2015

TUCSON WATER ANNUAL PRODUCTION (1940-2016)
CAP ProductionPotable Production TARP Production Reclaimed Production
0
20,000
40,000
60,000
80,000
100,000
120,000
140,000
Wate
r P
rod
ucti
on
fo
r T
W S
erv
ice A
rea (
Acre
-Feet)
1940 1950 1960 1970 1980 1990 2000 2010Year
2016 2016
CAP
Reclaimed
Water
TARP
Total Potable Water Use at 1985 Level

RESIDENTIAL INDOOR GPCD
69.3
58.6
36.7
0.0
10.0
20.0
30.0
40.0
50.0
60.0
70.0
80.0
REU1999 REU2015 High-Efficiency (Aquacraft2011d)
Ind
oo
r A
vera
ge G
allo
ns
Per
Cap
ita
Per
Day
(gp
cd)
Source: Water Research Foundation (2016) Residential End Uses of Water Update – #4309.
Denver, CO.
1999 vs. 2016 =
15.4% reduction
2016 vs. HE =
37.4% reduction

INDOOR GPCD COMPARISON
ToiletClotheswasher
Shower Faucet Leak Other Bath Dishwasher
REU1999 18.5 15.0 11.6 10.9 9.5 1.6 1.2 1.0
REU2015 14.2 9.6 11.1 11.1 7.9 2.5 1.5 0.7
0
2
4
6
8
10
12
14
16
18
20
Gal
lons
per
cap
ita
per
day
(gpc
d)
Source: Water Research Foundation (2015) Residential End Uses of Water Update – #4309. Denver,
CO.
Statistically significant
reductions in:
• Clothes washer
• Toilet
• Dishwasher
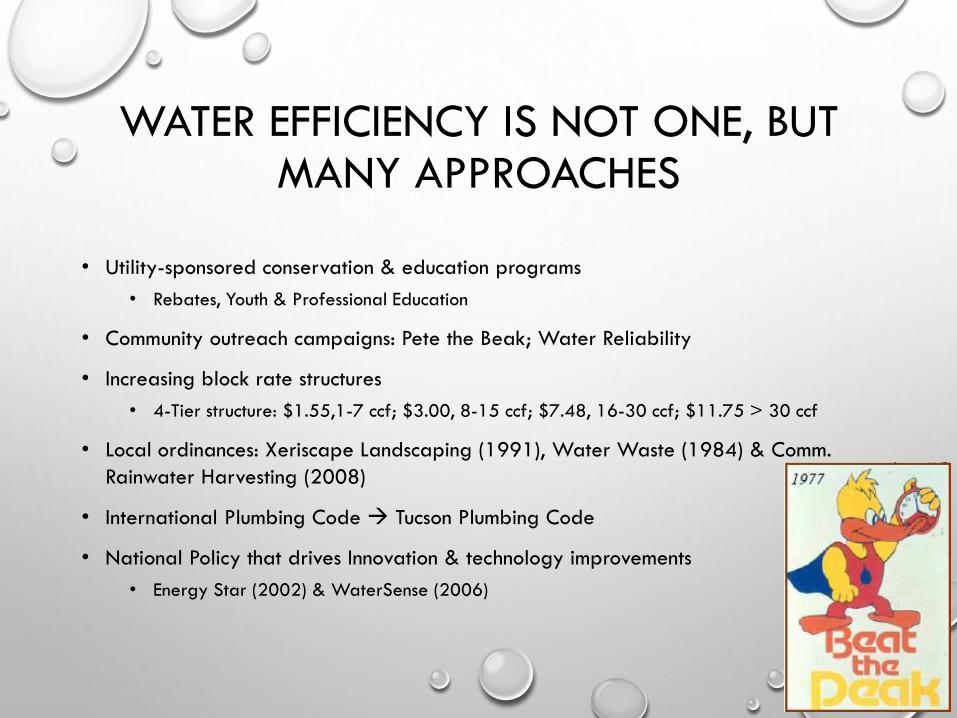
WATER EFFICIENCY IS NOT ONE, BUT MANY APPROACHES
• Utility-sponsored conservation & education programs
• Rebates, Youth & Professional Education
• Community outreach campaigns: Pete the Beak; Water Reliability
• Increasing block rate structures
• 4-Tier structure: $1.55,1-7 ccf; $3.00, 8-15 ccf; $7.48, 16-30 ccf; $11.75 > 30 ccf
• Local ordinances: Xeriscape Landscaping (1991), Water Waste (1984) & Comm.
Rainwater Harvesting (2008)
• International Plumbing Code Tucson Plumbing Code
• National Policy that drives Innovation & technology improvements
• Energy Star (2002) & WaterSense (2006)

0
20
40
60
80
100
120
140
160
180
19
85
19
86
19
87
19
88
19
89
19
90
19
91
19
92
19
93
19
94
19
95
19
96
19
97
19
98
19
99
20
00
20
01
20
02
20
03
20
04
20
05
20
06
20
07
20
08
20
09
20
10
20
11
20
12
20
13
20
14
20
15
SF H
ou
seh
old
Avg
. An
nu
al U
se (
CC
F)
1960s & 1970s
Typical landscape
Preferences shift…
A typical landscape today
SINGLE FAMILY AVG. ANNUAL USE 1985 - 2015
Present-day
Typical landscape

0
20
40
60
80
100
120
140
160
180
200
Syst
em G
PC
DTOTAL SYSTEM GPCD
1980 - 2015


188
130
105
78
512,000
717,875
-
20
40
60
80
100
120
140
160
180
200
1989 2015
-
100,000
200,000
300,000
400,000
500,000
600,000
700,000
800,000
Gallo
ns
per
Capita P
er
Day
Popul
ation
System Per Capita Water Use (gallons/day)
System Per Capita Wastewater Use (gallons/day)
Service Area Population
POPULATION AND PER CAPITA WATER AND WASTEWATER USE

1989: 188 / 107 gpcd
Pop. 512,000
2015: 130 / 79 gpcd
Pop. 717,875
96.493.3
134.4
54.0 56.2
80.0
0.0
20.0
40.0
60.0
80.0
100.0
120.0
140.0
160.0
1989 2015 2015 Hypothetical
Avg
. D
aily
Pro
duc
tion/
Flo
w (M
GD
)
Water Wastewater
HYPOTHETICAL, NON-CONSERVING WATER DEMAND
Daily Water
Production &
Wastewater Flows:
-1989 actual
- 2015 actual
- 2015 hypothetical

“WHY ARE MY RATES GOING UP AGAIN WHEN
I KEEP CONSERVING WATER?!”
• Due to conservation, per capita water use in Tucson has
dropped 45% and wastewater by 35% since 1989.
• Yet…. costs to customers continue to increase.
• Some customers are confused and frustrated.
• What is the impact on water and wastewater rates
due to conservation?

WATER SYSTEM AVOIDED COSTS
• Water Treatment Infrastructure
• Pumping & transmission expansion
• Water Resources
• Operating Costs
How Much Additional Cost
to Tucson Water meet non-
conserving, hypothetical
demand of 134 mgd?

WASTEWATER SYSTEM AVOIDED COSTS
• 2015 Avg. Daily Flow ~ 56.2 MGD
• Hypothetical Non-Conserving Avg. Daily Flow ~ 80 MGD
• Current System Max. Treatment Ability ~ 95 MGD
• In this analysis, wastewater treatment capacity water increased
to 107 MGD to meet Hypothetical Non-Conserving Daily Flow
range
What additional wastewater
system infrastructure and costs to
meet 80 mgd avg. daily flow?
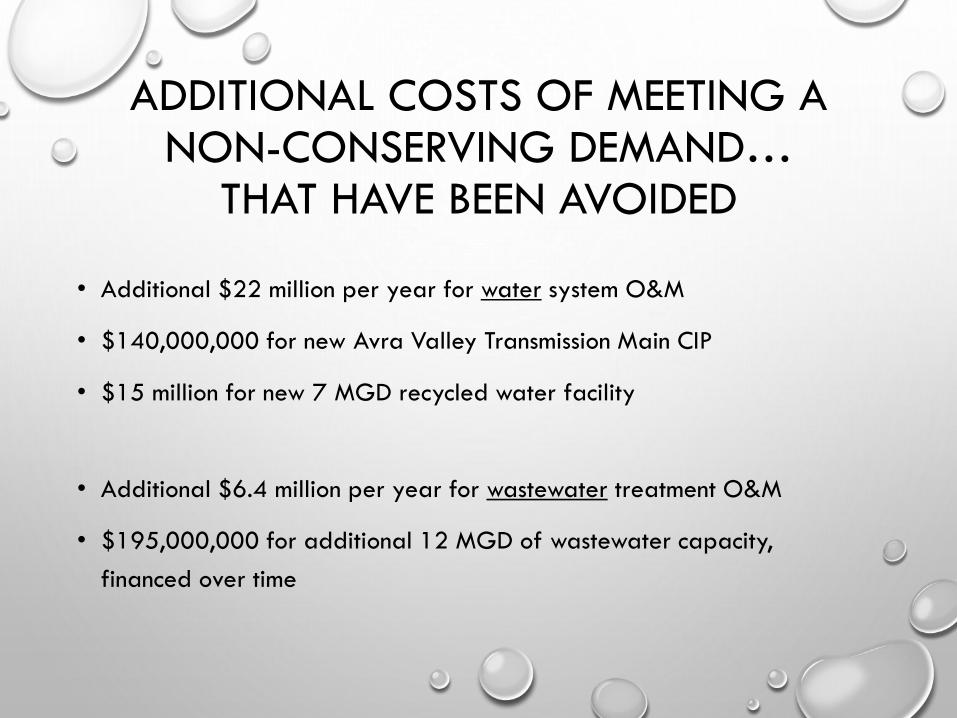
ADDITIONAL COSTS OF MEETING A NON-CONSERVING DEMAND…
THAT HAVE BEEN AVOIDED
• Additional $22 million per year for water system O&M
• $140,000,000 for new Avra Valley Transmission Main CIP
• $15 million for new 7 MGD recycled water facility
• Additional $6.4 million per year for wastewater treatment O&M
• $195,000,000 for additional 12 MGD of wastewater capacity,
financed over time

CUSTOMER RATE IMPACT
• Current avg. single-family, water customer uses 98.9 ccf/year, and pays
for 84 ccf/year of wastewater treatment.
• At current water rates, the avg. single-family customer pays $847 per year
for water and sewer.
• Under the non-conserving scenario (assuming 188 gpcd) the average
single-family customer would pay $976 per year for water and sewer.
Due to water efficiency, rates today are nearly
15.3% LOWER than otherwise necessary.

74.0
97.2
63.0
82.8$847
$976
$-
$200
$400
$600
$800
$1,000
$1,200
0
20
40
60
80
100
120
2015 Actual Non-Conserving Hypothetical
Ann
ual W
ate
r &
Wast
ew
ate
r Bill
-$
Ann
ual W
ate
r and
Wast
ew
ate
r U
se (kg
al)
Impact to an Average Single-Family Customer - Tucson, AZ
Water Use (kgal) Wastewater Discharge (kgal) Annual Water & Wastewater Bill - $

BREAKDOWN OF AVOIDED COSTS
Water Transmission, 11.8%
Reclaimed Water, 0.0%
Interest and Debt Service, 17.0%
Water Treatment Operation, 38.6%
Wastewater Treatment, 21.8% Wastewater Treatment
Operation, 10.8%
Tucson Water rates are
22.3% lower today and
Pima County WR rates are
7.8% lower today
than otherwise necessary if
per capita water demand
had not been reduced.

STRENGTH OF SEWER FLOWS
216
429
205
338
22781
20424
18000
18500
19000
19500
20000
20500
21000
21500
22000
22500
23000
23500
0
50
100
150
200
250
300
350
400
450
500
2000 2001 2002 2003 2004 2005 2006 2007 2008 2009 2010 2011 2012 2013 2014 2015 2016
Flo
w in
Mill
ion
Gal
lon
s/ye
ar
Ave
rage
Str
engt
h (
mg/
L)/y
ear
TSS BOD Combined Influent Flows for Agua Nueva and Tres Rios

IMPACT TO THE SEWER PIPES
• Scour velocities may take longer to attain in
newer developments with lower flows
• Flushing of pipes may be required
• Potential for more odors in pipes
• Potential for corrosion in pipes
• Terminal ends may require steeper slopes
• Cost goes up for deeper sewers

FLUSHING THE PIPES
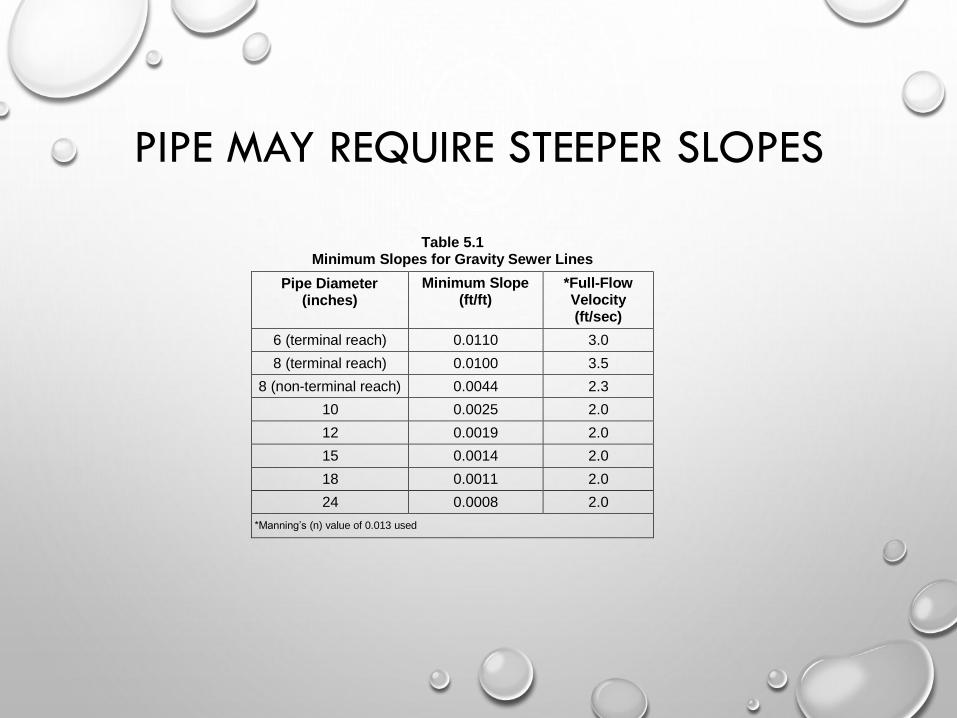
PIPE MAY REQUIRE STEEPER SLOPES
Table 5.1 Minimum Slopes for Gravity Sewer Lines
Pipe Diameter (inches)
Minimum Slope (ft/ft)
*Full-Flow Velocity (ft/sec)
6 (terminal reach) 0.0110 3.0
8 (terminal reach) 0.0100 3.5
8 (non-terminal reach) 0.0044 2.3
10 0.0025 2.0
12 0.0019 2.0
15 0.0014 2.0
18 0.0011 2.0
24 0.0008 2.0
*Manning’s (n) value of 0.013 used

ODORS AND CORROSION

Bottom Line: When Everyone Conserves, Everyone Saves
• Water and wastewater rates have increased because of the increasing
costs of providing 24/365 service, while maintaining and improving
infrastructure to meet regulatory treatment requirements.
• Decreasing demands are a balancing act: Revenue v. Resources
• The typical Tucson single-family customer pays 15% less today,
than they would need to be if water efficiency had not been
achieved.

QUESTIONS & DISCUSSIONTHANK YOU!