The Fifth Annual Assessment Conference of the Association ...
96
2015 AALHE “Actionable Assessment” Conference Proceedings |1 The Fifth Annual Assessment Conference of the Association for the Assessment of Learning in Higher Education (AALHE) “Actionable Assessment” June 1 – 3, 2015 Lexington, Kentucky Proceedings
Transcript of The Fifth Annual Assessment Conference of the Association ...

2015 AALHE “Actionable Assessment” Conference Proceedings |1
The Fifth Annual Assessment Conference of the
Association for the Assessment of Learning in Higher Education (AALHE)
“Actionable Assessment”
June 1 – 3, 2015
Lexington, Kentucky
Proceedings

2015 AALHE “Actionable Assessment” Conference Proceedings |2
I am pleased to share with you the second edition of the AALHE Conference Proceedings. The proceedings consist of session topics that were presented at our most recent conference June 1-3, 2015 in Lexington, KY. While all sessions were eligible for inclusion, only those presenters that submitted a paper for review and then approved by the editors are included. The AALHE Annual Assessment Conference is an effort to connect and provide professional development for assessment practitioners in higher education. The conference remains one of the best resources for advanced assessment professionals. This year, our conference focused on ‘Actionable Assessment’. Below you will find many topics that focus on the, How of Assessment; examples of the great work our colleagues are doing to take action to improve student learning. I do hope that each of you left the conference with at least one new idea or best practice that you can take home to your institutions. Please read through this document and feel free to contact those presenters whose ideas have sparked interest for you. It is with continuous networking, collegial communications, and sharing of knowledge and experience that we can continue to grow and support assessment practitioners across the world. Tara A. Rose, President Association for the Assessment of Learning in Higher Education Director of University Assessment, Office of University Assessment, University of Kentucky

2015 AALHE “Actionable Assessment” Conference Proceedings |3
AALHE is a professional association for assessment practitioners at colleges, universities, and higher education support organizations. It provides resources and a forum to support assessment practitioners’ professional development and the open discussion of issues, strategies, policies, and processes associated with higher education’s use of assessment as a tool to improve student learning and institutional effectiveness in fostering student success.
Edited by Dr. Ed Cunliff and Ms. Tracey Romano University of Central Oklahoma

2015 AALHE “Actionable Assessment” Conference Proceedings |4
AALHE BOARD OF DIRECTORS
David Eubanks, Eckerd College Susan Hatfield, Winona State University Joan Hawthorne, University of North Dakota Oscar Hernández, Texas Southmost College David Jordan, Emory University Jonathan Keiser, City Colleges of Chicago Robert Pacheco, MiraCosta College Jeremy Penn, North Dakota State University Eric Riedel, Walden University Tara Rose, University of Kentucky Monica Stitt-Bergh, University of Hawai‘i at Mānoa Marsha Watson, National Louis University Catherine Wehlburg, Texas Christian University

2015 AALHE “Actionable Assessment” Conference Proceedings |5
Table of Contents
Data Envelopment Analysis for Assessment and Institution Effectiveness Practitioners 7
Taiwo Ande, Christopher Garcia
Cheyney University's Experience of Ten Year Re-affirmation of Accreditation Self-Study Process 13
Phyllis W. Dawkins, Sesime K. Adanu, Shayla M. Prince
How to Help Faculty Make Better Rubrics 20 David K. Dirlam
Simple Predictors 29 David Eubanks
Organizing (Actionable) Home-Grown Assessments for Key Institutional Outcomes 36
Joan Hawthorne
A Guide to Curriculum and Accreditation Mapping using ExamSoft © Categories and Blueprint 41
Alisha H. Johnson, Mary-Margaret S. Finney
A Model for Impacting Teacher Effectiveness 47 Tara Rose, Beth Ettensohn, Sara Jewell
Detecting, Measuring, and Acting on "Susceptibility to Intervention" 64 Adam Ross Nelson
Assessment and Accreditation: An Institutional Collaborative Model 71 Stacy Sculthorp, Jeremie Bellenir, Heather Schroeder
2015 AALHE “Actionable Assessment” Conference Proceedings |6
Graduate Programs: Shifting the Mindset from Individual-Student to Program-Level Assessment 75
Monica Stitt-Bergh
When Standardized Tests Give Sorry Results 80 Janet Thiel
Understanding Student Learning 85 Dave Veazey
Emergent Assessment: Assessing Learning That We Don't Expect 92 Catherine M. Wehlburg

2015 AALHE “Actionable Assessment” Conference Proceedings |7
Data Envelopment Analysis for Assessment and Institution Effectiveness Practitioners
Taiwo Ande
Office of Institutional Analysis and Effectiveness University of Mary Washington
Fredericksburg, VA 22401 [email protected]
Christopher Garcia College of Business
University of Mary Washington Fredericksburg, VA 22401
Abstract
There are significant challenges encountered when attempting to assess and compare the performance of diverse academic departments within a university. Departments vary in size and resources allocated, and different disciplines by their very nature prioritize objectives differently. In this paper we show how Data Envelopment Analysis (DEA) can be used to provide a more objective assessment of departmental performance. DEA is a non-parametric method for assessing the relative performance of multiple decision-making units by making comparisons based on the most favorable efficiency score possible for each unit. We present an overview of DEA and a short case study using R. Keywords: data envelopment analysis; performance; effectiveness; university; department
Data Envelopment Analysis for Assessment and Institution Effectiveness
Introduction
Performance evaluation is an important task in the management of any organization. By understanding the relative performance of the key divisions within the organization, decision-makers can better predict outcomes and plan accordingly. Moreover, this knowledge allows the organization to more appropriately reward higher-producing divisions and formulate intervention measures for improving lower-producing ones. It is becoming increasingly important for universities to be able to understand and manage departmental performance, especially in light of the many instances of declining funding and increasing competition.
Objectively assessing and comparing academic departmental performance within a university setting can be a formidable challenge. One aspect of this has to do with the numerous incongruences in departmental resources and capabilities. Some departments, for example, are

2015 AALHE “Actionable Assessment” Conference Proceedings |8
large and have many faculty and students, while others are much smaller. Or some departments may have significant endowments while others have little or none. To further complicate matters, different academic disciplines will inherently prioritize goals and performance measures differently. Some programs may place special emphasis on undergraduate research participation; others may prize graduate school admissions most highly, while yet others may place the number of departmental publications or total grant funds at the highest priority. Thus, the vast differences in resources and capabilities that exist between departments coupled with inherently different goal priorities and performance measures makes it difficult to conceive how the performance of academic programs within departments may be objectively compared to one another.
Data Envelopment Analysis (DEA) is a non-parametric technique which provides an objective means of comparison between different decision-making units (such as academic departments). DEA in its modern form was first proposed in (Charnes et al., 1978). Since that time, DEA has been used in a wide variety of contexts including hospital performance assessment (Kuntz and Vera, 2007; Vera and Kuntz, 2007), police force assessment (Thanassoulis, 1995), assessing performance of service organizations (Sherman and Zhu, 2013), and productivity at the American Red Cross (Pasupathy and Medina-Borja, 2008) to name a few. In this paper we provide an overview of DEA and show how it may be applied to compare performance of academic departments within a university.
Data Envelopment Analysis
Under the DEA framework there is a set of inputs and outputs. Inputs may be conceived as resources or capabilities allocated to a department (such as number of faculty or quality of student) while outputs are conceived as different performance measures (such as number of graduating students or number of departmental publications). Efficiency may be thought of as the total output divided by total input, ranging from 0 to 100%. The definitions of “total input” and especially “total output” may vary by department. For instance, departments which value research output most highly will place a higher weight on publications versus teaching evaluations. DEA computes an efficiency score for each decision-making unit (departments in our case) by finding optimal input and output weights to maximize the output for each department. This allows performance to be compared while assuming the most favorable performance possible for each department.
Finding the highest possible efficiency for a given department is a type of constrained optimization problem. DEA utilizes linear programming (LP) to accomplish this. LP is a widely-used optimization method in operations research and has been applied on numerous real-world problems. For an overview of LP the reader is directed to (Dantzig and Thapa, 1997). To formulate our LP model for finding the maximal efficiency possible for a given department we begin by defining the following:
𝐷𝐷 = Set of academic departments 𝑋𝑋 = Set of inputs 𝑌𝑌 = Set of outputs 𝑥𝑥𝑖𝑖 = Price (or weight) of input 𝑖𝑖 𝑦𝑦𝑖𝑖 = Price (or weight) of output 𝑖𝑖

2015 AALHE “Actionable Assessment” Conference Proceedings |9
𝑎𝑎𝑖𝑖𝑖𝑖 = Amount of input 𝑖𝑖 allocated to department 𝑗𝑗 𝑏𝑏𝑖𝑖𝑖𝑖 = Amount of output 𝑖𝑖 resulting from department 𝑗𝑗
Weights 𝑥𝑥𝑖𝑖 and 𝑦𝑦𝑖𝑖 each range from 0 to 1 as does efficiency (since it is not possible to have greater than 100% efficiency). Efficiency is defined as total weighted output divided by total weighted input. Putting this all together more precisely, we have the following:
Efficiency of department 𝑗𝑗 =∑ 𝑏𝑏𝑖𝑖𝑖𝑖𝑖𝑖∈𝑌𝑌 𝑦𝑦𝑖𝑖∑ 𝑎𝑎𝑖𝑖𝑖𝑖𝑥𝑥𝑖𝑖𝑖𝑖∈𝑋𝑋
≤ 1 ≡�𝑏𝑏𝑖𝑖𝑖𝑖𝑦𝑦𝑖𝑖𝑖𝑖∈𝑌𝑌
≤�𝑎𝑎𝑖𝑖𝑖𝑖𝑥𝑥𝑖𝑖𝑖𝑖∈𝑋𝑋
(1)
DEA aims to maximize the weighted output for the department by setting input and output weights subject to the following constraints: 1) input weights sum to 1, and 2) the total weighted output of any department does not exceed its weighted input (so not to exceed 100% efficiency). The model is formulated as follows:
Maximize �𝑏𝑏𝑖𝑖𝑖𝑖𝑦𝑦𝑖𝑖𝑖𝑖∈𝑌𝑌
(2)
Subject To:
�𝑥𝑥𝑖𝑖𝑖𝑖∈𝑋𝑋
= 1 (3)
�𝑏𝑏𝑖𝑖𝑖𝑖𝑦𝑦𝑖𝑖𝑖𝑖∈𝑌𝑌
≤�𝑎𝑎𝑖𝑖𝑖𝑖𝑥𝑥𝑖𝑖𝑖𝑖∈𝑋𝑋
∀𝑗𝑗 ∈ 𝐷𝐷 (4)
𝑥𝑥𝑖𝑖, 𝑦𝑦𝑖𝑖 ≥ 0 ∀𝑖𝑖 ∈ 𝑋𝑋, 𝑗𝑗 ∈ 𝑌𝑌 (5)
The objective function in (2) is simply the total weighted output. Constraint (3) ensures the input weights sum to 1. Finally, constraints in (4) and (5) together ensure that the selected weights result in efficiency scores between 0 and 1when applied to any department.
After solving this model for a given department𝑗𝑗, dividing the left-hand side of constraint (4) by the right-hand side will give the best possible efficiency score for department. By computing this score for each department, an objective performance comparison can be made between departments.
Case Study: Assessing Departmental Performance in a Liberal Arts University
In Table 1, (excluding the far-right column) a dataset is shown which contains a number of different measures for each department in a liberal arts university for an academic year. Table 1: Departmental data for an academic year and corresponding DEA efficiencies

2015 AALHE “Actionable Assessment” Conference Proceedings |10
Department Num.
Graduates Satisfaction Total SCH
Department FTEs fac.
Cost of Instruction
DEA Efficiency
ARTD 40 0.9063 3585 8.95 $772,909.00 0.9711 BIOL 79 0.9038 7516 16.65 $1,659,501.00 0.9746 BUAD 114 0.8468 12396 29.95 $2,757,235.00 1.0000 CLPR 57 0.9464 6578 14.63 $1,286,458.00 0.9434 CPSC 33 0.8750 3207 8.97 $721,303.00 1.0000 ECON 24 0.9167 4195 7.65 $729,319.00 1.0000 ENLS 131 0.9324 12631 30.61 $2,506,213.00 1.0000 ESGE 22 1.0000 2917 7.33 $705,519.00 1.0000 GEOG 40 0.9375 4210 9.65 $763,556.00 1.0000 HYAS 83 0.9630 6255 16.31 $1,033,929.00 1.0000 MATH 26 1.0000 7556 16.3 $1,150,457.00 1.0000 MUSC 9 0.5000 2609 10.29 $778,983.00 0.9057 PSIA 83 0.9474 4331 11.32 $850,834.00 1.0000 PSYC 101 0.9435 7543 16.31 $1,328,366.00 1.0000 SOAN 64 0.9405 5123 11.66 $868,808.00 1.0000
In this dataset there are three measures which can be thought of as measures of departmental output: 1) number of graduates, 2) student satisfaction scores, and 3) total student credit hours (SCH). A cursory look at these columns shows a wide amount of variation in these output measures, and departments excel differently based on different output measures. There are also two types of resources allocated to departments (or inputs): 1) number of faculty full-time equivalents (FTEs), and 2) cost of instruction. Likewise, the inputs also have significant variation between departments. The DEA efficiency scores are shown in the rightmost column. These were computed using the Benchmarking package in the R statistical computing environment (Benchmarking, 2015; R, 2015).
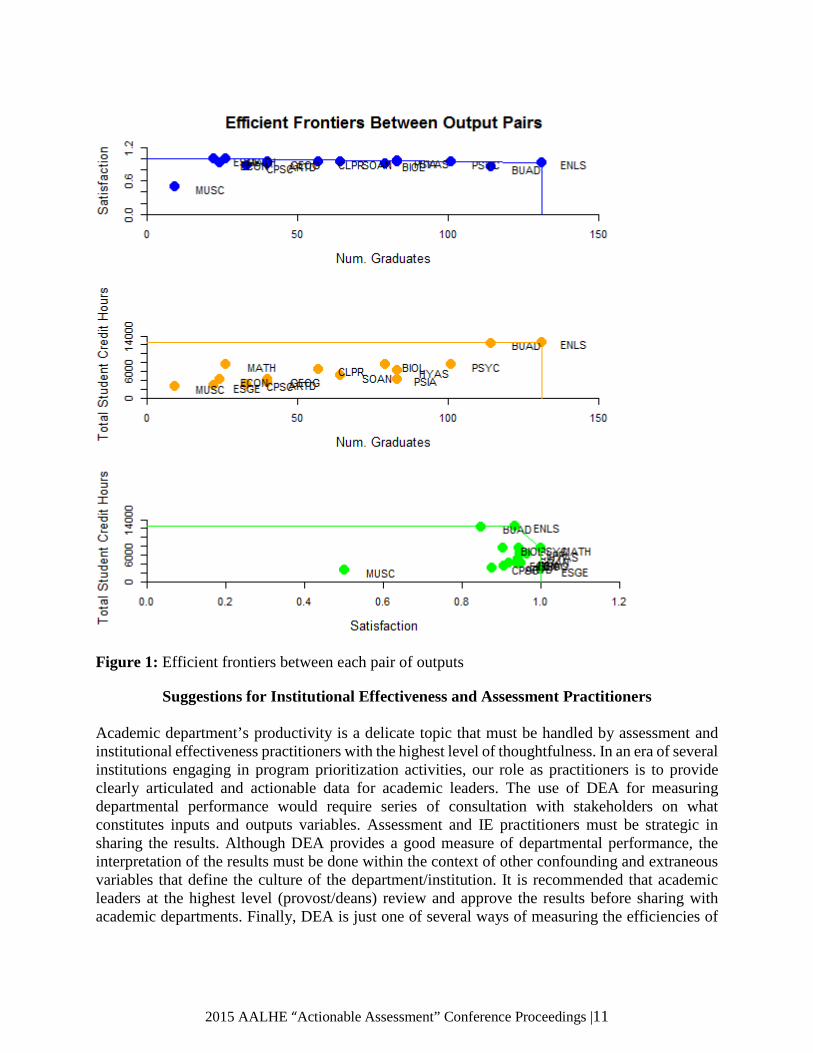
The DEA scores show that most departments can make the case that they are operating at 100% efficiency, while all departments are operating at >90% efficiency. The efficiency frontiers between every pair of outputs are shown below in Figure 1. The outer line shows the tradeoff boundary between the two outputs, where one output cannot be increased without decreasing the other. All departments operating at 100% DEA efficiency will fall on a frontier in at least one pair of outputs.
As a final note, we point out that in order for DEA to truly provide a meaningful comparison it is essential that an appropriate set of input and output measures are selected. If important output measures are excluded then certain departments may be unduly penalized because their performance strengths are not included. A similar case results if important inputs are not included, since departments which use these efficiently will not receive appropriate credit. Conversely, if irrelevant inputs or outputs are included then some departments may likewise show inflated efficiency. This is because they may score high on unimportant metrics or show good use of unimportant resources.
2015 AALHE “Actionable Assessment” Conference Proceedings |11
Figure 1: Efficient frontiers between each pair of outputs
Suggestions for Institutional Effectiveness and Assessment Practitioners
Academic department’s productivity is a delicate topic that must be handled by assessment and institutional effectiveness practitioners with the highest level of thoughtfulness. In an era of several institutions engaging in program prioritization activities, our role as practitioners is to provide clearly articulated and actionable data for academic leaders. The use of DEA for measuring departmental performance would require series of consultation with stakeholders on what constitutes inputs and outputs variables. Assessment and IE practitioners must be strategic in sharing the results. Although DEA provides a good measure of departmental performance, the interpretation of the results must be done within the context of other confounding and extraneous variables that define the culture of the department/institution. It is recommended that academic leaders at the highest level (provost/deans) review and approve the results before sharing with academic departments. Finally, DEA is just one of several ways of measuring the efficiencies of

2015 AALHE “Actionable Assessment” Conference Proceedings |12
academic departments. Practitioners are therefore encouraged to utilize other analyses to affirm the results generated through DEA.
Conclusion
In this paper we have provided an overview of DEA and shown how it may be applied within a university to compare the performance of different academic departments. Significant challenges exist in making such a comparison because of the different resources allocated to each department coupled with a plurality of performance measures, each of which may be prioritized differently by different disciplines. DEA provides a solution by finding and comparing the most favorable possible efficiency score for each department. Accordingly, DEA provides a powerful and insightful tool for performance management in higher education.
References
Benchmarking (2015). The R Benchmarking package. Retrieved May 22, 2015 from http://cran.r-project.org/web/packages/Benchmarking/Benchmarking.pdf
Charnes, A., Cooper, W., and Rhodes, E. (1978) Measuring the efficiency of decision-making
units European Journal of Operational Research, 2(6), 429–444. Dantzig, G. and Thapa, M. N. (1997) Linear programming 1: Introduction. Springer-Verlag.
Kuntz, L. and Vera, A. (2007) Modular organization and hospital performance. Health Services Management Research, 20(1), 48–58.
Pasupathy, K. and Medina-Borja, A. (2008) Integrating Excel, Access, and Visual Basic to
deploy performance measurement and evaluation at the American Red Cross. Interfaces, 38(4), pp. 324-337.
R (2015) The R Project for Statistical Computing, http://www.r-project.org/, accessed 5/16/2015.
Sherman, H.D., and Zhu, J. (2013). Analyzing performance in service organizations, Sloan Management Review, 54(4), 37-42.
Thanassoulis, E. (1995) Assessing police forces in England and Wales using data envelopment
analysis. European Journal of Operational Research, 87(3), 641-657. Vera, A. & Kuntz, L. (2007) Process-based organization design and hospital efficiency, Health
Care Management Review, 32(1), 55-65.

2015 AALHE “Actionable Assessment” Conference Proceedings |13
Cheyney University’s Experience of Ten Year Re-affirmation of Accreditation Self-Study Process
Dr. Phyllis W. Dawkins
Provost and Senior Vice President for Academic Affairs and Accreditation Liaison Officer Cheyney University of Pennsylvania
Dr. Sesime K. Adanu
Formerly Director of Institutional Effectiveness and Research Cheyney University of Pennsylvania
Currently Dean of Institutional Effectiveness and Enrollment Planning SUNY Broome Community College
Shayla M. Prince
Executive Associate to the Provost and Coordinator for Accreditation and Continuous Improvement
Cheyney University of Pennsylvania
Abstract
Cheyney University went through its 10 year reaffirmation of accreditation in spring 2014. As a result of the strategies revealed in this paper, the University had a successful visit where it met the requirements of all 14 standards of accreditation. Key among the contributors to this success are starting the process two years before the self-study visit, engaging faculty, students, alumni, and staff early in the process through events and activities on campus, establishing the steering committee and working groups early in the process, holding regular meetings to keep constituents informed, budgeting in advance for the accreditation process, and holding town hall meetings with the campus community to share progress, provide training and get input for the report. Involvement of students, faculty, staff, board members and alumni, as well as other key stakeholders is critical to any credible self-study. This creates an environment where constituents have a voice in objectively assessing the status of the University within the scope of ensuring continuous improvement. Campus community involvement also means that constituents are well informed about the accreditation process and the self-study content. This makes the campus better prepared to respond to questions and comments from the visiting team and also provides evidence of broad participation in the process. It is also important to share success stories of students as a part of sharing the University’s story. Additionally, share the history of the University’s experience within the context of higher education. These additional factors can contribute to a successful self-study review.
Keywords: MSCHE, accreditation, re-affirmation, institutional effectiveness, self-study, self-study design, self-study report, self-study visit.

2015 AALHE “Actionable Assessment” Conference Proceedings |14
Introduction Increasing demands from the federal government as well as public interest groups and stakeholders about the quality of higher education brings to light the importance and relevance of accreditation. Despite debates as to whether accreditation is the way to go in ensuring quality education that builds public confidence, the fact cannot be denied that accreditation does play an important role in ensuring continuous improvement and institutional effectiveness in higher educational institutions. Considering the challenges faced by most Historically Black Colleges and Universities (HBCUs), accreditation could be considered as one of the means to restore public confidence in HBCUs. At Cheyney University, the 10 year re-affirmation of accreditation attests to the fact that irrespective of the numerous challenges faced by the University, quality education and a commitment to continuous improvement are still high values at the institution. In this paper, the following issues related to accreditation at Cheyney University will be addressed. 1) preparations prior to the self-study design 2) expectations after approval of the self-study design 3) getting the Campus Community ready for the self-study process and on site visit 4) budget/logistical planning, and 5) preparations needed before and after the visit. The purpose is to help institutions in the process of preparing for their self-study visit to know the key issues to focus on in order to have a successful visit. Even though this paper is focused on accreditation as related to the Middle States Commission on Higher Education (MSCHE) http://www.msche.org/, lessons learned from this paper could be applicable to other regional and specialized accrediting bodies of higher educational institutions.
Preparations Prior to the Self-Study Design An early start to the accreditation process is invaluable to getting the report well written with sufficient time to review and edit it before the submission deadline. In order to ensure that the institution is on track to successfully completing the report for submission, it is advisable that the President of the institution communicate with the entire campus community, including students at least two years prior to the due date of the self-study report. This communication should provide a background on what accreditation is about, synopsis of the standards of accreditation the institution is self-assessing on and an invitation for volunteers to serve on the steering committee and working groups. The President should by this time identify the chair or co-chairs who will lead this effort and announce it as well. It is advisable to have a faculty member and a staff or administrator serve as co-chairs of the self-study process. The co-chairs need to attend all trainings and annual meetings held by the accrediting body to learn about the processes involved in the self-study.
Expectations after Approval of the Self-Study Design Upon their return from Self-Study training, the co-chairs need to decide on the approach to adopt for the report in consultation with the president of the College/University. A decision also needs to be made as to whether standards will be grouped or responded to individually. With these decisions made, the co-chairs need to write the self-study design, which outlines how the institution intends to approach the self-study report, including the key questions to be addressed relative to the respective standards. It is advisable for the co-chairs to look at sample successful

2015 AALHE “Actionable Assessment” Conference Proceedings |15
self-study designs from other institutions (Howard University 2009 Self-Study Report, Mansfield University 2012 Self-Study Report, and Immaculata University 2012 Self-Study Design) that recently went through the process to gain an insight into the content and style of the self-study design. The completed design needs to be thoroughly edited and submitted to the Middle States liaison for the College/University for review. After all necessary corrections are made based on feedback received from the liaison, a formal decision on approval of the design is communicated by MSCHE to the President and accreditation liaison officer of the institution. With this approval in hand, the co-chairs in consultation with the president put together a steering committee and working groups who will be charged with leading the process and gathering evidence to write the report. The Working Groups used at Cheyney University consist of the following with assigned standards:
Working Group A examines standards that trace the link between the university’s mission statements to its student outcomes. Thus, Group A reviewed how the University demonstrates outcomes expressed in the mission statement. It reviews plans in academic and student affairs and how institutional resources are allocated in student services to realize the intended student outcomes. There should be a discernible connection between the mission and goals, how the institution allocates resources, and outcomes. As a result of effective planning, institutional resources should be appropriately allocated to different areas within the institution to ensure that strategic goals are accomplished. The overarching goal of institutional renewal is to improve the teaching and learning environment and attainment of measurable student outcomes. Group A will determine the degree to which the aforementioned links have been, or can be, demonstrated. Working Group B examined governance, administration, and policy integrity based on the understanding that a clear governance structure and institutional integrity are essential to institutional effectiveness. Effective administrative leadership and institutional integrity regarding its policies and practices are the backbones for supporting the teaching and learning environments. This type of structure better leads to the achievement of the goals stipulated in the strategic plan. Group B reviewed the evidence that the institution is in compliance with governance, administration, and integrity standards. Working Group C examined the many dimensions of the role of the faculty and the instructional program. Faculty members play important roles in the University community in terms of designing and reviewing academic programs and producing student outcomes. Further, teaching could be linked to stated outcomes of the general education curriculum and other programs. The faculty’s role is a critical component to the attainment of institutional renewal and student success. Group C sought evidence, which demonstrated that the University is in compliance with these standards. Working Group D examined standards that were clustered based on the assumption that having an effective teaching and learning environment for students will contribute to increased admission and retention. Overall, the findings from the self-study helped inform the University community about the strengths and areas for improvement in the strategic

2015 AALHE “Actionable Assessment” Conference Proceedings |16
plan of Cheyney University. The findings from all of these work groups were viewed as opportunities for institutional renewal.
In situations where enough volunteers are not found for specific working groups, the president can appoint faculty and staff with expert knowledge to assist with the analysis of evidence and development of the self-study report. It is very important to ensure that students are represented on the working groups for input. Working group members who do not have knowledge on aspects of the report they are working on need to consult with offices/departments with the data and information to support the report. One important office to consult for data and information is the Office of Institutional Research. This office needs to be actively involved in the process and serve as a resource to all working groups. The chair/co-chairs need to coordinate efforts to ensure that the working groups are actively engaged in the writing process. Regular meetings need to be scheduled to get updates from working groups; a document room needs to be identified where hard copy documents will be kept for working groups and steering committee members to access. A shared online filing system such as SharePoint (https://products.office.com/en-us/sharepoint/collaboration) needs to be created on the College/University network solely for accreditation where the steering committee and working groups can access evidence as well as share documents being worked on. The early start of this depository makes it easy to organize documents down the road. Evidence folders for the respective standards can also be created early in the process to ensure that writings being done have supported evidence gathered early on in the process.
Getting the Campus Community Ready for the Self-Study Process/Visit It is important to note that without the involvement of the campus community, the self-study runs the risk of not being successful. This is because the report demands the input of the entire campus and not just a select few who edit and prepare the final draft. This is a reflective moment for the institution where objective assessment is made on the status of the institution related to the Characteristics of Excellence by MSCHE. More so, it will be unpleasant for the institution to experience the situation where the visiting team arrives on campus talking to students and staff to discover that they do not know about the visit and were not involved in the process. To ensure this awareness campus wide, events need to be organized after the approval of the self-study design. A theme could be chosen to launch the start of the writing where faculty, staff, administrators and students are invited to participate. This should be a fun event with refreshments provided. Summarized leaflets on the requirements of each of the accreditation standards should be distributed to participants with short quizzes organized on accreditation and continuous improvement with token prizes presented to attendees who are knowledgeable about the process. Monthly newsletters on the accreditation process can be instituted providing periodic updates to the campus community on issues and progress made on the report. Avenues should be provided for those not directly involved in the writing to provide input that can be incorporated into the report. This can be done through the Internet or other platforms convenient for the institution.

2015 AALHE “Actionable Assessment” Conference Proceedings |17
Budget/Logistical Issues It is quite easy to lose sight of this important component of the process when focusing on the writing of the report. It is important to budget for things that will be needed including the costs of printing materials related to the self-study that the visiting team and campus community will need access to. Also of importance is an Internet based software system to host the report and supporting documents if the institution’s database does not already have that capability. This is important in situations where updates are provided on the report after the hard copy is mailed to the visiting team. The team can be notified of the updates and provided with a log in access. Also to be budgeted for are the cost of hotel, airfare, food at the hotel and on campus when the team arrives, stationary and equipment on campus and at the hotel for the team. Further, the cost of transportation to shuttle between the hotel and campus has to be factored in if the school does not own a means of transport among other considerations. The budget template below serves as a useful reference.
Sample Budget Template
Documents Room and Accreditation Office Amount Equipment (Desktop Computer, Printer, Etc) Supplies Printing, Web Development and Media Amount
Printing (100 X $40 each)
Website Development
Mailings
Electronic Media Thumb drive w/logo (30 X $20) On-Site Visit Amount On Site Team estimates based on xx people and xx nights
Airfare/Travel (xx persons X $450 avg costs of airfare)
Lodging (15 ppl plus 2 staff rooms X $680 per stay (@ $136/night X 5 nights)
Snacks and Drinks for Hotel Rooms, Work Rooms on campus and hotel)
Incidentals (Misc.)
Meals on Own (3 team dinners for 15 ppl at $25 per)
Catering (Lunches on Campus) Shuttle Service and Golf carts for week ($1190/day for all day shuttle)

2015 AALHE “Actionable Assessment” Conference Proceedings |18
Preparations Before and After the Visit
As soon as the dates are determined by the chair, president and accrediting body, this information should be shared with the campus community. Faculty, staff and administrators should not be allowed to take leave or attend out of town conferences during this 2-3 day time period. This is very important because the purpose of the On Site Visit is for the team to gather the information needed to make a recommendation regarding the accreditation status of the University. The University does not know who the team needs to meet with to help gather the information to make this determination. Having faculty and staff accessible and knowledgeable makes the process run smoothly. It should be noted that the visiting team writes its report on its findings during the visit before they leave campus. Therefore, the quicker the campus responds to their follow up requests, the better it is so as to avoid the possibility of being cited for non-compliance with some of the standards because requested evidence in not handy. Further, it is very important to have a single point of contact to manage all of the team needs before and during the on-site team visit. This person should have a direct line of communication to the team chair and should coordinate the team chair’s visit to campus, secure the hotel and all on campus venues to be used and work with all campus constituents to ensure a successful visit. This point of contact should work closely with the University’s accreditation liaison officer on the team visit schedule, which is subject to constant changes as the team works to gather needed information in a short amount of time. This point of contact will also work with key offices to ensure the campus is clean, signage and directions are clear and in place, meals are arranged, and that meeting spaces and team work space is reserved for the visiting team to use throughout the visit. Equally important throughout the self-study draft process, is the need to keep the campus community engaged. Various events such as town hall meetings should be held and various drafts of the self-study report should be shared with the campus community and feedback garnered. It will be important to hold a specific session designed to garner student engagement. This can be done in the form of a student forum held in consultation with student government leadership. Allow students to learn about the purpose of accreditation and the content of the self-study report for input. This allows students to become familiar with the report and ensures informed answers to the visiting team if asked. Copies of the Self-Study throughout the drafting process should be placed in the school library and online for the campus community to easily access them.
IT Person to be on site support throughout visit (40 hours @$25/hr) Equipment Rentals (Hotel work room) Gifts/Work Supplies for Team Members-School Branded Bag for materials, portfolio, key chain, etc. Work Areas on Campus Chair On-Site Visit, If needed Amount Airfare/Travel Lodging
Expenses (Lunch/Dinner Meetings)
Total $

2015 AALHE “Actionable Assessment” Conference Proceedings |19
After the team visit, the chair of the team presents its findings to the school for review and response. The response has to be sent in a timely fashion to the visiting team in order for them to incorporate the response into their final report to MSCHE. MSCHE issues it final decision as to whether or not the institutions’ accreditation is re-affirmed or whether any follow ups may be necessary.
Conclusion While the task of getting an institution accredited is a herculean one, it needs to be noted that having an early start with a dedicated team makes it possible to surmount the challenges. The process ought to be a team effort that is objective, transparent and inclusive in ensuring optimum results. The self-study is an important time in the life of the institution where all hands are needed on deck devoid of hidden individual agenda, but rather a common purpose of ensuring that the institution gets accredited. People with concerns need have their voices heard during the writing process with ameliorative solutions found and addressed in the report and not wait for the team to visit to air grievances.
References
Howard University (2009). 2009 Self study report to the Middle States Association of Colleges and Schools Commission on Higher Education. Retrieved on May 13th, 2015 from http://www.gs.howard.edu/middle_states/mse/HU_Self_Study_2009.pdf Immaculata University (2012). Middle States Commission on Higher Education Self-Study Design. Retrieved on May 17, 2015 from http://www.immaculata.edu/middlestates/reaccreditation-process Mansfield University of Pennsylvania (2012). Self study report to the Middle States Association of Colleges and Schools Commission on Higher Education. Retrieved on May 13th, 2015 from www.mansfield.edu/middle-states Middle States Commission on Higher Education (2011). Characteristics of excellence in Higher
Education: Requirements of affiliation and standards for accreditation, 12th edition. Philadelphia: Middle States Commission on Higher Education
Middle States Commission on Higher Education (2012). Self-Study: Creating a Useful Process & Report. Retrieved on May 13th, 2015 from http://www.msche.org/publications/SelfStudy2012FINAL.pdf Middle States Commission on Higher Education (2014). Standards for Accreditation and Requirements of Affiliation. Retrieved on May 13th, 2015 from https://www.msche.org/publications/RevisedStandardsFINAL-2.pdf SharePoint (2013). SharePoint (2013) Retrieved on May 18h, 2015 from
https://products.office.com/en-us/sharepoint/collaboration

2015 AALHE “Actionable Assessment” Conference Proceedings |20
Help Faculty Make Better Rubrics
David K. Dirlam Director of Institutional Effectiveness & Accreditation
[email protected] Virginia Wesleyan College
Abstract
Five-point scales and Sequences Which Expand Little by Little (SWELL rubrics) do not work. They do not discriminate levels of student experience, scaffold student learning, pinpoint areas for curricular improvement, or measure institutional effectiveness. This session will present four principles for making developmental rubrics that do work in all four ways. First, to create developmental rubrics, describe examples of behaviors (not judgements or impressions of quality). Next, choose multiple dimensions in order to reveal an enormous variety of patterns of expert behavior. Third, for each dimension use a dynamic succession of levels that depends on rates of growth and competition resulting from the combination of behaviors into complex units. Fourth, create developmental rubrics for extremely diverse time scales ranging from minutes to millennia. Examples and supporting evidence are described. Keywords: developmental rubrics, expert behavior, dimensions of learning, succession model, assessment time scales, scaffolding, curriculum design, institutional effectiveness Compelling evidence presented below reveals that many versions of assessment rubrics fail completely to show value-added for educational programs. This happens when rubrics are based on multi-point (or Likert) scales. Any time the same scale is used across several dimensions or criteria of learning, they are SWELL Rubrics, an acronym for Sequences Which Expand Little by Little. The following sequence is a common SWELL rubric: “needs much improvement, needs improvement, adequate, better than adequate, outstanding.” The well-known Value rubrics differ somewhat from dimension to dimension but still bear much resemblance to SWELL rubrics. Such rubrics resemble grades in that the average value for second year and fourth year students differs very little. Simply put, SWELL rubrics do not show value-added for educational programs. In contrast, developmental rubrics powerfully discriminate levels of student educational experience. This is true when four basic principles are used within assessment surveys that contain several developmental dimensions, each listed as a multiple-choice question with the developmental levels as the options. The data in Figure 1 are based on an assessment survey, which showed the difference between SWELL and developmental rubrics with extreme clarity. Sixteen faculty members rated every student in every course using a single form containing both a Likert-type Rating Scale that they had developed and developmental rubrics for which they were one of fifty participating interviewees. Figure 2 illustrates three of the twelve dimensions of developmental rubrics.

2015 AALHE “Actionable Assessment” Conference Proceedings |21
The purposes of this report are twofold: (1) to identify the four basic principles for creating developmental rubrics along with their foundational origins and (2) to describe how they can scaffold student learning, pinpoint areas for curricular improvement, and measure institutional effectiveness.
Figure 2. Three dimensions of developmental rubrics for Rabbinical Studies
Figure 1. SWELL vs. Developmental Rubrics

2015 AALHE “Actionable Assessment” Conference Proceedings |22
The Four Basic Principles for Creating Developmental Rubrics
To create developmental rubrics, people need to understand the structure and dynamics of development and what these mean for the development of expertise. Expertise develops along multiple dimensions involving a few transformations of behaviors each, whether within individuals, groups, institutions, or even cultures.
The Behavior Principle: Developmental rubrics contain descriptions of examples of behaviors.
Many rubrics fail because they focus on rater’s judgments of impressions or feelings, rather than descriptions of learner behaviors. Rubrics creators should begin with behaviors that typify learner activities at different levels of expertise (see the Succession Principle below). Rubrics that try to define levels rather than describe typical behaviors also often fail because raters become stymied by borderline dilemmas. When rubrics creators and users understand the Succession Principle, examples of behaviors become more effective than definitions. The Dimensions Principle: Developmental rubrics consist of multiple dimensions.
Most people think of rubrics as multidimensional, so the Dimensions Principle is easy to grasp. Choosing among dimensions, however, is more complex and the fundamental value of multiple dimensions is poorly understood. The criterion for whether two sequences are actually separate dimensions is when every level of one sequence can logically coexist with any level of another sequence. We know that for writing evaluation, audience and time frame are separate dimensions, because of examples like reflective diaries. Such writing is usually done for the writer only (egocentric audience), but can contain careful predictions and hopes for the future (timeless or future time frame). Thus, a developmentally primitive audience accompanies a very advanced time frame. In general, every expertise develops along multiple dimensions. This is true empirically, because in over 300 one-to-two-hour interviews of experts, I have never had a respondent who could not identify multiple dimensions (though some respondents have not been able to identify a complete developmental sequence in the dimensions they generated). The fundamental value of multiple dimensions, on the other hand, has been obscured by data treatment practices that undermine that value. Assigning scores to levels and then averaging up the scores is a faulty use of statistics, because as the Succession Principle below will show, the distributions of scores within each level are decidedly non-normal. More importantly, combined scores obscure the patterns. Expert behavior is enormously diverse. Ten dimensions of rubrics contain an easy-to-master 40 concepts. But those 40 concepts reveal 5^10 (nearly 10 million) patterns of behavior. If the levels for each dimension are analyzed separately rather than muddled into averages, the design of courses and curricula can be informed by the specific impacts of those practices on each dimension of development.
The Succession Principle: Developmental rubrics show a dynamic succession of levels.
In his renowned classic on the “Problem of Serial Order in Behavior”, Karl Lashley (1951) showed that each level of expertise requires practice before it transforms to the next level. Thus, a beginning typist pecks at letters. After enough practice at finding letters, typists transform their activity to typing words. After extensive more practice, whole phrases or even sentences become the unit of typing. Each transformation is accompanied by a jump in typing speed and accuracy.
2015 AALHE “Actionable Assessment” Conference Proceedings |23
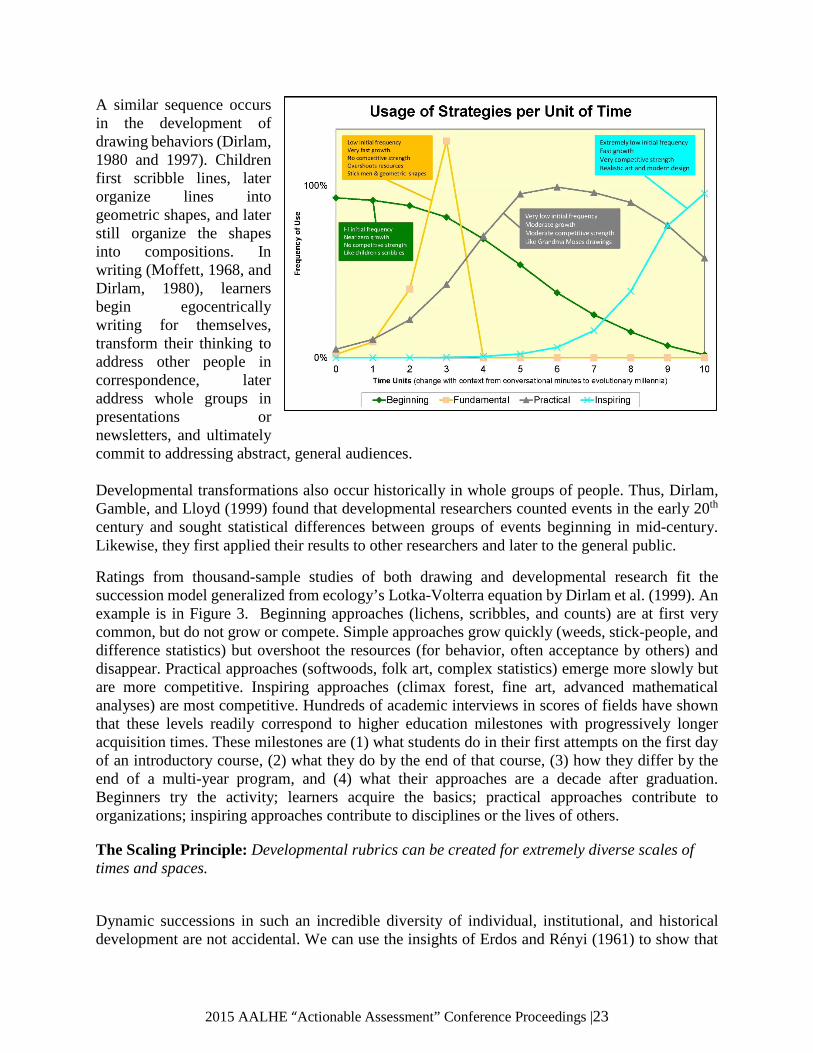
A similar sequence occurs in the development of drawing behaviors (Dirlam, 1980 and 1997). Children first scribble lines, later organize lines into geometric shapes, and later still organize the shapes into compositions. In writing (Moffett, 1968, and Dirlam, 1980), learners begin egocentrically writing for themselves, transform their thinking to address other people in correspondence, later address whole groups in presentations or newsletters, and ultimately commit to addressing abstract, general audiences. Developmental transformations also occur historically in whole groups of people. Thus, Dirlam, Gamble, and Lloyd (1999) found that developmental researchers counted events in the early 20th century and sought statistical differences between groups of events beginning in mid-century. Likewise, they first applied their results to other researchers and later to the general public.
Ratings from thousand-sample studies of both drawing and developmental research fit the succession model generalized from ecology’s Lotka-Volterra equation by Dirlam et al. (1999). An example is in Figure 3. Beginning approaches (lichens, scribbles, and counts) are at first very common, but do not grow or compete. Simple approaches grow quickly (weeds, stick-people, and difference statistics) but overshoot the resources (for behavior, often acceptance by others) and disappear. Practical approaches (softwoods, folk art, complex statistics) emerge more slowly but are more competitive. Inspiring approaches (climax forest, fine art, advanced mathematical analyses) are most competitive. Hundreds of academic interviews in scores of fields have shown that these levels readily correspond to higher education milestones with progressively longer acquisition times. These milestones are (1) what students do in their first attempts on the first day of an introductory course, (2) what they do by the end of that course, (3) how they differ by the end of a multi-year program, and (4) what their approaches are a decade after graduation. Beginners try the activity; learners acquire the basics; practical approaches contribute to organizations; inspiring approaches contribute to disciplines or the lives of others.
The Scaling Principle: Developmental rubrics can be created for extremely diverse scales of times and spaces.
Dynamic successions in such an incredible diversity of individual, institutional, and historical development are not accidental. We can use the insights of Erdos and Rényi (1961) to show that

2015 AALHE “Actionable Assessment” Conference Proceedings |24
such progressions have a mathematical basis. If we begin with isolated nodes (think random dots on a paper) and then link pairs of nodes at random (lines between the dots), a remarkable progression appears. The links haphazardly create little tree structures until the average number of links per node approaches one. Then within a relatively small number of new links, a phase shift to a giant component occurs that links nearly all nodes together. These giant components contribute to transformations in learners. Beginners have few options (e.g., typewriter keys), so giant components of patterns of behavior (words) emerge quickly. These components then become nodes for the next level (word typing). Since each new node is a unique pattern of elementary nodes, the number of new nodes and links needed for new giant components is exponentially larger than the earlier level (e.g., a few letters form millions of words). It thus, takes much longer for the giant components to emerge at this level. Such transformations to new levels occur only one or two more times, while the sheer complexity limits the completion of a fourth level. It is, therefore, at this fourth level where innovations and discoveries become possible. Because of the mathematics that underlies development, developmental rubrics exist at extremely diverse time scales.
Ideas for Using Developmental Rubrics
Scaffolding Student Learning
Developmental rubrics “scaffold” student learning when instructors have well-practiced familiarity with each level of each dimension. Vygotsky (1935/1978) discriminated a person’s independent problem solving from his or her potential solutions under the guidance of a more developmentally advanced person. To scaffold is to instruct in a child’s level of potential development. A teacher reading a beginning writer’s egocentric story might ask the writer what his or her best friend thought of it. Thus, the teacher “scaffolded” the pupil’s “diary” level of audience with a “correspondence” level of audience. For a class accustomed to writing letters to each other, a scaffolded assignment would involve students making presentations to their whole class. In turn, such presentations are important precursors to writing for abstract audiences. In the 1970’s, a group of campus-school teachers from the State University of New York at Plattsburgh held 30 one-hour meetings to refine eight dimensions of writing development. In the process, they learned the developmental rubrics so thoroughly that they commonly used them in interactions and lesson plans with their elementary school pupils. A representative of the NY State Education Department on a consulting trip reported that the fifth grade students, which three years earlier had been a year behind grade level, could all pass the regents high school writing exam. The next section shows the potential for higher education curricular design for developmental rubrics even without the deep familiarity shown by the campus-school teachers.
Pinpointing Areas for Curricular Improvement
At last year’s AALHE meeting (see the 2014 Proceedings), I reported on a Course Design Survey used by a Communication program. The faculty filled out a survey with several options each to answer basic questions about their courses: who did what, when, where, why, and with what resources. They also rated every student in every course using nine dimensions of developmental rubrics. Analysis revealed that two weeks devoted to presentations in a 200-level course resulted in dramatically more sophisticated performance on the senior research project. Determining the impact of such course design features is much less threatening to academic freedom than determining the impact of courses. Faculty members can choose to modify their syllabi to add
2015 AALHE “Actionable Assessment” Conference Proceedings |25
approaches shown to be effective for their programs much easier than they can modify whole courses.
2015 AALHE “Actionable Assessment” Conference Proceedings |26
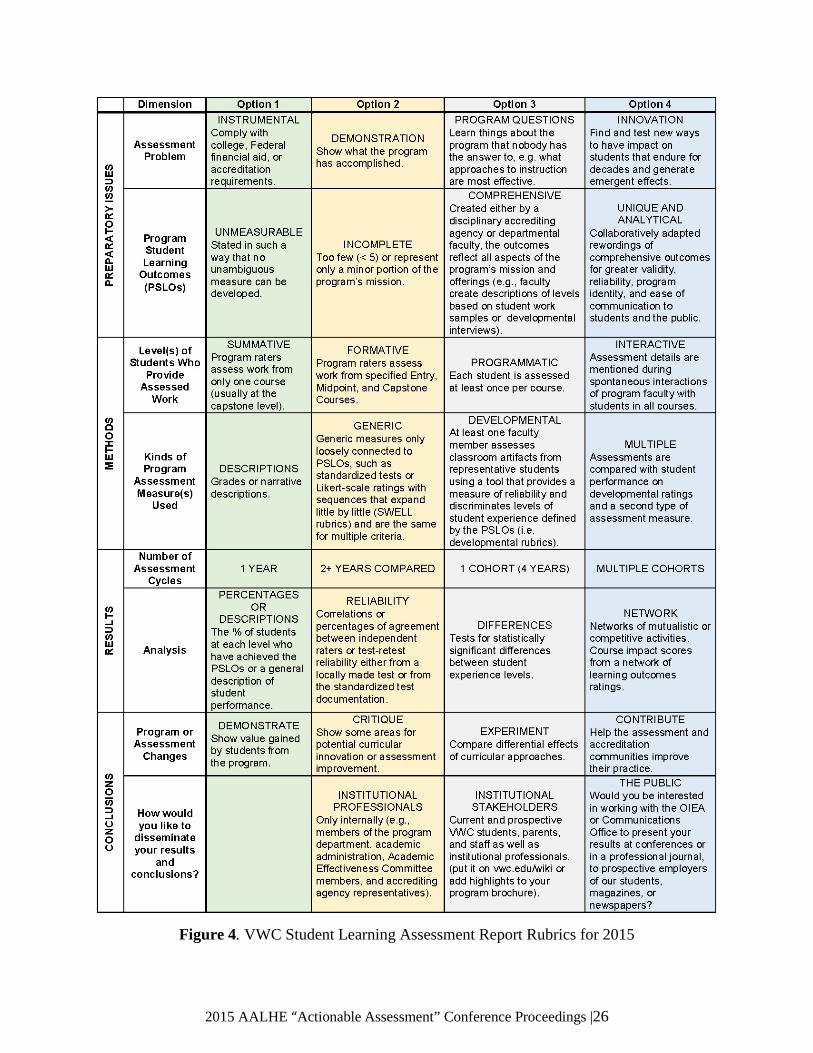
Figure 4. VWC Student Learning Assessment Report Rubrics for 2015

2015 AALHE “Actionable Assessment” Conference Proceedings |27
Measuring Institutional Effectiveness
At the AALHE meeting two years ago and in my Keynote Address at the 2014 New England Educational Assessment Network’s Fall Forum, I reported on the use of multidimensional rubrics for the development of institutional learning assessment. The current rubrics are attached here in Figure 4 for ease of access. A similar version was used three years ago to evaluate Student Learning Assessment Reports (SLARs) provided by every program at Virginia Wesleyan College. The next year the rubrics were put into a template for the reports, so that every assessment coordinator became familiar with them. Independent ratings of these reports by the Co-Chairs of the College’s Academic Effectiveness Committee revealed no differences between these first two years. In the third year, however, the program assessment coordinators had seen the opportunities afforded by more sophisticated options than they had used the year before. This year, the reports showed very dramatic increases in the sophistication along most of the dimensions of assessment. The one dimension that did not show such improvement was “Assessment Problem.” This result confirmed that identifying a good problem for learning assessment is as difficult as identifying a good research problem. The Course Design Survey mentioned above solves that common problem. The highly significant advances in other SLAR dimensions shows the power of allowing rubrics users to choose their level. The developmental SLAR template, therefore, scaffolds the development of assessment expertise. When faced with demands involving a new area of expertise, everyone progresses through successive levels. Acquisition of expertise in one area may speed up acquisition in other areas, but scaffolding still is the most efficient way to develop.
Conclusions
Developmental rubrics discriminate value added of instruction astronomically better than other sorts of rubrics. In order to create developmental rubrics people need to describe behaviors indicative of beginning, learning, practical application, and innovation or discovery. They also need to organize these into multiple dimensions that develop independently. A critical principle in making developmental rubrics that discriminate most effectively is to attend to the succession in which beginning strategies decline; learning strategies overshoot resources and crash; practical strategies endure for years as slower growing but more competitive; but inspiring strategies are the most sustainable due to their very high competitive strengths. Finally, because of the mathematical nature of development, developmental rubrics can apply not only to educational settings but also to extremely diverse time frames ranging from the minutes of conversational development to millennia of historical or ecological development. When instructors know developmental rubrics well, they can use them to scaffold student learning. If supplemented by a course design survey, analysis can pinpoint areas for curricular improvement. Finally, we can scale developmental rubrics up from individuals to groups in order to measure and scaffold the development of various aspects of institutional culture.

2015 AALHE “Actionable Assessment” Conference Proceedings |28
References
Dirlam, D. K. (1980). Classifiers and cognitive development. In S. & C. Modgil (Eds.), Toward a Theory of Psychological Development. Windsor, England: NFER Publishing, 465-498.
Dirlam, D. K. (1997). Chaos, Competition, and the Necessity to Create. Mind, Culture, and Activity, 4, 34-41.
Dirlam, D. K., Gamble, K. L., & Lloyd, H. S. (1999). Modeling historical development: Fitting a competing practices system to coded archival data. Nonlinear Dynamics, Psychology, and Life Sciences, 3, 93-111.
Dirlam, D. K. and Minnis, S. (2014). The Course Design Matrix: A critical link in formative program assessment. In Ed Cunliff and Tracey Romano (Eds). Emergent Dialogs in Assessment, 1. Lexington, KY: AALHE.
Erdos, P. and Rényi, A. (1961). On the strength of connectedness of a random graph. Acta Mathematica Scientia Humgary, 12, 261-267.
Lashley, K.S. (1951). The problem of serial order in behavior. In Jeffress, L.A., editor, Cerebral Mechanisms in Behavior. Wiley, New York.
Moffet, J. (1968). Teaching the Universe of Discourse. Boston: Houghton Mifflin.
Vygotsky, L. S. (1935/1978). Interaction between learning and development. In M. Cole, V. John-Steiner, S. Scribner, and E. Souberman (translators). Mind in Society: The Development of Higher Psychological Processes. Cambridge, MA: Harvard University Press.
2015 AALHE “Actionable Assessment” Conference Proceedings |29
Simple Predictors
David Eubanks Associate Dean of Faculty for Institutional Research and Assessment
Eckerd College
Abstract
Data mining in higher education benefits from both traditional statistics and the more computational forms that have emerged from the machine learning community. Although powerful tools exist to perform both kinds of analysis, they are often slow to implement or hard to learn. A new tool called Survey Prospector is introduced, with the purpose of providing a fast and simple solution to a particular workflow that is common to higher education: finding good predictive models from data sets. Keywords: data mining, statistics, machine learning, institutional research, institutional effectiveness
Introduction More and more, higher education decision-makers have access to digital repositories of student information: admissions and financial aid documents, transcripts, conduct records, co-curricular transcripts, surveys, learning outcomes records, and so on. Simultaneously, the Academy is under scrutiny to demonstrate the value of a degree, or to increase performance with regard to retention and graduation rates, loan defaults, etc. At the intersection of these two phenomena are data analysis tools and the people who use them. The former includes commercial software like SAS, STATA, and SPSS, as well as free software like R and RapidMiner (which also have commercial versions). The work is often done by Institutional Research offices or assessment professionals who have some quantitative training. The theory and practice of producing usable information from data (which we will call data mining) is also undergoing a revolution fueled by technology. The historical development of statistics has been, until quite recently, constrained by the computational power available. Therefore many of the techniques and theoretical approaches that embody traditional statistics are designed to economize computation. For example, minimization of squared error is a ubiquitous technique that makes derivations (and hence computations) simpler. This is because the derivative of x-squared is easy to compute, not because squared error is the only way to compare models to data. Fast computation allows larger data sets to be analyzed, more sophisticated visualizations, and computation-intensive algorithms. The last of these is coming from computer science departments under the name of machine learning, with is related to but distinct from statistics. A contrasting description of these “two cultures” is found in (Brieman 2001). Machine learning covers many topics, but there is a strong interest in using data to make predictions. As an example,

2015 AALHE “Actionable Assessment” Conference Proceedings |30
the Netflix prize offered $1 million to anyone who could improve their movie-matching accuracy by a few percent (the site is at http://www.netflixprize.com/). Tools like Rapid Miner or IBM’s Cognos or other “business intelligence” tools allow relatively easy access to many different algorithms to perform prediction, clustering, or other types of data mining. However, they still require time in training, setup and execution of modeling, and interpretation of the results. These are general tools appropriate to solving and automating data mining problems, rather than tools for fast data exploration. In institutional research, Excel or equivalent products have been indispensable for data exploration, enabling fast view of facets with pivot tables or pivot charts, and the flexibility of a scripting language when needed. However, there is a gap between Excel and business intelligence software: software that would combine predictive analytics and rapid data exploration.
Classification Problems
A useful and important problem in higher education is the classification problem, which takes on the task of predicting a binary dependent variable of interest using various independent variables. For example, student retention is such a yes/no variable, and any scalar or nominal variable can be usefully seen as one. A grade average is a scalar, but the question “is the average greater than 3.0?” is binary, and when applied to each student create a criterion to predict. This simplification allows us to apply a simple work flow to the prediction problem:
1. Normalize data so that it is categorical with a controlled number of categories. 2. Apply any filters of interest (e.g. just males or just females). 3. Identify a target (dependent) variable and create a binary classification. 4. List the independent variables in decreasing order of predictive power over the dependent
variable, with graphs and suitable statistics automatically generated. 5. Browse these top predictors to get a sense of what is important. 6. Visually inspect correlational maps between the most important independent variables. 7. Create multivariate predictors using combinations of the best individual predictors. 8. Cross-validate the model by keeping some data back to test the predictor on.
Once a model is created, one can use it for many purposes, including the generation of predictions. For example, we could use the last three years’ data on retention to rate each of this year’s students for risk of withdrawal. Ideally, this workflow is a quick to perform as a pivot table can be rotated, so that it can be used to freely explore data, even in real time (e.g. in meetings to facilitate discussion). The community of programmers and statisticians who develop the R language has spawned RStudio and, more recently, Shiny—a “platform as a service.” Developers can create web-based applications and upload them to be accessible from the cloud. This enables the workflow listed above to be run from any machine with access to the Internet. Survey Prospector, a small R/Shiny program, was designed to do this.
2015 AALHE “Actionable Assessment” Conference Proceedings |31
Survey Prospector
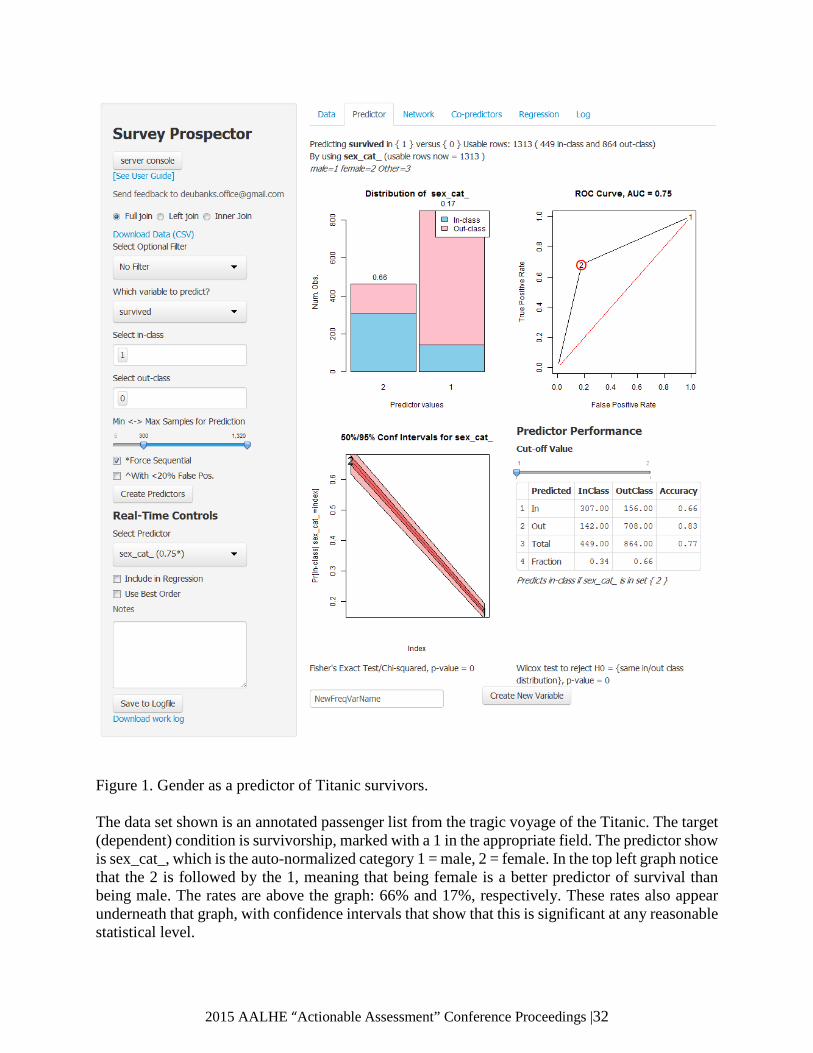
Survey Prospector is designed to work with discrete data that have few categories (typically around five), which can optionally be ordinal. Data normalization is automatic, converting categorical data into a selected number of categories. For example state codes like AK or IL would be recoded with 1 = most frequent state, 2 = second most frequent, up to a maximum code to represent Other. This creates a manageable but still useful recategorization of messy data. Scalar values like grade averages are normalized into n-tiles (as chosen by the user), for example, 1 = lowest 25%, up to 4 = highest 25%. Up to two filter conditions can be applied using a simple interface. These can be conjoined with logical AND or OR. The selection of a target criterion can also filter. For example, if the objective is to predict how the highest 25% GPAs contrast with the lowest 25%, the middle half can simply be omitted. Once the target variable is chosen, the click of a button will generate the best predictors from among the variables in the data and put them in order from best to worst. Each of these has a full report, as shown in figure 1.
2015 AALHE “Actionable Assessment” Conference Proceedings |32
Figure 1. Gender as a predictor of Titanic survivors. The data set shown is an annotated passenger list from the tragic voyage of the Titanic. The target (dependent) condition is survivorship, marked with a 1 in the appropriate field. The predictor show is sex_cat_, which is the auto-normalized category 1 = male, 2 = female. In the top left graph notice that the 2 is followed by the 1, meaning that being female is a better predictor of survival than being male. The rates are above the graph: 66% and 17%, respectively. These rates also appear underneath that graph, with confidence intervals that show that this is significant at any reasonable statistical level.

2015 AALHE “Actionable Assessment” Conference Proceedings |33
The Receiver-Operator Characteristic (ROC) graph appears top right, with the diagonal a reference line showing the performance of a random predictor. The triangular shape above it is the performance of the gender variable for survivorship, with an area of .75. This area under curve (AUC) is a standard measure of predictive power. Several variables can be combined in a logistic prediction model. This is shown in figure 2.
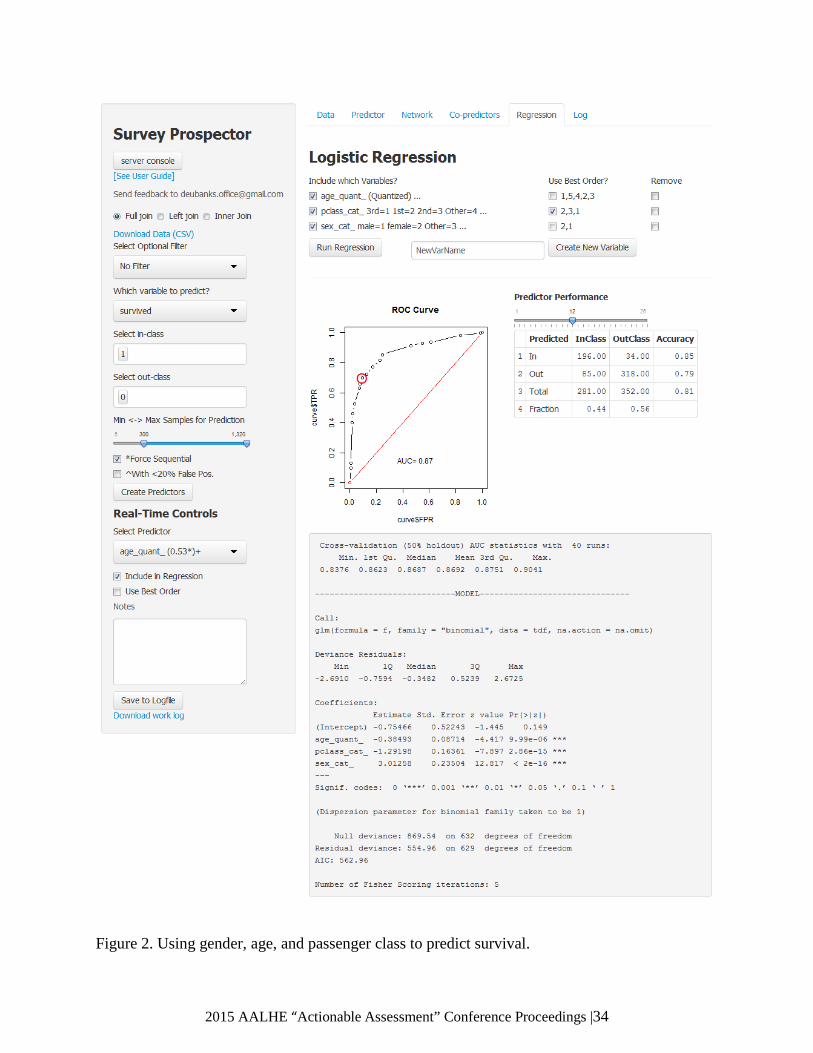
2015 AALHE “Actionable Assessment” Conference Proceedings |34
Figure 2. Using gender, age, and passenger class to predict survival.

2015 AALHE “Actionable Assessment” Conference Proceedings |35
We can see that the AUC has increase from .75 for gender alone, to .87 for the combined model. We must always be careful about overfitting a model, and cross-validation is done automatically by using half the data set to model the other half and check the prediction. This is done forty times, and the results shown. In this case, the worst AUC was .84, meaning that the combination of variables probably does have good prediction characteristics, and we can look for reasons as to why that might be.
Conclusions
The Survey Prospector software has been used successfully to identify attrition risk and assign probabilities of withdrawal to students. This formed the basis of intervention efforts. The software has also been used in many cases for data exploration, to find possibly interesting relationships in data of interest to a college, including admissions data, surveys, and grades. It is a general purpose tool that can be used dynamically in meetings, to answer questions in the moment, or to deliberately mine data for good predictors of some interesting criterion. Access to the program, as well as additional information, can be found at http://highered.blogspot.com/2014/07/survey-prospector.html.
References
Breiman, L. (2001). Statistical modeling: The two cultures (with comments and a rejoinder by the author). Statistical Science, 16(3), 199-231.

2015 AALHE “Actionable Assessment” Conference Proceedings |36
Organizing (Actionable) Home-Grown Assessments for Key Institutional Outcomes
Joan Hawthorne Director of Assessment and Regional Accreditation
University of North Dakota
Abstract
Three basic approaches to assessment of student learning include use of already-existing work products, purchase and use of commercially-developed tools, and development and implementation of locally-developed tools. Although each approach has its own advantages and disadvantages, the opportunities inherent in developing a tool that is ideally suited for meeting a specific campus need and context are easily overlooked. However, when the assessment need is appropriate and the necessary resources are available, development of a home-grown assessment tool can provide significant advantages for an institution. One clear advantage is that the process and findings can be directly aligned with the local campus’s goals and definitions. Another advantage is that faculty involvement in defining standards and scoring work products creates a sense of campus-wide relevance and immediacy for the findings that may be lacking with other tools. Finally, and perhaps most significantly, the faculty development that occurs in the process of creating, implementing, and scoring the assessment provides benefits that persist over time as better understanding of the meaning and value of assessment is generated among faculty campus-wide, creating long-term change in the culture of assessment. Keywords: Institutional outcomes, Assessment tools, Locally-developed, General education, Faculty development, Actionable assessment
Identifying the right strategy for measuring a key outcome can be surprisingly complex. Different stakeholders may express their own data preferences: perhaps board members prefer to see numbers, while foundation directors like results that can be formed into easy-to-tell stories about student learning effectiveness for sharing with prospective donors. Faculty in psychology may want to adhere to what their field sees as the “gold standard” in statistical methods and techniques, while colleagues in the humanities are persuaded that close reading and systematic analysis of student artifact samples can reveal more about learning than would any statistical metric. Those who write reports for program accreditors want data that provide information on difficult-to-assess outcomes specified by their accreditation bodies – maybe “commitment to lifelong learning” or “understanding and use of the highest ethical standards.” The director of general education wants to know how well students are doing on information literacy and quantitative reasoning and what the findings reveal about opportunities for strengthening the program in those areas. And, at least some days, top campus administrators seem interested in little beyond retention and on-time graduation numbers.
Identifying an Assessment Strategy
How does an assessment director begin balancing all these needs? In large part, the solution to a specific assessment need will depend on what needs to be known, who needs the information, and

2015 AALHE “Actionable Assessment” Conference Proceedings |37
for what purpose. And any “menu” of assessment activities on a given campus will likely rely on a range of strategies, including both direct and indirect measures. But when identifying the direct assessments to be used on your campus, there are some general principles to consider. At least three categories of direct assessments of program or institutional outcomes are plausible: assessment of existing student work products, standardized (mostly commercially available) tools, and tools/assessments that are locally developed to meet specific needs.
If the outcome to be assessed is at the level of a program housed within an individual department, work products generated in current courses may be the most desirable and least intrusive approach. They align closely with the curriculum, and scoring (whether done by the individual faculty member as part of grading or collaboratively as part of a program-wide assessment process) and will likely involve people who already have a shared sense of what the outcome “looks like” when they see it in student work. With institutionally owned outcomes, such as those in general education, the challenges of using existing work are greater. There are likely to be inconsistencies in types of work products and perhaps goal definitions. A consistent, meaningful process for collecting and scoring existing work products may be less plausible.
Commercial tools are sometimes viewed as the primary alternative. The good news is that increasing numbers of commercial tools are becoming available, doubtless in response to the ubiquity of this need across institutions of higher education. And they offer advantages: clearly defined costs, the potential for inter-institutional comparability, the availability of reliability and validity information, and “out-sourcing” of the workload. However, as Banta & Palomba (2015) point out, there are drawbacks to these tools as well. They may not measure the outcomes of greatest institutional need, student participants often lack motivation to do their best, and receiving “finished” reports that seem disconnected from the local context sometimes means that faculty don’t view findings as credible or actionable. Even inter-institutional comparability, often a key benefit desired by those using such assessments, loses value when peer institutions turn out to be using different tools or carrying out their sampling in quite different ways.
It is partially because of these problems that locally-developed tools have an appeal. But another part of that appeal is that tools developed and implemented on a specific campus offer real advantages of their own. They can directly align with the specific goal language and rubric used within the institution. Planning and constructing the assessment tool can be a valuable experience for faculty. Findings from the assessment have immediate relevance and actionability, because the assessment reflects institutional goals, values, definitions, and standards. Those who have helped with the assessment work become invested in the results – they help tell the story of the assessment activity, share results with colleagues and friends, and make revisions in their own courses and assignments as a result of what’s learned. In sum, locally-developed tools have significant faculty development value as well as yielding assessment results that inform consideration of courses, curricula, and programs.
Determining Criteria for the Tool
An assessment tool that is best for one institution and purpose may not be best for another, depending on the local context. Considerations that may inform decision-making about the kind of assessment to use could include any or all of the following:
2015 AALHE “Actionable Assessment” Conference Proceedings |38
• Will the tool provide meaningful information about the learning outcome (or in
response to the question about student learning) for which assessment is desired? • Will the results from the tool be reportable to necessary audiences? • Will the process and findings engage faculty and others on campus, i.e., will the
assessment be actionable? • Will the tool allow the program or institution to monitor improvement over time, i.e.,
can similar kinds of data be collected repeatedly if desired? • Will the costs – both financially and in terms of human resources – be appropriate for
the benefit gained? Over both the short and long term? • Does the appropriate expertise exist to create or implement this tool on our campus? • Does the institution have an implementation strategy that can be expected to generate
the appropriate range and numbers of student work products for analysis?
Using criteria such as these, conversations about possible tools can occur.
Creating a Home-Grown Tool
If the discussions about tools result in a decision to develop a campus-specific assessment method, a first step is to determine what outcomes are to be assessed or what questions are to be answered – and for what audiences or purposes. The need should drive decisions about the tool.
Once the assessment need is defined, attention can turn to assembling a team of faculty to develop the tool and plan the implementation strategy. Since one significant benefit of a locally-developed assessment is the faculty development opportunities provided, this is in many ways the most important part of the effort. The core members may be a small group for purposes of efficiency, and they are likely to be drawn from those with strong reasons to be interested in the goal or question. Faculty who are in disciplines with clear connections to the goals, those most committed to an institutional perspective on learning, and those whose programs have similar goals may be easiest to engage. But other faculty may be willing to serve as readers, responders, and “practice students” for a trial run. Involving both an “inner circle” and an “outer circle” of faculty doubles the likely buy-in, the faculty development value, the pool from which to recruit potential scorers, and the number of voices ultimately carrying forward the message about findings and possible curricular implications. All faculty can be invited to “express an interest,” but, on many campuses, busy faculty are most likely to respond to personal requests for their involvement made by people with whom they are acquainted. The importance of building individual connections and then drawing on them to engage faculty in assessment is hard to over-emphasize.
Once organized, the faculty team begins by agreeing on a rubric. In some cases, that may be as simple as agreeing to base the assessment strategy on a currently existing and already familiar rubric. But if that is not in place, the team will need to develop (or find) a rubric that can serve as an extended definition for the outcome.
The most intellectually stimulating (and challenging) part of the process occurs once team members are clear on the outcome, the definition, and the rubric. How can that outcome best be assessed within a specific campus environment? Brainstorming will lead team members to a list
2015 AALHE “Actionable Assessment” Conference Proceedings |39
of options, but that process will be more satisfying if the organizer (typically, the assessment director or, in the case of a general education outcome, the director of that program) starts the conversation by providing a summary of some of the kinds of assessments that have been used elsewhere. This list can be generated by compiling ideas picked up from conferences or via conversations with colleagues at other institutions, assessments described on a listserv or in an archive (ASSESS is an especially useful listerv, with many of its postings preserved in the Assessment Commons archive: http://assessmentcommons.org/; others are available as well), and ideas found by scanning assessment websites of institutions with similar goals and assessment needs. But it’s also possible to begin by listing basic options: if a direct assessment is needed, for example, students will need to demonstrate the work through some sort of writing, speaking, making, or doing that allows the outcome in question to be seen and scored.
Think broadly at the brainstorming stage, considering all the ways in which the outcome can be demonstrated. If an in-class venue is available for conducting the assessment, it will need to be do-able within the constraints of existing courses and existing time blocks – i.e., what will cause instructors to willingly devote class time to administering this particular assessment? How can it be developed in such a way that faculty are eager to be part of that administration? If it is to be administered out of class, different considerations will be important. Who, for example, will manage administration, recruit students, conduct the assessment sessions? What will be the motivation for students to complete the assessment thoughtfully and seriously?
Although consideration of these questions makes the task sound daunting, it can in fact be quite do-able with time for advance planning. On some campuses, existing capstones may be a logical place for the assessment – or for student recruitment. If faculty are generally committed to the institutional learning outcomes, they may be willing to devote a class session to the effort. Alternatively, faculty may act as institutional agents in encouraging or requiring student participation in an out-of-class assessment. It is entirely possible to devise out-of-class assessments that are engaging, even social (depending on the outcome). If your campus has a history (or develops one) of using assessment findings in ways that can be reported to students, willingness to volunteer will quickly increase. (See Appendix A, where two example strategies are described, both administered out-of-class and both effectively engaging students.) Of course, a locally-developed assessment needs to culminate in scoring – another opportunity for faculty participation and development. At some institutions, all faculty are expected to participate in scoring (sometimes on a rotation) and at others, they may be invited and rewarded with stipends. Our own campus offers neither of these benefits. As with all other aspects of a local assessment, the reward can be intrinsic, i.e. the opportunity for collegial engagement around meaningful questions of student learning – done with the confidence that the work will matter. The much-discussed “faculty resistance” to assessment is reduced considerably when the intrinsic rewards (and the opportunity to shape campus-wide programs) are evident. Partnering with leaders of related programs (directors of faculty development, general education, or undergraduate education) or with other administrators (deans, associate provost) to reach out to individual departments or faculty can be another effective recruiting strategy.
2015 AALHE “Actionable Assessment” Conference Proceedings |40
Using the Findings
Developing and implementing institution-specific assessments is not always or automatically the best choice – but the advantages, in cases, where locally-developed is appropriate, become especially clear when it’s time to use what’s been learned. If your scoring session has culminated in a “faculty debrief” based on what they found as they read or viewed the student work, you will be able to supplement summary scoring information with a qualitative analysis based on close examination of the work of many students, as judged by a variety of faculty, in relation to pre-established outcomes criteria. Those qualitative comments are easy to use as “hooks” to engage larger audiences with the findings. An example described by a faculty scorer can bring to life the finding that students struggled with “evaluating sources and information” on an information literacy assessment. Other faculty immediately imagine the kinds of strategies they can incorporate in classes, and the director sees how to implement a program-wide push to help faculty ensure students strengthen their skills in that area. With that kind of reporting and discussion, faculty often leave report-back sessions with concrete ideas for improvements. Program leaders finish the assessment process with a clear loop-closing agenda for their next year’s efforts.
That kind of immediate applicability is the obvious benefit of the effort that goes into planning and conducting an assessment that is appropriate for your own institutional context. In the long run, however, it may be the faculty development that becomes most valuable. Building the pool of faculty who understand how to carry out assessments and who have observed the concrete benefits is a significant step forward in developing a campus culture of assessment.
References
Assessment Commons. (1995-2015). Internet resources for higher education outcomes assessment. [Website archive]. Retrieved from http://assessmentcommons.org/
Banta, T.W. & Palomba, C. A. (2015). Assessment essentials: Planning, implementing, and
improving assessment in higher education. (2nd ed.) San Francisco: Jossey-Bass.
2015 AALHE “Actionable Assessment” Conference Proceedings |41
A Guide to Curriculum and Accreditation Mapping using ExamSoft © Categories and Blueprint Features.
Alisha H. Johnson MSN RN PCCN
Clinical Assistant Professor
Mary-Margaret Finney MSN RN CNE Clinical Associate Professor
Texas State University
Abstract
Accreditation is a voluntary yet often necessary process that requires educational institutions to routinely demonstrate compliance with expectations to assure program quality. This paper will demonstrate a program’s experience with implementation of secure online testing and analytics software. The software provides a valuable tool to assist with the development of categories for tagging assessment questions and mapping curriculum. Blueprints developed from the categorized assessment questions provide a quick reference to demonstrate accreditation compliance and allow for continuous quality improvement within programs schools and institutions. The implementation of any new technology can be perceived as challenging by faculty and program leadership. Considerations include cost, faculty/student resource requirements, and time. The process for implementation requires an organized approach with guidance from a committee of user stakeholders and clear goals. Through this experience the faculty learned that the process should not be rushed, may require incremental implementation, and is multi-faceted and ongoing. Keywords: Accreditation, Secure online testing, Curriculum Mapping, ExamSoft©, Blueprint, Assessment
Background Accreditation of academic programs is often a voluntary process that requires institutions or programs to routinely demonstrate compliance with expectations and assure quality of a program. This process holds education programs accountable to stakeholders, from the students to the public and the educators themselves, by assessing these programs against their own stated outcomes and goals and by national standards (Ellis & Halstead, 2011). Although accreditation is considered voluntary, most institutions of higher education view the process as a necessary step to safeguard program reputation and provide a route to access resources such as state financial funding (Davis, Wade & Weed, 2015).
Ideally accreditation is an ongoing activity that allows for continual self-analysis and improvement, however programs often focus only on the periodic “self-study” and site visits. Similarly, accreditation requirements are often viewed as time consuming and can overwhelm the resources of an institution (Davis et al., 2015). This perception causes programs to neglect the rich

2015 AALHE “Actionable Assessment” Conference Proceedings |42
data obtained through regular routine self-assessments that can guide continuous quality improvement (Ellis et al., 2011). The Commission of the Future of Higher Education (2008) was established by the United States Department of Education (DOE) which found the current accreditation processes to have “significant shortcomings” (DOE, 2008). The commission found the current system of accreditation lacking in transparency and recommended a more outcomes-based and public process to increase accountability (DOE, 2008).
Haviland (2014), states that assessments are tools through which institutions can test program learning outcomes, collect data and track student achievement of these outcomes and use this data to guide program improvement. Similarly, Becher (2013) posits that assessment data can assist academic faculty and administrators to instill a culture of continuous improvement by telling “the story” of student learning and revealing deficits in their knowledge-base (p. 19). Outcome based education is designed to begin with the end in mind, therefore institutions should set outcomes that reflect what is expected of a program graduate at the completion of their studies. To help students achieve the intended outcomes and validate achievement, it is essential that educational programs adapt curricula using assessment findings. Through this process, assessment can assist with program adaptation, formative attainment of knowledge and provide a mechanism for ensuring accreditation compliance with program outcomes (Crespo et al., 2010).
Outcomes based models rely on routine, objective assessment of learning outcomes. This occurs in a recognizable pattern whereby an education program creates outcomes to comply with accreditation standards, assessments are designed to test attainment of these outcomes. Assessment results are analyzed and remedial action is taken when gaps are identified (Atif, Ibrahim, Shuaib & Sampson, 2015).
The process of collecting and analyzing assessment data is often paper-based, labor- intensive and difficult to integrate into usable continuous quality improvement initiatives. Until recently, there were few electronic processes available to assist with analysis of program assessments and existing

2015 AALHE “Actionable Assessment” Conference Proceedings |43
programs were often designed only for individual institutions (Atif, et al., 2015). From these beginnings assessments have evolved to include e-assessments; computer-based, complex online systems which can incorporate learning analytics (Jordan, 2013). An example of this e-assessment model is ExamSoft © advertised as “a market-leading assessment-management solution that supports the entire testing process, including exam creation, administration, delivery, scoring, and analysis” (http://learn.examsoft.com/ ). This software allows the user to collect “actionable data to assess learning outcomes” and thereby assist an institution to meet both accreditation criteria and the opportunity to engage in continuous quality improvement. This paper will demonstrate a method for tracking outcomes and accreditation requirements using secure testing software. The experience of an undergraduate nursing program’s implementation of Examsoft© as a testing platform of choice will be reviewed.
Use of Categories in ExamSoft © When our School of Nursing set out to investigate assessment software to meet the needs of expanding programs, a committee was created to guide the selection and implementation of the software. The testing committee was convened consisting of representatives from all levels of the curricula. Examsoft© was selected as a testing platform of choice due to its user-friendly interface, ability to assist in analyzing student learning through assessments and accreditation compliance. Two super-users were identified from within the committee to assist with training and guide policy development as well as a dedicated IT professional housed within the School of Nursing. The committee made a conscientious decision to keep the number of super-users to a minimum to help control the planning phase and to keep the system of implementation organized. The super-users were also considered champions and assisted faculty with by-in of the new software.
In order to best meet the needs of accreditation compliance, the super-users set about identifying what categories needed to be tracked. Though the process described is specific to this School of Nursing, the general process is translatable to any program of education. Initially, the committee identified necessary levels of tracking required not only for accreditation purposes [Quality Safety Education for Nurses (QSEN), Board of Nursing identified Differentiated Essential Competencies (DECs), BSN Essentials] but also to meet the learning needs of our students in regards to licensure exam preparation (NCLEX test blueprint), Nursing Process, and question leveling via Blooms Taxonomy. However, at the School of Nursing, the Curriculum committee already maps course outcomes to program outcomes and accreditation standards (QSEN, DECs, and BSN Essentials). Therefore, a decision was made to avoid confusion and reduce risk by only mapping assessment questions to course outcomes within the testing software, and to let course outcomes serves as a link between course assessment and accreditation standards.

2015 AALHE “Actionable Assessment” Conference Proceedings |44
ExamSoft© software comes from the developer with pre-populated categories so this was a useful starting point for the process of organizing assessment question categories in a consistent, focused manner. In this committee’s experience, it is best to limit the category organization within the software to just the identified super-users. Once the categories are selected, created and organized by the super-users, the committee then standardized the process of category selection through development of testing policy to guide development of all future assessment questions. This process can therefore assure mapping of all outcomes across all levels in a consistent manner. Once questions are created within the ExamSoft© software and tagged with the appropriate categories, an assessment can then be compiled using individual questions and an overall picture of category usage can be viewed via the exam blueprint (see below).

2015 AALHE “Actionable Assessment” Conference Proceedings |45
These blueprints can then be used to readily demonstrate the programs compliance with accreditation standards as well as to guide continuing quality improvement.
Conclusion In this paper we introduced a method for using secure testing software for tracking outcomes and accreditation standards as well as to facilitate evaluation and ongoing assessment. The implementation of online testing and data analysis provides an opportunity for programs, schools and universities to develop a culture of continuous quality improvement. Ultimately, successful use of any software platform is dependent on two key factors: strong policies and procedures and faculty by-in. Customization of the software to support each individual program’s outcomes and assessment needs takes time and focused effort. The process described in this paper demonstrates the value in the time, effort, and cost of utilizing secured testing platforms as part of an ongoing curriculum evaluation. The possibilities are endless when dedication and commitment exists to building a program focused on a culture of continuous quality improvement and evaluation.

2015 AALHE “Actionable Assessment” Conference Proceedings |46
References
Becher, M. (2013). Instruction coordinators and higher education accreditation: A study of self awareness and assessment documentation use. The Journal of Academic Librarianship, 39, 573-581. doi:10.1016/j.acalib.2013.04.003
Crespo, R.M., Derntl, M., Gutierrez, I., Kloos, C.D., Leony, D., Najjar, J., Totschnig, M. (2010).
Aligning assessment with learning outcomes in outcome-based education. Proceedings from IEEE Education Engineering (EDUCON), 1239-1246. doi: 10.1109/EDUCON.2010.5492385
Davis, S.W., Wade, J., & Weed, D. (2015). Improving the nursing accreditation process.
Teaching and Learning in Nursing, 10, 35-38. http://dx.doi.org/10.1016/j.teln.2014.09.003
Department of Education. (2008). A test of leadership: Charting the future of U.S. higher
education. A report of the commission appointed by secretary of education margaret spellings. Retrieved from http://www2.ed.gov/about/bdscomm/list/hiedfuture/reports/final-report.pdf
Ellis, P., & Halstead, J. (2013). Understanding the commission of collegiate nursing education
accreditation process and the role of the continuous improvement progress report. Journal of Professional Nursing, 28(1), 18-26. doi: 10.1016/j.profnurs.2011.10.004.
Haviland, D. (2014). Beyond compliance: Using organizational theory to unleash the potential of
assessment. Community College Journal of Research and Practice, 38(9), 755-765. doi: 10.1080/10668926.2012.711144 Jordan, S. (2013, Oct). E-assessment: past, present and future. New Directions (Higher
Education Academy), 9(1), 87-106. doi: 10.11120/ndir.2013.00009

2015 AALHE “Actionable Assessment” Conference Proceedings |47
A Model for Impacting Teacher Effectiveness
Tara Rose [email protected]
Director of University Assessment University of Kentucky
Beth Ettensohn
[email protected] Lecturer, Art Education University of Kentucky
Sara Jewell
[email protected] Research Technology Specialist
Indiana University Southeast
Authors Note
The inception of this research began at a meeting for another purpose. A chance meeting between two people charged with different missions became a synergy that produced this model for impacting teacher effectiveness. It may be a rare event that the Director of University Assessment, would take the time to videotape, analyze data, and notate the work of one teacher, but I hope it happens more often for many more teachers.
Abstract
For instructors at the University of Kentucky, the Teacher Course Evaluation (TCE) is the primary catalyst for assessing teacher effectiveness in the classroom and for making personnel decisions. Data from the TCE is used for merit review, promotion, tenure for tenure-track faculty, and decisions that need to be made for rehiring lecturers. However, the responsibility of “showing evidence” of effective teaching falls on the instructor. What are some other methods that instructors can add to their teaching portfolio to help in the decision-making process? What methods of assessment can faculty utilize to aid in continuous improvement of their teaching? What other data sources might be used for further developing a model for impacting teacher effectiveness? Keywords: teacher effectiveness, actionable assessment, VAR model, teaching portfolio, multi-data sources, assessment in Higher Education, reflective practice, teacher evaluation
About the University of Kentucky
Founded in 1865 as a land-grant institution, the University of Kentucky is a public co-educational research university serving 28,000+ graduate and undergraduate students with over 200 academic

2015 AALHE “Actionable Assessment” Conference Proceedings |48
programs. 16 colleges and professional schools are led by over 9,000 full-time staff/ administrators and 1,230 faculty. In recent years, the University has seen a steady rise in the number of non-tenured faculty. A distinctive difference between tenure and non-tenured track faculty is made in their “Distribution of Effort (DOE).” Unlike their tenured counterparts, “research” is not considered a component of the non-tenured DOE. In 2002, Sexton’s Learning University Model challenged the notion of polarization between tenured and non-tenured faculty on the New York University campus. More recently, Scholarship of Teaching and Learning (SotL) has made great gains at the national level by engaging individuals in designing, conducting, and publishing research on teaching and learning. In Spring 2015, The University of Kentucky’s Center for the Enhancement of Learning and Teaching (CELT) provided its first SotL workshop. This introductory workshop and its 12 attendees is a positive sign that University of Kentucky is beginning to entertain the idea that “teaching is a serious intellectual activity that can be both deeply personal and highly collegial (SotL, 2015).” Project Background and Rationale The most common measure used for collecting data for faculty evaluation are TCE rating scales. Typically, the scores are copied and pasted into the annual portfolio without truly performing “a qualitative and quantitative summary of student evaluations” as indicated by the University of Kentucky’s Administrative Regulation 3.10. Weimer (2010) argues that student ratings offer a sound quantitative measure but do little to transform instruction. She challenges faculty members to take voluntary evaluation processes one step further by implementing supplemental evaluations of their teaching. Supplemental evaluations can be as diverse as the specialized disciplines and academic pursuits that they attempt to review. Many methods and strategies have been suggested (Berk, 2005, Braskamp, 1984, Centra, 1993, Geraci, 2012, Partee, 2012), and current practice suggests that the best evidence of the quality of classroom instruction includes multiple sources of data on a longitudinal basis (University of Michigan CRLT, 2014). Teachers who wish to supplement their teaching portfolio with sound data are faced with many questions. What supplemental data can best portray the instructor’s own contributions and accomplishments as a teacher? How can this data be collected and analyzed? What methods of assessment can faculty utilize to aid in continuous improvement of their teaching? The scope of this research is to probe possible data sources and their usefulness in developing a model for impacting teacher effectiveness at the University of Kentucky. In this initial study, a variety of methods was used to collect and compare data from seven semesters of 21 different sections of the same course taught by the same university professor. The methods for collecting data included teacher course evaluations (TCE), mid-term questions, peer review, video activated reflection, and self-reflection.
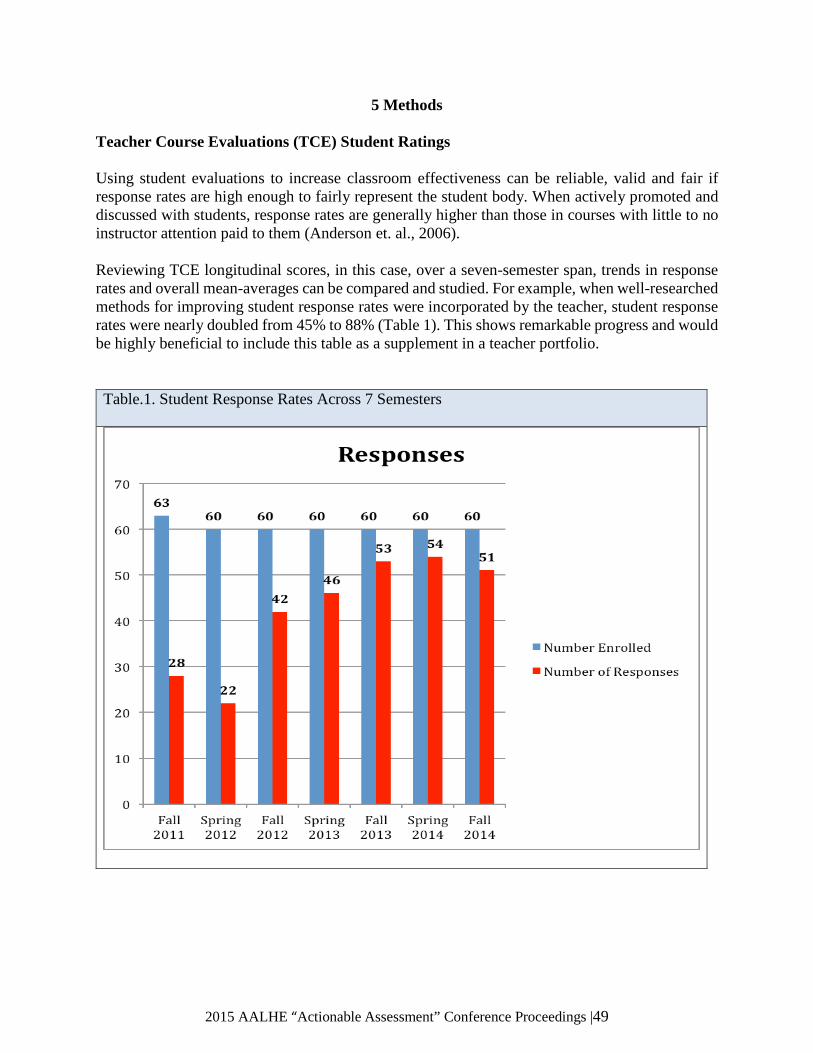
2015 AALHE “Actionable Assessment” Conference Proceedings |49
5 Methods
Teacher Course Evaluations (TCE) Student Ratings
Using student evaluations to increase classroom effectiveness can be reliable, valid and fair if response rates are high enough to fairly represent the student body. When actively promoted and discussed with students, response rates are generally higher than those in courses with little to no instructor attention paid to them (Anderson et. al., 2006). Reviewing TCE longitudinal scores, in this case, over a seven-semester span, trends in response rates and overall mean-averages can be compared and studied. For example, when well-researched methods for improving student response rates were incorporated by the teacher, student response rates were nearly doubled from 45% to 88% (Table 1). This shows remarkable progress and would be highly beneficial to include this table as a supplement in a teacher portfolio.
Table.1. Student Response Rates Across 7 Semesters

2015 AALHE “Actionable Assessment” Conference Proceedings |50
When viewing Table 2, a variety of questions might be generated for further research and action. How do response rates impact the accuracy of data? Is there a link between response rate and non-response bias? Are lower response rates less representative of the entire population? What research has been done to examine the stability of faculty ratings using a longitudinal design? What factors are necessary for greater teacher effectiveness?
Table.2. Overall Mean of Teacher Course Evaluation Questions
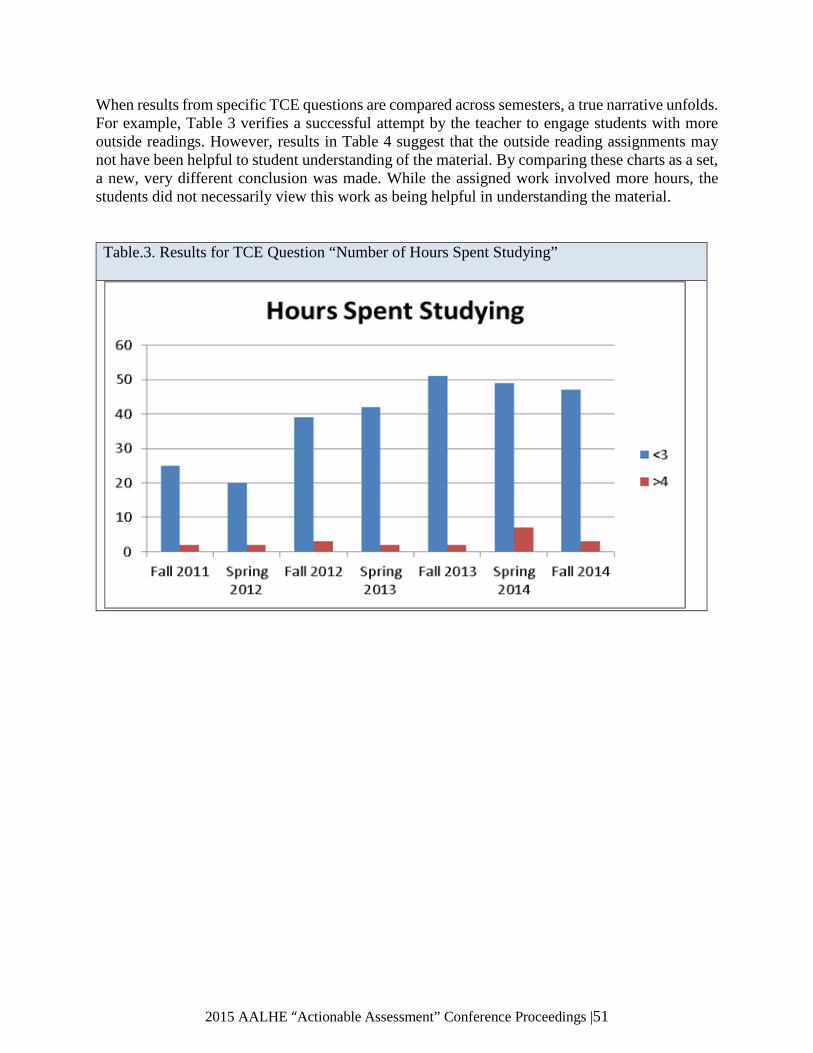
2015 AALHE “Actionable Assessment” Conference Proceedings |51
When results from specific TCE questions are compared across semesters, a true narrative unfolds. For example, Table 3 verifies a successful attempt by the teacher to engage students with more outside readings. However, results in Table 4 suggest that the outside reading assignments may not have been helpful to student understanding of the material. By comparing these charts as a set, a new, very different conclusion was made. While the assigned work involved more hours, the students did not necessarily view this work as being helpful in understanding the material.
Table.3. Results for TCE Question “Number of Hours Spent Studying”

2015 AALHE “Actionable Assessment” Conference Proceedings |52
Table.4. Results for TCE Question “Assignments Helped Understanding”
TCE Open-Ended Questions
Three open-ended questions are included in the TCE at the University of Kentucky. Using student responses to create word clouds, the reviewer is able to quickly visualize some general patterns, and points of possible interest (Table 5). Comparing word clouds over a period of time can be helpful in highlighting main differences and identifying omissions that can be easily determined. However, word clouds are challenging when the connotation has been completely stripped away from the nouns, removing the original sentiment/meaning behind the comments (Nussbaumer, 2012).
70.4% 70.4% 68.4%63.4%
77.4%
49.8%
65.7%
29.6%24.9% 26.8%
36.6%
20.8%
46.6%
28.3%
0.0%
10.0%
20.0%
30.0%
40.0%
50.0%
60.0%
70.0%
80.0%
90.0%
100.0%
Fall2011
Spring2012
Fall2012
Spring2013
Fall2013
Spring2014
Fall2014
Assignments Helped Understanding
Strongly Agree
Agree
Disagree
Strongly Disagree

2015 AALHE “Actionable Assessment” Conference Proceedings |53
Table.5. Word Clouds Generated from Student Open-ended Questions on the TCE
1. Describe the best features of this course.
2. What suggestions would you offer to improve
this course and/or to enhance the instructor’s teaching?
3. What aspect of the instructor’s teaching contributed
most to your experience?
Fall 2013
Fall 2011
Spring 2012
Fall 2012
Spring 2013
Midterm Questions
Using a mid-semester course evaluation and making changes in the course on the basis of student feedback produces a higher-response rate for the end of the semester TCE. This type of evaluation has obvious advantages over those required at the end of the term because students can benefit directly from the feedback provided. After showing the students that their feedback is valued and acted upon, they are more likely to respond to the TCE at the end of the semester (Anderson, Brown, Spaeth, 2006). This is especially true if students believe that ratings will be used for making decisions about the course and faculty member (Johnson, 2002). Beginning in fall 2013, three questions (Table 6) were added to the student online midterm in three sections of Ettensohn’s Pathways to Creativity course. The midterm is a graded comprehensive reflection of the earlier part of the semester and midterms are labeled with student names. The answers to these three mid-term questions provide invaluable insight to the learners and their individual reception of course content. These insights can lead to accommodations for improved student learning. Word counts may also be considered (Table 7).

2015 AALHE “Actionable Assessment” Conference Proceedings |54
Table.6. Open-ended Mid-term Questions
1. “Sensibility” is described as the ability to discern qualitative complexities. Give one
example of how you have been challenged to look at things differently or more deeply during
this course.
2. What is helping you most to learn in this course? Please give a brief example.
3. In this course, what has been the least helpful to your learning? Please be honest and
specific so that I can learn from you what is not working.
Table.7. Midterm Questions Word Count
Word Length Count Word Length Count Word Length Count
course 6 215 learning 8 60 waking 6 1
class 5 178 creative 8 58 wanting 7 1
things 6 110 helped 6 53 warriors 8 1
think 5 109 ideas 5 49 watch 5 1
really 6 102 instructor 10 49 waves 5 1
learn 5 92 great 5 48 weathered 9 1
different 9 91 teaching 8 48 weekly 6 1
teacher 7 89 something 9 41 weigh 5 1
helpful 7 82 challenged 10 40 weighing 8 1
project 7 74 drawing 7 40 welcoming 9 1
hands 5 68 helping 7 37 wellness 8 1
projects 8 68 making 6 36 windows 7 1
example 7 60 wakes 5 1 wisdom 6 1
2015 AALHE “Actionable Assessment” Conference Proceedings |55
Peer Feedback
Peer review is often used as a supplement to teacher portfolios. Peer feedback typically takes the form of classroom observations but can also include reviewing course materials and assignments. For the purpose of this study, a modified version of the Classroom Observation Protocol (COP) was used. The COP was developed by the National Science Foundation to measure teaching quality as a part of their evaluation of their Teacher Enhancement Initiative (1999). COP is unique in its attempt to measure teacher quality. This protocol includes two observers, one with expertise in assessment, and the other knowledgeable in the subject being taught, who observe one class and give scores for classroom environment, lesson structure, implementation, and content. The observation was also video-taped. A post-observation teacher interview followed. For the most part, the peer review for this study was unsuccessful due to lack of teacher preparation. To be more successful in the future, a copy of the full lesson plan and outline of the unit should be submitted to the two observers well in advance of their visit. One observer commented that limiting the number of observed items to check, could be more beneficial. Video-Activated Reflection Positive results have been demonstrated and the use of videotape replay is effective as a tool for helping teachers modify their performance in the classroom teaching/learning process. An even greater level of improved performance is gained when video-taping and self-rating are combined (Ellett, L. E., Smith, E.P, 1970). Video Activated Reflection (VAR) is a method that can be used to assist instructors to improve their teaching in the classroom. VAR has been adapted from a family intervention model, Video Activated Communication (Davis, 2004). While the family intervention model focuses on communication and management strategies between parent and child, the VAR has taken the approach and applied it to the instructor/student relationship in the classroom. VAR focuses on successful outcomes, evident on the videotape replay, which can reinforce successful interactions that are occurring between instructor and student. The VAR process utilizes Beebe, Beebe, and Ivy’s (2013) communication strategies. During Steps 9 and 10, the VAR professional focuses on verbal and non-verbal communication, asking the instructor to reflect on the “captured moments” of each communication mode (Table 8). The discussion between VAR professional and Teacher is an important component (Table 9).

2015 AALHE “Actionable Assessment” Conference Proceedings |56
Table.8. The 11 Steps of Video-Activated Reflection
Step 1: Schedule classroom taping with instructor.
Step 2: VAR Professional tapes the instructor/student relationship in the classroom.
Step 3: VAR Professional reviews tape (s).
Step 4: VAR Professional focuses on instructor strengths and successful interaction in the classroom.
Clips from the recording are selected to share with the instructor.
Step 5: Schedule a meeting to review the videotape clips with the instructor.
• Watch the clips together • Instructor write down thoughts as you review the tape • VAR Professional write down thoughts as you view the tape
Step 6: Instructor to share thoughts about the video.
Note: Many times when seeing ourselves on video we have a tendency to focus on the negative. This is why the VAR Professional will focus on strengths only.
Step 7: VAR Professional to share thoughts about the video – strengths only.
Step 8: Discussion, comparison, reflection. Replay videotape - stop and pause - as needed.
Step 9: Instructor will review nonverbal communication
• Eye contact • Physical delivery – gesture, movement, posture • Facial expression • Vocal delivery – pitch, rate, volume, articulation • Personal appearance
Step 10: Instructor will review verbal communication – the power of words.
• Power to ‘create and label experience’ • Power to ‘communicate feelings’ • Power to ‘affect thoughts and actions’ • Power to ‘shape and reflect culture’ • Power to ‘make and break relationships’
Step 11: Discussion, reflection, and identify actions to improve your teaching.

2015 AALHE “Actionable Assessment” Conference Proceedings |57
Table. 9. Discussion and Comparison of Video Clips - Steps 6 and 7 in the VAR Process
INSTRUCTOR VAR PROFESSIONAL
Strengths Strengths
Prior Knowledge (previous class) Eye Contact – excellent. Instructor made eye contact with each table as she spoke and gave the lecture, and did 1-1 instruction
Visual Scanning Pitch – worked well when giving lecture. Student Affirmation Facial Expressions – instructor laughed and smiled
throughout the class Authentic Examples Real Life Examples - allowed students to
understand what instructor meant when discussing content
Tone affects Energy Board Demonstration – instructor made a point to turn multiple times through the lecture. She would draw on board, then turn around and explain.
Student Involvement with Peers 1-1 instruction – attention was giving to students 1-1
Negative Pace – instructor did a great job on pacing the room environment, moving from table to table
Too Serious Positive reinforcement – instructor continued giving excellent positive reinforcements to student, saying things like: great job, beautiful work, how great for your first, etc
Look Sad Laughing – at one point the instructor laughed and it brightened the room
Facial Expressions – more so when changed from lecture to 1-1 instruction
Don’t smile Board used to draw on is too small for lecture
Kept turning back to students
Lack of Technology
Hover of over particular table
Talking to drawing or object not student
2015 AALHE “Actionable Assessment” Conference Proceedings |58
Self-Reflection
Self-reflection guided by a structured set of questions with self-scoring renders a different perspective. The particular tool used for this study provided enough space to document detailed pondering and questions for future SotL research (Appendix) Table 11 features the evidence identified through the collection of various data. Each method is connected to observational evidence and generates specific actionable goals. By organizing the data in this manner, a specific and cohesive plan can be developed.
Summary
Most of the methods employed by this study proved beneficial for identifying actions to improve teaching. From these options for improvement, short and long-range plans for continuous improvement can be made (Table 10). Working through the Video-Activated Reflection with a VAR professional was most helpful in identifying specific, relevant and attainable short-term goals. Seeing the data organized into graphs provided new perspectives from which new patterns were recognized. The comparisons using longitudinal data across several semesters helped to identify trends, successes and items of concern. Using the data as generated and displayed by this model is a more advanced way to incorporate supplemental evidence of effective scholarly teaching and learning activity into teaching portfolios. Because the responsibility of “showing evidence” of effective teaching typically falls on the instructor, collaboration with assessment and evaluator professionals is essential!

2015 AALHE “Actionable Assessment” Conference Proceedings |59
Table. 10. Actionable Assessments
Method of Data Collection
Evidence Actions
Video-Activated Reflection
* When back is to students – my volume was reduced. Be cognizant of pitch and volume when my back is turned away from the students.
Video-tape the lecture using the “Lightboard” available in the Faculty Media Depot
* My eye contact was not as noticeable with 1-1 instruction.
Say the student’s name before working with them to make that initial eye contact
* Storytelling seemed to bring energy to the room. draft a storytelling outline per lesson plan to further engage students
I became frustrated when a student left early (breaking the policy and expectations in the syllabus) which changed my demeanor.
Review the policy and expectations that are in place.
Confront the student more directly.
Sometimes it is hard for students to see what I am demonstrating.
Consider use of technology for further student engagement- visual/document camera
Self-Evaluation of Teaching & Learning
Survey
This is a 3 credit 100 level course. Students report that they, on average, spend 1-3 hours for outside coursework. This is low for Quality Matters Standards. However, it is average for School of Art & Visual Studies.
Is the number of hours spent outside of class enough -Is this course “too easy?”
Comments on effectiveness of methods/techniques (provide examples):
There is a tremendous gap between who comes prepared and who doesn’t.
Reflection: For 2015-16 school year, implement suggestions made by Michelle Schwartz in her article: “Getting Students to do their Assigned Readings” http://www.ryerson.ca/content/dam/lt/resources/handouts/student_reading.pdf
Instructor makes effective use of learning technologies. Reflection: Review & update use of learning technologies when switching to Canvas for 2016-17 school year and possible use of Mondopad in new Bolivar
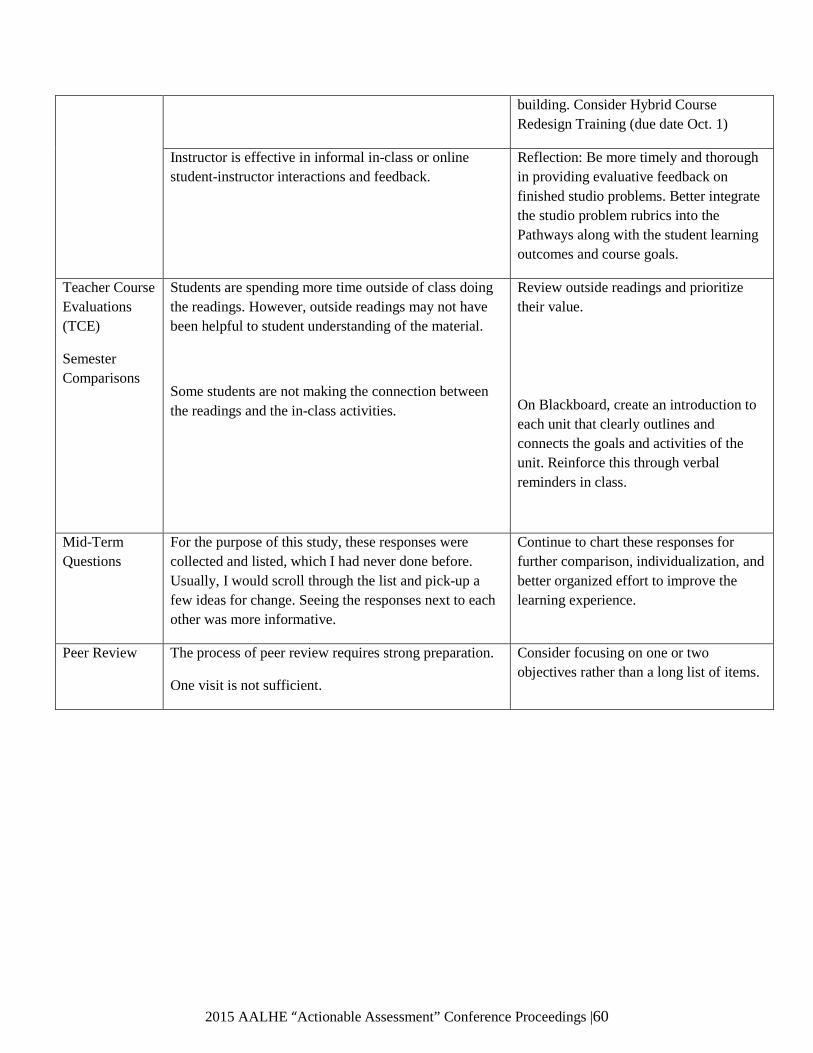
2015 AALHE “Actionable Assessment” Conference Proceedings |60
building. Consider Hybrid Course Redesign Training (due date Oct. 1)
Instructor is effective in informal in-class or online student-instructor interactions and feedback.
Reflection: Be more timely and thorough in providing evaluative feedback on finished studio problems. Better integrate the studio problem rubrics into the Pathways along with the student learning outcomes and course goals.
Teacher Course Evaluations (TCE)
Semester Comparisons
Students are spending more time outside of class doing the readings. However, outside readings may not have been helpful to student understanding of the material.
Some students are not making the connection between the readings and the in-class activities.
Review outside readings and prioritize their value.
On Blackboard, create an introduction to each unit that clearly outlines and connects the goals and activities of the unit. Reinforce this through verbal reminders in class.
Mid-Term Questions
For the purpose of this study, these responses were collected and listed, which I had never done before. Usually, I would scroll through the list and pick-up a few ideas for change. Seeing the responses next to each other was more informative.
Continue to chart these responses for further comparison, individualization, and better organized effort to improve the learning experience.
Peer Review The process of peer review requires strong preparation.
One visit is not sufficient.
Consider focusing on one or two objectives rather than a long list of items.

2015 AALHE “Actionable Assessment” Conference Proceedings |61
References
Anderson, J., Brown, G. & Spaeth, S. (2006). Online student evaluations and response rates reconsidered. Innovate, 2(6). Retrieved from http://www.innovateonline.info/index.php?view=article&id=301
Bain, Ken. (2004). What the Best College Teachers Do. President and Fellows of Harvard
College : Harvard University Press Beebe, S.A., Beebe, S.J., Ivy, D.K. (2013) Communication: Principles for a Lifetime, 5th
Edition. Upper Saddle River, NJ : Pearson Education Inc. Berk, Ronald A. (2005). Survey of 12 Strategies to Measure Teaching Effectiveness,
International Journal of Teaching and Learning in Higher Education. 17(1), 48-62. Bill and Melinda Gates Foundation. (2011). Learning about teaching: Initial findings from the
Measures of Effective Teaching project. Bellevue, WA: Author. Retrieved from .gatesfoundation.org/college-ready-education/Documents/preliminary-findings-research-
paper.pdf Braskamp, Larry A.; Brandenburg, Dale C.; & Ory, John C. (1984). Evaluating teaching
effectiveness: A practical guide. Beverly Hills, CA: Sage. Cashin, W.E, 1995. Student ratings of teaching : the research revisited. IDEA Paper No. 32.
Center for Faculty Education and Development. Kansas State University. Centra, John A. (1993). Reflective faculty evaluation: Enhancing teaching and determining
faculty effectiveness. San Francisco: Jossey-Bass Ellett,L. E., Smith, E.P. (1975). Improving performance of classroom teachers through
videotaping and self-evaluation. AV Communication Review, Fall 1975, Volume 23, Issue 3, pp 277-288
Feldman, K. A. (2007). “Identifying exemplary teachers and teaching: Evidence from student
ratings.” In R. P. Perry & J. C. Smart (Eds.), The scholarship of teaching and learning in higher education: An evidence-based perspective. Dordrecht, The Netherlands: Springer
Flash, P., Tzenis, C., Waller, A. (1995). Using Student Evaluations to Increase Classroom
Effectiveness, (2nd ed). Minneapolis, University of Minnesota. Geraci, L., Finn, L. (2012). Summative Evaluations of Teaching Effectiveness, Custom Research
Brief. Washington D.C. : University Leadership Council Advisory Board. Gurung, R.A., Schwartz, B.M. (2012). Optimizing Teaching and Learning: Practicing
Pedagogical Research. Chichester, Wiley-Blackwell.
2015 AALHE “Actionable Assessment” Conference Proceedings |62
Johnson, T. (2002). Online student ratings: Will students respond? Paper presented at American Educational Research Association Annual Meeting, 2002. Retrieved from
http://www.armstrong.edu/images/institutional_research/onlinesurvey_will_ students_ respond.pdf Marzano, R. J. (2012). The Two Purposes of Teacher Evaluation. Educational Leadership,
November 2012, Volume 70, Number 3, pp 14-19 Nussbaumer, C. (2012) Evaluating Word Clouds, Storytelling with Data Retrieved from:http://www.storytellingwithdata.com/2012/08/evaluating-word-
clouds.html Office of the Provost, University of Kentucky (2000). Policies for Faculty Performance
Evaluation, Administrative Regulation 3.10. Appendix 1. Retrieved from http://www.uky.edu/regs/files/ar/ar3-10.pdf
Partee, G. L. (2012). Using Multiple Evaluation Measures to Improve Teacher Effectiveness :
State Strategies from Round 2 of No Child Left Behind Act waivers. Washington, D.C : Center for American Progress. Retrieved May 26, 2015, from : https://eric.ed.gov/?q=%22no+child+left+behind%22&ff1=subEducational+Indicators&ff2=subEducational+Change&pg=3&id=ED539743
Pregent, Richard (2000). Charting your course: How to teach more effectively. Madison, Wisc.: Atwood (Fig. 9.2.1)
Regents of the University of Michigan (2014). Guidelines for Evaluating Teaching [Center for
Research on Learning and Teaching (CRLT) file]. Retrieved from http://www.crlt.umich.edu
Rosen,L.( 2015). Scholarship of Teaching Resources, Michigan State University College of
Education. Retrieved from : http://www.educ.msu.edu/cst/links.htm Sexton, John, Inaugural Address, September 26, 2002, President’s Office, New York University
SoTL Commons Conference Preview. (2015). Savannah, GA. Retrieved from http://academics.georgiasouthern.edu/ce/conferences/sotlcommons/
Strong, M. (2011). The highly qualified teacher: What is teacher quality and how do you
measure it? New York: Teachers College Press. Weimer, M. (2010). Inspired college teaching: A career-long resource for professional growth.
Hoboken, NJ: Wiley, John & Sons, Incorporated.

2015 AALHE “Actionable Assessment” Conference Proceedings |63
Weisberg, D., Sexton, S., Mulhern, J., & Keeling, D. (2009). The widget effect: Our national failure to acknowledge and act on differences in teacher effectiveness. Brooklyn, NY: New Teacher Project. Retrieved from http://widgeteffect.org/downloads/TheWidgetEffect.pdf
2015 AALHE “Actionable Assessment” Conference Proceedings |64
Detecting, Measuring, and Acting on “Susceptibility to Intervention”
Adam Ross Nelson, J.D. Doctoral (Ph.D.) Student in Education Leadership & Policy Analysis
University of Wisconsin – Madison Graduate Assistant
University of Wisconsin – Madison, Health Services
Introduction This proceeding presents information related to a program known as Badgers Step Up! (BSU!). The program is a synthesis of information and material from the Brief Alcohol Screening and Intervention for College Students (BASICS) (Dimeff, 1999) and the “Step Up!” program. At the University of Wisconsin – Madison (Wisconsin), BSU! began in the 2013-14 academic year. Multiple departments collaborated to implement the program. Wisconsin’s University Health Services (UHS) staff the program with graduate student facilitators. The Division of Student Life (DoSL) which includes the Dean of Students (DOS) office and Wisconsin’s Center for Involvement and Leadership (CfLI) also participate in planning and support for BSU!.
The program consists of a two hour workshop designed to induce students to recognize high risk alcohol consumption, build skills associated with reducing alcohol related risk, and to promote intervention when a student may be experiencing risk. The program includes three modules. The first is on the topic of leadership as it operates at Wisconsin. The second module provides information related to alcohol analyzing and measuring alcohol consumption. The third module teaches five steps for being an effective interventionist when there is alcohol related risk. The specific purpose of the program and all of its materials relate to alcohol beverage risk reduction. Despite the emphasis on alcohol, BSU!’s principles associated with risk reduction apply more universally in other situations that may involve risk. For example the five steps in BSU!’s third module have received attention in literature related to sexual assault prevention (Burn, 2009).
At present, all Registered Student Organizations (RSOs) must send a representative to attend BSU! once per year. Also required to attend are first year Greek students. Wisconsin’s varsity athletes attend BSU! in their sophomore year as well. Each group attends sessions targeted to that group’s cultural identity. For example, in the RSO sessions we often reference the student organization. For Greek audiences we reference chapters in lieu of student organizations. In sessions for athletes we replace organization and chapter with team or advisor.
To assess the effect of the program, staff devised a survey to measure change in student knowledge about rules and regulations associated with alcohol use at Wisconsin. The survey also sought to assess change in attitudes regarding risk reduction and bystander intervention. Students responded to this survey, devised by campus staff, both before and after the program through the Fall of 2014. For the Spring of 2015 staff retired the original survey. In place of the survey staff originally devised, we implemented two previously published and widely used standardized survey instruments for pre and post assessment purposes. After a brief discussion of our methods, this proceeding discusses whether results of these two surveys may indicate that some attendee groups may be more susceptible to the BSU! intervention than other groups. This proceeding then

2015 AALHE “Actionable Assessment” Conference Proceedings |65
explains the selection process associated with the survey instruments implemented in 2015. Finally, we explain how the most recent findings have informed our future assessment plans and goals.
Methods Survey administration remained consistent for both the retired Fall 2014 survey and the Spring 2015 survey. To register as an attendee for the BSU! program, students enter their information via an online registration form. Upon registration, BSU! staff sent students an individualized link to complete the pre assessment survey. After attendance, BSU! staff again sent an individualized link to complete the post assessment survey. Students received appropriate reminders. The survey software allowed us to identify whether respondents were representatives of RSOs, Greek new members, or athletic students.
We collected identifying information because Wisconsin requires students to complete the assessment surveys in addition to attending the program. The software permitted us to track who completed the assessment. Due to the compulsory nature of the survey, the Institutional Review Board (IRB) asked that we include an option in the Spring 2015 survey allowing respondents to opt out of the research associated with this project. This additional question allowed students to respond to the survey, in satisfaction of the university’s requirements, without forcing respondents to participate in the research. The analysis below reports from a subset of data representing only those who did not opt out via the option required by our IRB. Tables 1 and 2 report the sample size for each group, response rates, and age-related descriptive statistics.
Table 1: Fall 2014 Sample size, response rate, and age-related descriptive statistics.
Sample Size
(N)
Response Rate Respondent Ages
Pre Post Mean Range S.D.
RSO Attendees
Greek
Attendees
650
847
65%
62%
86%
63%
22.18
18.47
17-48
17-24
3.55
.77
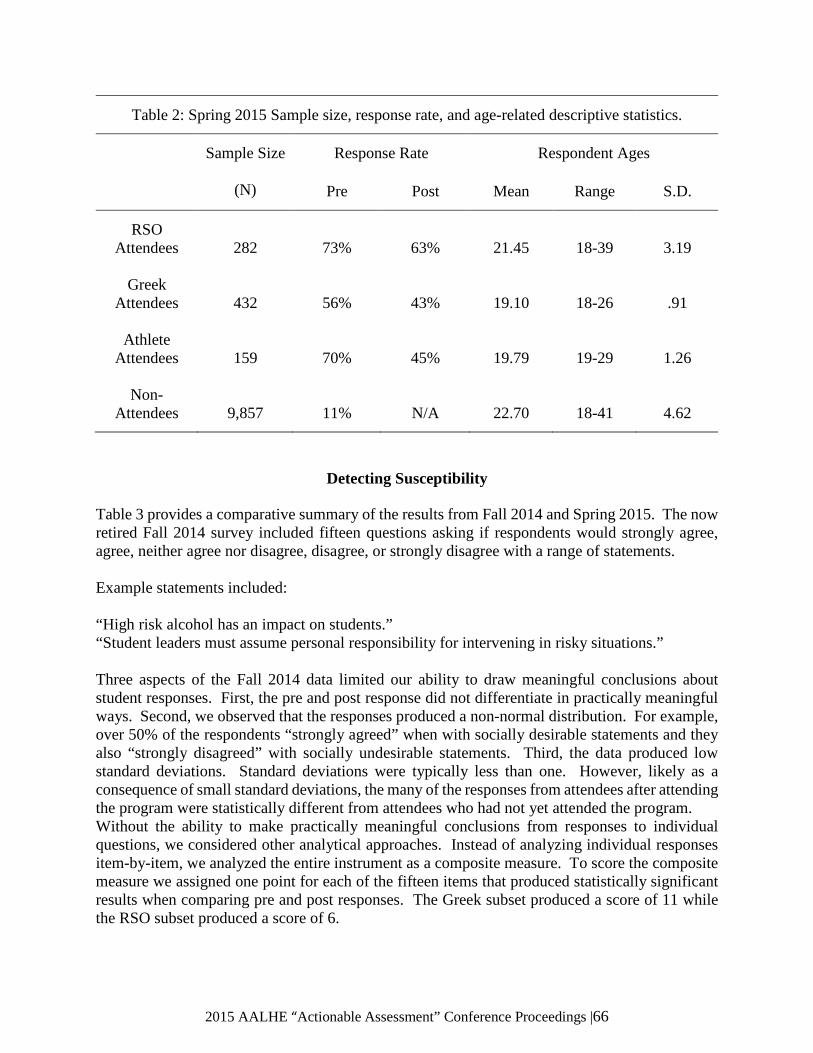
2015 AALHE “Actionable Assessment” Conference Proceedings |66
Table 2: Spring 2015 Sample size, response rate, and age-related descriptive statistics.
Sample Size
(N)
Response Rate Respondent Ages
Pre Post Mean Range S.D.
RSO Attendees
Greek
Attendees
Athlete Attendees
Non-
Attendees
282
432
159
9,857
73%
56%
70%
11%
63%
43%
45%
N/A
21.45
19.10
19.79
22.70
18-39
18-26
19-29
18-41
3.19
.91
1.26
4.62
Detecting Susceptibility Table 3 provides a comparative summary of the results from Fall 2014 and Spring 2015. The now retired Fall 2014 survey included fifteen questions asking if respondents would strongly agree, agree, neither agree nor disagree, disagree, or strongly disagree with a range of statements. Example statements included: “High risk alcohol has an impact on students.” “Student leaders must assume personal responsibility for intervening in risky situations.” Three aspects of the Fall 2014 data limited our ability to draw meaningful conclusions about student responses. First, the pre and post response did not differentiate in practically meaningful ways. Second, we observed that the responses produced a non-normal distribution. For example, over 50% of the respondents “strongly agreed” when with socially desirable statements and they also “strongly disagreed” with socially undesirable statements. Third, the data produced low standard deviations. Standard deviations were typically less than one. However, likely as a consequence of small standard deviations, the many of the responses from attendees after attending the program were statistically different from attendees who had not yet attended the program. Without the ability to make practically meaningful conclusions from responses to individual questions, we considered other analytical approaches. Instead of analyzing individual responses item-by-item, we analyzed the entire instrument as a composite measure. To score the composite measure we assigned one point for each of the fifteen items that produced statistically significant results when comparing pre and post responses. The Greek subset produced a score of 11 while the RSO subset produced a score of 6.

2015 AALHE “Actionable Assessment” Conference Proceedings |67
Specifically, Greek responses before attendance differed from their responses after attendance at statistically significant levels on 11 of the 15 statements. Responses of RSO representatives before attendance differed from their responses after attendance at statistically significant levels on just 6 of the 15 statements. Using ordinary least squares regression we also controlled for age which did not modify the count of statistically significant results. Missing and incomplete gender data prevented us from controlling for gender. Observing that the Greek score was almost double the RSO score resulted in a hypothesis that Greek students may be more susceptible to the BSU! intervention than the RSO students. The next section of this proceeding details the process associated with our attempts to measure and further understand this potential difference in susceptibility.
Measuring Susceptibility While making no adjustments to the program from Fall 2014 to Spring 2015, we adopted a new set of measures for pre and post assessment in the Spring of 2015. We reasoned that applying a new measure to the same program would assist in either confirming or disconfirming the tentative conclusion made from the Fall 2014 data. We applied the same composite scoring approach to the Spring 2015 survey data.
We selected two instruments associated with risk reduction and bystander intervention research. The decisional balance scale (DBM) (Banyard, et. al. 2005) provides two scores including one that represents a measure of attitudes or opinions in favor of intervention (DBSpro), and measuring attitudes or opinions weighing against intervention (DBScon) when someone may be at risk of harm or injury. The 11 item instrument asks participants to rate each statement on the following scale: 1 (Not important at all), 2 (Slightly important), 3 (Moderately important), 4 (Very important), 5 (Extremely important). The prosoical tendency measure (PTM) (Carlo & Randall, 2002) is a 23 item instrument, asking respondents to rate each statement on the following scale: 1 (Does not describe me at all), 2 (Describes me a little), 3 (Somewhat Describes me), 4 (Describes me well), 5 (Describes me greatly). Carlo & Randall (2002) determined, from the results of two separate studies, the instrument “demonstrated adequate internal consistency, temporal stability” (p. 42). Together, over the past decade, both the DBS and PTM have been cited by hundreds of other published studies, many which relate to alcohol, which indicates use and acceptance in the research and scholarly communities. Comparing pre and post responses, Greeks responded differently at statistically significant levels on 0 of the 11 DBS items and 6 of the 23 PTM items. Representatives from RSOs responded differently at statistically significant levels on 4 DBS items and 1 PTM item. Athletes responded differently at statistically significant levels on 1 DBS item and on 3 PTM items. When controlling for gender and age the results did not change. An additional important result to report is that the DBS and the PTM both result in composite sub scores. When analyzing the composite sub scores for differences between the pre and post responses, there were no statistically significant results for any of the groups.

2015 AALHE “Actionable Assessment” Conference Proceedings |68
Table 3: Comparative summary of results Fall 2014 to Spring 2015.
Fall 2014 Spring 2015
15 Item Retired Survey Score
11 Item DBS Score
23 Item PTM Score
RSO Attendees
Greek
Attendees
Athlete Attendees
6 Items
11 Items
N/A
4 Items
0 Items
1 Items
1 Items
6 Items
3 Items
Conclusion - Acting on Susceptibility Since the Greek post responses differed at statistically significant levels on nearly twice as many items as RSO students in the Fall 2014 survey, we hypothesized that Greek students may be more susceptible to the BSU! intervention. From the Spring 2015 DBS and PTM data however, we observed Greek post responses were statistically different from their pre responses on a total 6 items while RSO responses were statistically different on a total of 5. From these observations we are unable to confirm the hypothesis suggested by the Fall 2014 data, that Greek students might be more susceptible to the BSU! intervention than RSO students. Further limiting our ability to confirm the hypothesis from Fall 2014 was that we observed no statistically significant results when analyzing the composite sub scores associated with the DBS and PTM instruments.
An important incidental finding is that student attitudes, as measured by some of the individual DBS and PTM items, seem to have changed in the intervening time between their pre and post responses. That there were some statistically significant results in both semesters indicates that the students who participated in the program experienced some learning in the period intervening between their pre and post assessment responses. Attitudes of students from before and after attending the BSU! program, as measured by the DBS and PTM also seem to vary significantly by gender. For example, the pre and post responses from men were statistically the same on the DBSpro component sub score. Women, however on the DBSpro score provided responses differing by .06 standard deviations, which was significant at the .001 level. Conversely, men provided responses differing by .25 standard deviations significant at the .01 level following the BSU! program on the DBScon component sub score. Women’s responses on the DBScon were statistically the same as their pre responses.

2015 AALHE “Actionable Assessment” Conference Proceedings |69
Ultimately, the pre and post assessment method has limitations that prevent attributing changes as caused by the BSU! program. Most importantly, there is no meaningful counterfactual. In the examples from this proceeding, students complete the pre assessment at a point in time before attending the BSU! program (A1). The respondents completed the post assessment at a subsequent point in time after attending the BSU! program (A2). Campus staff reported the actual time elapsed between A1 and A2 ranges from a matter of hours to a matter of weeks. Differences in the student’s responses may be due to factors other than the BSU! program. The pre to post assessment method does not account for effects from other events and happenstances outside of the BSU! program. Two solutions would overcome these limitations. First, a randomized controlled trial (RCT) would provide a well-accepted methodological approach associated with rigorous support of causal claims. An RCT designed to test the causal effects of a program like BSU! would involve recruiting subjects to attend an educational workshop. A randomly selected group of subjects would attend a workshop related to a topic designed to control for attending a two hour-long workshop. A separate randomly selected portion of the subjects would attend the BSU! program. By comparing post assessment responses between the control and treatment groups staff may offer more meaningful conclusions related to the causal effect of the BSU! program, if there is any. A second method could be to combine a method known as differences-in-differences (DID) with the pre and post assessment. When combined with DID this approach involves using a comparison group who also responded to the pre and post assessments but who did not attend the intervention. Allison (1990) discussed the application of this “nonequivalent control group design” paired with pre and post assessments. The nonequivalent control group provides data that can assist in differencing out changes that were not caused by the program. The Schlotter et. al. (2011) described the insight this method provides in analyzing change over time:
Means might differ in the absence of treatment. However, as long as this difference is constant over time (in the absence of treatment), it can be differenced out by deducting group-specific means of the outcome of interest. The remaining difference between these group-specific differences must then reflect the causal effect of interest.
Finally, also likely to be effective for assessment purposes will be to implement, as we plan to, a course of qualitative approaches. We intend to implement a series of focused interviews with students who attend the program in the 2015-2016 academic year. The quantitative analysis presented here has heavily informed the planning for our qualitative assessment plans. Questions we intend to investigate relate to further understanding the prospect that some groups may be more susceptible to the BSU! intervention than others, either as a function of gender or organizational affiliations. Another important question raised by our previous quantitative approaches is whether different types of messaging may be more or less effective with different audiences. For example, consider the gender differences discussed above associated with the DBSpro and DBScon component sub scores. Might it be more effective to emphasize with male audiences discussion of matters that weigh against intervention instead of matters that weigh in favor? Might women better benefit more from discussion of matters that weigh in favor of intervention rather than matters that weigh against?

2015 AALHE “Actionable Assessment” Conference Proceedings |70
Despite an inability to confirm or disconfirm whether some groups may be more susceptible to intervention than others, this proceeding discussed the deliberative and analytical approaches associated with our efforts to produce and report meaningful assessment results related to the Badgers Step Up! program at the University of Wisconsin - Madison.
References Allison, Paul D. “Change Scores as Dependent Variables in Regression Analysis.” Sociological Methodology 20, no. 1 (January 1990): 93–114.
Banyard, Victoria L., Elizabeth G. Plante, and Mary M. Moynihan. “Rape Prevention through Bystander Education: Final Report to NIJ for Grant 2002-WG-BX-0009.” Durham: University of New Hampshire, 2005.
Burn, S. M. (2009). A situational model of sexual assault prevention through bystander intervention. Sex Roles, 60(11-12), 779-792.
Carlo, G., & Randall, B. A. (2002). The development of a measure of prosocial behaviors for late adolescents. Journal of Youth and Adolescence, 31(1), 31-f44.
Dimeff, L. A. (Ed.). (1999). Brief alcohol screening and intervention for college students (BASICS): A harm reduction approach. Guilford Press.
Leadership Framework. University of Wisconsin. (n.d.). Retrieved March 10, 2015, from http://leadership.wisc.edu/leadership-framework.htm
Schlotter, Martin, Guido Schwerdt, and Ludger Woessmann. “Econometric Methods for Causal Evaluation of Education Policies and Practices: A Non-Technical Guide.” Education Economics 19, no. 2 (May 2011): 109–37. doi:10.1080/09645292.2010.511821.
Step Up! Program. Arizona State University. (n.d.) Retrieved May 12, 2015, from http://stepupprogram.org/
2015 AALHE “Actionable Assessment” Conference Proceedings |71
Assessment and Accreditation: An Institutional Collaborative Model
Stacy Sculthorp Lead Assessment Specialist
Jeremie Bellenir
Associate Director, Accreditation
Heather Schroeder Assessment Specialist
Capella University
Abstract
Capella University is a mission-driven culture focused on learner success and maximizing each adult learner's personal and professional potential. Capella's educational philosophy incorporates the scholar-practitioner model. This model considers that learners build on previous knowledge; that is, each educational level incorporates the knowledge gained at the previous level while also incorporating real-world knowledge and experience. Learners are expected to synthesize scholarship with practical application on a continuum from practitioner to scholar, with an emphasis based on their degree level.
Capella University is accredited by The Higher Learning Commission. Capella University leverages a unique organizational structure to realize a competency-based educational philosophy within an exclusively online environment. An important part of this structure is the collaborative relationship between assessment and accreditation professionals, which helps Capella programs meet and exceed external expectations and standards. The assessment and accreditation staffs collaborate with each other and with faculty to ensure successful outcomes and continuous improvement for all accredited programs within Capella University.
Keywords: Accreditation, assessment, competency, collaboration, learning outcomes
Accreditation and Assessment Partnership Accreditation work requires consistent knowledge of context and subject matter, as well as the ability to foster positive relationships with a variety of stakeholders across functional groups including institutional leadership. The accreditation and assessment teams within Capella University, while collaborative, pursue distinct work assignments, often assigned by school or discipline, for the purpose of clarity on context, subject matter, and relationships. Assessment work requires knowledge of Capella University’s competency-based curricula. Assessment specialists work with a number of stakeholders across the university to support the actualization of Capella’s competency-based educational philosophy. Key responsibilities of the
2015 AALHE “Actionable Assessment” Conference Proceedings |72
assessment specialist at Capella University include analyzing assessment data to drive learner success and competitive advantage, assessing learning outcomes data for continuous quality improvement, providing quality assurance of Capella’s assessment system, and evaluating assessments for accuracy in measuring learning.
Accreditation and assessment staff, along with academic and market owners, are accountable for accreditation pursuits and maintenance. The goal is to ensure success through productive collaboration. An appropriate staffing structure with sufficient expertise, talent, and capacity is necessary to fully partner on the pursuit and maintenance of accreditations. Accreditation specialists and assessment specialists bring expertise in accreditation processes and approvals, external agencies, authentic assessments, and different types of data analysis. To ensure optimal service to internal stakeholders, a portfolio lead serves as the primary accreditation specialist and contact for leadership (VPs, directors, deans, and markets and products managers) for accreditations and approvals that fall within each portfolio of accreditations. In addition, each assessment specialist is assigned to one or more accreditations so that this individual understands the internal and external assessment-related accreditation goals, while gaining a long-term view of the applicable data.
The accreditation and assessment teams are organized in a manner that reflects a “composite organization.” According to the Project Management Book of Knowledge a composite organization is a blend of a functional and matrix organization, where some organizations allow for groups that provide specific services for multiple, similar functional areas and groups. The accreditation and assessment staff completes work with multiple institutional leaders, with an intentional focus on collaboration and execution across the accreditation and assessment staffing model, processes, and documentation. The purpose of this type of organization is to create subject matter experts allowing all accreditation and assessment staff the opportunity to provide leadership internal and external to the team. This also allows accreditation and assessment staff the opportunity to serve across disciplines, limiting single points of failure and addressing the challenges of context, cooperation, control, and community within a matrix organization (Hall, 2013).
This structure creates consistent partnership and accountability, providing one point of contact for institutional leadership while creating a leadership framework that will require and drive collaboration among accreditation staff to successfully deliver on individual initiatives. To ensure collaboration and execution, accreditation staff leads quarterly attestation meetings regarding each portfolio to identify current and upcoming initiatives, and necessary deliverables (including owners). Assessment specialists attend these quarterly attestation meetings to review assessment related needs.
Documentation
To provide value to internal stakeholders and ensure positive performance, accreditation and assessment staff members drive towards standardization of documentation and processes. For accreditation specialists, this includes the use of established reporting standards, standard governance and attestation materials, project planning tools, and escalation and status update tools and methods. For assessment specialists, this includes reviewing quarterly learning outcomes data, reviewing assessments required by external accreditors, and providing detailed data analyses on specified programs on a quarterly cycle.

2015 AALHE “Actionable Assessment” Conference Proceedings |73
Process
Accreditation specialists and assessment specialists partner with stakeholders across the life cycle for accreditations and other approvals. The accreditation cycle includes five phases: discovery, review, verification, decision, and maintenance. This life-cycle is illustrated below.
Visual
Throughout each stage, the goal is to monitor program and course development and revisions while collaborating with academic owners – the faculty. During the initiation stage, accreditation specialists initiate accreditation governance. Accreditation specialists and assessment specialists partner during this phase to review necessary curriculum work, identify a specific assessment specialist resource, and review standards to understand if there is a fit between agency and institutional assessment expectations. During the discovery stage, accreditation specialists and assessment specialists partner to fulfill requirements for self-studies and the preliminary application.

2015 AALHE “Actionable Assessment” Conference Proceedings |74
During the review stage, accreditation and assessment specialists partner to complete work related to assessment-specific standards, identify common interpretations of standards and data necessary to demonstrate compliance, identify possible contributors external to the faculty-assessment-accreditation triad, and encourage intentional communication or meetings between assessment and accreditation to build accountability, trust, and confidence with faculty and other internal customers. During the verification stage, accreditation and assessment specialists work together as needed during the site visits. During the decision stage, external accreditors provide the accreditation decision. Accreditation specialists communicate these decisions and accreditors’ feedback to faculty and assessment specialists for the purpose of creating improvements. Finally, during the maintenance stage, accreditation and assessment specialists work together to support the continuous improvement cycle. This includes annual verification of standard alignment, quarterly attestations, and annual or interim reports. Record keeping is an important function of accreditation and assessment work, and standardization of record keeping is also a critical function of the university to maintain an accurate history of accreditation pursuits and maintenance while also minimizing disruptions and ensuring continuity of service.
References
Project Management Institute (2004). A guide to the project management body of knowledge: (PMBOK guide). Newtown Square, PA: Project Management Institute, Inc.
Barlett C.A., Ghoshal, S. (1990). “Matrix Management: Not a Structure, a Frame of Mind.”
Harvard Business Review, 68(4), p. 138-145. Hall, K. (2013). Making the matrix work: How matrix managers engage people and cut
through complexity. London: Nicholas Brealey Publishing.

2015 AALHE “Actionable Assessment” Conference Proceedings |75
Graduate Programs: Shifting the Mindset from
Individual-Student to Program-level Assessment
Monica Stitt-Bergh
Associate Specialist of Assessment University of Hawai’i
Abstract
Graduate programs need to carry out program-level learning outcomes assessment. Because their context differs from undergraduate programs, they cannot always mirror undergraduate assessment practices. In this paper, I highlight features of graduate programs at research universities that have an effect on student learning outcomes assessment. I offer strategies for assessment coordinators/leaders who work with graduate programs. Keywords: graduate education; outcomes assessment Graduate program student learning outcomes (SLO) assessment has received little attention in the literature, which is dominated by undergraduate and general education program assessment. The structural differences between graduate and undergraduate programs and graduate faculty perceptions indicate that assessment practitioners need to approach graduate programs differently. In this paper, I draw on my interactions with graduate programs at a research university to describe characteristics of graduate programs that have an effect on SLO assessment and I offer strategies for assessment coordinators/leaders who work with graduate program assessment. The structural differences between graduate and undergraduate education at a U.S. research university are striking. For example, the following features of graduate programs change the view of outcomes assessment:
• Graduate program faculty handle admissions, not an admissions office. They look for an
intellectual fit between prospective students and current faculty members, which begins the close faculty-student connection.
• Graduate programs typically have fewer students per faculty member when compared to undergraduate programs.
• Graduate programs may be overseen by a dean of graduate education or research, not a dean of a subject-area college, which can obscure assessment reporting lines and requirements.
• A higher percentage of graduate programs have professional accreditation with specific assessment requirements, terminology, and reporting formats.
• Graduate students matriculate already committed to an academic discipline; they do not declare their major partway through and do not switch majors as frequently happens in undergraduate education.
2015 AALHE “Actionable Assessment” Conference Proceedings |76
• Graduate students often take their courses from one program with the exception of a few cognate courses; they do not complete a curriculum based on the liberal arts tradition.
• Graduate students in the same program can pursue distinct, narrowly-focused avenues of study, resulting in very different sets of knowledge and skills across students at program completion.
• Graduate programs, by design, have program-level, culminating work (e.g., thesis, final creative project) that is evaluated by a faculty committee.
These differences shape faculty perceptions of students, particularly doctoral candidates. They lead to faculty’s personal investment in and a strong connection to individual students and their research or creative projects. Faculty see themselves as mentors in an apprenticeship model and take individual students as their advisees for a year or more. I stress individual because the faculty relationship with the individual student is one reason graduate faculty have difficulties adopting a program-level mindset. The faculty make the following types of statements: “We already know what each student can do because we spend hours with them in the lab.” “Our program is fit to each student—there is no set of common courses.” “I know where each of my students got a job and all of them are successful.” Their focus on individual students runs counter to program SLO assessment that seeks to gather information across students to guide program decisions. Thus, an underlying challenge with graduate program SLO assessment is shifting the mindset from what individual students can and cannot do to a mindset of what the program is and is not doing well in terms of helping students achieve the desired program learning outcomes.
In the next section, I discuss several specific challenges posed by graduate education structure and faculty perceptions and offer strategies to consider.
Curriculum map. The purpose of creating a graphical illustration of the curriculum and outcomes is to facilitate planning, curriculum coherence analysis, and interpretation of assessment results. A cursory examination of a completed curriculum map quickly reveals the extent of coverage of the outcomes. The customary curriculum map for an undergraduate program lists each course and experience and often uses a scheme to indicate whether the outcome is being introduced, reinforced/practiced, or mastered at the senior level. Graduate programs may find this approach does not work if course-taking patterns and the content of out-of-course experiences (e.g., exams, oral defenses, theses/dissertations, clinical experience) are tailored to students’ particular research interests in order to provide specialized knowledge and skills that allow students to contribute (original) research/creative projects to their chosen field of study.
An alternative that may make more sense to graduate faculty is to group courses together, emphasize non-course requirements by listing them separately, and use a checkmark system instead of an “introduce to master” scheme (Table 1). A faculty discussion on a curriculum map that matches the program structure and faculty perceptions is a powerful activity that helps shift faculty to a program mindset.

2015 AALHE “Actionable Assessment” Conference Proceedings |77
Table 1. Example of a PhD Program Curriculum Map
Requirements
Student Learning Outcome Areas
Knowledge Scholarly inquiry Communication Professional
responsibility
Core courses X* X X
Elective courses X
Comprehensive exam X * X
Proposal X X
Proposal oral defense X X
Dissertation X * X * X *
Dissertation defense X X * X *
Professional activity (e.g., teaching, conference)
X * X * X *
* Evidence collected for program-level decision making
Evaluation of evidence. Assessment experts recommend multiple evaluators for a single piece of student work. Although this occurs in the typical graduate program (e.g., thesis committee), the faculty often do not use shared, agreed-upon evaluation criteria. Faculty’s close and extended work with students may lead them to believe explicit criteria are superfluous. However, common evaluation criteria are needed in order to fairly and accurately draw conclusions about program performance. Individual student results based on common criteria can be pooled to create a cross-student picture—a picture of the program. One tactic to help faculty collaboratively develop evaluation criteria is to ask them to start with professional criteria used in their discipline: journal reviewer guidelines, grant review guidelines, teaching evaluation checklist, etc. Faculty can modify these to create program-level criteria and also use them to help students’ professional development and knowledge of disciplinary conventions and expectations. Alternatively, rubrics exist and faculty may also adjust an existing rubric used at another university or degree program (see Hill, 2015; Khan, Khalsa, Klose, & Cooksey, 2012; thesis/dissertation rubrics under “Rubric Resources,” n.d.).
A different strategy involves building upon a graduate program’s semester or annual performance review of individual student progress. Many programs on our campus hold a meeting to discuss each student individually, but the focus is on courses taken and time to degree. To turn this into a

2015 AALHE “Actionable Assessment” Conference Proceedings |78
SLO assessment activity, programs can craft a developmental rubric of expertise that references the program SLOs (developmental rubric examples: Dirlam, n.d., “Wisdom Profiles”). Faculty use their multi-faceted, well-informed knowledge of each student to complete the rubric in collaboration with other faculty during the meeting. They do not use the rubric to evaluate one piece of student work; instead, they base their evaluation on their interactions with the student and his/her products. Faculty can use the same developmental rubric each year to evaluate students at any point in their degree. This is a form of direct evidence in SLO assessment because faculty experts make evidence-based judgements. To increase credibility, faculty document the evidence upon which the evaluations are made in formal meeting minutes. The final key, as explained next, is aggregation.
Aggregation of results. When faculty (committees) evaluate students using the same criteria, the results can be aggregated and used for program-level decision making. The aggregated results encourage faculty to shift from interpretation based on individual students to an explanation of program effectiveness in enabling students to meet faculty expectations. Given the close relationship between faculty and students, the shift can be difficult. Faculty may still point to individual students to explain the results. The conversation needs to be gently returned to asking and answering questions about the overall picture that aggregated results paint in terms of program quality and opportunities to learn. An assessment coordinator can more easily steer the conversation when he/she has a well-designed chart or image that immediately tells the story of program effectiveness in terms of SLO achievement. A small graduate program (e.g., fewer than seven graduates per year) compounds the problem: too few students to form patterns in a given year. Public reporting of results cannot occur until a sufficient number guarantees student confidentiality and trends cannot be examined until several years of data are aggregated. In this case, a program can either evaluate evidence as it is submitted and later aggregate, or it can accumulate the evidence and later have a team of faculty evaluate and aggregate. In my experience, ongoing evaluation and reflection is more efficient and effective, and if students’ aggregated results—even if only a few students’ results— resonant with many faculty during careful examination, the program can consider action. Two important points when interpreting results from small programs: first, I recommend faculty take a program view by critically reflecting on whether the student populations are similar or different as they make sense of multi-year results; and second, I actively direct the conversation to long-term, program development actions likely to benefit groups of students. In sum, my work with graduate programs helped me articulate the differences in structure and faculty perceptions and led me to adapt assessment strategies used for undergraduate programs so they are meaningful and contribute to graduate program improvement or evolution. In particular, mapping the curriculum, harnessing existing individual student evaluation practices, and appropriate aggregation of results to allow for program-level decision making, are where I see the important distinctions between program SLO assessment in undergraduate and graduate programs. The potential confusion arising from different approaches across degree levels is overshadowed by the benefits of strategies that fit program structure and faculty perceptions because assessment practices that match culture are more likely to be worthwhile and sustainable.
2015 AALHE “Actionable Assessment” Conference Proceedings |79
References
Dirlam, D. (n.d.). Wisdom Profiles. In Changing Wisdoms. Retrieved from http://changingwisdoms.org/
Hill, Y. Z. (2015). From evaluation of individual students to program level assessment of
learning—Implications for graduate programs. Retrieved from http://manoa.hawaii.edu/assessment/workshops/pdf/graduate_programs_2015-02.pdf
Khan, R., Khalsa D. K., Klose, K., & Cooksey, Y. Z. (2012). Assessing graduate student learning
in four competencies: Use of a common assignment and a combined rubric. Research & Practice in Assessment, 7, Winter. Retrieved from http://www.rpajournal.com/dev/wp-content/uploads/2012/11/A2.pdf
Rubric Resources. (n.d.). Student Learning, Outcomes Assessment and Accreditation, University of Rhode Island. Retrieved from http://web.uri.edu/assessment/uri/rubrics/

2015 AALHE “Actionable Assessment” Conference Proceedings |80
When Standardized Tests Give Sorry Results
Janet Thiel Associate Vice-President for Academic Affairs
Neumann University
Abstract
With an increasingly underprepared student population, how does an institution use valid assessment data to counteract standardized scores that fall below the norm? This session will focus on the appropriate use of direct and indirect assessment data to counter low means of standardized testing data to show valid learning and value-added learning in the area of Critical Thinking. An expanded definition of critical thinking will include transformative learning, reflective practice, and metacognition. Keywords: assessment, standardized testing, critical thinking, valid learning
Brookfield (1995) deems reflection on praxis as critical; a useful reflection tool is metacognition. Metacognition is the thinking about learning that is critical to the learning process, thus it is imperative that students regulate their own thinking process and transfer this learning to new situations (Ormrod, 2004). For survival in the modern world, students need to learn rigorous higher-order thinking; to do so, universities must create a serious intellectual culture within its boundaries (Ripley, 2013). McCarthy (2012), in consideration of Neuroscience and the Millennials, describes the learning cycle as having the key components of communication, critical thinking, collaborative problem solving, and creativity. Mezirow (J. Mezirow & Associates, 2000) describes transformative learning as that which critically reassesses values, attitudes, and frames of reference. So why do we limit our judgment of students’ critical thinking success to a multiple choice test that relies upon the reading skill of inference? How valid are these results? How can we validate our students’ learning beyond the discrete data of these tests?
As an institution, we have been using the ETS® Proficiency Profile (Educational Testing Service, 2015) testing as a benchmark for general education. We recognize that the vast majority of students who enter our institution will need to take additional placement testing due to low SAT scores. In fact, more than 40% are placed into a college reading course. So, it was not unexpected to have less than 10% of our graduating seniors test at a level of proficient or near proficient in this test. Low stakes testing based on concentrated reading on a computer screen, while required for a recent Title III Grant, was not the best measure of our students’ true capacity in this area. So, how did we counterbalance these testing results?
First, in January 2013, we made faculty aware of the testing content in a faculty development session, as well as student results to date from Fall 2009. Testing content includes three levels in Reading, Writing, and Mathematics skills. This generated discussion of current classroom practice and awareness of the need to challenge students with higher order thinking (Level 3 Reading) through directed questioning and problem solving. The use of case studies and undergraduate
2015 AALHE “Actionable Assessment” Conference Proceedings |81
research is now more the rule rather than exception on campus. But, the current standardized testing results are merely creeping up. National norms in this area are also equally low, so the comparative data is just as dismal. Academic year 2014-2015 testing showed a 16% percent gain in overall mean score for the 2009 cohort in this university, and a 9% and 8% gain for the 2010 and 2011 cohorts respectively. Mean scores ranged from initial results (< 30 credits) of 414.68 – 421.89 and final results (> 90 credits) of 428.61 – 430.5 on a range of 400-500. The testing of senior year students (>90 credits) had less than 50% of students judged proficient or marginally proficient in Reading and Mathematics Level 1, but more than 70% of these students proficient or marginally proficient in Reading Level 1. Less than 5% were proficient or marginally proficient at Level 3 in any of these skill areas. The ETS® Proficiency Profile results continue to mirror the initial testing results of these students’ SAT or ACT scores upon entry, with a slight improvement in Reading Level 1 due to the high number of students placed into an initial College Reading course.
In considering this question of valid assessment of critical thinking skills for a recent MSCHE Self-Study, our faculty expanded the definition of critical thinking and looked for other evidence of this skill. All students are trained in reflective practice, either through theological reflection or metacognitive reflection as a part of coursework. Students were guided through a defined reflective process over several courses and their reflection papers evaluated via rubric as part of our Core Experience assessment process for Learning Outcome 2.2 Engage in Self-Reflection.
Direct measures used to assess competency in this area [Contemplation] included written work products from first year students enrolled in Theology 104 or Honors 105, junior or senior level students enrolled in upper division theology courses and a biology course, and CAPS division students enrolled in LSTHEO 200. In addition to the written work products from theology classes, there was a review of the evaluations of the Capstone Reflections from 28 graduating seniors in the Institute for Student Leadership. Please see LO 2.1 for details. Indirect measures of competency in reflection involved an analysis of questions from the National Survey of Student Engagement 2013, the 2014 Noel-Levitz survey of all students, NU alumni survey questions, and NU Mission survey questions. All surveys reflected most recent data. (NU Core Curriculum Task Force, 2015, p. 2)
Students showed appropriate progress according to the rubric competencies and their status within the four years of undergraduate study (Developing = 1st year, Milestones 2 & 3 = years 2 & 3, Capstone = Senior Year). Through the assessment process used in the area of critical reflection, students showed acceptable gains and demonstrated competencies reflective of critical thinking. In addition, faculty developed appropriate rubrics for use in Core and course assessment. (NU Core Curriculum Task Force, 2015) Another area used for assessment of critical thinking was the quantitative reasoning project assigned in core math courses. From faculty graded results, students seemed to be making satisfactory progress in this area. This project is graded using an adapted rubric from the AAC&U VALUE rubrics (Association of American Colleges and Universities, 2010), and results are shared each semester with the Math faculty. However, the results seemed to be too good! Faculty were
2015 AALHE “Actionable Assessment” Conference Proceedings |82
assessing the student work at an accomplished (Milestone 3) or mastery (Capstone) level, even though their academic status was that of first or second year students. A norming session was held, and the rubric was revised as were the expected levels of achievement to reflect the level of these courses. (See Appendix A.) This project required either some simple research for an exponential function (Math 103 College Algebra) or an experiment demonstrating observed statistics (Math 102 Introductory Statistics) as well as a report outlining the steps taken to solve the given prompt. Students were successful in completing the assignment, as guided by their instructor within a series of in class explanations of the project and its expectations.
Seniors are offered capstone courses or experiences in our university. Part of the capstone process was the opportunity to reflect on the overall college experience. Guided reflections and sharing were part of these seminars, often in a retreat like atmosphere. Students took seriously this opportunity to consider their personal and professional growth over their college career. Again, these reflection exercises were evaluated by rubric and the evidence showed that the students had accomplished the expected criteria. Students could well articulate the transformative learning experiences as defined by Mezirow’s theories (J. Mezirow & Associates, 2000).
Since critical thinking and reflective practice were part of our student leadership formation program, the capstone experience for these students was also assessed. Students were guided through a reflection based on the outcomes of the program and were invited to share their reflections within a dinner program to which were invited local leaders, administration, and faculty. The invited guests were asked to assess the responses of the students held during these dinner conversations. The students demonstrated quite sophisticated skills in self-knowledge, career readiness, and how they had developed their own leadership style and competencies. Often, the faith-based value system emphasized by the university was acknowledged and testimony given to its internalization (NU Institute for Student Leadership Formation, 2015). . This experience of social and academic integration follows the model proposed by Arum and Roksa (2011) as a solution to limited learning on college campuses.
As a final piece of evidence of critical thinking, the results from students’ participation in internships or field experiences was considered. Evaluations by their clinical instructors, supervisors, or mentors added to the data on critical thinking skills as these are demonstrated in the workplace. Students scored well in these evaluations, and overall in their readiness for career placement as determined by summative scores. These workplace experiences require students to think quickly to address challenges and to follow-through with acceptable solutions. The students are also judged in their ability to abide by ethical standards and to work as a member of a team. As young practitioners, they also were encouraged to ask questions of their supervisors. They were judged to do so appropriately, as befits a student in a formative experience. From the Fall 2014 results, the questions related to critical thinking skills had mean scores as listed below. Ratings were based on a Likert scale of 1 (Low) to 5 (High). See Appendix B for full survey.
Breaks down complex tasks/problems into manageable pieces (4.35) Brainstorms/develops options and ideas (4.22) Demonstrates an analytical capacity (4.27)
2015 AALHE “Actionable Assessment” Conference Proceedings |83
Thus, despite low proficiency results in one 40 minute, low stakes testing that included critical thinking, students graduating from this university were able to produce other valid evidence of their ability to think critically, reflectively, and honestly about situations, their own growth, and the needs of others. This is validated at our university through clearly articulated Core Experience Learning Outcomes, faculty-led efforts to define competencies and rubrics to evaluate student learning based on these competencies, and multi-modal assessment practices, in line with the best practices espoused by the American Association of Colleges and Universities (Sullivan, 2015). For survival in our modern world, students need to learn rigorous higher-order thinking; to do so, universities must create a serious intellectual culture within its boundaries (Ripley, 2013). Our sorry results from one test has led us as a university to examine our practices related to critical thinking and to seek alternate experiences to engage our students and evaluate their learning.
References
Arum, R., & Roksa, J. (2011). Academically adrift. Chicago, IL: The University of Chicago Press.
Association of American Colleges and Universities. (2010). Assessing outcomes and improving achievement: Tips and tools for using rubrics. (T. L. Rhodes, Ed.) Washington, DC: Association of American Colleges and Universities .
Brookfield, S. (1995). Becoming a critically reflective teacher. San Francisco, CA: 1995.
Educational Testing Service. (2015, April 29). About the ETS Proficiency Profile. Retrieved from ETS Proficiency Profile: https://www.ets.org/proficiencyprofile/about
J. Mezirow & Associates. (2000). Learning as transformation: Critical perspectives on a theory in progress. San Francisco, CA: Jossey-Bass.
McCarthy, B. (2012). The learning cycle, the 21st century and millennial learners: Who they are and how to teach them. Wauconda, IL: About Learning Incorporated.
NU Core Curriculum Task Force. (2015, April 28). NU Core Experience: Home. Retrieved from NU Core Experience: http://www.neumann.edu/CoreExperience
NU Core Curriculum Task Force. (2015, April 29). NU Core Experience: Newsletter August 2014. Retrieved from NU Core Experience: http://www.neumann.edu/CoreExperience/newsletters/August2014.pdf
NU Institute for Student Leadership Formation. (2015, April 28). NU ISLF: Institute News. Retrieved from NU Institute for Student Leadership Formation: http://www.neumann.edu/life/SLF/news.asp
NU Institute for Student Leadership Formation. (2015, April 28). NU ISLF: Institute News. Retrieved from NU Institute for Student Leadership Formation: http://www.neumann.edu/life/SLF/news.asp

2015 AALHE “Actionable Assessment” Conference Proceedings |84
Ormrod, J. E. (2004). Human learning (4th ed.). Upper Saddle River, NJ: Pearson Education, Inc.
Ripley, A. (2013). The Smartest kids in the world: And how they got that way. New York: Simon & Schuster, Inc.
Sullivan, D. F. (2015). The VALUE breakthrough: Getting the assessment of student learning in college right. Washington, DC: Association of American Colleges and Universities.
2015 AALHE “Actionable Assessment” Conference Proceedings |85
Understanding Student Learning
Meaningful & Useful
Dr. Dave Veazey Director, University Assessment, Accreditation & Research
Pacific Lutheran University Director, Pacific Northwest Learning Consortium
Abstract
Assessment does not change culture. Culture leads assessment
A strategy to successfully implement meaningful and useful assessment of student learning that leads to authentic improvement must incorporate the character of the complex work of educating human beings – both the students and the instructional staff. By its nature, human learning is unpredictable, iterative and heavily influenced by local contexts. While generalizable methods for understanding student learning and the ways one might assess student learning may be arrived at over time, the methods employed and their implementation must be done in a manner that appreciates and integrates unique conditions, people and their personalities. Local contexts that appear similar may have invisible political and social environments that make a strategy successful in one arena but not another. In short, one size fits all assessment and accountability can become an exercise in compliance and veer far from the goal of improving student learning – worse yet, consume valuable resources that might otherwise support faculty in meaningful efforts in the local context. Keywords: Leadership, Culture, Change, Meaningful, Useful, Practical
While undoubtedly slow to change, the process begins by utilizing the strengths of the existing culture and a respect for different perspectives alongside evidence to inform conversation to create improvements in understanding student learning. Pacific Lutheran University is not using assessment to change the culture, but rather utilizing the existing culture to lead assessment of learning – both for the institution and for students. The result is practical, meaningful and sustainable assessment aligned with faculty intuition and interests.
Background The process of accomplishing assessment of student learning in higher education has a body of literature that describes components of identifying learning outcomes tied to mission, aligning those outcomes with the curriculum (developing a curriculum map), faculty evaluation of student work, finding gaps in student performance and adjusting the curriculum or pedagogy in an attempt to address deficiencies (Banta, 2002) (Allen, 2004) (Walvoord, 2004) (Bresciani, 2006) (Driscoll, 2007) (Suski, 2009). While the steps are well established as reasonable and accepted means to

2015 AALHE “Actionable Assessment” Conference Proceedings |86
understand student learning, it is unclear if higher education has successfully utilized such methods to increase student learning (Bok, 2006) (Arum, 2011) (Blaich, 2011). One rationale for this disconnect can perhaps be understood through organizational theory in which individuals and organizations have two kinds of theories of action (Argyris, 1985). An “espoused theory” is what an organization asserts while the “theory in use” is the one demonstrated through action. The theory-in-use governs behavior while the espoused theory may be invisibly ignored as the organization goes about its business saying one thing and doing another. Tagg (Tagg, 2003) describes the structure of an organization as being the stable elements that define the framework and the procedures in which activities and processes occur. In higher education these include the faculty governing processes, extant curriculum, pedagogy and reward structures; the blind acceptance of the quality and value of these existing structures make innovation and change difficult to accomplish. Christensen and Eyring (Christensen, 2011) state “the spirit of honoring tradition” is a strong force in higher education and most institutions simply trim around the edges when budgets are cut while hanging on to historic programs and processes rather than make difficult decisions to alter the status quo. Clark (Clark, 2004) makes a similar point claiming that traditional structures cause higher education to often “opt for the comfort of standing still”. For assessment to occur as the literature claims it should, the stable, established structures, theory-in-use, must be subordinated by the espoused theory of learning and transformational growth as described in mission statements, institutional outcomes and educational values. Such a transformation is what is called for in creating the Learning Paradigm College; it is a tall order (Tagg, 2003). The most recent and comprehensive research on learning in higher education demonstrates that in all institutions there is both a great deal of learning growth in addition to none at all in the areas most valued in higher education such as critical thinking, moral reasoning and literacy. Importantly, variability in the extent or actual absence of student learning is present at all institutions (Blaich, 2011). Based on student learning outcomes from their four-year longitudinal study, the authors describe the practices that lead to quality student learning outcomes. Not surprisingly, the conditions that lead to student learning occur alongside the presence of high impact practices such as quality teaching, prompt feedback, quality faculty-student interactions, challenging work and collaborative learning among others. These findings are consistent with Chickering and Gamson (Chickering, 1987) whose research showed good teaching and learning practice in undergraduate education includes seven principles:
1. Encourages contact between students and faculty 2. Cooperative learning opportunities among students 3. Active learning 4. Prompt feedback 5. Emphasize time on task 6. High expectations 7. Respect for diverse talents and ways of learning

2015 AALHE “Actionable Assessment” Conference Proceedings |87
Pressures to respond to reward structures, both internally dealing with tenure and promotion in addition to external pressures that create faculty allegiance to the discipline above the institution create an environment in which explicit and transparent deliberation of student learning is not a priority. At the same time, public pressure on institutions, public and private alike, have created reporting regulations that require institutions to demonstrate student learning outcomes (Ewell, U.S. accreditation and the future of quality assurance, 2008). Unfortunately, the push for external accountability, including accreditation has led to a flurry of reports and data collection exercises that accomplish the external goal (report submission) but do not necessarily lead to quality engagement by faculty in learning and experimentation in curriculum and pedagogy as a result of that investigation (Kuh, 2009). It is the engagement of faculty in conversation about student learning with the use of student evidence in concert with the professional, considered judgment of faculty that can lead to the creation of change that enhances faculty productivity, student success and, overall, evidence of the success of higher education.
Culture Leading Assessment
More data, additional reporting processes or websites with a plethora of indicators of achievement do not change the college’s theory in use. Rather, faculty talking with each other and learning from each other while making professional judgments of student quality incrementally make changes that, piecemeal, diffuse into the culture and operation of the college. If these incremental steps are aligned with mission, over time, theory-in-use aligns well with the espoused theory and a college can define itself as a learning paradigm college. Understanding student learning (AKA Assessment) must be constructed to encourage incremental awareness and improvement of student learning if it is to become a permanent part of the university culture. Tacking on additional reporting responsibilities will not necessarily enhance student learning nor will it engender a collegial environment in which faculty discussions regarding student performance and teaching quality can be openly discussed (Johnson, 2014). At the same time, without the pressure to demonstrate evidence that students are accomplishing the espoused goals of the institution, the learning paradigm may not have the momentum to be created. It is a tricky balance requiring political acumen and symbolic leadership (Bolman, 2008) (Kezar, 2001). With these premises, challenges and contradictions in mind, Understanding Student Learning should be an incremental approach to improvement; one aligned with faculty passions and student learning needs. Providing reports are not the priority, conversations are; but the conversations must be guided by student evidence and lead to observable demonstrations that students have attained the skills, knowledge, attitudes and habits of mind worthy of the college degree. The process of Understanding Student Learning can be framed in five distinct elements:
1. Faculty interest in a particular area of student learning 2. Collection of information – useful information only 3. Compilation of information into actionable, yet imperfect evidence 4. Meaning Making – a conversation among faculty about the imperfect evidence 5. Experiment – Try something to address what was discovered

2015 AALHE “Actionable Assessment” Conference Proceedings |88
Return to #1 the following year.
Understanding Student Learning
Sdfja;lsdfaigaknvas234051=0495810942501945q9’asdjflakjdgajgasldkjfa;lskdjga;ibna;oiwergnaoirnaidnvaig’andfg’aikn’rgaiw3[05892349085102438tuawierjg[q09450q234853094utjp3409tuq[0934uq934j[0394u6tq3954t34u8to94utp098eg;oiaj409u6qtp3048upw3498utp[0qw394ut394up6w09u45tp;0w98346pt8etpw90834utqa9034utp0q934u[t0qw93u4[tq934ut[p0q934ut[qw0934ut[q0934ut[q0934ut[q039w4u[tq0934ut[q0934ut[q0934ut[q3094ut[q34t[q039846[q934ut[8qw5ytp8w5pgqy34pq9374p9aweur[0a9wu5j;zw94roiutjao394ut;a9ow4tuq49q[0349fj[q0349ru[qu4ef[q0934uqa0934ut[q93u4t[q90u4t[q0934t[09qu4[t90quf9au[409uq[3490[1q3094ut[q0394ut[q0934ut[]q934ut[q934ut[q9w94qp904fjpqw0394utpq0394tuq[0394u[q0394jf[q0394jf[q0934ujf[q0934j[q0934tg[q934gt[q3094ut[qLet’s try….
“A new lesson” “A different pedagogy”
“An additional writing assignment”
Curiosity about student
learning
Experiment with inconclusive results
Meaning Making What does this mean? What should we do?
Imperfect Student Evidence
Data
1
5
4 3
2
2015 AALHE “Actionable Assessment” Conference Proceedings |89
On the whole, faculty possess a sincere interest in student learning and strive to learn and improve practice to meet student learning goals; in many cases this is done in isolation, in hallways, in ad-hoc conversations as faculty wrestle with a vast array of concerns associated with faculty life. Understanding Student Learning is a conversation about student learning in collaborative faculty group settings in which evidence informs the conversation. Importantly, the conversation drives incremental change in curriculum and pedagogy; student learning information merely informs the conversation. Data collection and the processes used to report on the information is not the goal or an outcome but rather a single step. The conversation among faculty, sometimes formally convened but more typically occurring across the campus as part of the systemic culture of faculty life is the real driver of change and improvement. Assessment, as practiced in higher education is often done in reverse. An external demand is placed upon the university, typically through recommendations made via regional accreditation that assessment of student learning must be improved. These recommendations lead to an appointment of an assessment coordinator that may staff an office to guide the effort across the institution. Understanding student learning, an endeavor that must be a faculty conversation can instead become an administrative function, a locale not always likely to lead to valuable integration across the faculty culture. Assessment is seen as an additional burden, yet another task foisted upon the backs of faculty without compensation. Worse yet, funding that might be used to support faculty in understanding student learning is diverted to yet another administrative function, one that provides only sticks and perceived retribution for non-compliance. Faculty might dutifully provide reports that appease external and internal requirements, but the question remains if changes of value have actually transpired that enhance faculty collegiality and communication about student learning. To use an analogy from the automotive industry, a nice paint job covers the exterior while the rust, engine and drivetrain go unchecked. Understanding Student Learning turns this structure upside down by permitting the culture to lead assessment rather than expecting assessment to change culture. The process is not simplistic. Being a human process, it is iterative and requires time for faculty, new and old, to find meaning in student learning information so changes to curriculum and pedagogy can be made in concert with faculty values and institutional mission. The change to a learning paradigm culture may appear slower but it has depth and meaning, creating real change as opposed to compliance reports. In the end, a continuous process of inquiry, exploration and experimentation results in which the quality of the curriculum and teaching is constantly questioned and revised to meet student learning goals as an innate practice embedded in the culture. It is no longer an additional administrative function, it is instead a campus wide, on-going conversation about student learning that informs staff and faculty about what the institution values and how it accomplishes those values.
A Checklist
Below is a list of conditions and steps for implementing Understanding Student Learning that enables culture to lead assessment.

2015 AALHE “Actionable Assessment” Conference Proceedings |90
Understanding Student Learning Conditions
• Be COMMITTED TO IMPROVEMENT – Incremental, Simple, Long-Term, Sustainable • Education goals & process must stem from MISSION & CULTURE • VALUE OPENLY QUESTIONING long standing institutional practices • Embrace the fuzzy world of program level learning – IT IS NOT RESEARCH • Start with faculty PASSION & INTUTION regarding student learning goals
Process
• Pilot, pilot again, AND again
1. Select ONE aspect of student learning that captures the hearts and minds of faculty.
Start with faculty intuition – an excellent source of data 2. Collect some student learning information that informs the question
3. Using a rubric or other means of evaluation, faculty analyze evidence together
4. Develop hypotheses: What have we learned? What was surprising?
5. Be willing to EXPERIMENT before data is “conclusive” Return to #1 above
References Allen, M. J. (2004). Assessing academic programs in higher education. San Fransisco, CA:
Jossey-Bass. Argyris, C. P. (1985). Action science: Concepts, methods, and skills for research and
intervention. San Fransicsco, CA: Jossey-Bass. Arum, R. a. (2011). Academically adrift. Chicago, IL: The University of Chicago Press. Banta, T. W. (2002). Building a scholarship of assessment. San Fransisco, CA: Jossey-Bass. Berliner, D. C. (2002). Educational research: The hardest science of all. Educational Researcher,
8, 18-20.

2015 AALHE “Actionable Assessment” Conference Proceedings |91
Blaich, C. a. (2011). From gathering to using assessment results: Lessons from the Wabash
National Study. Champaign, IL: National Institute for Learning Outcomes Assessment. Bok, D. (2006). Our underachieving colleges. Princeton, NJ: Princeton University Press. Bolman, L. G. (2008). Reframing organizations: Artistry, choice and leadership. San Fransisco,
CA: Jossey-Bass. Bresciani, M. J. (2006). Outcomes-based academic and co-curricular program review. Sterling,
VA: Stylus. Chickering, A. G. (1987). Seven principles for good practice in undergraduate education.
American Association of Higher Education Bulliten, pp. 39, 3-7. Christensen, C. a. (2011). The innovative university. San Fransisco, CA: Jossey-Bass. Clark, B. R. (2004). Sustaining change in universities. New York, NY: McGraw-Hill Education. Driscoll, A. a. (2007). Outcomes based assessment for learner-centered education. Sterling, VA:
Stylus. Ewell, P. T. (2008). U.S. accreditation and the future of quality assurance. Washington, DC:
Council fo Higher Education Accreditation. Kezar, A. L. (2001). Organizing higher educaiton for collaboration: A guide for campus leaders.
San Fransisco, CA: Jossey-Bass. Kuh, G. G. (2009). More than you think, less than we need: Learning outcomes assessment in
American higher education. Urbana, IL: National Institute for Learning Outcomes Assessment.
Suski, L. (2009). Assessing student learning. San Fransisco, CA: Jossey-Bass. Tagg, J. (2003). The learning paradigm college. San Fransisco, CA: Jossey-Bass. Walvoord, B. E. (2004). Assessment clear and simple. San Fransisco, CA: Jossey-Bass.
2015 AALHE “Actionable Assessment” Conference Proceedings |92
Emergent Assessment: Assessing Learning That We Don't Expect
Catherine M. Wehlburg, Ph.D.
Associate Provost for Institutional Effectiveness [email protected]
Texas Christian University
Abstract
Traditionally, assessment has asked faculty to develop a set of expected learning outcomes and then to measure those to determine what students know and don’t know. Faculty often are frustrated by this because they feel limited in what they are looking for in student learning. “Emergent Assessment” adds a dimension to traditional assessment processes by setting up a process where faculty can determine what students learn that is above and beyond the “traditionally set” learning outcomes. This session will explore this new area of emergent assessment, discuss how it can be used, how to help facilitate the process with faculty. Keywords: Emergent Assessment, Formative Assessment, Summative Assessment, Accountability, Faculty Engagement, Transformative Assessment Few would deny that there are complications and issues with assessing learning in higher education. There are concerns with gaining sufficient faculty engagement and with the actual use of assessment data for improvement. In addition, there are always questions about the validity of measures and the problems with gaining appropriate samples. This paper will focus most specifically on the issues of gaining faculty participation and will question the process that is often used in the assessment of student learning. Assessment has certainly been a concept in higher education for a long time. Peter Ewell (2002) stated that “the intellectual roots of assessment as a scholarship extend back well before its emergence as a recognizable movement” (p. 3). These roots are focused on assessment for improvement, in most cases. But more recently, assessment has been linked to accreditation in higher education. And, as accreditation is an essential part of higher education, the accountability side of assessing learning has often taken precedence over the need for assessment data to help demonstrate improvement. Of course, assessment can provide both – data for accountability and information about improvement. Nonetheless, this tension between assessing for improvement and assessing for accountability has been with higher education for decades and will be for a long time. One of the major difficulties in working with assessment in higher education is in the definition of the term. This causes much of the perceived tension between assessing for improvement and assessing for accountability. For example, during the teaching process, faculty often measure student learning. Some of this measurement of student work is summative (exams, completed papers, or final presentations, for example). But much of this work is formative assessment. Faculty will look over their course prior to teaching it again in the next semester to modify what
2015 AALHE “Actionable Assessment” Conference Proceedings |93
seemed to be difficult places for students. But of course, some of the teaching/learning and assessment process occurs within the context of a single classroom moment: the faculty member makes a statement or draws a conclusion and, looking around, sees confused looks on student faces. Knowing that students have missed this point or misunderstood the concept or issue, the faculty member may go back and try to explain it in a different way. Then, perhaps, seeing looks of comprehension on student faces, the faculty member may then move on to another topic. This type of informal assessment has been around as long as teaching has occurred. – perhaps even since the beginning of human communication. The cycle of assessment has been used (if not always documented) at almost every teaching and learning moment (Wehlburg, 2008). Faculty are regularly informally assessing student learning and using that information to enhance the course (sometimes in the moment of teaching, sometimes in ways that modifies the course for the next time that it is taught). The teaching and learning process, when done fully, uses the assessment process to monitor student learning and enhance the teaching process in formative ways. But this is not what many faculty consider to be Assessment. The common university approach to Assessment in higher education has often been a top-down process. Accreditors have required it, so university presidents and provosts will often mandate that it occurs. Often assessment professional are hired to get through the accreditation process (rather than to work on continuously improving learning). This causes assessment to be seen as something that is done only for accreditation – the accountability focus. And, since this is seen as a once-a-decade event, it is not used in a formative way. Many faculty see this process as a waste of valuable teaching or research time.
Much of what frustrates many faculty about the assessment process is the need to identify learning outcomes at the beginning of a course or program. Often faculty will state that they don’t wish to confine learning to a set of four or five learning outcomes. This is especially true of higher level courses where students are, indeed, learning by creating something new. As faculty teach their courses and see students go through their programs, they will often see learning and change in students that is incredible and would not have been expected at the beginning of the course or program. These types of exciting and unique learning outcomes are rarely measured because they are not expected. So, they often get lost. Assessment reports are submitted, but they leave out documenting some of the most amazing learning. Therefore, along with the traditional types of assessment, faculty should be encouraged to look for the emergent learning – the things that they might hope for or aspects of student learning that would surprise them, or the insights that could come from a particularly engaging discussion or response to a current event. How can assessment professionals encourage faculty to document and show this type of learning within the confines of assessment? In other words, how can we assess learning that is not expected? The use of emergent assessment techniques can help to encourage faculty to look for these learning events and document them. Faculty are often very pleased to be asked to share these types of events. These are the moments that often make teaching such a worthwhile endeavor. And this type of a significant learning event are the stories that faculty will often talk about and share with colleagues – but these are almost never included in annual assessment reports. How can assessment

2015 AALHE “Actionable Assessment” Conference Proceedings |94
reports become a more accurate way of describing what is learned? What has worked? What still needs to be enhanced or improved? Emergent Assessment may provide a more flexible way for assessment professionals to encourage faculty to think about assessment and the documentation of learning in different ways. This process may create a flexible and appropriate venue for faculty to address the sometimes surprising and possibly exciting unexpected student learning that often happens during a course or a program of study. In order to incorporate this, assessment professionals may wish to add certain questions to the traditional program or departmental annual assessment report that include asking faculty and the departments:
– What did you learn over this year about students and their learning? – What was surprising from your assessment data? – What is missing? – What else should you have asked? – What do you still want to know or explore? – Does this make a difference?
But asking these questions is not enough. There needs to be an appropriate venue for reporting this information and some type of method to show the value in reporting this type of learning. And, to use only emergent assessment as data for improvement and accountability would not provide sufficient data for good decision making and would most certainly not be seen as enough to satisfy the accreditation requirements for assessment. Therefore, a combined assessment approach is needed. Clearly, both traditional and emergent assessment processes are important. The emergent assessment approach may be seen by faculty as a way that the institution explicitly values their voice about student learning. Faculty may be able to better use the significant learning experiences that their students go through to better design curriculum and pedagogy. Assessment reports need to reflect both emergent and traditional processes – and institutions need to value both of these approaches.
If the assessment process is going to make a difference in the future of education at more substantial levels than it has over the past three decades, the process must become more formative and include trust and dialogue between teachers, legislators, parents, employers, and administrators. Education as a whole, and student learning in particular, is an extremely complex and multifaceted concept. Oversimplifying the measurement process does a disservice to education, its current and future students, and all who have any stake in the outcomes. And ignoring the types of unexpected learning that occur will only frustrate faculty and give a picture of learning that is not complete. Assessment professionals must find a way to incorporate assessment practices that are both realistic and informative. Assessment for accountability will always be a part of the overall assessment process, but it must never be the “tail that wags the dog.” Measuring student learning should always be, first and foremost, a formative process that is designed to enhance student learning at the course, program, and institutional level. We want to include traditional assessment techniques, but there is also a need to find ways to reflect the emergent assessment process. Assessment is not just about measurement – it is about transforming the learning environment, the institution, the faculty, and our students.
2015 AALHE “Actionable Assessment” Conference Proceedings |95
References
Ewell, P. (2002). An emerging scholarship: A brief history of assessment. In T. Banta & Associates (Eds.), Building a Scholarship of Assessment (pp. 3-25). San Francisco, CA: Jossey-Bass.
Wehlburg, C. (2008). Promoting integrated and transformative assessment: A deeper focus on
student learning. San Francisco, CA: Jossey-Bass.
2015 AALHE “Actionable Assessment” Conference Proceedings |96
About AALHE
The Association for the Assessment of Learning in Higher Education (AALHE) is an organization of practitioners interested in using effective assessment practice to document and improve student learning. As such, it aims to serve the needs of those in higher education for whom assessment is a tool to help them understand learning and develop processes for improving it. AALHE began to take shape in late 2009. Formed in part because no other organization had emerged to replace the range of resources and opportunities for interaction that the Assessment Forum of the American Association for Higher Education had offered until it closed in 2005, AALHE's Founding Board of Directors launched this organization with the intention of providing much richer resources and a wider range of interactive opportunities than the Assessment Forum did, largely because much of its content and conversations will be online. The organization has been designed to constitute a wide range of resources for all who are interested in the improvement of learning, from assessment directors who organize and manage programs, to faculty and Student Affairs professionals who use assessment strategies to understand their students’ learning, to graduate students and others who are conducting research on the effectiveness of assessment processes and instruments, to institutional researchers who want to develop effective learning data systems. Through its largely virtual design, AALHE proposes to stimulate discussions both within the groups described above and within the larger community of assessment practitioners. AALHE intends to offer assessment practitioners a variety of ways to learn and share their thoughts about assessing and improving learning. The annual AALHE Conference Proceedings will be published each year following the annual conference. Members whose proposals for a conference session have been accepted will be invited to submit a manuscript for the Conference Proceedings. AALHE is housed at the University of Kentucky, which provides generous technical and staff support, but the organization remains an independently incorporated, member-funded, non-profit entity recognized by the Commonwealth of Kentucky.