The Fiber Year 2008/09 A World Survey on Textile and ... A World Survey on Textile and Nonwovens...
92
The Fiber Year 2008/09 A World Survey on Textile and Nonwovens Industry Issue 9 – May 2009
Transcript of The Fiber Year 2008/09 A World Survey on Textile and ... A World Survey on Textile and Nonwovens...

The Fiber Year 2008/09A World Survey on Textile and Nonwovens Industry
Issue 9 – May 2009

Dear readers,
2008 – what a year! Can you remember a similar economic situation with such a dramatic sales
downturn of the entire textile trade? A historical incidence, which found its absolute climax in
2007 after three formidable years, was on the verge of falling into a bottomless abyss last year.
Certainly, our industry is extremely cyclical, but nobody could anticipate such a vehement
slump. The German Federation “Verband Deutscher Maschinen- und Anlagenbauer” (VDMA)
and the Swiss “SWISSMEM” reported drops in orders and turnovers in the entire sector of
more than 60% in 2008. Some companies, mainly in other countries, were hit even harder. They
recorded order losses of more than 90%.
Due to their innovative product portfolio and their market-leading machine and system
technologies for staple fiber and man-made fiber spinning as well as nonwovens production, the
Business Units of Oerlikon Textile could present themselves above average, but had to accept
a sales decrease of 37.8 % and thus corresponding losses. As the market leader in the fields of
rotor and ring spinning, winding, twisting, and embroidery as well as spinning and texturing
of man-made fibres, and last but not least the globally unique nonwovens full liner with the
technology fields airlaid, carding, and spunbond, we and our units again gave new impulses in
2008 for the market of the future. With our products WINGS (Winder Integrated Godet System)
by Oerlikon Barmag, Autoconer 5 by Oerlikon Schlafhorst and Sytec One by Oerlikon Neumag
alone we revolutionised the former production processes in the corresponding technological
fields.
Together with you, our customers, we want to concentrate in the future even more on your
requirements and requests. Due to their dedication and commitment to the textile business, their
highly productive innovations and their internationally skilled service staff, our Business Units
will provide the decisive advantage about your competitors when the next upturn comes.
We will do our utmost to continue to be your reliable and highly innovative partner with our
five Business Units Oerlikon Barmag, Oerlikon Neumag, Oerlikon Saurer, Oerlikon Schlafhorst
and Oerlikon Textile Components.
Yours sincerely,
Thomas Babacan
CEO Oerlikon Textile and
Chief Operating Officer,
OC Oerlikon Management AG,
Pfäffikon/Switzerland
Thomas Babacan
CEO Oerlikon Textile and
OC Oerlikon Management
ForewordThe information in this report is mainly based on the global network and in-house experience.
Special thanks go to all companies and institutions below mentioned for their precious
contribution.
ABRAFAS
Airbus S. A. S.
All Pakistan Textile Mills Association (Punjab Zone)
Asian Development Bank
Association of the Nonwoven Fabrics Industry
Autoliv Inc.
Bangladesh Garments Manufacturers and Exporters Ass.
Bangladesh Textile Mills Association
Brazilian Textile and Apparel Industry Association
Boeing Co.
Camara Industrial Argentina de la Indumentaria
China Chemical Fibers Association
China Chemical Fiber Economic Information Network
China Cotton Textile Association
China Nonwovens & Industrial Textiles Association
China Textile Information Center
Dralon GmbH
EDANA
Federal Bureau of Statistics (Pakistan)
Fiber Economics Bureau
Food and Agriculture Organization of the United Nations
General Aviation Manufacturers Association
German Association of the Automotive Industry (VDA)
Global Wind Energy Council
Hexcel Corp.
INDA
Indonesian Synthetic Fiber Makers Association
International Cotton Advisory Committee (ICAC)
International Wool Textile Organisation (IWTO)
Japan Chemical Fibers Association
Lenzing AG
Malaysia Trade and Industry Portal
Malaysian Textile Manufacturers Association
Mexican Clothing Industry (CNIV)
Ministry of Economic Affairs, R.O.C.
Ministry of Textiles (India)
National Bureau of Statistics of China
National Council of Textile Organizations (NCTO)
Performance Fibers GmbH
Proexport Colombia
Spinners & Weavers Association of Korea
State Committee of the Republic of Uzbekistan
Taiwan Textile Research Institute
The World Bank Group
Trevira GmbH
Turkey State Institute of Statistics
United Nations Conference on Trade and Development
United States Agency for International Development
United States Department of Agriculture
United States Department of Commerce
U.S. Census Bureau
Vietnam Textile Association (Vitas)
World Bank
© OC Oerlikon Corporation AG, Pfäffikon 2009 The content of this report is protected by
copyright. Oerlikon permits recipients of this report to make copies of Oerlikon’s copyright
material in this report for their own use. Further distribution and/or publication is permitted
provided that the source is acknowledged and no changes to the content are made. However,
Oerlikon reserves the right to withdraw any of these permissions in relation to any particular
user at any time.
The information provided in this report has been investigated and compiled with reasonable
care. However, the information is provided “as is” without warranties of any kind, expressed or
implied, including accuracy, timeliness and completeness.
For further information:
Andreas Engelhardt
Oerlikon Saurer Arbon Ltd.
Textilstrasse 2
CH-9320 Arbon
Tel. +41 - 71 - 447 51 89; Cell. +41 79 571 34 33
[email protected] or [email protected]
03The Fiber Year 2008/09

04 The Fiber Year 2008/09
Table of contents
1. Executive Summary and Outlook 2009/10.........................................................................05
2. Textile Tracking & Traceability .............................................................................................09
3. Raw Material Industry............................................................................................................13
3.1 Cotton .......................................................................................................................................13
3.2 Wool...........................................................................................................................................18
3.3 Crude Oil ..................................................................................................................................20
4. Fiber Consumption in 2008 ..................................................................................................22
5. Manmade Filament Yarn and Staple Fibers .......................................................................24
5.1 Polyester ..................................................................................................................................26
5.2 Polyamide.................................................................................................................................31
5.3 Polypropylene ..........................................................................................................................35
5.4 Acrylic .......................................................................................................................................35
5.5 Cellulosic..................................................................................................................................37
5.6 Carbon Fibers ..........................................................................................................................40
5.7 Aramids.....................................................................................................................................42
5.8 Spandex Yarns .........................................................................................................................42
6. Spun Yarn .................................................................................................................................44
6.1 Americas...................................................................................................................................45
6.2 Asia............................................................................................................................................52
6.3 Greater Europe........................................................................................................................68
6.4 Africa.........................................................................................................................................71
7. Nonwovens and Other Unspun End-Uses ..........................................................................74
8. Textile Chain ............................................................................................................................78
9. Statistical Appendix ...............................................................................................................80
“The Fiber Year 2008/09” is the ninth issue to describe in detail developments in the
comprehensive picture on the textile industry. Statistical information is instrumental in
politics explain much activity in this industry today and have consequences far beyond the
boundaries of the industry.

05The Fiber Year 2008/09
1. Executive Summary and Outlook 2009/10
These both charts may best describe the current textile crisis. Monthly retail sales in clothing
slumped from September 2008 in the United States, where the credit crunch began and then
quickly spread globally. Even discounts at year-end of up to 70% did not lure consumers,
marking the worst holiday-shopping season in 40 years. The global situation became even
worse due to above-average capacity additions of textile machinery in the past and surging
crude oil prices until July as well as soaring cotton prices until August.

06 The Fiber Year 2008/09
The monthly manmade fiber production growth in Japan was in negative territory the entire
year and even gaining continuously momentum from February onwards. Despite an annual loss
of 10% or 120,000 tonnes, inventories steadily grew. At year-end, the manmade fiber inventory
accounted for 125,000 tonnes, up 13% from the end of 2007.
Up and down of the crude oil price has taken place in an unpredictable way. OPEC was cutting
output rate several times but could not avoid the collapse of prices. Given stable political
surroundings, reduced consumption was and will continue to be an obstacle for another roller
coaster ride despite the prediction to achieve Peak Oil in 2010. Looking at break-even price
for most countries, they are currently operating at a loss. So, the price should go up to avoid
massive cutbacks in investments and curtailing of seeking new oil fields. Several investments
for new and expanded refineries in the Middle East have already been postponed.
The downswing in cotton prices has begun in August 2008 as direct response to softening
textile demand and higher returns from other crops. Substantial reduction in area under crops
in all leading countries will result in less supply. Ultimately, a rise in prices is unavoidable.
All the more, when manufacturing activity gains momentum and consumption considerably
exceeds supply.

07The Fiber Year 2008/09
All fiber types were negatively affected by the economic slump. While cotton use has witnessed
its second consecutive decline, the long-term downswing for wool continued. Cellulosics,
experiencing an all-time high in 2007 after six years of strong growth, were down 9.1% last year.
People engaged in the synthetics fiber industry need a distinguished capacity for remembering
as the last decline in world production dates back to the year 1982 – the year when Leonid
Ilyich Brezhnev, the former General Secretary of the Communist Party of the Soviet Union and
thus political leader of the Soviet Union, died.
Consequently, every single sub-category was also down. The entire filament yarn industry has
lost a volume of 680,000 tonnes last year. The strongest decline in volume terms in carpet yarn
spinning has resulted from the United States housing bubble where housing prices peaked in
early 2005 and started to decline in 2006. In December 2008 the Case-Shiller home price index
reported its largest price drop in its history. The staple fiber processing volume dropped by 4.2
million tonnes, of which two thirds were due to lower output from cotton spinning.

08 The Fiber Year 2008/09
Total fiber consumption dropped 6.7% to 67.3 million tonnes, equal to an average per capita
consumption of 10.0 kg. This demand shortfall of about 4.85 million tonnes, unprecedented in
modern textile history, is a direct response to the economic slump.
The International Labour Organisation (ILO) predicts that up to 51 million jobs worldwide
could disappear by the end of this year as a result of the economic slowdown. This worst-case
economic scenario could push up the world’s unemployment to 7.1%, compared with 6.0% in
2008 and 5.7% in 2007. A reduced number of wage and salary earners as well as the considerable
concern about long-term job security, resulting in a slowdown of consumer spending, might
lead to an ongoing decline in textile and clothing demand in 2009. As is known, the textile
industry has always been a forerunner of fluctuation in economic activity. Therefore, it would
not be a big surprise to see a modest recovery in 2010 already.

09The Fiber Year 2008/09
2. Textile Tracking & Traceability
AgResearch is New Zealand’s largest Crown Research Institute with
key role to play in boosting the productivity of its bio-dependent
economy.
“A simple practical system for traceability throughout the textile supply
chain has long been a desire of most of the participants in the chain:
yarn is involved;
is used by the maker-up, not a cheaper, inferior copy;
and that the specified fibre, yarn and fabric has been used throughout
the manufacturing process.
A defining characteristic of the world textile market is the sheer
complexity of the manufacturing and supply chain. Most textile goods
are not only produced in a large number of steps by several distinct
sub-contractors but most brand owners also use several suppliers.
With the globalisation of these supply and manufacturing chains, it is
not unusual for the components that make up your fashion garment to
have travelled several times around the world before reaching the retail
store. Thus the possibilities for covert substitution of the specified
materials for cheaper fibre, yarn, fabric or garments are manifold and,
until now, difficult to detect.
A number of textile tracking methods using specialty fibres have been
proposed. While these methods can identify particular yarns, textiles
or garments, the verification involved is generally specialist in nature
and destructive, requiring a sample to be removed and laboratory
tested.
A new development, Verifi TT fibre, developed by AgResearch Textiles,
New Zealand, in cooperation with Datatrace DNA, Australia, is set
to change the face of textile authentication. Verifi TT fibre is a fine,
synthetic fibre containing a unique, customer-distinct tracer material.
These fibres are blended with any other textile fibre at an early stage
in processing, at a ratio of 1:3000 (around 300 g/tonne). At this level
the fibre is invisible to the eye and has no discernable influence on any
fabric properties.
At any stage in the production sequence, the product (fibre, yarn,
fabric, garment) can be instantly and simply verified by scanning the
product with the Verifi TT hand-held scanner. There are no expensive,
time-consuming and destructive laboratory tests, just a simple scan
which will verify whether or not the product is the genuine article.

10 The Fiber Year 2008/09
The Verifi TT fibre will be available in a range of fibre lengths and
diameters, as well as in continuous filament form.
The authentication system is also ideal for use in textile labels. A label
containing Verifi TT in a garment can be quickly scanned to check its
authenticity, even at point of sale, to confirm to the customer that they
are buying the genuine article. Labels containing Verifi TT can be used
by the brand owner to prevent unauthorised production overruns of
leading brand garments by commission manufacturers, which are often
sold on the ‘grey’ market.
The Verifi TT system was launched at the recent Air New Zealand
Fashion week in Auckland when identical twins wearing seemingly
identical Stitch Ministry garments came onto the catwalk. An
AgResearch scientist ran the scanner quickly over each of the twin’s
dresses. The green light flashed and the message ‘Genuine Stitch
Ministry Garment’ came up on the scanner screen for one dress; there
was no signal for the fake dress.
Extensive laboratory and in-mill testing has shown that the signal from
the Verifi TT fibre is unaffected by any physical or chemical process
such as carding, spinning, dyeing, bleaching, autoclaving, etc.
The Verifi TT system was developed as a result of enquiries from some
large manufacturers. AgResearch is now working with some major
textile firms who want to be first in line to use the verification fibre,
and there is strong interest from companies in Europe, USA, Asia and
Australia for a variety of uses and products.”

11The Fiber Year 2008/09
FAO Trade and Markets
“2009 is the International Year of Natural Fibres, proclaimed by the
United Nations General Assembly in December 2006. The Food and
Agriculture Organization of the United Nations (FAO) is coordinating
the Year, which was officially launched in Rome on January 22.
Natural fibres are derived from animals and from plants. Production in
total is worth around US$40 billion annually to the world’s farmers.
For some countries natural fibres are of major economic importance.
Cotton is a major source of income in some west African countries
where, for example cotton accounts for more than 50% of the value of
Burkina Faso’s exports. Sisal is an important export for Tanzania, and
jute is still important in Bangladesh. In other cases natural fibres are of
less significance at the national level but are of major local importance
within some countries, as in the case of alpaca fibre in the Andes, and
sisal in north-east Brazil. Farmers and processors in these countries
depend on proceeds from the sale and export of these natural fibres for
their income and food security.
On the consumption side, natural fibres have a wide range of uses,
from high priced apparel to industrial applications. They are important
materials in clothing and home textiles. Other natural fibres are used
in traditional ropes and sacks, but increasingly they are finding their
way into a range of newer uses, including pulping for paper and as
reinforcement in plastic composites, particularly in the automotive
industry. In many of these applications natural fibres are subject to
competition from synthetic substitutes.
The International Year of Natural Fibres is aimed at raising the profile
of natural fibres, contributing to the incomes and food security of the
farmers who produce them, as well as contributing to a cleaner global
environment. The objectives also include promoting the efficiency and
sustainability of natural fibre production and fostering an international
partnership among the various natural fibre industries.
Considerable progress has been made in the first few months of 2009.
We have established a website (www.naturalfibres2009.org) with
content in 8 languages and it is expanding daily. We have prepared a
video, we have a logo, a brochure and a poster. We held a symposium
in October 2008, and an official launch ceremony in January 2009.
But perhaps of most importance is the international partnership that
has brought together people from all the natural fibre industries. An
International Steering Committee has been formed, and members of this
committee, and many others as well, have planned events throughout
the year. The Calendar of Events shown on the website currently has
around 50 entries, and we are adding more every week.
There is a lot more to be done. We need to continue to develop the
website, to generate posters, brochures, press information kits,
shopping bags and ‘T’ shirts etc, to provide information about natural
fibres and to generate awareness and support for the international
year. We plan to hold a conference in the Philippines in October, and a
closing event at FAO in December. We hope to have a presence at one
or more international textile fairs and fashion shows. A photographic

12 The Fiber Year 2008/09
or art competition would also increase involvement and raise support
for the International Year.
But these things cost money. We have managed so far with FAO’s own
resources, and with donations from the Common Fund for Commodities,
the New Zealand government, and from cotton, wool and jute industry
organizations. We need support from donor countries or industries if
we are to achieve the goals of the International Year of Natural Fibres
and realise its full potential benefit.”
13The Fiber Year 2008/09
3. Raw Material Industry
3.1 Cotton
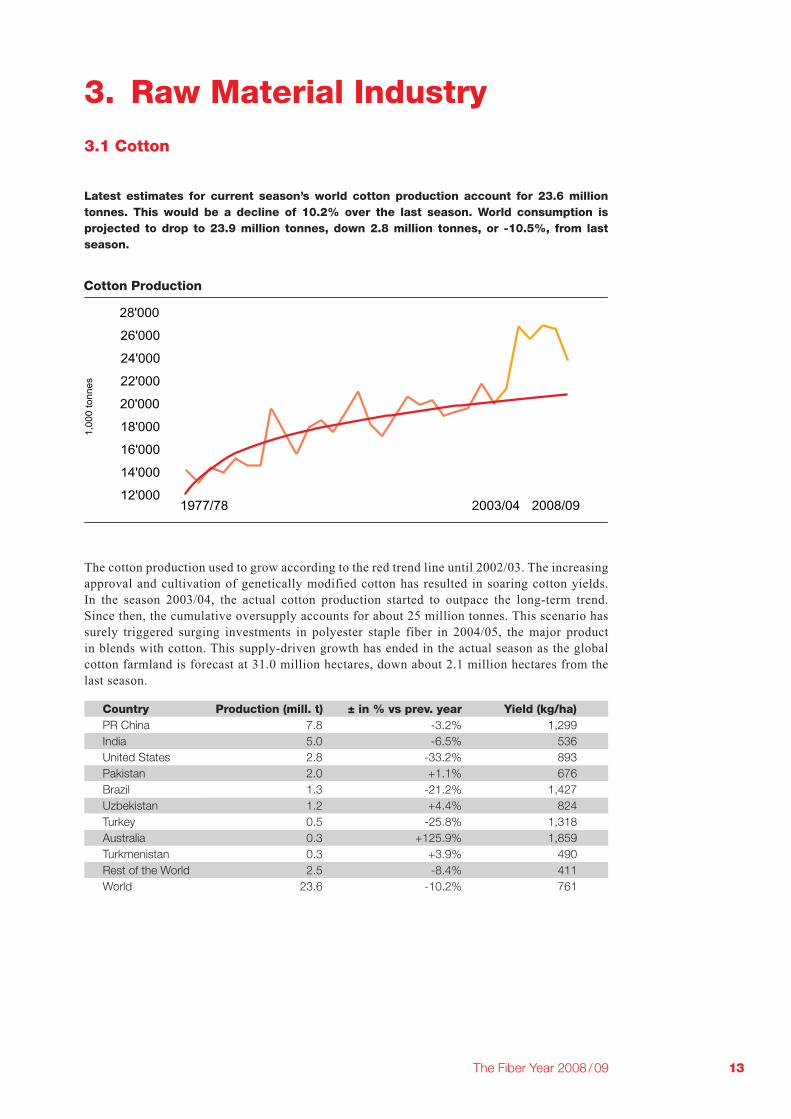
Latest estimates for current season’s world cotton production account for 23.6 million
tonnes. This would be a decline of 10.2% over the last season. World consumption is
season.
The cotton production used to grow according to the red trend line until 2002/03. The increasing
approval and cultivation of genetically modified cotton has resulted in soaring cotton yields.
In the season 2003/04, the actual cotton production started to outpace the long-term trend.
Since then, the cumulative oversupply accounts for about 25 million tonnes. This scenario has
surely triggered surging investments in polyester staple fiber in 2004/05, the major product
in blends with cotton. This supply-driven growth has ended in the actual season as the global
cotton farmland is forecast at 31.0 million hectares, down about 2.1 million hectares from the
last season.
Country Production (mill. t) ± in % vs prev. year Yield (kg/ha)
PR China 7.8 -3.2% 1,299
India 5.0 -6.5% 536
United States 2.8 -33.2% 893
Pakistan 2.0 +1.1% 676
Brazil 1.3 -21.2% 1,427
Uzbekistan 1.2 +4.4% 824
Turkey 0.5 -25.8% 1,318
Australia 0.3 +125.9% 1,859
Turkmenistan 0.3 +3.9% 490
Rest of the World 2.5 -8.4% 411
World 23.6 -10.2% 761

14 The Fiber Year 2008/09
Most of the leading producing countries, representing about 90% of world cotton production,
will experience a fall in current season’s output. The strongest declines are expected to occur
in the Americas – United States (-33%) and Brazil (-21%). Reasons for the lower supply from
Brazil are increasing costs of production and high returns for soy and corn. Soybeans and corn
require less fertilizer than cotton and require no fertilizer the first year after a cotton crop.
However, a severe drought in southern Brazil from mid-November until January will result in
significantly lower production of both crops in the current season.
The Cotlook A Index moved in the range from 52 US cents per pound to 90 US cents. Cotton
prices have continued its long-term trend until August 2008. The sustained weakening demand
for cotton on the international market has led to a deep plunge in the fourth quarter. In November,
cotton prices have reached a temporary bottom somewhere at 52 cents after the dramatic fall
witnessed in the last three months.
World cotton area for 2008/09 is forecast at 31.0 million hectares, down about 2.1 million
hectares from the last season. Three quarters of the global cotton area is located in six countries
– India (9.4 million hectares), PR China (6.0 million hectares), United States (3.1 million
hectares), Pakistan (2.9 million hectares), Uzbekistan (1.4 million hectares) and Brazil (0.9
million hectares). The long-term trend in the U.S. cotton production has dramatically reversed
after bumper crop in 2005-06. Diminishing local demand, lower subsidies and more biofuels
result in further declining cotton output. The U.S. cotton area in the actual season is the lowest
in 25 years.

15The Fiber Year 2008/09
It has been quite normal in the past to experience changes in the world cotton growing area.
However, the future looks rather gloomy as all leading growers have reduced cotton growing
farmland. Cotton would not be grown other than for use by the textile and clothing industry.
Thus, the sharp decline in cotton cultivation area is a direct response to softening textile
demand and higher returns from other crops. However, there is no visionary power necessary
to predict that mankind in future continues to prefer wearing clothes. That means, the more
drastic reductions are being executed at the moment, the more sustainable and escalating will
be the recovery.
International trade has become increasingly important due to geographic shifts in mill use of
cotton as a result of the textile trade liberalization. Although the globalization is expected to
widen the gap between producing areas, having favorable environmental conditions and access
to technology, and cotton consuming regions, having low labor costs, the current cotton trade
volume will suffer from a substantial setback. The long-term development of cotton exports is
shown below.
16 The Fiber Year 2008/09
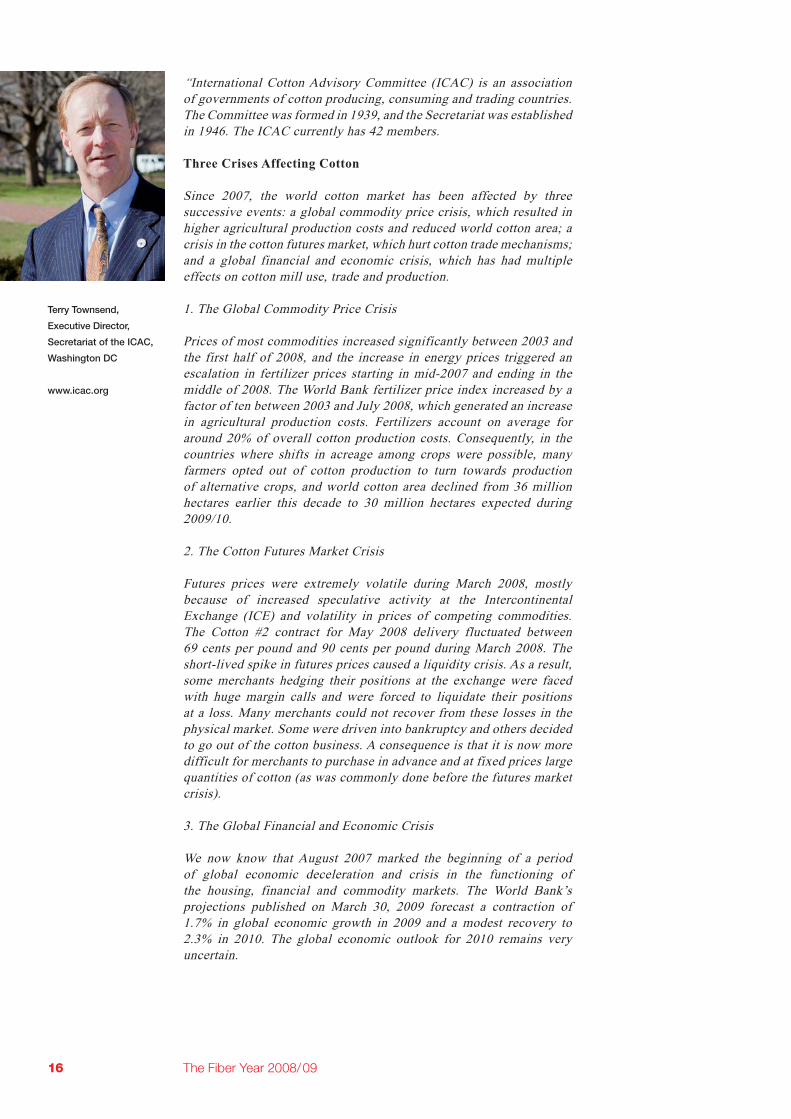
“International Cotton Advisory Committee (ICAC) is an association
of governments of cotton producing, consuming and trading countries.
The Committee was formed in 1939, and the Secretariat was established
in 1946. The ICAC currently has 42 members.
Three Crises Affecting Cotton
Since 2007, the world cotton market has been affected by three
successive events: a global commodity price crisis, which resulted in
higher agricultural production costs and reduced world cotton area; a
crisis in the cotton futures market, which hurt cotton trade mechanisms;
and a global financial and economic crisis, which has had multiple
effects on cotton mill use, trade and production.
1. The Global Commodity Price Crisis
Prices of most commodities increased significantly between 2003 and
the first half of 2008, and the increase in energy prices triggered an
escalation in fertilizer prices starting in mid-2007 and ending in the
middle of 2008. The World Bank fertilizer price index increased by a
factor of ten between 2003 and July 2008, which generated an increase
in agricultural production costs. Fertilizers account on average for
around 20% of overall cotton production costs. Consequently, in the
countries where shifts in acreage among crops were possible, many
farmers opted out of cotton production to turn towards production
of alternative crops, and world cotton area declined from 36 million
hectares earlier this decade to 30 million hectares expected during
2009/10.
2. The Cotton Futures Market Crisis
Futures prices were extremely volatile during March 2008, mostly
because of increased speculative activity at the Intercontinental
Exchange (ICE) and volatility in prices of competing commodities.
The Cotton #2 contract for May 2008 delivery fluctuated between
69 cents per pound and 90 cents per pound during March 2008. The
short-lived spike in futures prices caused a liquidity crisis. As a result,
some merchants hedging their positions at the exchange were faced
with huge margin calls and were forced to liquidate their positions
at a loss. Many merchants could not recover from these losses in the
physical market. Some were driven into bankruptcy and others decided
to go out of the cotton business. A consequence is that it is now more
difficult for merchants to purchase in advance and at fixed prices large
quantities of cotton (as was commonly done before the futures market
crisis).
3. The Global Financial and Economic Crisis
We now know that August 2007 marked the beginning of a period
of global economic deceleration and crisis in the functioning of
the housing, financial and commodity markets. The World Bank’s
projections published on March 30, 2009 forecast a contraction of
1.7% in global economic growth in 2009 and a modest recovery to
2.3% in 2010. The global economic outlook for 2010 remains very
uncertain.
Washington DC

17The Fiber Year 2008/09
While the two crises mentioned earlier primarily affected cotton
production and trade, the global economic crisis is influencing
mainly textile purchases by end-use consumers and therefore cotton
consumption. In addition, tightening credit conditions for textile mills
are slowing their purchases of raw materials, including cotton. In some
countries, for example in Europe and in the United States, the global
economic crisis is accelerating a decline in cotton mill use that started
many years ago, due to other factors. In other countries, such as China
and India, the two largest industrial users of cotton, cotton mill use is
contracting in 2008/09 for the first time in many years. World cotton
mill use is expected to fall by 13% in 2008/09 to 22.9 million tons.
This would be the strongest decline recorded since World War Two.
The global economic crisis, through its impact on world cotton mill
use, is also affecting cotton trade, stocks and production. The lower
demand for cotton is causing a drop in imports, and exporters are being
forced to carry larger stocks than desired. Finally, the tightening of
credit conditions worldwide will also affect world cotton production
in 2009/10, as it is making it more difficult for cotton producers to
finance their inputs.
Conditions in Place for Longer Term Growth
With a rebound in world economic growth expected to begin in 2010 and
improve in 2011, demand for cotton will strengthen again. Technology
changes in cotton production are contributing to both higher yields are
reduced environmental impacts, creating the conditions for long term
growth in the cotton sector. World consumption of cotton reached a
record of more than 26 million tons in 2007, and a return to that level
is likely within a few years after the recession has run its course.”
18 The Fiber Year 2008/09
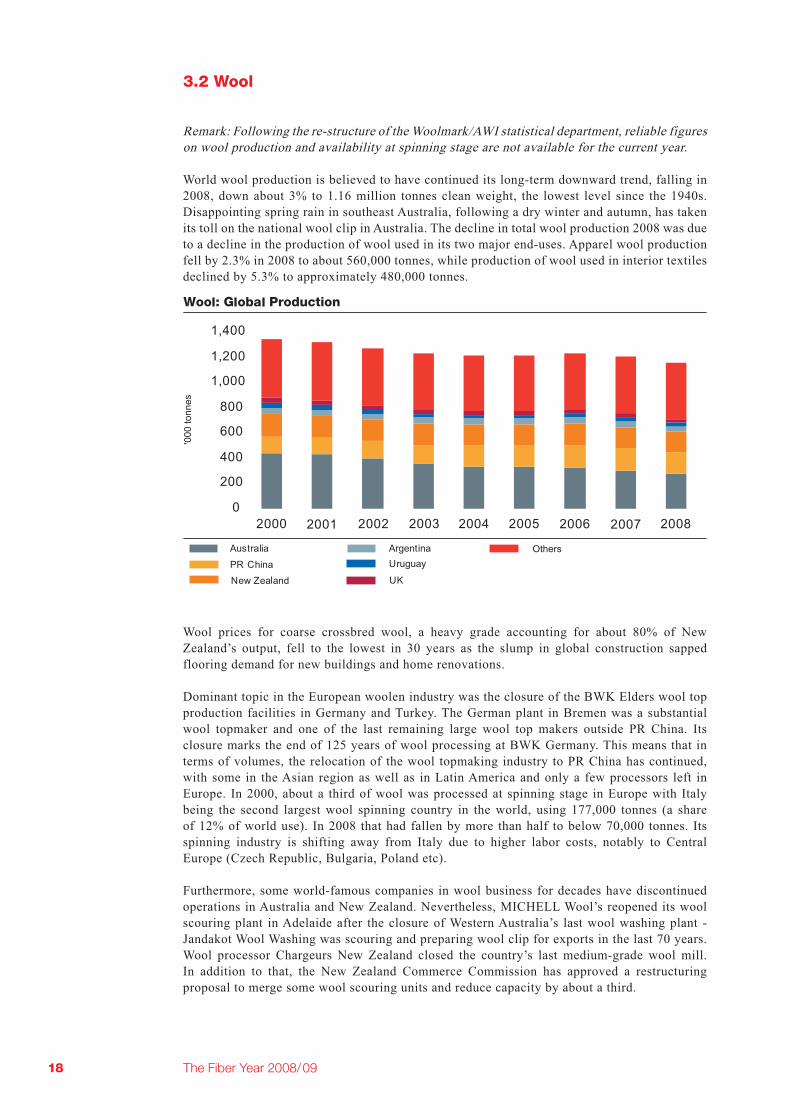
3.2 Wool
Remark: Following the re-structure of the Woolmark/AWI statistical department, reliable figures
on wool production and availability at spinning stage are not available for the current year.
World wool production is believed to have continued its long-term downward trend, falling in
2008, down about 3% to 1.16 million tonnes clean weight, the lowest level since the 1940s.
Disappointing spring rain in southeast Australia, following a dry winter and autumn, has taken
its toll on the national wool clip in Australia. The decline in total wool production 2008 was due
to a decline in the production of wool used in its two major end-uses. Apparel wool production
fell by 2.3% in 2008 to about 560,000 tonnes, while production of wool used in interior textiles
declined by 5.3% to approximately 480,000 tonnes.
Wool prices for coarse crossbred wool, a heavy grade accounting for about 80% of New
Zealand’s output, fell to the lowest in 30 years as the slump in global construction sapped
flooring demand for new buildings and home renovations.
Dominant topic in the European woolen industry was the closure of the BWK Elders wool top
production facilities in Germany and Turkey. The German plant in Bremen was a substantial
wool topmaker and one of the last remaining large wool top makers outside PR China. Its
closure marks the end of 125 years of wool processing at BWK Germany. This means that in
terms of volumes, the relocation of the wool topmaking industry to PR China has continued,
with some in the Asian region as well as in Latin America and only a few processors left in
Europe. In 2000, about a third of wool was processed at spinning stage in Europe with Italy
being the second largest wool spinning country in the world, using 177,000 tonnes (a share
of 12% of world use). In 2008 that had fallen by more than half to below 70,000 tonnes. Its
spinning industry is shifting away from Italy due to higher labor costs, notably to Central
Europe (Czech Republic, Bulgaria, Poland etc).
Furthermore, some world-famous companies in wool business for decades have discontinued
operations in Australia and New Zealand. Nevertheless, MICHELL Wool’s reopened its wool
scouring plant in Adelaide after the closure of Western Australia’s last wool washing plant -
Jandakot Wool Washing was scouring and preparing wool clip for exports in the last 70 years.
Wool processor Chargeurs New Zealand closed the country’s last medium-grade wool mill.
In addition to that, the New Zealand Commerce Commission has approved a restructuring
proposal to merge some wool scouring units and reduce capacity by about a third.
19The Fiber Year 2008/09
A new trend appears to gain increasingly importance as the demand for unmulesed wool is
spreading from retailers to processors and manufacturers. Mulesing is the surgical removal
of skin from the backsides of sheep, to prevent flystrike, and is common practice for many
wool growers. While European retailers insist on unmulesed wool for their garments, Chinese
buyers of wool are demanding the same. An United States retailer is considering to stop using
Australian wool because of concerns about the practice of mulesing.
“International Wool Textile Organisation (IWTO) is the international
body representing the interests of the world’s wool-textile trade and
industry. IWTO membership covers woolgrowers, traders, primary
processors, spinners, weavers, garment makers and retailers of wool and
allied fibres in its member-countries, as well as all kind of organizations
related to wool products and the wool business in general.
Wool is a natural fibre for the world we live in today. It is a fibre with a
true ‘green’ lineage that is both sustainable and biodegradable – which
are now highly valuable assets to the textile industry. This environmental
advantage is increasingly a sought after requirement of fibre but wool
has many other inherent benefits that have historically earned it a
quality reputation from global manufacturers and consumers.
Performance is critical in textiles and wool’s multi-capable reputation
in the finished product is built on a legacy that goes back over 10,000
years. Transcending generations of change shows the vast potential of
wool to meet, adapt and fulfil complex product scenarios. Wool offers
practical attributes that far exceed man-made fibres and as it is grown,
not made, its physical cell structure is complex allowing wool the
natural ability to breathe. Uniquely it absorbs and releases humidity and
provides a climate that is capable of adjusting to individual situations
which ensures you are warm but never hot.
In addition it is the safe fibre - a high water and nitrogen content make
it naturally flame retardant and it meets many international regulations
without the need for chemical treatments. It absorbs unhealthy carbons
in the atmosphere providing a better environment.
Wool is a globally traded commodity and its market diversity is
vast and ever expanding. It is found in many sectors; apparel and
fashion, activewear, flooring and interiors, aviation, architecture,
manufacturing, medical use and protective apparel. These all use wool
and with this dynamic versatility, it has proved itself to be the original
‘Smart’ fibre.
Research and development with wool continually pushes this potential
further, opening doors to a future that will safeguard an industry,
which is a major worldwide employer and bringing multiple benefits
to people, products and the planet.
Despite all these positive attributes, consumers, industry and
governments continue to be oblivious of the Health and Safety benefits
wool can bring. As a result of subsequent low wool prices, less and less
farmers are likely to grow wool in the future. With this in mind, the
wool industry needs support to redress this threat to the existence of
the wool industry.”
Belgium

20 The Fiber Year 2008/09
3.3 Crude Oil
Crude oil prices were on a roller coaster ride, starting 2008 at about US$90, afterwards surging
to US$147 in July and dropping to below US$40 until the end of the year. Nobody can afford
paying US$147 a barrel and, on the other hand, just a few can afford selling oil at US$40.
Looking at the break-even price for most countries, they are currently operating at a loss.
Oil prices at US$40 would result in a massive cutback in investments, cancelation of new
exploration projects and massive national budget deficits.
Why do not loss-making countries stop exploring and exporting oil now that it is around
US$40? Apart from the negative effect on the labor market, many countries are too reliant on oil
revenues. There is a number of countries, e.g. Algeria, Kuwait, Libya, Nigeria, Saudi Arabia,
UAE and Venezuela, with the majority of export revenues stemming from oil. They depend on
selling oil at any price to fund government programs and prevent political instability.
Which influence had the oil price on fiber intermediates? The impact of soaring oil prices has
often been overrated. So, polyester fiber intermediates did not follow this surge in prices, putting
increasing pressure on the converters. As a consequence, we have witnessed several shutdowns
in the fiber intermediates industry. The increase in MEG price in the fourth quarter of 2007 is
a statistical blip rather than a genuine indication of surging oil prices. Lower production due to
an explosion at a SABIC unit in August 2007 was the reason.
Paraxylene (PX):
While expansions came on-stream as scheduled, lifting capacity to 31 million tonnes, declining
demand has led to worsening utilization rates at about 85%, several shutdowns and capacity
adjustments. Permanent closures were seen in North America and more may be seen in the
coming years. Investments for new units and de-bottlenecking occurred in PR China, Russia,
South Korea and Thailand.
After the exceptional previous year with almost 5 million tonnes growth in capacity, investments
have slowed in 2008. New nameplate capacity of 1.3 million tonnes was commissioned,
achieving a size of 45 million tonnes. BP Chembel N.V. in Belgium and FCFC in PR China and
Taiwan were responsible for this growth. The delay in new projects, in particular in PR China,
will help to increase utilization rates from 85% in 2008.

21The Fiber Year 2008/09
Mono Ethylene Glycol (MEG):
The industry has witnessed an increase of nameplate capacity of about 1.7 million tonnes in
2008 despite two major delays in plant start-ups in the Middle East. Expansions were completed
in the Middle East and PR China, South Korea and Thailand. Global production cuts together
with large-scale projects scheduled to come on-stream in the Middle East in 2009, have caused
a drop in prices at year-end 2008 to a level we have not seen in the last six years.
The market development appears to be difficult to predict due to the new OMEGA process from
Shell. The first full-scale plant using this technology has just come on-stream in South Korea
in May 2008. A second unit in Saudi Arabia is due to start-up this year. The OMEGA process
is said to have 10% lower capital costs and nearly no by-products. Lower energy and water
consumption are said to be on top. The industry may feel the margin squeeze from this new
technology.

22 The Fiber Year 2008/09
4. Fiber Consumption in 2008
long-standing economic activity in full swing may be result of PR China’s accession to
innumerable manufacturers in the western hemisphere out of business.
All fiber types suffered from slowing demand. Small-scale fiber types like aramid and carbon
fibers weathered the downturn not bad until the fourth quarter 2008. Although firm demand fell
in aerospace, automotive, military and wind power, they managed to stay on positive territory
in terms of the growth rate. On the other hand, established fibers like polyester, polyamide,
polypropylene and acrylic were down in volumes. The usage of cotton, wool and silk also
decreased by 10.1% to 25.2 million tonnes, manmade fibers fell by 4.5% to 42.2 million tonnes.
The third section with kapok, ramie, flax, hemp, jute, sisal and coir is anticipated to have
stagnated at 5.9 million tonnes. This segment is only mentioned for the sake of completeness,
it will not be included in any further comments.

23The Fiber Year 2008/09
Manmade fibers slightly improved their relative market position at 63%, while cotton, wool and
silk hold a market share to 37% of the world textile market. A world population of 6.75 billion
corresponds to an average per capita consumption of 10.0 kg.
On a world basis, fiber demand of cotton, wool, silk and manmade fiber has decreased by
6.7% to 67.3 million tonnes, the steepest decline in history. The chart above shows the long-
term inter-fiber competition. Since the beginning of the 1990’s, manmade fibers have been the
most important fiber type in terms of volume. The average annual growth rate since 1980 for
manmade fibers accounts for 3.9%, for natural fibers it amounts to 1.9%.
Filament yarns declined by 2.8% to 23.9 million tonnes, mainly driven by losses in industrial
and carpet yarn. Staple fibers, the input material for spun yarn and nonwovens, were down 8.8%
to 43.3 million tonnes. This segment suffered decisively from slowing demand for cotton and
double-digit declines of viscose staple, nylon, acrylic and polypropylene fibers.
24 The Fiber Year 2008/09
5. Manmade Filament Yarn and Staple Fibers
tonnes.
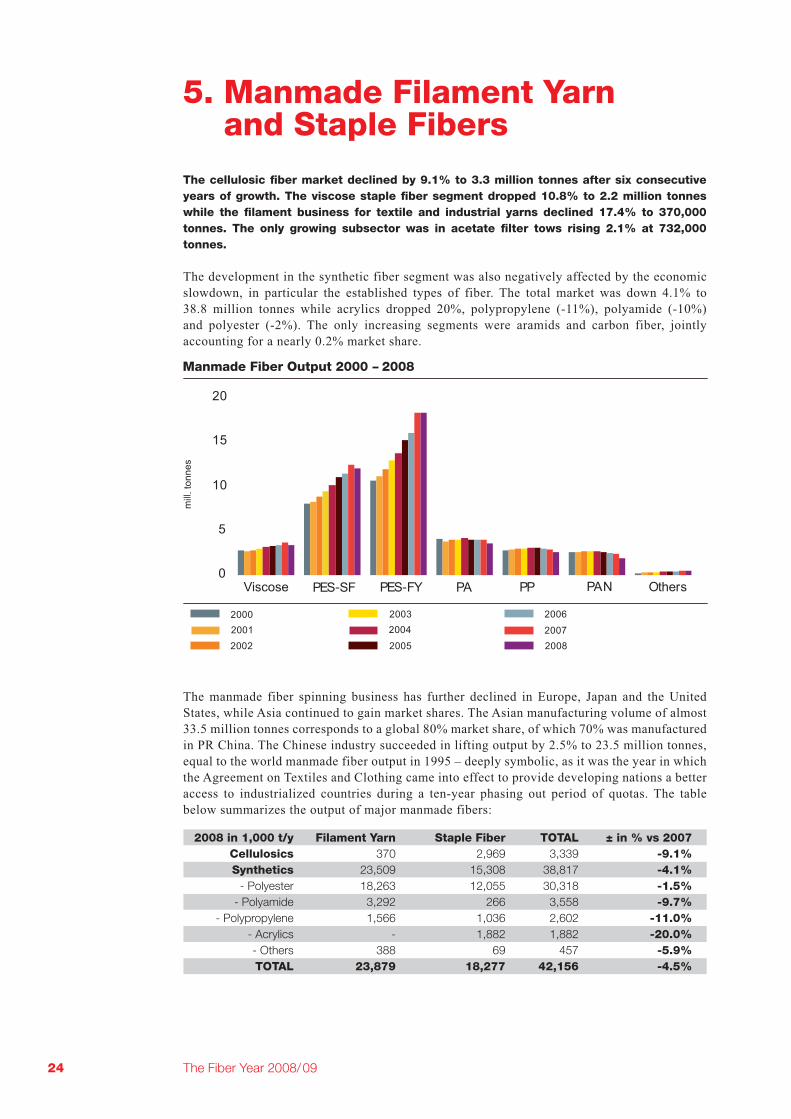
The development in the synthetic fiber segment was also negatively affected by the economic
slowdown, in particular the established types of fiber. The total market was down 4.1% to
38.8 million tonnes while acrylics dropped 20%, polypropylene (-11%), polyamide (-10%)
and polyester (-2%). The only increasing segments were aramids and carbon fiber, jointly
accounting for a nearly 0.2% market share.
The manmade fiber spinning business has further declined in Europe, Japan and the United
States, while Asia continued to gain market shares. The Asian manufacturing volume of almost
33.5 million tonnes corresponds to a global 80% market share, of which 70% was manufactured
in PR China. The Chinese industry succeeded in lifting output by 2.5% to 23.5 million tonnes,
equal to the world manmade fiber output in 1995 – deeply symbolic, as it was the year in which
the Agreement on Textiles and Clothing came into effect to provide developing nations a better
access to industrialized countries during a ten-year phasing out period of quotas. The table
below summarizes the output of major manmade fibers:
Filament Yarn Staple Fiber TOTAL ± in % vs 2007
Cellulosics 370 2,969 3,339 -9.1%
Synthetics 23,509 15,308 38,817 -4.1%
- Polyester 18,263 12,055 30,318 -1.5%
- Polyamide 3,292 266 3,558 -9.7%
- Polypropylene 1,566 1,036 2,602 -11.0%
- Acrylics - 1,882 1,882 -20.0%
- Others 388 69 457 -5.9%
TOTAL -4.5%

25The Fiber Year 2008/09
Headquartered in Greensboro, NC, Unifi Inc. is a leading producer and
processor of multi-filament polyester and nylon textured yarns.
“With so many uncertainties around the global economy and the total
impact to the global textile industry still being defined, Unifi will
stay focused and committed to improving our business fundamentals,
including the growth of our value-added products and enhancing our
offering of sustainable textile solutions. Additionally, with initiatives
in place to grow our sales in the United States, China and Brazil, Unifi
is able to provide our product solutions and excellent customer service
around the world - supporting our customers where ever they choose
to do business.”

26 The Fiber Year 2008/09
5.1 Polyester
The output of polyester fibers was down 1.5% at 30.3 million tonnes and all sectors were
negatively affected. Filament yarns weathered the turbulences surprisingly well by declining
just 0.4% to 18.3 million tonnes while staple fibers, in line with falling cotton demand, were
down 3.2% to 12.1 million tonnes. The fundamental change of the polyester business has
continued in favor of PR China.
The only growth region was Asia, increasing its contribution by 0.4% to 27.5 million tonnes while
output in Greater Europe dropped 16.9% to almost 1.2 million tonnes and the manufacturing
volume in the Americas declined 16.5% to below 1.4 million tonnes.
The Chinese share in the polyester industry accounted for 66%, a staggering growth rate from a
27% ratio in 2000 and a 12% market share in 1990. Chinese polyester industry has been showing
a significant increase in excess supply with production more strongly rising than consumption.
Exports surged in both filament yarn and staple fiber while imports dramatically fell. The
polyester filament and fiber trade surplus accounted for US$1.4 billion last year compared
with US$140 million two years ago. Higher exports were partly helpful to compensate slowing
domestic demand and to sligthly lift up operating rates to avoid a drop below 60% utilization.

27The Fiber Year 2008/09
The table below summarizes last year’s performance of the leading five polyester industries:
The filament market is mainly producing yarns for textile and industrial applications. Although
demand for polyester and PTT carpet yarn has continued growing in the United States, the
volume still is quite small. Polyester textile yarns roughly stagnated at 17.1 million tonnes
(-0.2%) and industrial filaments declined by 2.6% to almost 1.2 million tonnes. Last year was
a classic POY-year with only about a quarter of investments for FDY. As more than 1,000
texturing machines were sold in 2007, sales nosedived by half in 2008.
A modest growth in the polyester textile yarn production just occurred in Asia, lifting output by
1.2% to 16.3 million tonnes. This corresponds to a market share of 95%. The textile powerhouse,
PR China, like Malaysia and Vietnam were the only Asian nations with increasing production
volumes. The contribution from Greater Europe and the Americas declined double-digit. Turkey
suffered from the steepest decline as the output has plunged 38% with the effect that Sönmez
Filament has halted production permanently. Sönmez was in the business since 1972 and had
been operating at loss since 2003. Measures to cut capacity and increase productivity turned out
to be not successful to rebound.
The industrial yarn business has not only suffered from the downturn in the automotive industry
but also from changing trade flows.
Although the global trade volume declined by 4.5% to 535,300 tonnes last year, PR China
was able to boost its exports by 42% to 166,900 tonnes despite an increase in average prices
of 3.6%, capturing 31% of world trade flows. Extraordinary growth in shipments has been
observed to the following countries:
PES-FY ± in % PES-SF ± in % TOTAL ± in %
PR China 12,829 +5.0% 7,216 +2.7% 20,046 +4.1%
India 1,335 -4.2% 748 -13.8% 2,083 -7.9%
Taiwan 1,019 -17.2% 503 -13.6% 1,522 -16.0%
Korea 680 -4.1% 477 -14.2% 1,157 -8.6%
USA 302 -19.9% 646 -17.2% 947 -18.1%
Others 2,098 -12.6% 2,465 -6.6% 4,563 -9.4%

28 The Fiber Year 2008/09
Tires are the biggest consumer of polyester industrial yarn. As tire producers reported disastrous
financial figures, they will increase cost-cutting measures, shut down units and cut expenditures.
Continental will lower commercial vehicle tire production throughout Europe by a total of 27%.
Cooper Tire & Rubber Co. likely will close one of its four U.S. tire plants. Michelin reduced
passenger and light truck tire production for the last two months last year at its three U.S.
plants and cut production at its BFGoodrich tire manufacturing plant in Alabama. Additionally,
Kumho Tire Co. Ltd. has postponed completion of its first U.S. plant in Georgia. Toyo Tire
USA Corp. slowed the pace of work on its US$270 million expansion in Georgia. Michelin has
canceled plans to build a second tire plant in Mexico. This may explain the 11% reduction of
polyester industrial yarn output in the NAFTA region.
On the other hand, shifting of tire capacity has continued. Kesoram Industries Ltd. will expand
its tire unit in India. Kumho Tire Co. Ltd. has broken ground on its US$165 million tire plant
in South Korea and has further inaugurated production at its US$200 million car tire plant in
Vietnam. Pirelli intends to increase capacity for radial truck tires at its Egyptian plant by 50%
with an investment of US$65 million. Yokohama Rubber Co. Ltd. has inaugurated production
at its newest tire plant in Vietnam primarily for the local market. Apollo Tyres Ltd. has broken
ground in India for its US$24 million factory expansion for off-the-road tires, with production
expected to start in the second quarter of 2009.
In 2008, Mexico weathered the global collapse in vehicle sales better than its North American
neighbors. The country produced 2.1 million vehicles (+4%) versus a decline of 20% in the
United States. Mexican exports rose 2.5% to 1.7 million units thanks to stronger shipments
to Canada (+26.9%), Latin America (+19.6%) and Europe (+9.8%). A wave of investments
from Chrysler, Ford, GM has helped to exceed 2 million cars for the first time in 2007. The
vehicle output is forecast to increase to 3 million units by 2015. While U.S. companies may be
restricted for accepting Relief Program funds, Asian manufacturers are about to turn to Mexico.
China FAW Group plans to build a factory that will start-up in 2010. Other Asian companies,
including Hyundai and Tata Motors, are looking to invest for the first time. Finally, Toyota has
just lifted its truck capacity. Despite a global 4.1% reduction in vehicle output to 69.1 million
units, there still are positive examples in today’s economic turmoil. However, to tell the whole
story, Mexico’s auto production could fall as much as 25% this year after witnessing the worst
two-month period in January-February 2009 since 1995, according to the Mexican Automotive
Industry Association. Opposed signals from Brazil that has even outperformed the Mexican
results by lifting last year’s vehicle output by 8.1% to 3.2 million units. Here, the automobile
production rose in January for the first time since July 2008, surging 92.7% in January from the
previous month and production in February further rose by 8.4% from January as well as 36.2%
in March over February.
Relief for the entire market for technical textiles should come following the recent World Bank
announcement to support an extra US$100 billion over the next three years for infrastructure
expansion projects. For instance, Latin American investments in roads appear to be a promising
consumer of technical textiles. In Argentina are 450 road projects currently underway as part
2007 2008 ± in %
USA 24.1 39.5 +63.7%
Korea 12.8 26.9 +109.5%
Germany 14.6 18.7 +28.0%
Netherlands 7.8 11.3 +45.9%
South Africa 1.0 7.0 +567.5%
Malaysia 1.8 3.1 +72.6%
Italy 4.0 5.0 +23.4%
Others 51.1 55.4 +8.4%

29The Fiber Year 2008/09
of the 2008 US$2 billion budget, comprising 30,000 km of national roads and 20,000 km of
toll roads. Brazil is extending for almost 1,600 km a highway that is a major transportation
route between Argentina, Brazil, Paraguay and Uruguay. Colombia will spend US$58 million
constructing a highway from Tunja city to Puerto Boyacá. Of the 280 km road, only 56 km are
currently paved. Rural roads in Colombia will also receive a boost as the national road authority
- Invías - expects to invest US$68 million to improve road conditions. This rural investment
program aims to improve regional connectivity and increase local competitiveness. Peru is
considering to invest US$770 million in road, airport and port infrastructure, Another US$202
million will be spent on five highway projects. Just an example out of many others that future
demand for technical textiles will be on the rise again.
The staple business witnessed the strongest decline, accounting for 3.2% to 12.1 million tonnes.
All regions had a negative growth, Asia mastered the adverse situation the best. Total production
in Asia just declined 1.7% at 10.4 million tonnes. PR China, Malaysia and Vietnam managed
to grow. Vietnam’s first producer of polyester staple fiber from recycled bottles, Hop Thanh
Co. Ltd., has commissioned its 20,000-tonne plant lifting combined annual capacity of its two
plants to 50,000 tonnes. Double-digit decreases happened in the remaining world. The most
dramatic single-market drop in manufacturing volume was in the United States after already
losing 270,000 tonnes production volume in the last three years. As a consequence, Wellman
Inc., second largest domestic polyester staple fiber manufacturer, filed voluntary petitions for
relief under Chapter 11 in February 2008. According to the amended plan of reorganization, the
company will exit the polyester staple fiber and engineering resins businesses, consolidate the
polyester resin production at its Pearl River facility and shut its Darlington plant.

30 The Fiber Year 2008/09
“In July 2008, the first production plant started-up for the manufacture
of polytrimethylene terephthalate fully drawn yarn (PTT-FDY) at
Jiangsu Zhonglu Technology Co., Ltd., an affiliate of Shenghong
Group. With 32 spinning positions, this PTT plant is currently the
largest in China. Located in the Chinese province of Jiangsu, the plant
achieved the desired yarn quality upon commencement of operations.
As one of the largest polyester manufacturers in China, Shenghong Group
is increasingly focused on sophisticated materials and applications.
“The pressure on the margin for commodity yarns is extremely high.
We are increasingly exposed to competition from other Asian countries
who can produce these goods at lower cost. Thus in the future we will
focus on the high-priced segment and niche markets. In this respect,
PTT is an outstanding addition to our portfolio,” said Miao Han Gen,
CEO of Shenghong Group. PTT is a polyester variant which is a very
complex material in terms of processing, so that complete control of
the production process by the yarn manufacturer is an absolute must.
Due to their special properties, PTT yarns are not only substitutes
for polyester and polyamide in textile applications, but open up new
possibilities for use as well. PTT is extraordinarily soft and highly
elastic, yet retains its shape very well. High light-fastness and wash
resistance make this material ideal for use in areas where durability is
required. Furthermore, PTT repels dirt and builds up hardly any static
charge. Accordingly, PTT is used primarily for sports clothing - in
particular for swimsuits in this case - and for home textiles.
The unique properties of PTT yarn as well as the sophisticated
production process ensure attractive margins for yarn manufacturers.”

31The Fiber Year 2008/09
5.2 Polyamide
Polyamide fibers declined 9.7% to 3.6 million tonnes in 2008. After some years of continuous
growth in the textile and industrial yarn business, both markets were on the downswing. Carpet
yarns continued its mid-term trend and staple fibers confirmed its long-term trend as shown in
the chart below.
Persistent high caprolactam and polymer prices until the last quarter of 2008, the depressed
housing market in the United States and lower vehicle build rates have put a strain on the
industry.
As the global capacity utilization of caprolactam plants fell below 60%, several manufacturers
temporarily closed facilities and reduced production in the second half of 2008. BASF AG
has reduced its worldwide production of caprolactam to about 65% at the sites in the United
States, Belgium and Germany. Fertilisers and Chemicals Travancore in India has restarted the
caprolactam plant in February 2009, which was closed for the last six months. Several Asian
caprolactam producers have reduced production rates by 30%. On the other hand, investments
have also been announced. In 2009, Zhejiang Hengyi Group has started to construct the biggest
single caprolactam line of 200,000 tonnes in Zhejiang province. Lanxess AG will expand
its capacity of caprolactam in the Netherlands by 10% until 2010. Honeywell of the United
States and Chongqing Chemical and Pharmaceutical Holding (Group) Company have started
feasibility studies for a caprolactam project of about US$400 million. Ube Industries aims to
finish a 10,000 tonnes expansion of its Thai capacity for caprolactam to 120,000 tonnes per
year in 2010.
According to the National Association of Realtors in the United States, vacation-home sales
dropped 30.8% to 512,000 last year, while investment-home sales fell 17.2% to 1.12 million in
2008. Primary residence sales declined 13.2% to 3.77 million in 2008. As part of the American
Recovery and Reinvestment Act, there is a new US$8,000 tax credit for home buyers available
in 2009 and the credit does not require repayment. This stimulus together with lowest mortgage
interest rates and lower house prices might support a recovery in nylon carpet filament from
residential demand.
VDA reported a 4.1% decline in world automotive production at 69.1 million vehicles. As about
three quarters of nylon industrial filament have been targeting the automotive industry, lower

32 The Fiber Year 2008/09
build rates directly affect the demand for tires and airbags. Although the polyester lobby has
been trying to branch out into this segment for several years, the airbag sector still is a 100%
nylon market. However, trials are underway in the coated fabrics sector to achieve commercial
approbation. Even if third party certification should be granted, bulkier polyester airbags due
to more yarns needed will restrict the scope of action for car designers.
The nylon filament business supplies yarns for textile, industrial and carpet applications. A
declining demand was noticeable for all end-uses. The total volume produced was down 8.6% at
3.3 million tonnes. Reductions in the manufacturing activity occurred across the world exempt
from PR China that managed to increase its output by 6.5%. Apart from a higher domestic mill
consumption, surging polyamide exports by 50% have helped the Chinese industry. Nevertheless,
the country still is a net importer of polyamide, purchasing nylon-related products amounting
to US$2.2 billion in 2008.
Almost 90% of nylon yarn production for textile end-uses is located in Asia and Greater Europe.
The global supply in 2008 accounted for 1.5 million tonnes, down 6.1%. While capacity in the
United States continued to decrease, acquisitions were the hot topic in Europe. In Turkey,
the long-term contraction went on, starting a couple of years ago with the closures of Insa
(Sabanci) and Tekstiplik. Last year, yarn maker Sifas Tekstil cut production and send some of
its workers on unpaid leave. In both regions, the Americas and Greater Europe, manufacturing
volume was down. The Nafta output dropped by 19.1% to 61,000 tonnes while Latin America’s
production remained at previous year’s level of 54,000 tonnes. The volume in Greater Europe
declined by 9.8% to 212,000 tonnes. Contrary signals came from the Chinese market with
innumerable small textile firms shutting down, foreign investors from neighboring countries
with one-step manufacturing units leaving the market and some Chinese companies expanding
nylon 6 and predominately nylon 66 textile filament yarn capacity. Companies like Fujian
Creator Group, Danylon, Hangzhou Yongchang, Liheng at Changle, Shanghai Rongyang,
Quanzhou Tianyu, Yantai Hualun and Xiamen Donglun have either started-up new capacity
or are in the construction phase. In total, those investments will raise the annual capacity by
about 50,000 tonnes. This seems to be reasonable in a market that grew 8.2% in 2008. The
strong build-up of Chinese capacity has already replaced nylon-related POY and textured yarn
exports from Taiwan. Shipments of Taiwanese FDY to the mainland are expected to suffer from
corresponding expansions shortly. Hence, Taiwan’s nylon industry suffered from poor textile
yarn volumes that slumped 21.5% to 302,000 tonnes. In total, the Asian output of textile yarns
was 4.6% lower at 1.1 million tonnes.
The nylon industrial yarn industry still is a little more balanced, athough at present Asia holds
a 63% market share compared to 50% in 2000. Greater Europe takes in a 21% market share and
the Americas amount to 13%. Last year’s production was on the decrease by 7.5% to below 1.0
million tonnes. The only growing industry was domiciled in PR China where production rose
3.0% to 314,000 tonnes. Despite qualified concerns about current excess capacity, manufacturers
like Hangzhou Dikai, Yixing Hongcheng and most prominently Invista, that has inaugurated its
US$50 million airbag yarn facility in November 2008, will further raise the installed capacity
in PR China. Double-digit declines took place in every American manufacturing nation with
Mexico worst hit, falling 44.1% to 7,100 tonnes after the withdrawal of AKRA. The United
States weathered the slump in nylon industrial yarn demand the best. Although output decreased
by 12.2% to 65,300 tonnes, manufacturers were running at full capacity following a long-term
contraction of capacity. Here, additional capacity will be put into operation from SANS in
North Carolina. The company will transfer a line from South Africa where production was
ceased. Europe, where the automotive production declined 4.0%, saw a reduction of nylon
industrial yarn production by 4.7% to 221,000 tonnes.
The global nylon carpet yarn suffered from the steepest decline as production fell 14.1%
to 824,000 tonnes. Above-average reduction arose in the United States with manufacturing

33The Fiber Year 2008/09
volumes dropping 16.1% to 521,500 tonnes and majors like Mohawk, Shaw and Solutia closing
several spinning plants. The real estate crisis is one explanation for the poor carpet volumes,
but steadily growing polyester carpet yarn volumes have additionally started to substitute nylon
carpet yarns. Investments in new polyester carpet yarn capacity may call for further growth
at the expense of both, polypropylene and nylon carpet yarn. The Canadian output was also
down 13.5% to 87,200 tonnes as it used to be the prime supplier to the United States. A similar
development has been observed in Greater Europe that was, in addition to lower consumer
spendings, suffering from the loss of exports to the Middle East as a consequence of the strong
Euro. The Chinese industry was enjoying growing manufacturing activity, mainly in the contract
market, due to Beijing Olympics, Shanghai Expo in 2010 and the Asian Games in Guangzhou
in 2012. To respond to increasing domestic demand, Shenma has doubled its nylon carpet yarn
capacity to 4,000 tonnes and Invista is building a 2,000-tonne facility.
The production of staple fibers has further slumped by 21.4% to 266,000 tonnes, largely driven
by strong cutbacks in the United States. Nevertheless, the U.S. industry still is the main center
of production with a global share of 47%, although output dropped by another 70,000 tonnes in
2008. In total, the U.S. industry has lost almost 150,000 tonnes of annual output in only three
years. Greater Europe, mainly the western part, also suffered from a double-digit decline. The
sustained Chinese development of nonwovens further boosted the staple market, up by 12.5%.
The development in Japan and Taiwan was slow without any significant changes.

34 The Fiber Year 2008/09
Gujarat Polyfilms Private Ltd. founded in 2004 as a joint venture
of Pratibha Group and T.M. Patel Group, is located in Surat, the
Indian synthetic fiber capital. The two companies involved have
been successfully active in the textile industry for over 25 years now.
Gujarat Polyfilms is specialized in the manufacturing of polyamide 6
FDY yarns. During ITME 2008 in Bangalore, ITME Daily News editor
D. J. Gohain spoke to Ritesh Gupta, Executive Director of Gujarat
Polyfilms Pvt. Ltd. about the manmade fiber market, his business and
his future plans.
How do you see today’s situation of shrinking profit margins in India’s
corporate world? Has the present situation hurt your business?
“Today’s business scenario is tough for everybody, especially
considering our high interest rate legacy in India, as compared to the
Far East. Also there are certain taxation structures which are difficult
to live with. On top of that, we have this situation of a global financial
meltdown. So, no doubt it is a difficult situation for everybody. We are
still battling it out and trying to keep afloat. I can’t say this situation
will not hit us. It may be so at some point in time, maybe in the very
near future.”
What is the strategy you are adopting to survive in this slowdown
environment?
“To tackle the slowdown in the market, our strategy is to make products
which will be consumed in the market quickly because prices are down
worldwide. In other words we want to sell and quickly clear up our
inventories.”
How does Oerlikon Barmag machinery assist your company in its
achieving goals?
“We have installed Oerlikon Barmag machinery in our plant and so far
the results are quite appreciable. We are coming with very new products
to the Indian market and trials are still going on. We are sure that these
innovative products will give us an edge over our competitors in the
market. Oerlikon Barmag machinery will definitely help position us as
a niche supplier of quality and innovative products.”
How does Oerlikon Barmag machinery and services add value to your
products?
“We are manufacturers of very fine denier Nylon FDY and have recently
introduced Micro filament Nylon FDY in India with Oerlikon Barmag
machinery. Oerlikon Barmag machinery adds value to our products
and we are able to provide high-quality and innovative products to the
customers.”
What is your view on the current situation of the synthetic fibers
market?
“Of late, chemical fiber prices have come down drastically. I feel that
low fiber prices will push up the demand again. The demand was low
because fiber prices were very high due to the rapid increase in raw

35The Fiber Year 2008/09
material prices of chemical fibers. But now the chemical fiber prices
are down by 40 to 60% and this should give a boost to demand. Once
inventories are cleared, these manufacturers will come to a reasonable
level of operational capacity.”
5.3 Polypropylene
The world polyproyplene market decreased by 11.0% to 2.6 million tonnes, suffering not
only from slowing textile consumption but to a greater extent from high raw material costs
compared with polyester fiber intermediates. The underlying market definition does not take
into consideration nonwovens, monofilaments, tapes, slit film and fiberfill.
While staple fiber applications dropped by 10.7% to 1.0 million tonnes, output of filament yarns
declined by 11.2% to 1.6 million tonnes. The industry was facing ongoing margin pressure due
to high raw material costs and the upstream industry could not pass these price hikes on. This
pressure has further supported the substitution of polypropylene by low-cost polyester yarns.
As low margins have forced producers to switch to niches, this could not compensate big-
volume end-uses. On top of that, the slump in carpet yarn demand was particularly responsible
for lower polypropylene spinning activities. This has mainly affected carpet yarn industries in
the United States and in Europe. The polypropylene business has additionally witnessed modest
activities for fine denier textile and high-tenacity yarns.
Despite double-digit declines of the polypropylene filament and fiber output in the Americas
and in Greater Europe, both regions were defending their leading market shares. The Americas,
with a predominant position of the United States, accounted for a 39% share. The contribution
from Greater Europe amounted to 34%. In Asia, the manufacturing volume was up nearly 3%,
driven by a 19% higher output in PR China and a 16% higher manufacturing volume in the
small-sized Indian industry.
5.4 Acrylic
The acrylic fibers market has continued its downswing, dropping by 20.0% to below 1.9 million
tonnes. This has resulted in a dramatic slump in world utilization rate to below 65% of nameplate

36 The Fiber Year 2008/09
capacity from almost 90% in 2003/04. The industry around the globe continued suffering from
flat demand and further increased raw material prices. Fiber prices have developed unfavorably
compared with polyester fibers, continuously widening the gap until year-end. All Asian
manufacturing nations suffered from double-digit declines, with the exception of India that
managed to slightly grow by 2.8%. The output in Greater Europe was down 13.4% and the
volume in Latin America declined by 6.6%. Top performing countries were Egypt and Iran,
both enjoying a double-digit production growth. The chart below shows major suppliers with
Asia accounting for a 56% share of world output followed by Greater Europe (35%) and the
Americas (6%).
Global demand for acrylic fibers was extremely weak and the situation even worsened after
crude oil prices started their dive in July. The downstream industry was expecting lower raw
material prices, but the decline by some 20% until end of November was rather moderate
compared with a loss of 60% in crude oil. This expectant mindset has resulted in buying just
minimum volumes to have as little stock as possible. Furthermore, substitution away from
acrylic continued to be a strong burden. In December, this disproportion has lessened and
caused a slight upward movement in activity.

37The Fiber Year 2008/09
As a consequence, several manufacturers around the world have temporarily or completely
shut down units. Other companies are planning to sell their acrylic assets or to reduce capacity.
Mitsubishi Rayon Co. Ltd. has already downsized its fiber operations by reducing annual
capacity for regular types of fiber from 130,000 tonnes to 52,000 tonnes. Furthermore, certain
facilities will be switched to the production of carbon fiber precursor materials. To end with
promising news, Radici Fibras Industria e Comercio in Brazil announced a perennial process
of investments to develop acrylic fibers for civil construction. Taekwang Industrial Co. built
a facility at the North Korean border to produce annually 4,000 tonnes acrylic fiber, expected
to start operation in February 2009. The company with annual acrylic fiber capacity of 57,000
tonnes in South Korea is considering to transfer part of its production facilities in the South to
the industrial complex.
5.5 Cellulosics
The cellulosic fiber market, producing an average annual growth rate of 3.5% over the last six
years, suffered from a decline in output by 9.1% at 3.3 million tonnes. Staple fibers dropped
by 7.9% to 3.0 million tonnes while filament yarns declined by 17.4% to 370,000 tonnes. As in
previous issues, data on the production of TENCEL®, the third-generation cellulosic fiber, is
included in this survey.
The filament business continued its long-term decline. Additional pressure resulted from a fire
at Glanzstoff Austria in January 2008. The company used to produce 10,500 tonnes industrial
yarns and 1,000 tonnes textile yarns at this site per year. Due to technically and economically
unfeasible future regulatory requirements, Glanzstoff Group had decided to cease production at
its St. Pölten factory at the end of 2008. The ongoing flat demand has additionally occasioned
Indian Century Textiles & Industries Ltd. to suspend operations of viscose yarn by end of
February 2009. Finally, Enka Group will close its textile viscose yarn production at its Elsterberg
site in Germany, established in 1909, by end-June 2009 as orders dropped more than 20%.
Acetate tows, used in the manufacturing of cigarette filters, rose by 2.1% to 732,000 tonnes. The
continued slowdown in growth may be result of the global efforts to restrict smoking. However,
this industry still is comparatively balanced in regional terms. Daicel Chemical Industries Ltd.,
the market leader in Asia, has commissioned its new production facility for cigarette filter

38 The Fiber Year 2008/09
acetate tow in October 2007, increasing total capacity by about 20%. In the first nine months
(April – December 2008) of the current fiscal year 2009, cellulosic derivatives have achieved
revenues of ¥60.7 billion and an operating income of ¥7.4 billion – ROS of 12.2% appears to
be enviable for the tough conditions in the global textile industry. Therefore, it is not surprising
that the company had announced to construct a new acetate tow plant for cigarette filters at its
Aboshi plant, Japan, with start-up in the first quarter 2010. Its goal is to meet growing demand,
mainly for use in super slim cigarettes, in overseas markets. Combined with the capacity at
its Ohtake plant, its domestic acetate tow capacity for cigarette filters will increase by 10% to
71,500 tonnes per year.
Although demand for viscose staple fibers in nonwovens, textile applications and flame retardent
products has been promising, this fiber has been negatively affected by excess capacity and,
since September 2006, an increasingly unfavorable price differential between viscose and
polyester staple fiber.
TENCEL®, the new age cellulose fiber, has successfully continued to gain market shares in a
range of end-uses in the home textiles and clothing sector as well as the nonwovens industry. As
a result of the persistent strong demand, Lenzing AG had completed the 10,000-tonne expansion
of high-quality TENCEL® fibers at its Austrian facility. This growth seems to be driven by
nonwovens made up of Lenzing’s staple fiber types, that had been certified as compostable
materials as they are fully biodegradable. However, bad news came from Finland as viscose
fibers manufacturer Kuitu Finland Ltd., formerly Säteri Oy, had filed for insolvency.
Viscose staple fibers may regain lost territory as soon as the price differential to polyester
staple fibers will further shrink. An increasingly tightened competition when the new facility
from Shandong Boxer as well as capacity additions from Fulida and Aoyang will come on-
stream in 2009 may lead to a decline in prices.

39The Fiber Year 2008/09
“The Lenzing Group is an international group of companies,
headquartered in Austria. Lenzing provides the global textile and
nonwovens industry with high-quality cellulose fibers - from special
cellulose fibers to high-tech plastics polymers. Seventy years of fiber
production expertise make us the only producer world-wide of all three
man-made cellulose fiber generations, from classic viscose to lyocell
and modal.
The fiber boom of record year 2007 drove our business up to the middle
of 2008. Then the situation changed markedly: The financial crisis,
triggered in the USA, successively spread into the real economy and
thereby affected our customers in the textile chain. We experienced a
massive decline in fiber business which became even more pronounced
by the end of the year. The impact of falling prices was in part
aggravated by high raw material prices and sinking demand.
In this dramatic development, which brought about the first decline in
global fiber production in decades, Lenzing sustained its position well.
Thanks to our consistent cost management and our strong position
as market and innovation leader we even managed to gain further
market share. Last, but not least we succeeded because of the good
fundamentals of the Lenzing Group:
The excellent and long-standing relationship with our customers is
based on our continuous focus on the superior quality and performance
of our products, maintained and enhanced by steady quality assurance
and ongoing optimization, and on our track record as a reliable and
stable supplier. The Lenzing Group has proven itself as a steady partner
even in a turbulent phase of the economy: A keystone to success in
difficult times.
The ecological advantages of our fibers made from the raw material
wood have never been as topical as today. And here we benefit from
our past high investment in the future: Ecologically sound production
and the natural raw material wood are unique sales propositions for
our customers in the textile and the nonwovens industry. The market
demands the superior absorbency and the excellent ease of wear of
cellulose fibers, a result of their natural origin.
Ongoing product development and innovative strategies in customer
cooperation are further important reasons for the high acceptance of our
products and services in the supply chain: They enable our customers
to differentiate themselves in their markets. A tradition of strong links
with machinery suppliers, as well as the accumulated expertise of
decades are crucial elements of the reliability and the success of our
innovative products with our customers.”
Management Board
Austria

40 The Fiber Year 2008/09
5.6 Carbon Fibers
This technologically advanced fiber continued to be on the upswing although some worrying
issues emerged in the course of last year, in particular related to the aircraft and wind power
segment. However, production is believed to have further gone up to about 38,000 tonnes.
In addition to the full commercial operation of some manufacturers’ expansion of existing
facilities in 2007, three new manufacturing sites went on-stream in Mexico, Spain and Turkey
in 2008.
No doubt that the superior carbon fiber properties will branch out into new markets and
increasingly substitute traditional materials. Nevertheless, adverse conditions will go along with
this development arising from temporary excess capacity and disappointments in consumption
of some end-uses. First evidence has been experienced in worsening business figures of major
carbon fiber producers.
According to the General Aviation Manufacturers Association, worldwide deliveries of general
aviation airplanes amounted to 3,969 airplanes in 2008, valued at US$24.8 billion, compared
with 4,272 units valued at US$21.9 billion during this same period in 2007. The business jet and
turboprop shipments continued to show strength while the piston engine airplane sector, most
susceptible to economic changes, was down 20.8%.
Annual deliveries of Airbus and Boeing, dominating the market for more than 100-seat
commercial planes, were down 4.0% at 858 aircraft. The new composite-intensive aircraft in
commercial and military aerospace has not achieved its original target of consumption. Boeing’s
B787, originally scheduled to enter service in May 2008, has been delayed four times to first
delivery in 2010. Airbus fell short of its targeted A380’s deliveries in 2008 and will continue
to be under plan this year. The Airbus A400M military transport plane, which was initially
contracted for first delivery in 2009, has even been delayed three years. In addition, a two-
month strike at Boeing has resulted in the loss of about 60 planes scheduled for delivery in the
fourth quarter.
The build rate of commercial aircraft as well as business and regional jet will soften. Airbus
and Boeing, the world’s largest planemakers, plan to deliver a little less, but prepare already to
adjust output for a significantly lower level in 2010. Bombardier Aerospace, the third largest
maker of aircraft, expects fiscal year 2009/10 deliveries to be slightly less than last fiscal year.

41The Fiber Year 2008/09
Embraer, the fourth largest aircraft maker, slashed its deliveries forecast for this year to 270
aircraft from a previous estimate of as many as 350.
New composite-intensive aircraft programs will also not contribute to a significant stimulation
in 2009. Nevertheless, the outlook remains positive due to the Asian traffic growth, the rising
number of low cost carriers and more retrofitting. Moreover, a number of new aircraft programs
(Airbus’s A350 and A320 successor, Boeing’s Yellowstone Project, Bombardier’s CSeries,
United Aircraft’s MS-21, Mitsubishi Regional Jet) with targeted first flight between 2013 and
2015 will boost demand for lightweight composite materials.
Wind power has continued its surging capacity additions. According to the Global Wind Energy
Council, wind power installations increased by 29% in 2008 to 120,791 megawatts (MW). The
market for last year’s turbine installations accounted for about US$47.5 billion.
This segment is increasingly gaining attractiveness for carbon fibers as the continuously
increasing average blade length requires the usage of lightweight materials. Between 2000 and
2008, the average blade length has doubled to about 45 meters.
Nearly three quarters of the wind power capacity is installed in the United States, Germany,
Spain, PR China and India. The Chinese wind energy market has again doubled and the United
States passed Germany to take the lead in wind power installations. The outlook for both markets
is promising as the development of wind energy is one of the key economic growth areas in PR
42 The Fiber Year 2008/09
China. Furthermore, the wind energy helps to achieve President Obama’s ambition of doubling
renewable energy production in three years.
However, the financial crisis along with drastically falling crude oil prices have hit the wind
sector in the second half of the year, resulting in a declining demand for carbon fibers. The
economic slowdown has also caused a slump in demand for sports applications, automotive
and other industrial markets, reflecting both weak markets and inventory adjustments by
customers.
5.7 Aramids
The markets of aramids comprise para-type aramid, used for a variety of reinforcements
reflecting its high-tenacity and high-strength, and meta-type aramid, equipped with superior
properties in heat resistance and flame retardancy. Last year’s production is believed to have
accounted for 69,000 tonnes, predominantly provided by U.S. based DuPont and Japan based
Teijin. Both companies have been dominating this industry in recent decades and continuously
expanding their capacities on global basis. In mid-2008, Teijin has completed the first phase of
expansion and gradually increased its para-aramid fiber capacity by 15% at its Dutch facility –
an investment that was decided in November 2006. DuPont’s multi-phase expansion to lift para-
aramid capacity by more than 25%, an US$500 million investment announced in September
2007, will be delayed at least a year. It was originally scheduled to open in late 2010. However,
the meta-aramid expansion in Spain has recently been completed, the final step in a three-phase
US$100 million investment.
This segment has been offering a multitude of growing opportunities in various end-uses such
as aircraft, automotive and tires, protective clothing, ballistics, friction, reinforcement material,
heat and cut resistance applications and civil engineering/geotextile. Although the outlook for
future growth still looks promising, the steady and firm demand fell in aerospace, automotive
and military. However, the commitment of the both industry leaders remains high, in particular
to defend the market leadership.
Teijin will reorganize its High Performance Fibers Business Group into Aramid Fibers Business
Group and Carbon Fibers Business Group that separately handle aramid fibers and carbon
fibers effective April 1, 2009. DuPont sued South Korean Kolon Industries Inc. in February
2009, claiming theft of trade secrets for protective clothing from aramid fibers. Kolon is a
latecomer to this segment, entering this industry mid-2005. In general, quiet a challenging
ambition to step into competition with two dominant global players as this segment is believed
to be consistently covered by patents.
5.8 Spandex Yarns
The spandex industry has also been negatively impacted by the slowing textile consumption. Last
year’s output is believed to have dropped by at least 10% to below 350,000 tonnes. In addition
to that, specific circumstances have significantly worsened the manufacturers’ situation. The
chart below shows prices that started soaring to extremely high levels from mid-2006 onwards,
leading to massive new investment plans with scheduled start-up in 2007 and 2008.

43The Fiber Year 2008/09
The main target of capacity additions has been PR China. As already mentioned in last year’s
issue “… the capacity will again outstrip demand. This may worsen the manufacturer’s
margins…” New capacity of about 135,000 tonnes came on-stream in PR China. As the average
Chinese capacity utilization was just about 55%, it is no surprise to have witnessed a number
of domestic producers shut down operations and even industry majors like Shandong Yantai
Spandex Plant reported utilization rates of merely 40%. A conference in October, organized
by China Chemical Fiber Association, was aimed at further cutting operation rates as earlier
agreed production cuts of 30% turned out to be not enough. In total, Chinese consumption in
2008 fell to about 160,000 tonnes with both exports and imports declining by 13% each.
Despite lower exports, some markets have come under significant attack from Chinese exports.
Most shipments (8,973 tonnes, +32%) went to Turkey where the new 15,000-tonne facility
from Hyosung Corp. started operation in the first quarter of 2008. While deliveries to Japan
moderately rose by 11% to 6,676 tonnes, exports to South Korea almost doubled to 5,996
tonnes. This is quite remarkable as it is the home market for Hyosung, the second largest
producer of spandex in the world, that can produce a combined 92,000 tonnes of spandex at
local and overseas plants.
Spandex activity in Europe has continuously worsenend with volumes below 2007 and capacity
significantly under-utilized despite voluntary liquidation of Fillattice that had already downsized
its Italian facility in 2007. New capacity was launched from Asahi Kasei Fibers Corp. in
Germany that had bought the Dorlastan® spandex business of Lanxess in November 2005. This
additional 400-tonne capacity together with the commercial production at the Hyosung plant in
Turkey just accounted for a fraction of new installed equipment in PR China and Vietnam. In
Vietnam, Hyosung commenced operations of its new 15,000-tonne spandex plant and Texhong
Textile Group of China is constructing two plants for manufacturing spandex.
While the U.S. spandex producers were running near full capacity in 2007, the business climate
has steadily worsened as well with a drop in capacity utilization to below 70% in the fourth
quarter 2008. Increased exports from PR China at 4,017 tonnes (+10%) may pose a minor reason
for the slowing spandex business in the United States. In particular, the reduced domestic mill
consumption is to blame following the closure of several processing companies.

44 The Fiber Year 2008/09
6. Spun Yarn
The 2008 world output of yarns was down 6.5% to 59.2 million tonnes. The three yarn types
were differently affected by the worldwide slump in demand. Filament yarns decreased
31.2 million tonnes and long staple yarn even fell 10.5% to 4.1 million tonnes.
Spun yarns still dominate the world market with a 59.6% share compared with 64.0% in 2000.
However, filament yarns have been producing higher dynamics. The average annual growth
rate over the period 1995 until 2008 accounts for 5.8% in the filament business and 2.4% in the
spun yarn industry. In 2008, output of filaments amounted to 23.9 million tonnes (-2.8%) and
spun yarns accounted for 35.3 million tonnes (-8.9%). The chart below shows the long-term
development of filament and spun yarns.
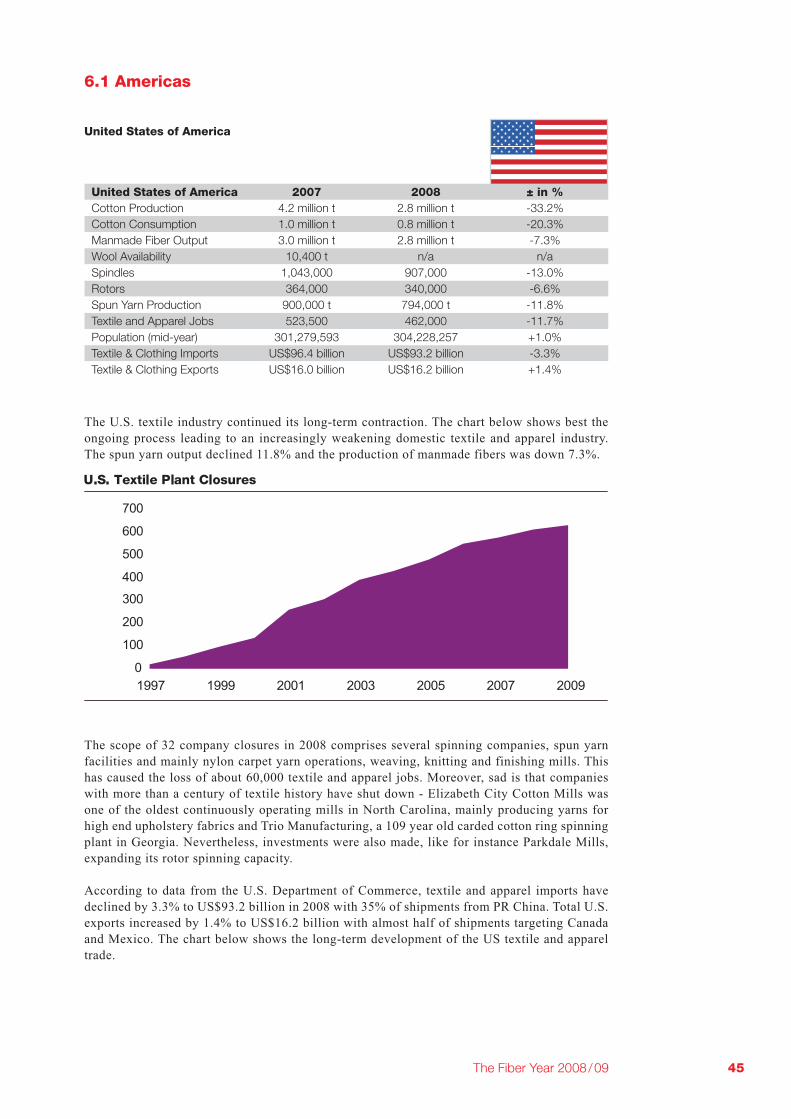
45The Fiber Year 2008/09
6.1 Americas
United States of America
The U.S. textile industry continued its long-term contraction. The chart below shows best the
ongoing process leading to an increasingly weakening domestic textile and apparel industry.
The spun yarn output declined 11.8% and the production of manmade fibers was down 7.3%.
The scope of 32 company closures in 2008 comprises several spinning companies, spun yarn
facilities and mainly nylon carpet yarn operations, weaving, knitting and finishing mills. This
has caused the loss of about 60,000 textile and apparel jobs. Moreover, sad is that companies
with more than a century of textile history have shut down - Elizabeth City Cotton Mills was
one of the oldest continuously operating mills in North Carolina, mainly producing yarns for
high end upholstery fabrics and Trio Manufacturing, a 109 year old carded cotton ring spinning
plant in Georgia. Nevertheless, investments were also made, like for instance Parkdale Mills,
expanding its rotor spinning capacity.
According to data from the U.S. Department of Commerce, textile and apparel imports have
declined by 3.3% to US$93.2 billion in 2008 with 35% of shipments from PR China. Total U.S.
exports increased by 1.4% to US$16.2 billion with almost half of shipments targeting Canada
and Mexico. The chart below shows the long-term development of the US textile and apparel
trade.
United States of America 2007 2008 ± in %
Cotton Production 4.2 million t 2.8 million t -33.2%
Cotton Consumption 1.0 million t 0.8 million t -20.3%
Manmade Fiber Output 3.0 million t 2.8 million t -7.3%
Wool Availability 10,400 t n/a n/a
Spindles 1,043,000 907,000 -13.0%
Rotors 364,000 340,000 -6.6%
Spun Yarn Production 900,000 t 794,000 t -11.8%
Textile and Apparel Jobs 523,500 462,000 -11.7%
Population (mid-year) 301,279,593 304,228,257 +1.0%
Textile & Clothing Imports US$96.4 billion US$93.2 billion -3.3%
Textile & Clothing Exports US$16.0 billion US$16.2 billion +1.4%

46 The Fiber Year 2008/09
The chart below represents the ten leading textile and apparel importing nations into the United
States. Last year’s volume of this group increased by 1.0% to US$66.0 billion, accounting for a
70.9% share in imports. Vietnam and Bangladesh have clearly benefited from quota-free trade,
increasing its exports by 19.0% and 10.8% respectively. The NAFTA partners, Canada and
Mexico, have further lost significant volumes. While Canadian shipments fell 25% to US$1.7
billion, Mexican deliveries dropped 11.9% to US$5.0 billion.
As shown in the chart below, the largest import category (338/339) comprises cotton knit shirts
and blouses. Imports declined by 3.2% to US$14.2 billion. The local market size in volume
terms fell 2.3% to 437 million dozen, the domestic share of production decreased from above
50% in the mid-1990s to about 4% last year.

47The Fiber Year 2008/09
This market segment is representative for a number of other end-uses. The second ranked U.S.
import category (347/348) for cotton trousers, slacks and shorts, amounted to US$12.2 billion
(-3.2%) in 2008. Likewise, the local share of production decreased from above 50% in mid-
1990s to about 2% in 2008. Other segments like coats, skirts, sweaters, night- and underwear
have similarly developed.
However, the United States still is significantly involved in the global textile industry as it is the
largest exporter of raw cotton. In the current 2008/09 season, 2.6 million tonnes of cotton are
designed for exports, that accounts for 41% of world cotton exports. Moreover, it is the biggest
textile and apparel consuming single country. On top of that, it is strongly impacting worldwide
flow of machinery and equipment. The reduction of domestic capacity has led to increased
sales of used machines to Asia and Africa. Although used equipment has lower purchase costs,
outdated technology will not guarantee a successful export production, which is necessary to
earn foreign exchange.
Mexico
Mexico’s economic growth slowed to 1.3% in 2008 after an 3.3% expansion in the previous
year as the U.S. slowdown has negatively affected the domestic economy. In the fourth quarter,
gross domestic product even contracted 1.6%, mainly driven by a sharp contraction in the
industrial sector, which declined 4.2% annually. The annual headline inflation of 6.5% closed
the year at the highest level in eight years, and more than doubled the Central Bank’s long-term
inflation target of 3.0%. Foreign direct investment fell to below US$18 billion last year, down
from US$24.7 billion in 2007.
Mexico 2007 2008 ± in %
Cotton Production 135,000 t 134,000 t -0.7%
Cotton Consumption 435,000 t 392,000 t -9.9%
Manmade Fiber Output 342,000 t 283,100 t -17.2%
Wool Availability 4,100 t n/a n/a
Population (mid-year) 108,700,891 109,955,400 +1.2%
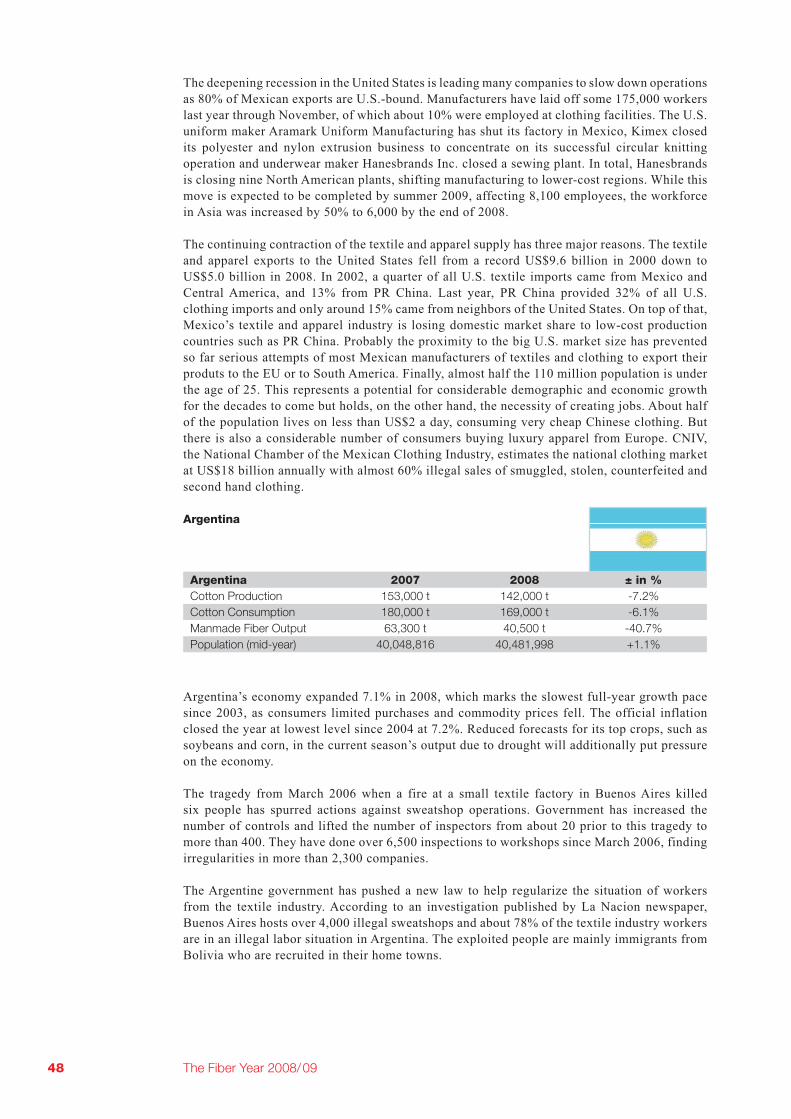
48 The Fiber Year 2008/09
The deepening recession in the United States is leading many companies to slow down operations
as 80% of Mexican exports are U.S.-bound. Manufacturers have laid off some 175,000 workers
last year through November, of which about 10% were employed at clothing facilities. The U.S.
uniform maker Aramark Uniform Manufacturing has shut its factory in Mexico, Kimex closed
its polyester and nylon extrusion business to concentrate on its successful circular knitting
operation and underwear maker Hanesbrands Inc. closed a sewing plant. In total, Hanesbrands
is closing nine North American plants, shifting manufacturing to lower-cost regions. While this
move is expected to be completed by summer 2009, affecting 8,100 employees, the workforce
in Asia was increased by 50% to 6,000 by the end of 2008.
The continuing contraction of the textile and apparel supply has three major reasons. The textile
and apparel exports to the United States fell from a record US$9.6 billion in 2000 down to
US$5.0 billion in 2008. In 2002, a quarter of all U.S. textile imports came from Mexico and
Central America, and 13% from PR China. Last year, PR China provided 32% of all U.S.
clothing imports and only around 15% came from neighbors of the United States. On top of that,
Mexico’s textile and apparel industry is losing domestic market share to low-cost production
countries such as PR China. Probably the proximity to the big U.S. market size has prevented
so far serious attempts of most Mexican manufacturers of textiles and clothing to export their
produts to the EU or to South America. Finally, almost half the 110 million population is under
the age of 25. This represents a potential for considerable demographic and economic growth
for the decades to come but holds, on the other hand, the necessity of creating jobs. About half
of the population lives on less than US$2 a day, consuming very cheap Chinese clothing. But
there is also a considerable number of consumers buying luxury apparel from Europe. CNIV,
the National Chamber of the Mexican Clothing Industry, estimates the national clothing market
at US$18 billion annually with almost 60% illegal sales of smuggled, stolen, counterfeited and
second hand clothing.
Argentina
Argentina’s economy expanded 7.1% in 2008, which marks the slowest full-year growth pace
since 2003, as consumers limited purchases and commodity prices fell. The official inflation
closed the year at lowest level since 2004 at 7.2%. Reduced forecasts for its top crops, such as
soybeans and corn, in the current season’s output due to drought will additionally put pressure
on the economy.
The tragedy from March 2006 when a fire at a small textile factory in Buenos Aires killed
six people has spurred actions against sweatshop operations. Government has increased the
number of controls and lifted the number of inspectors from about 20 prior to this tragedy to
more than 400. They have done over 6,500 inspections to workshops since March 2006, finding
irregularities in more than 2,300 companies.
The Argentine government has pushed a new law to help regularize the situation of workers
from the textile industry. According to an investigation published by La Nacion newspaper,
Buenos Aires hosts over 4,000 illegal sweatshops and about 78% of the textile industry workers
are in an illegal labor situation in Argentina. The exploited people are mainly immigrants from
Bolivia who are recruited in their home towns.
Argentina 2007 2008 ± in %
Cotton Production 153,000 t 142,000 t -7.2%
Cotton Consumption 180,000 t 169,000 t -6.1%
Manmade Fiber Output 63,300 t 40,500 t -40.7%
Population (mid-year) 40,048,816 40,481,998 +1.1%
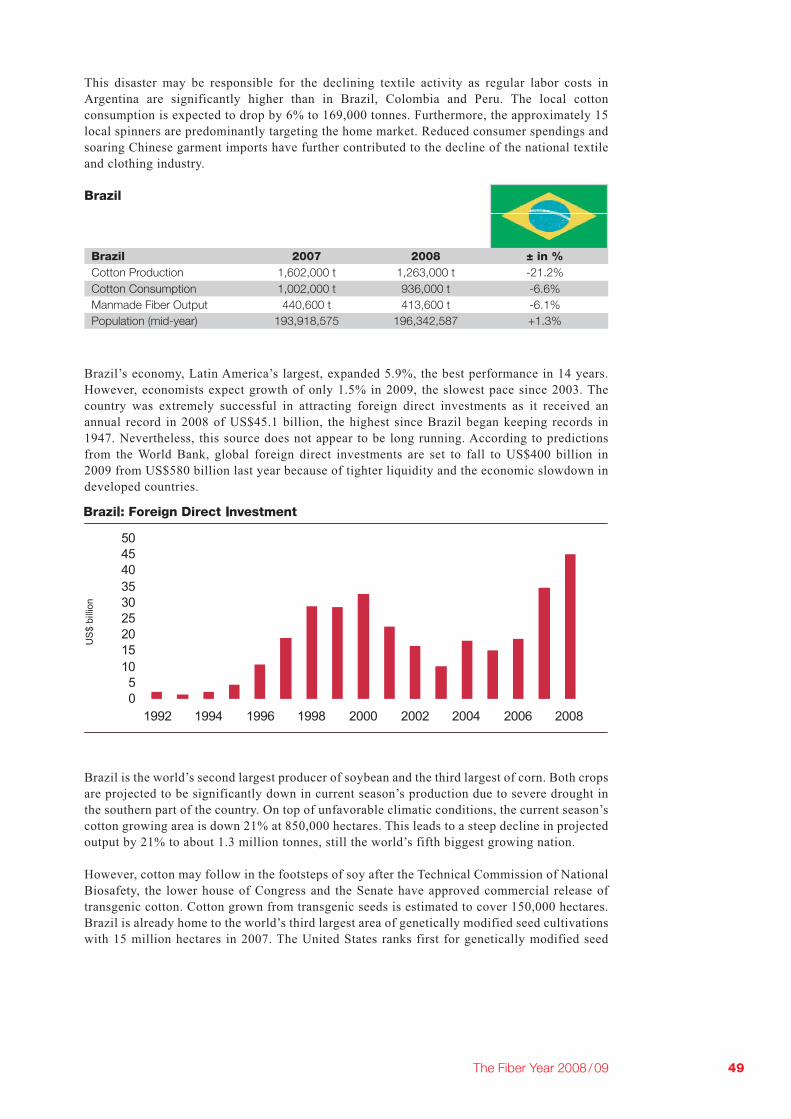
49The Fiber Year 2008/09
This disaster may be responsible for the declining textile activity as regular labor costs in
Argentina are significantly higher than in Brazil, Colombia and Peru. The local cotton
consumption is expected to drop by 6% to 169,000 tonnes. Furthermore, the approximately 15
local spinners are predominantly targeting the home market. Reduced consumer spendings and
soaring Chinese garment imports have further contributed to the decline of the national textile
and clothing industry.
Brazil
Brazil’s economy, Latin America’s largest, expanded 5.9%, the best performance in 14 years.
However, economists expect growth of only 1.5% in 2009, the slowest pace since 2003. The
country was extremely successful in attracting foreign direct investments as it received an
annual record in 2008 of US$45.1 billion, the highest since Brazil began keeping records in
1947. Nevertheless, this source does not appear to be long running. According to predictions
from the World Bank, global foreign direct investments are set to fall to US$400 billion in
2009 from US$580 billion last year because of tighter liquidity and the economic slowdown in
developed countries.
Brazil is the world’s second largest producer of soybean and the third largest of corn. Both crops
are projected to be significantly down in current season’s production due to severe drought in
the southern part of the country. On top of unfavorable climatic conditions, the current season’s
cotton growing area is down 21% at 850,000 hectares. This leads to a steep decline in projected
output by 21% to about 1.3 million tonnes, still the world’s fifth biggest growing nation.
However, cotton may follow in the footsteps of soy after the Technical Commission of National
Biosafety, the lower house of Congress and the Senate have approved commercial release of
transgenic cotton. Cotton grown from transgenic seeds is estimated to cover 150,000 hectares.
Brazil is already home to the world’s third largest area of genetically modified seed cultivations
with 15 million hectares in 2007. The United States ranks first for genetically modified seed
Brazil 2007 2008 ± in %
Cotton Production 1,602,000 t 1,263,000 t -21.2%
Cotton Consumption 1,002,000 t 936,000 t -6.6%
Manmade Fiber Output 440,600 t 413,600 t -6.1%
Population (mid-year) 193,918,575 196,342,587 +1.3%

50 The Fiber Year 2008/09
cultivation with 58 million hectares in 2007, half the world´s transgenic farmland. Argentina
takes in second place with close to 20 million hectares. The approval of Bt cotton may help
to bring down production cost. In addition, the Ministry of Agriculture has provided US$327
million to the cotton industry for commercialization.
Brazil has the second largest population in the Western hemisphere with more than 195 million
people. The Brazilian population is also young, more than half is under the age of 29. This may
explain that the clothing expenditure per capita of about US$400 is relatively stronger than in
other emerging countries. This adds up to an annual domestic apparel market size at retail level
of nearly US$80 billion. Even more appealing that the local clothing market used to rise 7%
annually.
It already became apparent in the fourth quarter of 2008 that consumer spending on clothing
cooled down. Relief for the domestic textile consumption may arise from governmental efforts
to revive economic growth. President Luiz Inacio Lula da Silva has announced plans to build
one million homes by 2010 to protect workers in the construction industry. This may help to
lift demand for home textiles, actually demanding 425,000 tonnes of predominantly cotton and
polyester products on annual basis.
Colombia
The economy rose only 3.5% last year after growing at a rate of 7.9% in 2007 on strong
consumer and industrial demand. Higher prices in food and beverages have caused a rise in
annual inflation rate at 7.7%, which represents the highest year-end inflation rate since 2000.
However, the country has never experienced hyperinflation, maintaining single-digit levels
since 1999. Substantial foreign direct investments continued to flow into the country. This may
result from the World Bank business environment ranking in the 2009 “Doing Business Report”.
Colombia has been recognized during the past years as one of the countries that introduced the
most reforms to improve the business platform. Colombia is now located at position 53 in
the rank of 181 countries. This makes Colombia the country that generates the most reforms
to facilitate business in Latin America. Additionally, according to the World Competitiveness
Yearbook 2008, Colombian managers are recognized by multinational companies as one of
the most qualified in the region. On top of that, labor force is available at competitive wages,
compared with other developing and industrialized countries.
Colombia 2007 2008 ± in %
Cotton Production 35,000 t 30,000 t -14.3%
Cotton Consumption 79,500 t 80,000 t +0.6%
Population (mid-year) 44,379,598 45,013,674 +1.4%

51The Fiber Year 2008/09
The majority of FDI was destined for the oil and mining sector. In the clothing sector, Kaltex,
a Mexican textile producer, acquired the majority share of Coltejer-Cia. Colombiana de Tejidos
S.A. at the price of US$96 million. Coltejer’s product mix includes natural and synthetic fibers,
woven and knitted fabrics, clothing and home textiles. Coltejer started its new denim plant in
Colombia at costs of US$32 million in 2006. Furthermore, Brazilian-based Hering Store, a
clothing manufacturer and sales company, has opened a clothing retail store and is planning to
open 11 more in Bogota before 2011.
Colombia’s textile and apparel industry, generating about 700,000 direct and indirect jobs,
comprises nearly 500 textile mills and 10,000 clothing companies, most of which are small-
and medium-sized. The textiles and apparel sector covers the entire supply chain from cotton
and synthetic fibers, through spinning, weaving, knitting, finishing, dyeing and printing, to
the manufacture of garments and accessories. However, there still is a shortfall of cotton yarn
and denim, leading to textile imports of about US$1 billion that could be replaced by local
production. The elimination of the 10% import tariff on cotton may pose a promising measure
to spur upstream spinning activities as higher imports will be required. Heavy rainfalls during
the planting season will lead to a 5,000-tonne decline in cotton production. The excellent supply
of energy at competitive costs and the demand of the downstream industry might call for higher
investments in new capacity.
Looking ahead, the following issues might put pressure on Colombia’s textile and apparel
industry:
a) Smuggling of clothes is very common. According to the Colombian Association of Textile
Manufacturers and The National Business Association of Colombia, 30% of the domestic
market consists of illegal trade.
b) Currency
c) Competition from Asia
d) Lacking international business as meager 5% of textile and clothing exports are being shipped
beyond the American borders
Peru
Peru’s economy grew 9.8% in 2008, the fastest expansion since 1994. The annual inflation
almost doubled to 6.7%, which is the highest year-end figure observed since 1996, but slowed
in December on falling fuel prices and electricity rates. The textile industry of Peru has
gradually gained importance backed by its low labor costs. According to Werner International,
the average hourly cost per operator accounted for US$2.02 in 2008 with 8,232 mill operation
hours per year.
Peru 2007 2008 ± in %
Cotton Production 65,000 t 65,000 t ±0.0%
Cotton Consumption 114,000 t 114,000 t ±0.0%
Population (mid-year) 28,809,303 29,180,899 +1.3%

52 The Fiber Year 2008/09
As cotton is considered the white gold of Peru, the domestic clothing industry has heavily relied
on this main input to grow its exports. In particular, the increase in total exports of textiles
and apparel to the U.S. has been quite remarkable, since 2000 doubling to more than US$800
million. Almost 90% refer to cotton export products in value terms.
Next to low cost of production and the high quality of raw material, duty-free access to the U.S.
market and vertical integration of the local manufacturers, generating about 350,000 direct jobs
in the apparel chain, have helped to boost exports. Peruvian textile investments during 2008,
estimated to have increased to about US$200 million, may be considered as a token of strength.
Nevertheless, in light of a high national poverty rate of 40%, investors might start worrying
about the presidential election in 2011 that could reverse President Alan Garcia’s free-market
policies and pro-business programs.
In addition to conventional cotton, Peru belongs to the top ten organic cotton producing
countries. Spurred by higher demand from numerous small- to large-sized retailers, organic
cotton cultivation surged 152% in the last season to 145,872 tonnes grown on 161,000 hectares
in 22 countries around the world. Primum mobile for retailers seems to be that organic cotton
can sell for a premium. However, to help ensure the quality and value of organically grown
products, growers must not have used synthetics for three seasons before they can apply to
be an organic grower. This three-year gap has kept some farmers away from the conversion.
In an attempt to support the growth of the organic cotton industry, Wal-Mart Stores Inc. will
purchase so-called “transitional” cotton at the same premium cost of certified organic cotton.
The world’s largest retailer needs a large and steady supply to further increase the number
of organic products in its U.S. stores to serve an U.S. business already topping US$1 billion
annually.
6.2 Asia
Asia 2007 2008 ± in %
Cotton Production 15.5 million t 14.9 million t -3.8%
Cotton Consumption 20.4 million t 18.4 million t -9.7%
Wool Consumption 705,800 t n/a n/a

53The Fiber Year 2008/09
Bangladesh
Bangladesh’s US$72 billion economy needs to grow by more than 7% a year to become a
middle-income country by 2020 and by more than 8% to halve poverty by 2015. Around 40% of
Bangladesh’s more than 150 million people live below the international poverty line. Although
the country was expected to suffer greatly after the expiration of the Multi Fiber Agreement in
January 2005, which imposed quotas on developing countries’ exports to developed countries,
it has benefited from the removal of quotas, as its labor is some of the cheapest in the world.
Its textile industry is the number-one export earner, accounting for about 75% of the country’s
exports and foreign exchange earnings. In 2008, a total of 43 new spinning mills came into
operation with 945,000 spindles versus 28 mills in 2007 with 443,000 spindles. The industry
has enjoyed an annual increase in installed spindles of almost 15% on average over the last
eight years. At present, the country has a total of 341 spinning mills. Anyhow, conditions have
worsened as yarn stocks at the mills increased and yarns from neighboring countries were partly
offered below raw material costs.
As a consequence of strong investments and favorable perspectives for garment exports, the
textile industry now employs more than five million people and contributes about 13% of the
country’s GDP. The output was also steadily on the rise. The chart below shows the development
and, at the same time, the persistent necessity for further investments in spinning, weaving,
knitting and processing mills.
Bangladesh 2007 2008 ± in %
Cotton Production 8,000 t 13,000 t +62.5%
Cotton Consumption 599,000 t 599,000 t ±0.0%
Wool Consumption 2,500 t n/a n/a
Yarn Consumption 650,000 t 680,000 t +4.6%
Population (mid-year) 152,033,861 154,037,902 +1.3%
Number of Garment Units 4,490 4,740 +5.6%
Textile & Clothing Exports US$9.4 billion US$12.1 billion +28.7%

54 The Fiber Year 2008/09
Bangladesh is almost entirely dependant on raw cotton imports to meet rapidly growing demand,
as cotton is a relative less desirable crop and high-yielding varieties are lacking. Rainfalls,
floods and pest infestations which are common in Bangladesh worsen profitability vis-à-vis
competing crops.
Apparel exports have significantly changed, knitwear exports exceeded woven apparel exports
in 2007/08 for the first time. Total exports went up 29% at US$12 billion in 2008, even strongly
gaining momentum in the second half of 2008 as U.S. and EU retailers progressively turned
to lower-priced products. The majority was sold to the European Union and US$3.5 billion
were shipped to the United States. This represented a strong 11% increase in deliveries to
the largest single consumer market. This is consequence of trade advantages with the United
States and several other countries through various instruments, including the Generalized
System of Preferences, and bilateral trade and investment treaties. Given political stability,
textile industry looks with optimism to the future. The Bangladesh Garment Manufacturers and
Exporters Association even aims to double apparel exports to US$25 billion by 2013.

55The Fiber Year 2008/09
This target seems to be supported by almost all renowned international retailers that have
enhanced their procurement volume. Furthermore, Bangladeshi government has received
innumerable proposals for textile and garment investments worth more than US$1 billion
last year. Nevertheless, power shortages have increasingly blocked industrial expansion, and
therefore the country crucially needs a large expansion in generation capacity, as well as an
upgrading of transmission and distribution networks. The 2008/09 budget aims to accelerate
growth and to protect the poor from rising prices for food, fuel and fertilizer. To boost production
and investments, it has reduced income tax and import duty rates. It also provides various tax
incentives to stimulate business activity and investment.
Cambodia
Cambodia, the second poorest country in Southeast Asia, heavily relies on the garment industry,
providing about 80% of its foreign exchange, accounting for 12% of the gross domestic product
and employing almost 330,000 people. Its export garment market is worth about US$2.8
billion with majority of exports to the United States. In particular, exports of US$1.5 billion
in categories protected by U.S. quotas on shipments from China such as 338/339 (cotton knit
shirts) and 347/348 (cotton trousers) might be at risk as quotas expired at the end of 2008.
Actually, the increasing pressure in the U.S. market has already led to a decline in those large-
volume categories, causing the closure of some 30 garment factories, leaving about 30,000
workers unemployed. This shows the necessity for the country’s apparel industry to further
develop. The economic stimulus to extend the profit tax exemption for garment factories until
the end of 2009 appears to be not far-reaching enough. The absence of domestic spinning
and weaving companies due to prohibitive high energy costs will avoid a break through. To
safeguard employment, according investments seem to be crucial as low labor costs and high
ethical standards due to the International Labor Organization’s monitoring system will not be
enough to ensure long-term survival. Better Factories Cambodia runs a program of unannounced
factory visits to check on working conditions. Moreover, the international competitiveness of
its export industries - garment and tourism - is being undermined by high transaction costs and
the potential for diversifying the economy into other sectors as agro-industry and assembly is
correspondingly limited.
PR China
Cambodia 2007 2008 ± in %
Population (mid-year) 13,995,904 14,241,640 +1.8%
Garment Factories 290 260 -10.3%
Apparel Workforce 361,900 330,000 -8.8%
Textile & Clothing Exports US$2.89 billion US$2.80 billion -3.2%
PR China 2007 2008 ± in %
Cotton Production 8,056,000 t 7,795,000 t -3.2%
Cotton Consumption 11,213,000 t 9,907,000 t -11.6%
Wool Consumption 421,800 t n/a n/a
Manmade Fiber Output 22.88 million t 23.45 million t +2.5%
Spun Yarn Output 20.0 million t 21.5 million t +7.5%
Short-Staple Spindles 99.0 million 104.4 million +5.5%
Open End Rotors 2.04 million 2.12 million +4.0%
Population (mid-year) 1,321,851,888 1,330,044,605 +0.6%
National Trade Balance US$262.2 billion US$295.5 billion +12.7%
Foreign Direct Investment US$74.8 billion US$92.4 billion +23.6%
FOREX Reserves US$1,528.2 billion US$1,946.0 billion +27.3%
Textile & Clothing Exports US$171.2 billion US$185.2 billion +8.2%

56 The Fiber Year 2008/09
Softening demand for Chinese exports and policy tightening by the authorities have trimmed
economic growth from 11.9% in 2007 to 9.1% last year. However, foreign direct investment rose
23.6% to a record US$92.4 billion. Outbound investment jumped 63.6% to US$40.7 billion,
with mergers and acquisitions accounting for half of that. Foreign investments proceed target-
oriented to upgrade Chinese industrial and strategic positions in global competition and to earn
financial returns from large multinational companies. A considerable portion also focusses on
energy and resource projects to secure the nation’s growing demand for power and raw materials.
The Chinese foreign exchange reserves have jumped to No.1 in the world at US$1,946 billion at
the end of 2008. The reserves grew, especially between 2002 and 2008 on average of US$247.7
billion per year, as a consequence of the accession to the WTO in 2001.
The appreciation of the Chinese currency against the U.S. Dollar and weaker economic growth
in industrial countries damped exports, as did a reduction in tax rebates on exports in the first
half of 2008. However, tax rebates on textile and garment exports have been lifted several times
in the second half after the clothing industry has witnessed an impressive wave of bankruptcies
and layoffs. Exports reached a new record high in trade surplus of US$295 billion, of which
textile and apparel exports accounted for almost 57%. Although the growth rate in exports of
textiles and clothing was the slowest in seven years, a total of US$185 billion was shipped
abroad.
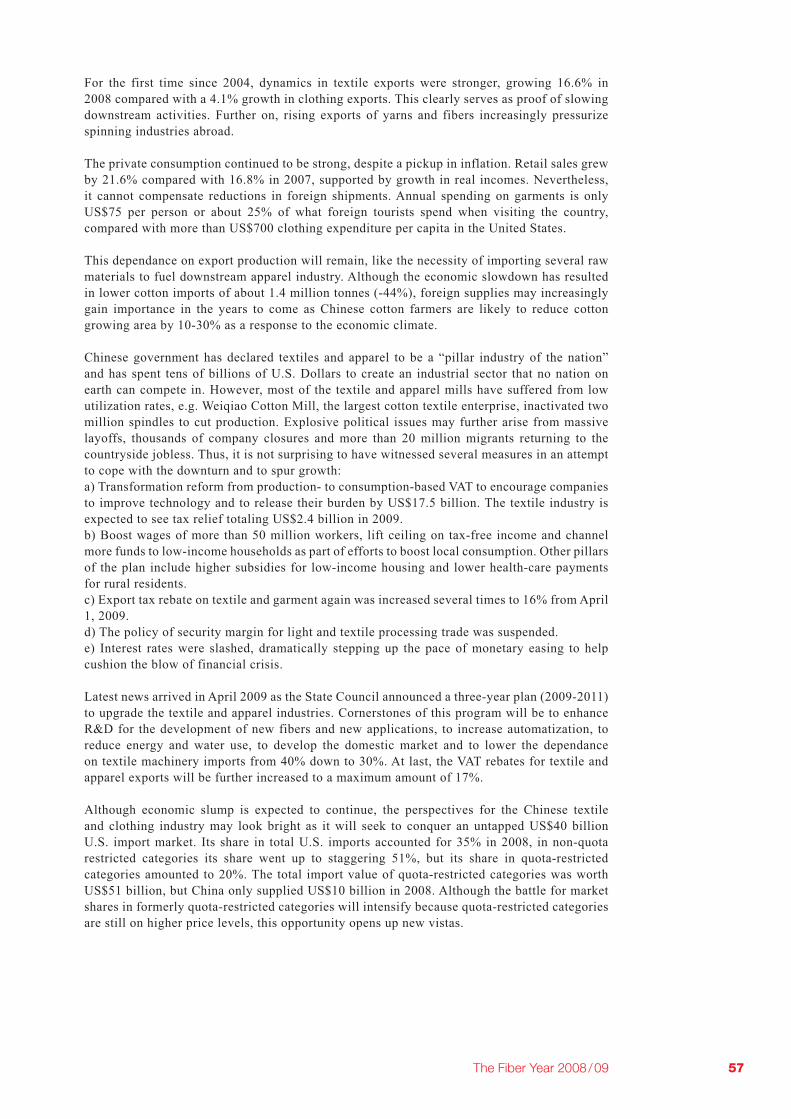
57The Fiber Year 2008/09
For the first time since 2004, dynamics in textile exports were stronger, growing 16.6% in
2008 compared with a 4.1% growth in clothing exports. This clearly serves as proof of slowing
downstream activities. Further on, rising exports of yarns and fibers increasingly pressurize
spinning industries abroad.
The private consumption continued to be strong, despite a pickup in inflation. Retail sales grew
by 21.6% compared with 16.8% in 2007, supported by growth in real incomes. Nevertheless,
it cannot compensate reductions in foreign shipments. Annual spending on garments is only
US$75 per person or about 25% of what foreign tourists spend when visiting the country,
compared with more than US$700 clothing expenditure per capita in the United States.
This dependance on export production will remain, like the necessity of importing several raw
materials to fuel downstream apparel industry. Although the economic slowdown has resulted
in lower cotton imports of about 1.4 million tonnes (-44%), foreign supplies may increasingly
gain importance in the years to come as Chinese cotton farmers are likely to reduce cotton
growing area by 10-30% as a response to the economic climate.
Chinese government has declared textiles and apparel to be a “pillar industry of the nation”
and has spent tens of billions of U.S. Dollars to create an industrial sector that no nation on
earth can compete in. However, most of the textile and apparel mills have suffered from low
utilization rates, e.g. Weiqiao Cotton Mill, the largest cotton textile enterprise, inactivated two
million spindles to cut production. Explosive political issues may further arise from massive
layoffs, thousands of company closures and more than 20 million migrants returning to the
countryside jobless. Thus, it is not surprising to have witnessed several measures in an attempt
to cope with the downturn and to spur growth:
a) Transformation reform from production- to consumption-based VAT to encourage companies
to improve technology and to release their burden by US$17.5 billion. The textile industry is
expected to see tax relief totaling US$2.4 billion in 2009.
b) Boost wages of more than 50 million workers, lift ceiling on tax-free income and channel
more funds to low-income households as part of efforts to boost local consumption. Other pillars
of the plan include higher subsidies for low-income housing and lower health-care payments
for rural residents.
c) Export tax rebate on textile and garment again was increased several times to 16% from April
1, 2009.
d) The policy of security margin for light and textile processing trade was suspended.
e) Interest rates were slashed, dramatically stepping up the pace of monetary easing to help
cushion the blow of financial crisis.
Latest news arrived in April 2009 as the State Council announced a three-year plan (2009-2011)
to upgrade the textile and apparel industries. Cornerstones of this program will be to enhance
R&D for the development of new fibers and new applications, to increase automatization, to
reduce energy and water use, to develop the domestic market and to lower the dependance
on textile machinery imports from 40% down to 30%. At last, the VAT rebates for textile and
apparel exports will be further increased to a maximum amount of 17%.
Although economic slump is expected to continue, the perspectives for the Chinese textile
and clothing industry may look bright as it will seek to conquer an untapped US$40 billion
U.S. import market. Its share in total U.S. imports accounted for 35% in 2008, in non-quota
restricted categories its share went up to staggering 51%, but its share in quota-restricted
categories amounted to 20%. The total import value of quota-restricted categories was worth
US$51 billion, but China only supplied US$10 billion in 2008. Although the battle for market
shares in formerly quota-restricted categories will intensify because quota-restricted categories
are still on higher price levels, this opportunity opens up new vistas.

58 The Fiber Year 2008/09
India
India’s growth may slow to 7.1% in the fiscal year to March 2009, the weakest pace since
2003. Inflation is expected to ease to less than 3% by March on falling commodity prices.
Private consumption, which accounts for about 60% of the US$1.2 trillion economy, is holding
up – an indication that recovery in India might be faster than in other countries. However, the
country has become increasingly vulnerable to economic slowdowns in other countries as trade
represents about 35% of gross domestic product. In addition, half the population is under the
age of 25, which represents a tremendous potential for considerable demographic and economic
growth.
The textile industry is strong in the conventional fiber-to-garment sectors with a surplus cotton
balance and the world’s largest polyester producer is domiciled in the country. The total output
of spun yarns and manmade fibers amounted to 6.5 million tonnes, consolidating its second
position in world textile industry. While spun yarn output was quite stable at 4.0 million tonnes,
manmade fibers declined, in particular due to losses in the polyester and viscose sector. This
industry plays a vital role in the local economy, constituting 4% of GDP, employing about 90
million people in textile and allied sectors, and exports account for about 20% of the country’s
total foreign revenues.
India 2007 2008 ± in %
Cotton Production 5,306,000 t 5,008,000 t -5.6%
Cotton Consumption 3,984,000 t 3,701,000 t -7.1%
Wool Consumption 128,200 t n/a n/a
Manmade Fiber Output 2.71 million t 2.50 million t -7.9%
Spun Yarn Output 3.96 million t 3.94 million t -0.7%
Short-Staple Spindles 38.88 million 41.22 million +6.0%
Open End Rotors 613.992 652.077 +6.2%
Population (mid-year) 1,129,866,154 1,147,995,898 +1.6%
Textile & Clothing Exports US$19.4 billion US$22.4 billion +15.3%
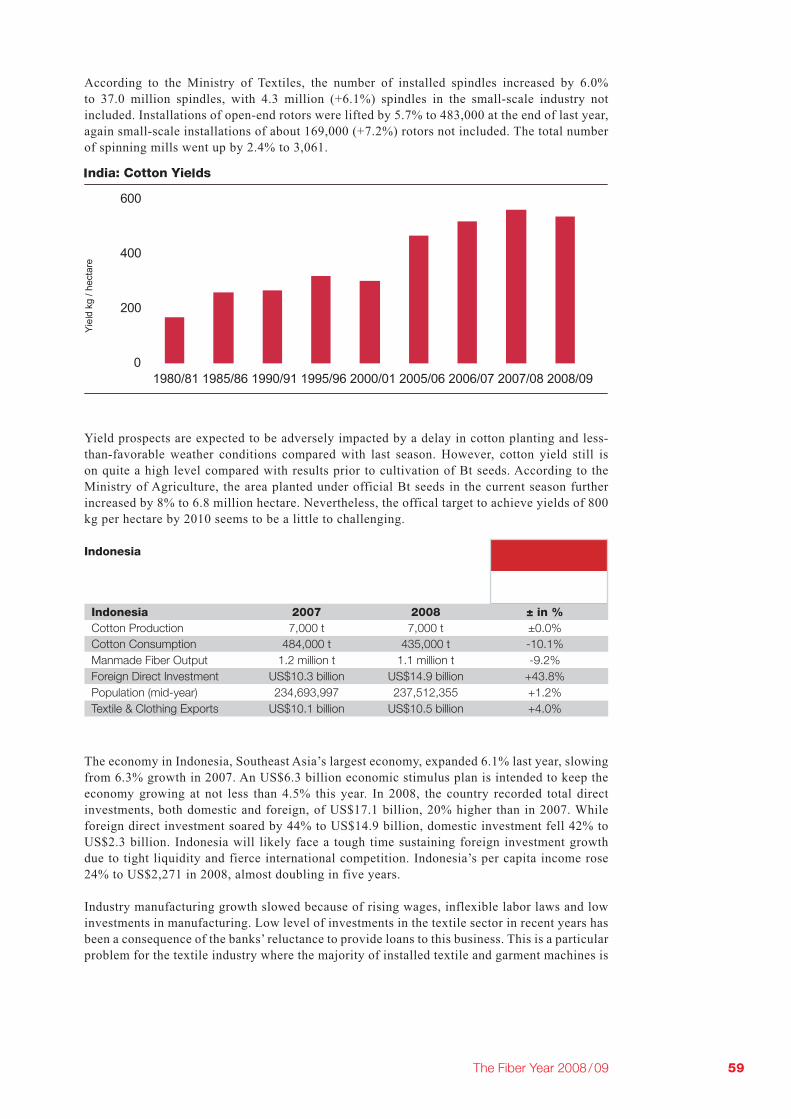
59The Fiber Year 2008/09
According to the Ministry of Textiles, the number of installed spindles increased by 6.0%
to 37.0 million spindles, with 4.3 million (+6.1%) spindles in the small-scale industry not
included. Installations of open-end rotors were lifted by 5.7% to 483,000 at the end of last year,
again small-scale installations of about 169,000 (+7.2%) rotors not included. The total number
of spinning mills went up by 2.4% to 3,061.
Yield prospects are expected to be adversely impacted by a delay in cotton planting and less-
than-favorable weather conditions compared with last season. However, cotton yield still is
on quite a high level compared with results prior to cultivation of Bt seeds. According to the
Ministry of Agriculture, the area planted under official Bt seeds in the current season further
increased by 8% to 6.8 million hectare. Nevertheless, the offical target to achieve yields of 800
kg per hectare by 2010 seems to be a little to challenging.
Indonesia
The economy in Indonesia, Southeast Asia’s largest economy, expanded 6.1% last year, slowing
from 6.3% growth in 2007. An US$6.3 billion economic stimulus plan is intended to keep the
economy growing at not less than 4.5% this year. In 2008, the country recorded total direct
investments, both domestic and foreign, of US$17.1 billion, 20% higher than in 2007. While
foreign direct investment soared by 44% to US$14.9 billion, domestic investment fell 42% to
US$2.3 billion. Indonesia will likely face a tough time sustaining foreign investment growth
due to tight liquidity and fierce international competition. Indonesia’s per capita income rose
24% to US$2,271 in 2008, almost doubling in five years.
Industry manufacturing growth slowed because of rising wages, inflexible labor laws and low
investments in manufacturing. Low level of investments in the textile sector in recent years has
been a consequence of the banks’ reluctance to provide loans to this business. This is a particular
problem for the textile industry where the majority of installed textile and garment machines is
Indonesia 2007 2008 ± in %
Cotton Production 7,000 t 7,000 t ±0.0%
Cotton Consumption 484,000 t 435,000 t -10.1%
Manmade Fiber Output 1.2 million t 1.1 million t -9.2%
Foreign Direct Investment US$10.3 billion US$14.9 billion +43.8%
Population (mid-year) 234,693,997 237,512,355 +1.2%
Textile & Clothing Exports US$10.1 billion US$10.5 billion +4.0%
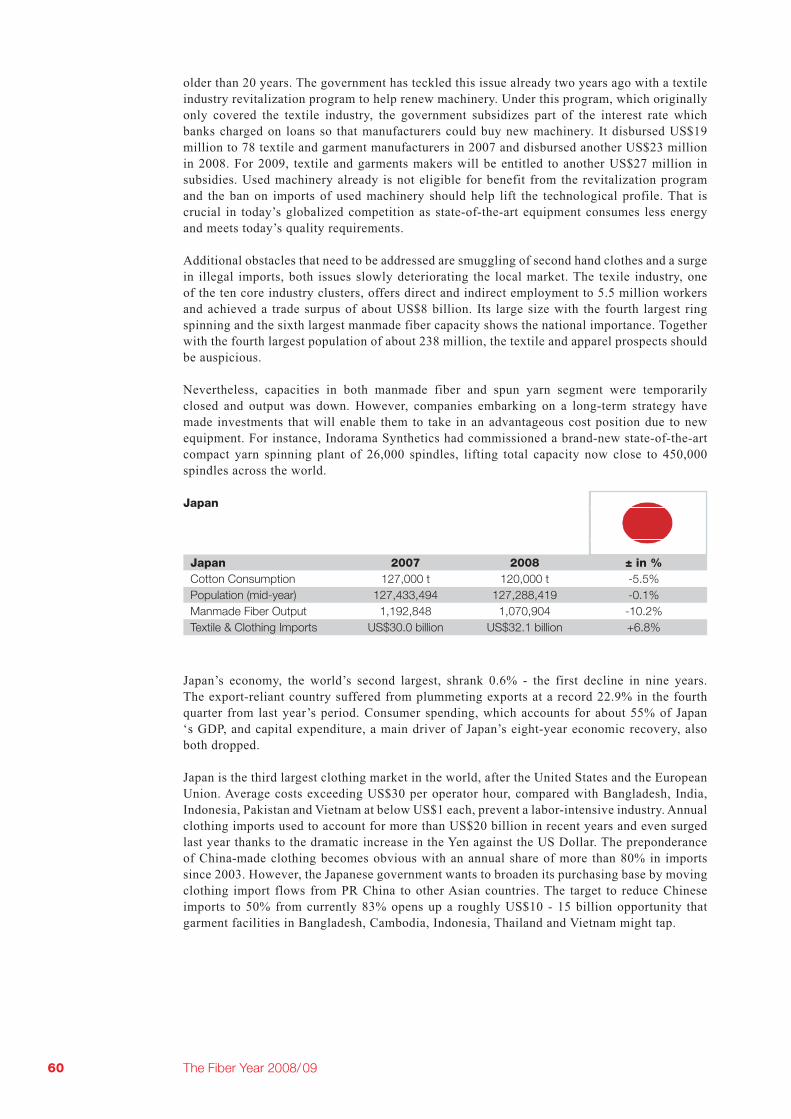
60 The Fiber Year 2008/09
older than 20 years. The government has teckled this issue already two years ago with a textile
industry revitalization program to help renew machinery. Under this program, which originally
only covered the textile industry, the government subsidizes part of the interest rate which
banks charged on loans so that manufacturers could buy new machinery. It disbursed US$19
million to 78 textile and garment manufacturers in 2007 and disbursed another US$23 million
in 2008. For 2009, textile and garments makers will be entitled to another US$27 million in
subsidies. Used machinery already is not eligible for benefit from the revitalization program
and the ban on imports of used machinery should help lift the technological profile. That is
crucial in today’s globalized competition as state-of-the-art equipment consumes less energy
and meets today’s quality requirements.
Additional obstacles that need to be addressed are smuggling of second hand clothes and a surge
in illegal imports, both issues slowly deteriorating the local market. The texile industry, one
of the ten core industry clusters, offers direct and indirect employment to 5.5 million workers
and achieved a trade surpus of about US$8 billion. Its large size with the fourth largest ring
spinning and the sixth largest manmade fiber capacity shows the national importance. Together
with the fourth largest population of about 238 million, the textile and apparel prospects should
be auspicious.
Nevertheless, capacities in both manmade fiber and spun yarn segment were temporarily
closed and output was down. However, companies embarking on a long-term strategy have
made investments that will enable them to take in an advantageous cost position due to new
equipment. For instance, Indorama Synthetics had commissioned a brand-new state-of-the-art
compact yarn spinning plant of 26,000 spindles, lifting total capacity now close to 450,000
spindles across the world.
Japan
Japan’s economy, the world’s second largest, shrank 0.6% - the first decline in nine years.
The export-reliant country suffered from plummeting exports at a record 22.9% in the fourth
quarter from last year’s period. Consumer spending, which accounts for about 55% of Japan
‘s GDP, and capital expenditure, a main driver of Japan’s eight-year economic recovery, also
both dropped.
Japan is the third largest clothing market in the world, after the United States and the European
Union. Average costs exceeding US$30 per operator hour, compared with Bangladesh, India,
Indonesia, Pakistan and Vietnam at below US$1 each, prevent a labor-intensive industry. Annual
clothing imports used to account for more than US$20 billion in recent years and even surged
last year thanks to the dramatic increase in the Yen against the US Dollar. The preponderance
of China-made clothing becomes obvious with an annual share of more than 80% in imports
since 2003. However, the Japanese government wants to broaden its purchasing base by moving
clothing import flows from PR China to other Asian countries. The target to reduce Chinese
imports to 50% from currently 83% opens up a roughly US$10 - 15 billion opportunity that
garment facilities in Bangladesh, Cambodia, Indonesia, Thailand and Vietnam might tap.
Japan 2007 2008 ± in %
Cotton Consumption 127,000 t 120,000 t -5.5%
Population (mid-year) 127,433,494 127,288,419 -0.1%
Manmade Fiber Output 1,192,848 1,070,904 -10.2%
Textile & Clothing Imports US$30.0 billion US$32.1 billion +6.8%

61The Fiber Year 2008/09
In the light of the severe economic recession, selective trade agreements with duty-free clothing
imports may be instrumental to ease the price pressure. Definitely those agreements appear
to be more straightforward than the increasing use of so-called safeguard actions and anti-
dumping tariffs. Nevertheless, all kinds of trade sanctions, while imposing textile quotas is now
against WTO rules, seem to be contrary to the idea of free trade. A mandatory precondition for
free trade is fair trade like Joe Biden, the U.S. Vice President, mentioned during the election
campaign in October 2008 in North Carolina. In consequence, as long as unfair trade and
competition still prevails, the vision of a free evolvement of market forces will not come true.
Korea
South Korea’s economy grew 2.7% in 2008, the weakest pace since 1999. The country relies
largely on exports, which accounted for 63.5% of GDP in 2008. Total year’s exports rose
13.8%, but the global economic slowdown has already led to a significant decline in the fourth
quarter. On the other hand, the country’s need to import nearly all its energy, making it the
world’s fifth largest crude oil buyer, has resulted in soaring imports in value terms following
the surging crude oil prices. This has already turned the 2007 trade surplus of US$14.6 billion
into a deficit of US$12.8 billion in 2008. Additionally, consumers have lost confidence amid
rising unemployment and inflation, while falling stock and property prices have reduced the
wealth of households.
As the country does not grow cotton, imports of raw cotton as well as cotton yarn imports give
information about the condition of the downstream garmenting industry.
2007 2008 ± in %
Cotton Consumption 218,000 t 191,000 t -12.4%
Spindles & Rotors 1,177,260 1,135,204 -3.6%
Manmade Fiber Output 1.53 million t 1.40 million t -9.0%
Balance of Trade +US$14.6 billion -US$12.8 billion
Population (mid-year) 48,250,148 48,379,392 +0.3%
Textile & Clothing Exports US$12.3 billion US$11.7 billion -4.9%
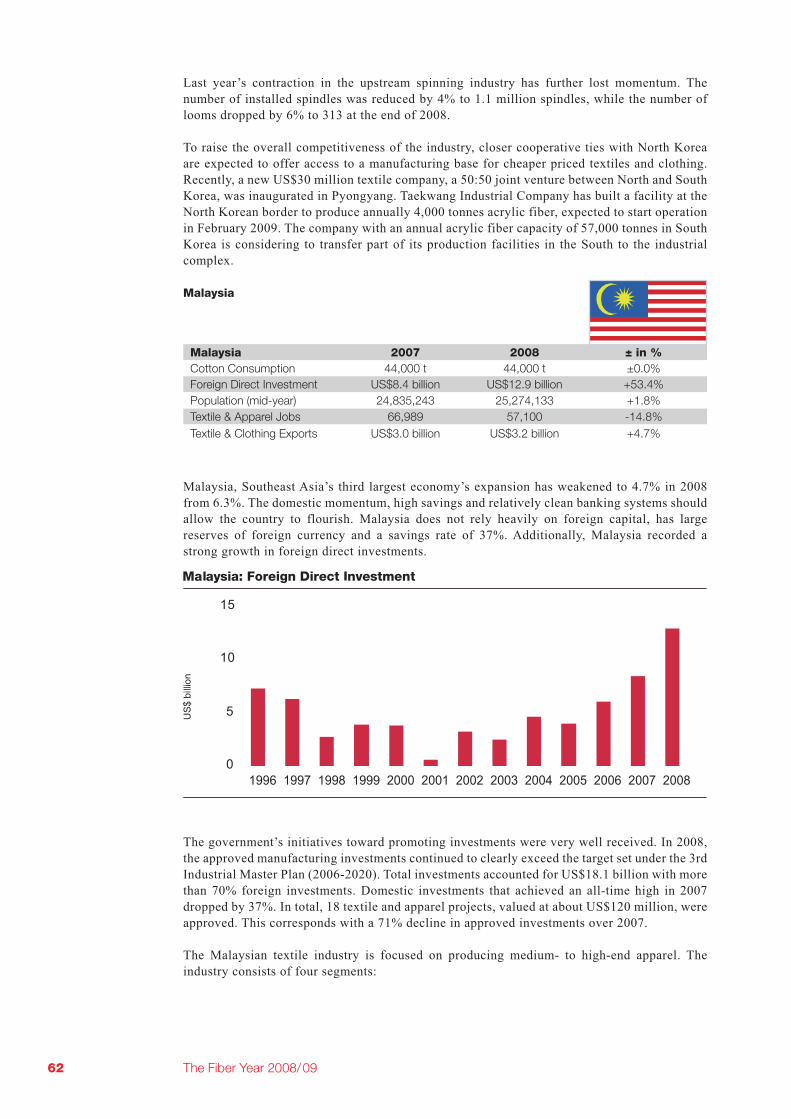
62 The Fiber Year 2008/09
Last year’s contraction in the upstream spinning industry has further lost momentum. The
number of installed spindles was reduced by 4% to 1.1 million spindles, while the number of
looms dropped by 6% to 313 at the end of 2008.
To raise the overall competitiveness of the industry, closer cooperative ties with North Korea
are expected to offer access to a manufacturing base for cheaper priced textiles and clothing.
Recently, a new US$30 million textile company, a 50:50 joint venture between North and South
Korea, was inaugurated in Pyongyang. Taekwang Industrial Company has built a facility at the
North Korean border to produce annually 4,000 tonnes acrylic fiber, expected to start operation
in February 2009. The company with an annual acrylic fiber capacity of 57,000 tonnes in South
Korea is considering to transfer part of its production facilities in the South to the industrial
complex.
Malaysia
Malaysia, Southeast Asia’s third largest economy’s expansion has weakened to 4.7% in 2008
from 6.3%. The domestic momentum, high savings and relatively clean banking systems should
allow the country to flourish. Malaysia does not rely heavily on foreign capital, has large
reserves of foreign currency and a savings rate of 37%. Additionally, Malaysia recorded a
strong growth in foreign direct investments.
The government’s initiatives toward promoting investments were very well received. In 2008,
the approved manufacturing investments continued to clearly exceed the target set under the 3rd
Industrial Master Plan (2006-2020). Total investments accounted for US$18.1 billion with more
than 70% foreign investments. Domestic investments that achieved an all-time high in 2007
dropped by 37%. In total, 18 textile and apparel projects, valued at about US$120 million, were
approved. This corresponds with a 71% decline in approved investments over 2007.
The Malaysian textile industry is focused on producing medium- to high-end apparel. The
industry consists of four segments:
Malaysia 2007 2008 ± in %
Cotton Consumption 44,000 t 44,000 t ±0.0%
Foreign Direct Investment US$8.4 billion US$12.9 billion +53.4%
Population (mid-year) 24,835,243 25,274,133 +1.8%
Textile & Apparel Jobs 66,989 57,100 -14.8%
Textile & Clothing Exports US$3.0 billion US$3.2 billion +4.7%

63The Fiber Year 2008/09
- primary textiles (polymerisation, spinning, weaving, knitting and wet processing),
- made-up textiles,
- made-up garments and
- textiles and clothing accessories.
A total of 662 companies is involved in the four segments. In addition, about 1,000 small
textiles and apparel companies, which are exempted from having to obtain manufacturing
licences, are in operation. They are mostly involved in made-up garment manufacturing. Textile
and clothing exports accounted for about 1.5% of Malaysia’s total exports of US$190 billion in
2008. The industry presently employs nearly 60,000 workers. The production index for textiles
and clothing has continued to decline from 90% in 2006 (2000 = 100%) to 80% in 2007 and
77% last year. While spun yarn production went down 2.9%, the output of manmade fibers rose
by 7.0%.
The export-driven industry weathered the current economic turmoil superbly despite a 7.5%
decline in shipments to the United States at US$666 million and a 9.3% drop in deliveries to
Turkey. To some extent, brisk domestic sales have helped the textile industry to compensate the
shortfall in main export markets. The industry’s practice of six-month forward-buying has not
yet affected the domestic industry. However, the downturn triggered by the crisis is expected to
take a turn for the worse in 2009.
A competitive disadvantage for the Malaysian textile industry is its minor contribution to the
country’s exports. Therefore, the domestic textile and apparel industry will most likely only
fractionally benefit from the US$18.1 billion - equivalent to 10% of one year’s gross domestic
product - economic stimulus package that Malaysia’s government unveiled in November 2008
and March 2009. To reduce the cost of doing business, the government has exempted levy
payments to the Human Resources Development Fund for six months for workers in the textile
industry with effect from February 1.
Pakistan
Pakistan’s GDP growth rate in 2008 was about 4.7%. Inflation jumped up to over 20% during
2008 from 8.8% in December 2007. As result of political and economic instability, the value of
Pakistani rupee has depreciated. The country faces an economic crisis and the government has
just started to implement reforms on petroleum and power prices, tightening monetary policy
and controlling expenditures.
Pakistan’s farm sector, accounting for a quarter of the economy, has developed at the disadvantage
of cotton. Current season’s cotton harvested area is 8% less than the earlier forecast at 2.8 million
hectares due to substitution to rice and corn. Unfavorable weather conditions and pest attack
have also adversely affected cotton productivity. In total, the governmental cotton production
target of 2.4 million tonnes will be clearly missed.
Additionally, Pakistani farmers are losing estimated US$770 million annually on unnecessary
pesticide spray on cotton cultivated from normal cotton seed and are losing their competitive
edge to Indian cotton farmers growing Bt cotton which requires less pesticide. Furthermore,
Pakistan 2007 2008 ± in %
Cotton Production 1,938,000 t 1,960,000 t +1.1%
Cotton Consumption 2,722,000 t 2,504,000 t -8.0%
Cotton Yarn Exports 680,188 t 524,470 t -22.9%
Population (mid-year) 169,340,538 172,800,051 +2.0%
Balance of Trade -US$15.2 billion -US$14.0 billion +7.8%
Textile & Clothing Exports US$11.2 billion US$10.9 billion -2.7%

64 The Fiber Year 2008/09
60% of the current crop cotton are believed to be planted to illegal Bt cotton varieties or rather
to spurious seeds marketed under the name of Bt cotton.
In consequence, Pakistan is a net importer of extra long staple and medium long staple cotton
from the United States and, in general, of better grades of cotton. Actual season’s drop in
imports by 40% to 544,000 tonnes has its reason in falling textile and clothing demand. The
spinning sector, mainstay of Pakistan’s textiles, has been suffering from declining yarn sales
and rising production costs. Cotton yarn exports fell 23% in volume terms and 16% in value
terms at US$1.2 billion. Out of 450 spinning mills, 100 were closed and about 300 operated on
loss.
Taiwan
Taiwan’s economy just managed to stay on positive territory by growing 0.1% in 2008.
The worsening balance of trade mainly results from slowing exports. Private consumption
expenditure as well as private investments already turned negative during 2008.
Last year’s industrial production index showed a decline along the textile value chain. The textile
industry ended with a 18.0% lower volume of 2.1 million tonnes manmade fibers produced
and 174,000 tonnes cotton locally consumed. Textile production was confronted with a steep
drop of 30%, adjusting its output to the steadily declining apparel production. Consequentially,
textile and clothing exports declined by 7.9% to US$11.7 billion, now accounting for 3.3% of
Taiwan’s total exports.
Taiwan 2007 2008 ± in %
Cotton Consumption 223,000 t 174,000 t -22.0%
Population (mid-year) 22,858,872 22,920,946 +0.3%
Balance of Trade US$27.4 billion US$14.8 billion -45.9%
Manmade Fiber Output 2,591,764 t 2,108,630 t -18.6%
Textile & Clothing Exports US$12.7 billion US$11.7 billion -7.9%

65The Fiber Year 2008/09
Taiwan’s textile industry used to be a major foreign exchange earner, but growing competition
has forced several textile plants to relocate, where production costs are lower. Vietnam has
become an important production base for Taiwan’s textile industry. Tainan Spinning Co. has
520,000 spindles installed there.
Nevertheless, local textile manufacturers have been supported in an attempt to increase the
competitiveness against foreign textile companies. Taiwan Textile Federation, Taiwan`s largest
textile industry association, will invest US$8.3 million in four years to enhance the global
marketing partnerships with internationally renowned textile brands. The Taiwan Textile
Research Institute disclosed programs to strengthen Taiwan’s textile industry: (1) horizontal
integration of the entire textile industry, merging all of the related associations into one,
(2) vertical integration of the textile industry and (3) creating better designs and innovative
marketing schemes.
Given the high Taiwanese labor costs, the only promising direction seems to be manufacturing
of innovative and sophisticated textile products. Furthermore, with ecology and environmental
protection becoming increasingly popular, Taiwan should continue steadily increasing the
production of “green textile products”.
Thailand
Thailand, Southeast Asia’s second biggest economy, grew 3.0%. Renewed political uncertainties
and rising inflation have undercut consumption and investments in 2008. Despite higher labor
costs than most other suppliers in Asia, Thailand’s apparel industry resisted foreign competition
over the past four years. This may be a consequence of the steady upgrading of the local
industry towards high-end markets. Further on, the fall of the Baht helped in stimulating sales
while large availability of domestic textile materials remained a very strong advantage for Thai
Thailand 2007 2008 ± in %
Cotton Production 3,000 t 3,000 t ±0.0%
Cotton Consumption 425,000 t 392,000 t -7.8%
Manmade Fiber Output 919,300 t 847,500 t -7.8%
Population (mid-year) 65,068,149 65,493,298 +0.7%
Textile & Clothing Exports US$7.0 billion US$7.2 billion +2.4%
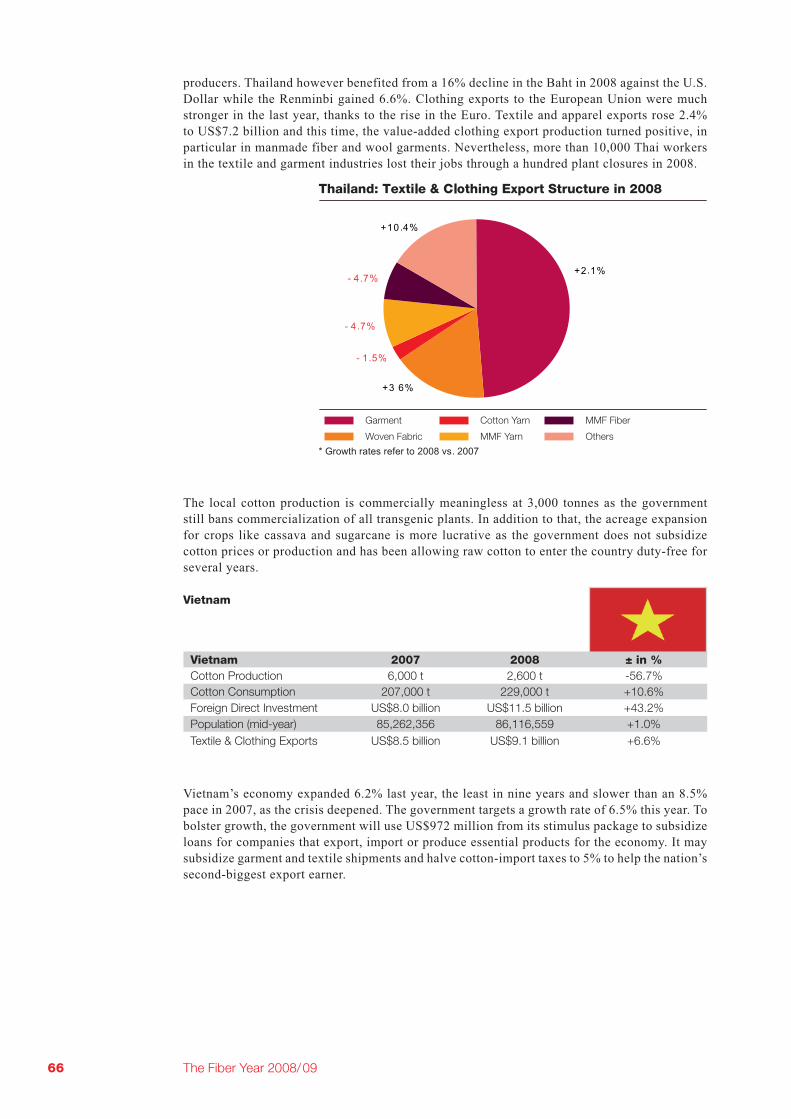
66 The Fiber Year 2008/09
producers. Thailand however benefited from a 16% decline in the Baht in 2008 against the U.S.
Dollar while the Renminbi gained 6.6%. Clothing exports to the European Union were much
stronger in the last year, thanks to the rise in the Euro. Textile and apparel exports rose 2.4%
to US$7.2 billion and this time, the value-added clothing export production turned positive, in
particular in manmade fiber and wool garments. Nevertheless, more than 10,000 Thai workers
in the textile and garment industries lost their jobs through a hundred plant closures in 2008.
The local cotton production is commercially meaningless at 3,000 tonnes as the government
still bans commercialization of all transgenic plants. In addition to that, the acreage expansion
for crops like cassava and sugarcane is more lucrative as the government does not subsidize
cotton prices or production and has been allowing raw cotton to enter the country duty-free for
several years.
Vietnam
Vietnam’s economy expanded 6.2% last year, the least in nine years and slower than an 8.5%
pace in 2007, as the crisis deepened. The government targets a growth rate of 6.5% this year. To
bolster growth, the government will use US$972 million from its stimulus package to subsidize
loans for companies that export, import or produce essential products for the economy. It may
subsidize garment and textile shipments and halve cotton-import taxes to 5% to help the nation’s
second-biggest export earner.
Vietnam 2007 2008 ± in %
Cotton Production 6,000 t 2,600 t -56.7%
Cotton Consumption 207,000 t 229,000 t +10.6%
Foreign Direct Investment US$8.0 billion US$11.5 billion +43.2%
Population (mid-year) 85,262,356 86,116,559 +1.0%
Textile & Clothing Exports US$8.5 billion US$9.1 billion +6.6%
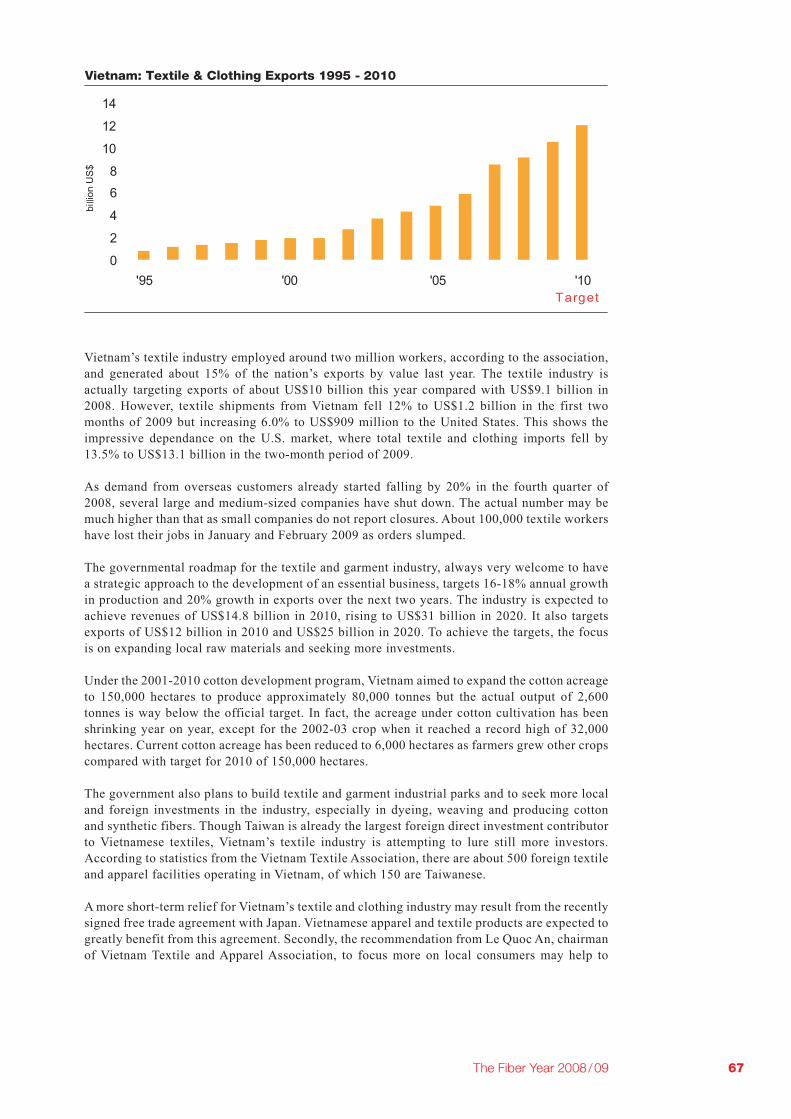
67The Fiber Year 2008/09
Vietnam’s textile industry employed around two million workers, according to the association,
and generated about 15% of the nation’s exports by value last year. The textile industry is
actually targeting exports of about US$10 billion this year compared with US$9.1 billion in
2008. However, textile shipments from Vietnam fell 12% to US$1.2 billion in the first two
months of 2009 but increasing 6.0% to US$909 million to the United States. This shows the
impressive dependance on the U.S. market, where total textile and clothing imports fell by
13.5% to US$13.1 billion in the two-month period of 2009.
As demand from overseas customers already started falling by 20% in the fourth quarter of
2008, several large and medium-sized companies have shut down. The actual number may be
much higher than that as small companies do not report closures. About 100,000 textile workers
have lost their jobs in January and February 2009 as orders slumped.
The governmental roadmap for the textile and garment industry, always very welcome to have
a strategic approach to the development of an essential business, targets 16-18% annual growth
in production and 20% growth in exports over the next two years. The industry is expected to
achieve revenues of US$14.8 billion in 2010, rising to US$31 billion in 2020. It also targets
exports of US$12 billion in 2010 and US$25 billion in 2020. To achieve the targets, the focus
is on expanding local raw materials and seeking more investments.
Under the 2001-2010 cotton development program, Vietnam aimed to expand the cotton acreage
to 150,000 hectares to produce approximately 80,000 tonnes but the actual output of 2,600
tonnes is way below the official target. In fact, the acreage under cotton cultivation has been
shrinking year on year, except for the 2002-03 crop when it reached a record high of 32,000
hectares. Current cotton acreage has been reduced to 6,000 hectares as farmers grew other crops
compared with target for 2010 of 150,000 hectares.
The government also plans to build textile and garment industrial parks and to seek more local
and foreign investments in the industry, especially in dyeing, weaving and producing cotton
and synthetic fibers. Though Taiwan is already the largest foreign direct investment contributor
to Vietnamese textiles, Vietnam’s textile industry is attempting to lure still more investors.
According to statistics from the Vietnam Textile Association, there are about 500 foreign textile
and apparel facilities operating in Vietnam, of which 150 are Taiwanese.
A more short-term relief for Vietnam’s textile and clothing industry may result from the recently
signed free trade agreement with Japan. Vietnamese apparel and textile products are expected to
greatly benefit from this agreement. Secondly, the recommendation from Le Quoc An, chairman
of Vietnam Textile and Apparel Association, to focus more on local consumers may help to

68 The Fiber Year 2008/09
cope with shrinking exports. The home market is attractive with a population of 86 million
people. Apparel accounted for 5% of the country’s US$45-billion retail market last year and the
market is forecast to grow to US$6 billion by 2010. According to a recent survey conducted by
Business Studies and Assistance Center, consumers in the 20 to 45 age group in Ho Chi Minh
City spend 18.5% of their income on clothes, compared with 11% the year before. Finally, from
a manufacturer’s point of view, producers can earn a higher profit by selling locally instead of
exporting apparel.
6.3 Greater Europe
Turkey
Turkey’s economy expanded 1.1% in 2008, bringing GDP per head to about US$10,400 in the
European Union membership candidate of 76 million. The unemployment rate of more than
13% reached a historic high as falling orders from home and abroad sparked massive job losses
in manufacturing. Inflation was strong at 10% at the end of 2008 and interest rates are at a very
high level. An agreement could be soon concluded with the International Monetary Fund (IMF)
to help weather the global crisis. At least, Turkish government and IMF have agreed in principle
on the conditions of a new loan deal worth up to US$45 billion.
The textile and apparel industry has been the backbone of the Turkish economy, accounting
for 8% of GDP, 16% of total industrial production and 11% of manufacturing jobs. Textile
and apparel exports account for 20% of total Turkish export earnings. There are an estimated
7 million spindles and 550,000 rotors in Turkey. Total textile sales are about US$50 billion,
of which half are exports. Total investments in the sector exceeded US$50 billion in the last
decade. At first sight, last year’s export performance was satisfying in the light of the global
economic slowdown. However, it is deceptive, as the crisis in the textile industry began way
before the global economic slowdown, generated by a low exchange rate combined with high
input costs and a high interest rate policy. Exports started declining already in the second half
of 2008 with textile and apparel exports falling more than 25% in December. At the same
time, clothing imports continued increasing. The 24% fall of the Lira in 2008 against the US
Dollar has among other things caused a slowdown in imports. The Turkish currency also lost
21% against the Euro and this should limit the current fall in exports. Additionally, slowing
apparel exports are also reflecting the current relocation of the Turkish clothing industry to
other countries in the region.
Greater Europe 2007 2008 ± in %
Cotton Production 2.8 million t 2.4 million t -15.0%
Cotton Consumption 2.4 million t 1.9 million t -18.9%
Wool Consumption 422.400 t n/a n/a
Turkey 2007 2008 ± in %
Cotton Production 675,000 t 501,000 t -25.8%
Cotton Consumption 1,306,000 t 1,023,000 t -21.7%
Wool Consumption 43,600 t n/a n/a
Foreign Direct Investment US$22.0 billion US$17.7 billion -19.6%
Population (mid-year) 74,767,836 75,793,836 +1.4%
Textile & Clothing Exports US$23.7 billion US$23.6 billion -0.3%

69The Fiber Year 2008/09
Consequence of such unfavorable circumstances was a dramatic number of company closures.
Reportedly, more than half the mills either seized operations or began working at a reduced
capacity. In addition to that, about 40 mills have either moved to low cost countries such as
Egypt or sold their machinery to other countries, such as India. Industry sources indicate that
more than 1 million spindles of spinning capacity have moved out of the country during the last
twelve months. Yarn producers were especially hard hit, partly due to surging imports in the
past years. Anti-dumping sanctions were taken to protect spun and filament yarn manufacturers
from competitors in Asia, but this could not prevent a sharp fall in production. Further on,
the steep decline in the planting area of 27%, the lowest cotton planting level since 1995,
has drastically lowered local availability of cotton. Better returns on corn and wheat, lack of
irrigation water, ecological problems and insufficient crop supports caused the decline. The
government plans to allocate about US$12 billion in five years and to irrigate a total of 1.7
million hectares of land. In an attempt to persuade farmers in the region to continue planting
cotton, the Agricultural Minister also announced that seed cotton will be under a production
bonus system until 2011. The chart below shows the dramatic crash with a reduction of cotton
use of 36% in just two years.
The government has presented an economic stimulus package in February 2009 to reduce some
corporate tax on investments by up to 90% and also cut taxes in textiles and retail apparel by
75% for a five-year period if they move their plants to certain cities. It has further imposed
registration requirements for textile and apparel imports. It seems questionable whether those
measures will result in a sustainable recovery.
Uzbekistan
Uzbekistan 2007 2008 ± in %
Cotton Production 1,124,700 t 1,174,200 t +4.4%
Cotton Exports 958,000 t 653,000 t -31.8%
Cotton Yarn Outpuut 152,000 136,100 -10.5%
Textile-related FDI US$87 milliom US$119 million +36.8%
Population (mid-year) 27,079,266 27,345,026 +1.0%

70 The Fiber Year 2008/09
Uzbekistan, producing a 9.0% growth of GDP last year, is the world’s sixth largest producer of
cotton with an output volume of 1.2 million tonnes in 2008, up 4.4%. Weather-related problems
and ongoing irrigation shortages have lowered yields and the need to increase production of
food crops in order to meet domestic demand will lead to a reduction of the cotton planted area
by 100,000 hectares to 1.315 million hectares in the current and next season.
Cotton represents 20% of the country’s exports and accounts for over 15% of its GDP. The fall
in current season’s cotton exports by 32% is partly related to the economic slowdown. More
essentially, it is result of the growing number of North American and European companies and
retailers that have taken measures to exclude Uzbek cotton from their merchandise because of
alleged abuse of children in the cotton fields.
Official reports state around 150 mills under Uzbekengilsanoat Association, representing more
than 90% of the country’s capacity and output. Of these mills, 90 are involved in the production
of yarn and woven cloth, a further 50 produce knitted garments, 12 manufacture ready-made
garments and 3 produce hosiery goods. Although current capacity allows for the production of
250,000 tonnes of yarn, 480 million sqm of fabric, 110 million pieces of knitted garments and
40 million pairs of hosiery, the current capacity utilization rate is much lower.
The Uzbek government has worked out a state program on development of textile industries
between 2007 and 2012 with a total of 79 projects worth US$615 million to help create about
36,200 new jobs and to produce 407,100 tonnes of cotton yarn by 2012. In 2007, over US$87
million of foreign investments were addressing the industry with 23 new companies coming
on-stream and creating some 10,000 new jobs. Last year, 25 new textile enterprises were
established with an annual capacity to produce 45,100 tonnes of cotton yarn, 22.8 million
units of clothing and knitwear as well as 2,400 tonnes of stockinet. The Uzbek state controlled
joint stock company, Uzbekengilsanoat International, will set up seven new greenfield spinning
mills with a combined annual capacity of 27,000 tonnes cotton yarn of various counts, when
fully operational in the next few years. Some Turkish manufacturers, forced by low exchange
plants to Uzbekistan as four factories that produce cloth and yarn in Bursa are up for sale. Even
a heavyweight in textiles like Japan’s Toray Industries has found out how the land lies to launch
a production of finished textile goods.

71The Fiber Year 2008/09
6.4 Africa
The industry is very much fragmented with the top five cotton producing countries – Burkina
Faso, Tanzania, Egypt, Nigeria and Benin - accounting for just half the continent’s total output.
Still some 70% of regional output is being exported, enabling other industries to improve value-
added production, although this would be of vital importance for those low income cotton
producing nations.
Burkina Faso
Burkina Faso is expected to rebound cotton production to 185,000 tonnes after an extremely
disappointing year in 2007/08. The cotton area will likely increase by 10% to 440,000 hectares
in the actual season. This may be result of the US$15 million subsidy on seed and fertilizer.
Additionally, the country has planted 8,000 hectares of Bt cotton in 2008/09.
Several African nations are forecast to significantly increase its current season’s cotton
production, such as Cameroon (+17% at 54,000 tonnes), Sudan (+71% at 41,000 tonnes),
Tanzania (+85% at 124,000 tonnes), Uganda (+70% at 22,000 tonnes) and Zambia (+35%).
However, the local cotton consumption is predicted to increase in not even a single African
country.
Although African cotton industries set goals to develop the textile industry, most of them
appear to be not realistic. These nations need to overcome a number of obstacles, like access to
technical and financial resources, abolition of direct subsidies to production provided in other
countries as well as improvement in research, yields, quality of seeds and fiber, logistics as well
as downstream textile chain.
Ethiopia
Ethiopia’s US$500 million target for textile and apparel exports has been postponed two years
as the ambitious projections are lagging way behind with exports amounting to less than US$15
million in 2007. Now, the authorities aim to achieve the export target by 2011. Ethiopia offers
a low cost production location but prior to setting up vertically integrated textile and garment
operations, it appears to be crucial to improve the quality of cotton spinning and textile mills
under the special guidance of the Ethiopian Textile and Garment Manufacturers’ Association.
However, an integrated Turkish textile group, Ayka Addis Textile and Investment Group, has
recently started-up its spinning mill with a capacity to process 20 tonnes of cotton per day.
Other Turkish investments are in the governmental focus. In total, the Ministry of Trade and
Africa 2007 2008 ± in %
Cotton Production 1.2 million t 1.2 million t +0.7%
Cotton Consumption 0.6 million t 0.6 million t -7.6%
Wool Consumption 73.600 t n/a n/a
Burkina Faso 2007 2008 ± in %
Cotton Production 147,000 t 185,000 t +25.9%
Cotton Consumption 1,000 t 1,000 t ±0.0%
Population (mid-year) 14,797,172 15,264,735 +3.6%

72 The Fiber Year 2008/09
Industry assumes that this goal requires investments of US$1.6 billion to install around 48 units
for spinning, approximately 31 for grey textile production, nearly 22 in knitted sector, 53 in
woven, 31 in garment and 6 for finished textile.
Tanzania
Tanzania is also in the process of developing and promoting the textile industry by inviting
investors to expand garment production. The program aims at doubling productivity of
seed cotton to 1,500 kg per hectare by 2010 and to 2,500 kg by 2015 compared to 300 kg at
present.
Zambia
Zambia, planning to diversify its economy away from copper mining, will award farm land to
foreign investors to improve agricultural production and reduce food shortages. It has created
two major farm blocs, each over 100,000 hectares in size for farmers to grow cash crops.
The project has however been hindered by delays in setting up the required infrastructure.
The Ministry of Trade and Industry is currently considering to impose additional duties on
imports of textile and clothing to help the ailing domestic sector. Just recently, the Zambia-
China Mulungushi Textiles Joint Venture Ltd. has been restarted. The textile company has
an annual capacity to produce 1,800 tonnes of cotton yarn, 17 million meters of fabrics and
100,000 units of garments. Over the years the mill went in to backward integration and also set
up cotton ginneries.
Egypt
Egypt’s economic recovery continued with an expansion of real GDP by 7.2% in 2007/08, the
fastest pace of growth in more than a decade. The country realized significant improvements
in various business segments, on the back of the reform program, initiated in 2004. Such
improvements created a better investment climate, attracting foreign investors to engage
in various projects, looking for lucrative margins realized from vast available investment
opportunities. This was reflected by the incline of inflows from foreign direct investment,
jumping by 36% to US$17.8 billion in 2007/08. Thus, Egypt has evolved into the leading
recipient country in Africa.
Egypt 2007 2008 ± in %
Cotton Production 218,000 t 114,000 t -47.7%
Cotton Consumption 207,000 t 174,000 t -15.9%
Cotton Exports 137,000 t 54,000 t -60.6%
Wool Consumption 6,500 t n/a n/a
Foreign Direct Investment US$13.1 billion US$17.8 billion +36.1%
Population (mid-year) 80,335,036 81,713,517 +1.7%

73The Fiber Year 2008/09
The year 2008 witnessed skyrocketing rates of inflation. The accelerated money supply in the
market, resulting from the encouraging investment climate, led to an increase in consumption,
which was not met by sufficient production levels, resulting in higher local prices. Inflation
rate reached its peak in August 2008, as it reached 23.6%, compared to 6.9% in December
2007. However, the latest inflation figures reflect a decline as inflation rate stood at 18.3% in
December 2008. This came as a result of the drops in international food and energy prices.
As more than half the 82 million population is younger than 25, Egypt needs a sustainable
growth to create jobs and lower the unemployment rate. A labor intensive apparel industry
could be beneficial but the 16% decline in cotton use is a clear indicator for the domestic
condition of the textile chain. It had lost competitiveness due to mostly operating on outdated
equipment and financial difficulties of textile companies. However, foreign investments in the
textile and apparel segment may help to lift the technological profile.
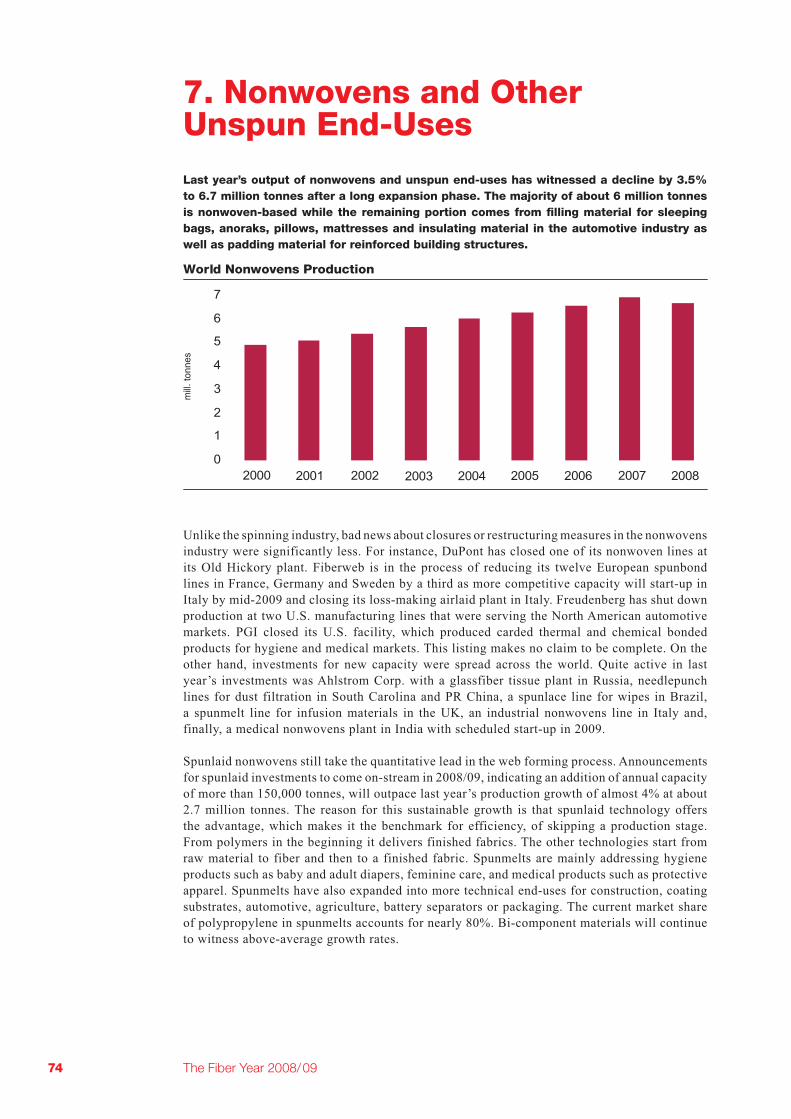
74 The Fiber Year 2008/09
7. Nonwovens and Other Unspun End-Uses
Last year’s output of nonwovens and unspun end-uses has witnessed a decline by 3.5%
to 6.7 million tonnes after a long expansion phase. The majority of about 6 million tonnes
well as padding material for reinforced building structures.
Unlike the spinning industry, bad news about closures or restructuring measures in the nonwovens
industry were significantly less. For instance, DuPont has closed one of its nonwoven lines at
its Old Hickory plant. Fiberweb is in the process of reducing its twelve European spunbond
lines in France, Germany and Sweden by a third as more competitive capacity will start-up in
Italy by mid-2009 and closing its loss-making airlaid plant in Italy. Freudenberg has shut down
production at two U.S. manufacturing lines that were serving the North American automotive
markets. PGI closed its U.S. facility, which produced carded thermal and chemical bonded
products for hygiene and medical markets. This listing makes no claim to be complete. On the
other hand, investments for new capacity were spread across the world. Quite active in last
year’s investments was Ahlstrom Corp. with a glassfiber tissue plant in Russia, needlepunch
lines for dust filtration in South Carolina and PR China, a spunlace line for wipes in Brazil,
a spunmelt line for infusion materials in the UK, an industrial nonwovens line in Italy and,
finally, a medical nonwovens plant in India with scheduled start-up in 2009.
Spunlaid nonwovens still take the quantitative lead in the web forming process. Announcements
for spunlaid investments to come on-stream in 2008/09, indicating an addition of annual capacity
of more than 150,000 tonnes, will outpace last year’s production growth of almost 4% at about
2.7 million tonnes. The reason for this sustainable growth is that spunlaid technology offers
the advantage, which makes it the benchmark for efficiency, of skipping a production stage.
From polymers in the beginning it delivers finished fabrics. The other technologies start from
raw material to fiber and then to a finished fabric. Spunmelts are mainly addressing hygiene
products such as baby and adult diapers, feminine care, and medical products such as protective
apparel. Spunmelts have also expanded into more technical end-uses for construction, coating
substrates, automotive, agriculture, battery separators or packaging. The current market share
of polypropylene in spunmelts accounts for nearly 80%. Bi-component materials will continue
to witness above-average growth rates.

75The Fiber Year 2008/09
The ongoing growth in this sector is being expressed by expanding spunlaid capacity as well as
retrofitting and upgrading existing spunlaid technology. While big-scale manufacturing nations
like PR China and the United States have enjoyed an ongoing flow of investments, Brazil and
Mexico were also in the focus from majors like Companhia Providencia, the largest nonwovens
producer in Latin America, and PGI that enjoyed the sixth consecutive year of revenue growth to
US$1.15 billion (+8.1%) in 2008. Fitesa, among the largest polypropylene nonwoven producers
in the world, will build a new US$120 million facility in South Carolina. In addition to that,
new capacity came on-stream in emergent medical and hygiene markets like Poland and Russia.
Finally, Ahlstrom has started up its new nonwovens line in the UK.
Carded nonwovens output was down by 2% to about 2.4 million tonnes. This technology with
four web forming processes has continuously lost market shares. The chart below illustrates
changes in this segment in favor of the spunlace process.
The spunlaced technology has continued to benefit from further growth in hygiene and
household wipes in Western Europe and North America due to its specific properties such as
soft hand and drapability. As new requirements in interior automotive products and filtration
had triggered considerable investments in 2007/08 around the globe, last year’s main challenge
was to maintain a continuous production process and optimize utilization rates. Consequently,
new investments were at quite low level. Anjani Non-wovens, an Indian nonwovens industry
newcomer, will start spunlace production mid-2009 to manufacture cotton pads and wipes
mainly for exports to Europe, Japan and the United States.
The traditional method of needlepunching is an eco-friendly technology, as it allows processing
any kind of recycled material like RPET fibers. The range of fibers comprises staple fibers
and continuous filaments, making needlepunching a very universal and flexible technology.
While needlepunched products have been experiencing a steady growth over the last decade,
thermal and resin bonded applications have developed below average. The largest market for
carded thermal bonded polypropylene nonwovens was cover stock. The shift from carded
fabrics towards spunbonded materials due to more cost-effective production for low weight
materials could not be compensated by developing new markets. In mid-2008, investments
for needlepunched nonwovens were completed in PR China, Denmark, Germany, Middle East
and the United States. While Fibertex Group in Denmark has replaced older equipment, a new
line for the industrial fabric production at Foss Manufacturing Co, one of the world’s largest
manufacturers of needlepunched nonwovens, went into service.

76 The Fiber Year 2008/09
The demand for airlaid nonwovens mainly used in wipes, hygiene products and absorber pads
for the food industry was slightly up to about 450,000 tonnes in 2008. All major manufacturers
were profitable after the industry has recovered from undamped capacity additions in the early
2000s. Despite a downsizing of Buckeye Technologies at its Canadian facility at the beginning
of last year, sales steadily increased until the October-December period when revenues fell
at a double-digit rate. This will lead to a reduction of planned capital spending by a third
this year. Furthermore, some new capacity came on-stream or is about to start-up. Concert
Industries Corp., a manufacturer of cellulose fiber-based airlaid products for hygienic end-uses
with manufacturing locations in Germany and Canada, will increase capacity at its German
plant. The investment of about US$80 million is expected to start-up in September 2009. Mid-
2008, Fiberweb (China) Airlaid Co. Ltd. has started operations at its Tianjin expansion project,
increasing total annual capacity in PR China by about two thirds to 26,000 tonnes. Finally,
Fibertex Group from Denmark has modernized its airlaid line in the Czech Republic in the
middle of last year.
Investments in the highly concentrated segment of wetlaids were less. The big players in this
industry are Ahlstrom Corp. and Hollingsworth & Vose Co., accounting for about half the world
production. The output remained static at about 230,000 tonnes in 2008. The main products are
tea bag and filter materials, medical barrier fabrics, speciality wipes, battery separators and
several other small-sized applications. As the technology is fairly mature, some end-uses have
been substituted by other nonwoven technologies.
The most dynamic technology has been spunlaid, taking in a 46% world market share. Carded
nonwovens have performed at significantly lower growth rates in the previous decade, now
accounting for a 42% share.

77The Fiber Year 2008/09

78 The Fiber Year 2008/09
Sectors covered by Oerlikon Textile business units Sectors covered by Oerlikon Texti

79The Fiber Year 2008/09
Textile business units with partners Sectors not covered by Oerlikon Textile business units

80 The Fiber Year 2008/09
World Fiber Use
Unit: ‘000 tonnes
* cotton, wool and silk included
Year Natural *Manmade
‘000 tonnesTOTAL
Population
billion
Consumption
kg / capita
2008 25,171 42,156 67,327 6.75 10.0
2007 28,012 44,161 72,173 6.64 10.9
2006 28,205 40,864 69,069 6.57 10.5
2005 26,641 39,512 66,153 6.49 10.2
2004 24,970 37,463 62,433 6.41 9.7
2003 22,672 35,228 57,900 6.34 9.1
2002 22,761 33,477 56,238 6.23 9.0
2001 21,941 31,595 53,536 6.15 8.7
2000 21,496 31,147 52,643 6.08 8.7
1999 21,266 29,400 50,666 6.00 8.4
1998 19,990 28,296 48,286 5.92 8.2
1997 20,189 27,523 47,712 5.85 8.2
1996 20,237 24,680 44,917 5.77 7.8
1995 19,600 23,594 43,194 5.69 7.6
1994 19,461 22,613 42,074 5.61 7.5
1993 19,631 20,765 40,396 5.53 7.3
1992 19,673 20,481 40,154 5.45 7.4
1991 19,740 19,738 39,478 5.37 7.4
1990 21,460 19,380 40,840 5.28 7.7
1989 21,409 18,944 40,353 5.20 7.8
1988 21,072 18,543 39,615 5.11 7.8
1987 20,638 17,864 38,502 5.02 7.7
1986 20,743 16,886 37,629 4.94 7.6
1985 17,732 16,259 33,991 4.85 7.0
1984 16,240 15,764 32,004 4.77 6.7
1983 15,705 14,850 30,555 4.69 6.5
1982 15,469 13,597 29,066 4.61 6.3
1981 15,189 14,631 29,820 4.53 6.6
1980 15,227 14,301 29,528 4.46 6.6
1975 13,349 10,677 24,026 4.09 5.9
1970 13,484 8,394 21,878 3.71 5.9
1965 13,401 5,486 18,887 3.35 5.6
1960 11,607 3,367 14,974 3.04 4.9
1950 7,723 1,681 9,404 2.56 3.7

81The Fiber Year 2008/09
Consumption of Natural Fibers
Unit: ‘000 tonnes
Year Cotton Wool Silk TOTAL ± in %
2008 23,907 1,164 100 25,171 -10.2%
2007 26,713 1,201 98 28,012 -0.7%
2006 26,875 1,232 98 28,205 5.9%
2005 25,328 1,216 97 26,641 6.7%
2004 23,658 1,214 98 24,970 10.1%
2003 21,344 1,231 97 22,672 -0.4%
2002 21,398 1,271 92 22,761 3.7%
2001 20,536 1,317 88 21,941 2.1%
2000 20,067 1,343 86 21,496 1.1%
1999 19,820 1,363 83 21,266 6.4%
1998 18,527 1,386 77 19,990 -1.0%
1997 18,690 1,424 75 20,189 -0.2%
1996 18,727 1,439 71 20,237 3.3%
1995 17,998 1,510 92 19,600 0.7%
1994 17,774 1,618 69 19,461 -0.9%
1993 17,885 1,678 68 19,631 -0.2%
1992 17,870 1,736 67 19,673 -0.3%
1991 17,745 1,928 67 19,740 -8.0%
1990 19,406 1,988 66 21,460 0.2%
1989 19,388 1,955 66 21,409 1.6%
1988 19,122 1,886 64 21,072 2.1%
1987 18,743 1,832 63 20,638 -0.5%
1986 18,891 1,789 63 20,743 17.0%
1985 15,929 1,744 59 17,732 9.2%
1984 14,440 1,744 56 16,240 3.4%
1983 13,993 1,657 55 15,705 1.5%
1982 13,782 1,632 55 15,469 1.8%
1981 13,516 1,616 57 15,189 -0.2%
1980 13,575 1,599 53 15,227 2.7%
1975 11,723 1,578 48 13,349 -0.2%
1970 11,784 1,659 41 13,484 0.1%
1965 11,884 1,484 33 13,401 2.9%
1960 10,113 1,463 31 11,607 4.2%
1950 6,647 1,057 19 7,723 n/a

82 The Fiber Year 2008/09
Production of Manmade Fibers
Year Cellulosics * Synthetics TOTAL
2008 3,339 -9.1% 38,817 -4.1% 42,156 -4.5%
2007 3,672 7.5% 40,489 8.1% 44,161 8.1%
2006 3,414 5.0% 37,450 3.3% 40,864 3.4%
2005 3,252 1.0% 36,260 5.9% 39,512 5.5%
2004 3,220 9.0% 34,243 6.1% 37,463 6.3%
2003 2,953 6.1% 32,275 5.2% 35,228 5.2%
2002 2,783 4.6% 30,694 6.1% 33,477 6.0%
2001 2,661 -3.5% 28,934 1.9% 31,595 1.4%
2000 2,758 6.9% 28,389 5.8% 31,147 5.9%
1999 2,579 -7.1% 26,821 5.1% 29,400 3.9%
1998 2,775 -3.6% 25,521 3.6% 28,296 2.8%
1997 2,879 0.3% 24,644 13.0% 27,523 11.5%
1996 2,870 -3.5% 21,810 5.8% 24,680 4.6%
1995 2,973 4.9% 20,621 4.3% 23,594 4.3%
1994 2,834 3.3% 19,779 9.7% 22,613 8.9%
1993 2,743 -1.6% 18,022 1.9% 20,765 1.4%
1992 2,788 -4.7% 17,693 5.2% 20,481 3.8%
1991 2,924 -8.3% 16,814 3.8% 19,738 1.8%
1990 3,189 -4.6% 16,191 3.8% 19,380 2.3%
1989 3,342 -0.9% 15,602 2.8% 18,944 2.2%
1988 3,371 2.6% 15,172 4.1% 18,543 3.8%
1987 3,286 1.4% 14,578 6.8% 17,864 5.8%
1986 3,241 0.2% 13,645 4.8% 16,886 3.9%
1985 3,234 -4.5% 13,025 5.2% 16,259 3.1%
1984 3,387 2.3% 12,377 7.3% 15,764 6.2%
1983 3,310 3.6% 11,540 10.9% 14,850 9.2%
1982 3,194 -7.8% 10,403 -6.8% 13,597 -7.1%
1981 3,464 -1.6% 11,167 3.6% 14,631 2.3%
1980 3,522 1.8% 10,779 7.7% 14,301 6.0%
1975 3,216 -2.2% 7,461 9.2% 10,677 4.9%
1970 3,585 1.0% 4,809 18.7% 8,394 8.9%
1965 3,446 5.3% 2,040 23.7% 5,486 10.3%
1960 2,664 5.2% 703 58.6% 3,367 14.9%
1950 1.611 n/a 70 n/a 1,681 n/a
Unit: ‘000 tonnes
* since 2002 with Tencel® included

83The Fiber Year 2008/09
Global Fiber Consumption
Unit: ‘000 tonnes
Year Cotton Wool Synthetics Cellulosics TOTAL
1960 68% 10% 5% 18% 14,974
1970 54% 8% 22% 16% 21,878
1975 49% 7% 31% 13% 24,026
1980 46% 5% 37% 12% 29,528
1985 47% 5% 38% 10% 33,991
1986 50% 5% 36% 9% 37,629
1987 49% 5% 38% 9% 38,502
1988 48% 5% 38% 9% 39,615
1989 48% 5% 39% 8% 40,353
1990 48% 5% 40% 8% 40,840
1991 45% 5% 43% 7% 39,478
1992 45% 4% 44% 7% 40,154
1993 44% 4% 45% 7% 40,396
1994 42% 4% 47% 7% 42,074
1995 42% 3% 48% 7% 43,194
1996 42% 3% 49% 6% 44,917
1997 39% 3% 52% 6% 47,712
1998 38% 3% 53% 6% 48,286
1999 39% 3% 53% 5% 50,666
2000 38% 3% 54% 5% 52,643
2001 38% 2% 54% 5% 53,536
2002 38% 2% 55% 5% 56,238
2003 37% 2% 56% 5% 57,900
2004 38% 2% 55% 5% 62,433
2005 38% 2% 55% 5% 66,153
2006 39% 2% 54% 5% 69,069
2007 37% 2% 56% 5% 72,173
2008 36% 2% 58% 5% 67,327

84 The Fiber Year 2008/09
Production of Manmade Fibers
Cellulosics * Synthetics
Year Filament Staple TOTAL Filament Staple TOTAL
2008 370 2,969 3,339 23,509 15,308 38,817
2007 448 3,224 3,672 24,122 16,367 40,489
2006 448 2,966 3,414 21,814 15,636 37,450
2005 456 2,796 3,252 20,947 15,313 36,260
2004 482 2,738 3,220 19,639 14,604 34,243
2003 474 2,479 2,953 18,393 13,882 32,275
2002 463 2,320 2,783 17,368 13,326 30,694
2001 480 2,181 2,661 16,334 12,600 28,934
2000 533 2,225 2,758 15,995 12,394 28,389
1999 527 2,052 2,579 15,040 11,781 26,821
1998 581 2,194 2,775 14,141 11,380 25,521
1997 611 2,268 2,879 13,235 11,409 24,644
1996 640 2,230 2,870 11,594 10,216 21,810
1995 654 2,319 2,973 10,903 9,718 20,621
1994 630 2,204 2,834 9,957 9,822 19,779
1993 652 2,091 2,743 8,925 9,097 18,022
1992 695 2,093 2,788 8,577 9,116 17,693
1991 759 2,165 2,924 8,025 8,789 16,814
1990 837 2,352 3,189 7,637 8,554 16,191
1989 927 2,415 3,342 7,156 8,446 15,602
1988 950 2,421 3,371 6,855 8,317 15,172
1987 915 2,371 3,286 6,436 8,142 14,578
1986 934 2,307 3,241 6,026 7,619 13,645
1985 933 2,301 3,234 5,792 7,233 13,025
1984 959 2,428 3,387 5,444 6,933 12,377
1983 983 2,327 3,310 5,065 6,475 11,540
1982 967 2,227 3,194 4,612 5,791 10,403
1981 1,053 2,411 3,464 4,986 6,181 11,167
1980 1,130 2,392 3,522 4,854 5,925 10,779
1975 1,148 2,068 3,216 3,790 3,671 7,461
1970 1,391 2,194 3,585 2,398 2,411 4,809
1965 1,372 2,074 3,446 1,124 916 2,040
1960 1,131 1,533 2,664 417 286 703
1950 872 739 1,611 54 16 70
Unit: ‘000 tonnes
* since 2002 with Tencel® included
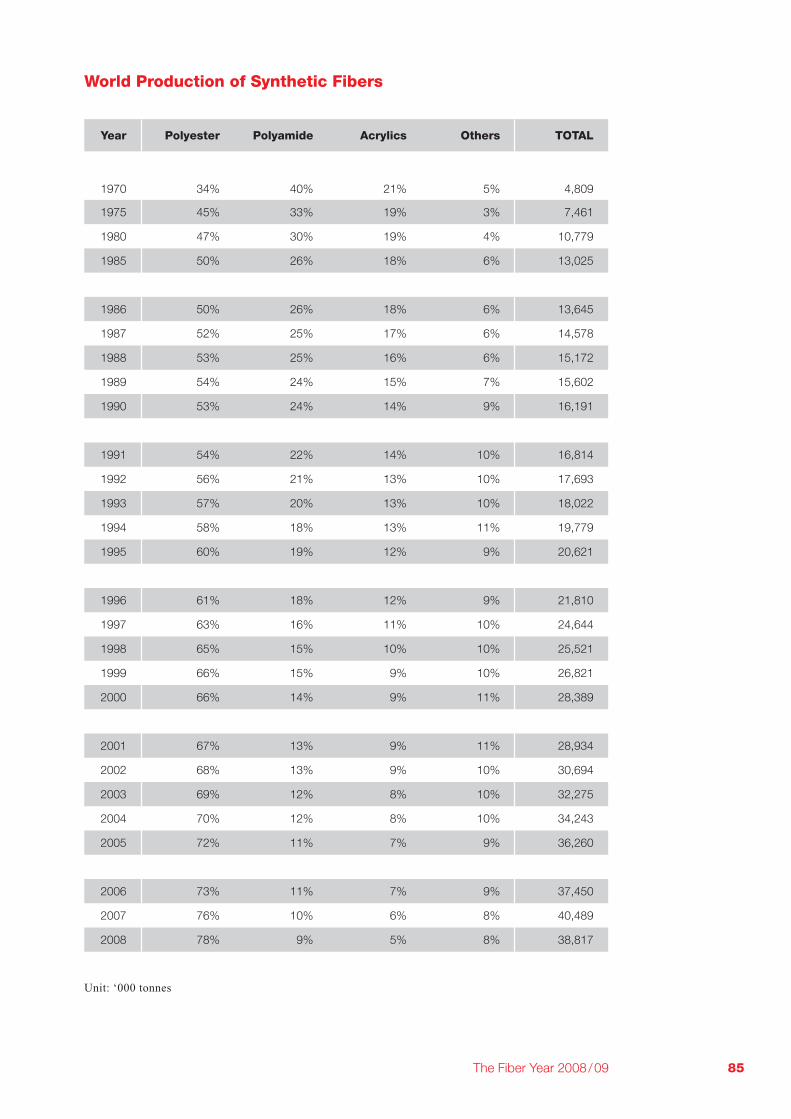
85The Fiber Year 2008/09
World Production of Synthetic Fibers
Unit: ‘000 tonnes
Year Polyester Polyamide Acrylics Others TOTAL
1970 34% 40% 21% 5% 4,809
1975 45% 33% 19% 3% 7,461
1980 47% 30% 19% 4% 10,779
1985 50% 26% 18% 6% 13,025
1986 50% 26% 18% 6% 13,645
1987 52% 25% 17% 6% 14,578
1988 53% 25% 16% 6% 15,172
1989 54% 24% 15% 7% 15,602
1990 53% 24% 14% 9% 16,191
1991 54% 22% 14% 10% 16,814
1992 56% 21% 13% 10% 17,693
1993 57% 20% 13% 10% 18,022
1994 58% 18% 13% 11% 19,779
1995 60% 19% 12% 9% 20,621
1996 61% 18% 12% 9% 21,810
1997 63% 16% 11% 10% 24,644
1998 65% 15% 10% 10% 25,521
1999 66% 15% 9% 10% 26,821
2000 66% 14% 9% 11% 28,389
2001 67% 13% 9% 11% 28,934
2002 68% 13% 9% 10% 30,694
2003 69% 12% 8% 10% 32,275
2004 70% 12% 8% 10% 34,243
2005 72% 11% 7% 9% 36,260
2006 73% 11% 7% 9% 37,450
2007 76% 10% 6% 8% 40,489
2008 78% 9% 5% 8% 38,817
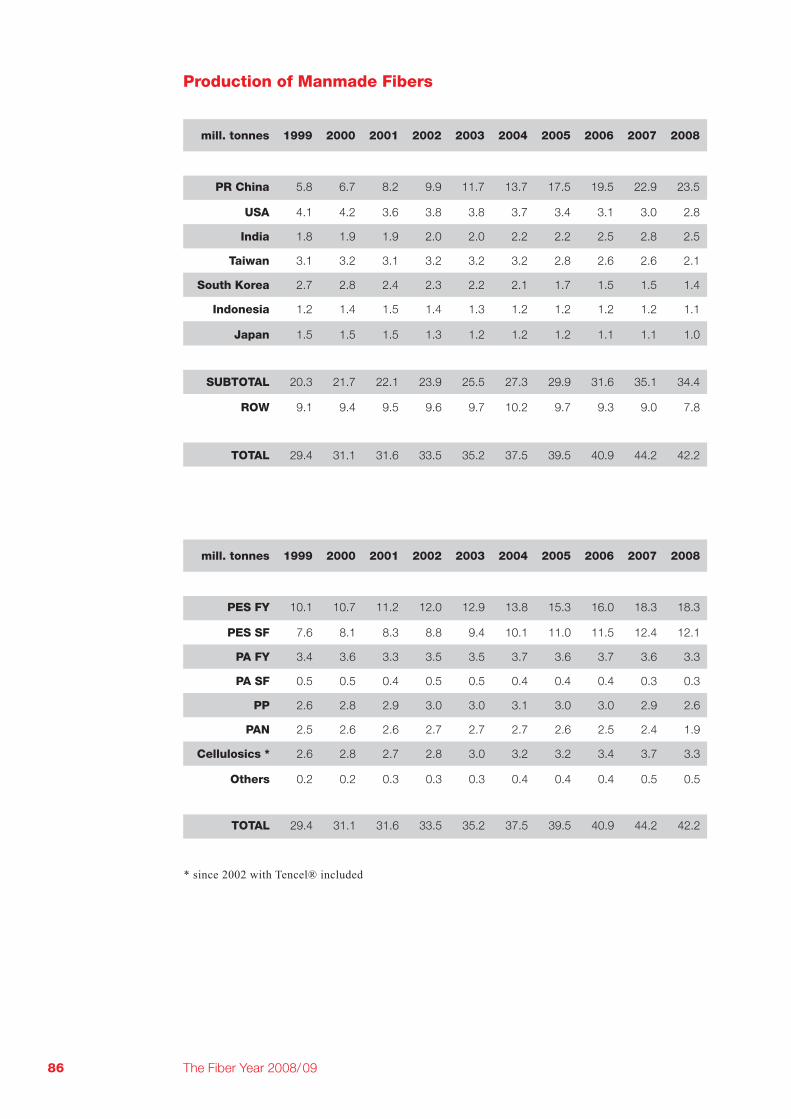
86 The Fiber Year 2008/09
Production of Manmade Fibers
mill. tonnes 1999 2000 2001 2002 2003 2004 2005 2006 2007 2008
PR China 5.8 6.7 8.2 9.9 11.7 13.7 17.5 19.5 22.9 23.5
USA 4.1 4.2 3.6 3.8 3.8 3.7 3.4 3.1 3.0 2.8
India 1.8 1.9 1.9 2.0 2.0 2.2 2.2 2.5 2.8 2.5
Taiwan 3.1 3.2 3.1 3.2 3.2 3.2 2.8 2.6 2.6 2.1
South Korea 2.7 2.8 2.4 2.3 2.2 2.1 1.7 1.5 1.5 1.4
Indonesia 1.2 1.4 1.5 1.4 1.3 1.2 1.2 1.2 1.2 1.1
Japan 1.5 1.5 1.5 1.3 1.2 1.2 1.2 1.1 1.1 1.0
SUBTOTAL 20.3 21.7 22.1 23.9 25.5 27.3 29.9 31.6 35.1 34.4
ROW 9.1 9.4 9.5 9.6 9.7 10.2 9.7 9.3 9.0 7.8
TOTAL 29.4 31.1 31.6 33.5 35.2 37.5 39.5 40.9 44.2 42.2
mill. tonnes 1999 2000 2001 2002 2003 2004 2005 2006 2007 2008
PES FY 10.1 10.7 11.2 12.0 12.9 13.8 15.3 16.0 18.3 18.3
PES SF 7.6 8.1 8.3 8.8 9.4 10.1 11.0 11.5 12.4 12.1
PA FY 3.4 3.6 3.3 3.5 3.5 3.7 3.6 3.7 3.6 3.3
PA SF 0.5 0.5 0.4 0.5 0.5 0.4 0.4 0.4 0.3 0.3
PP 2.6 2.8 2.9 3.0 3.0 3.1 3.0 3.0 2.9 2.6
PAN 2.5 2.6 2.6 2.7 2.7 2.7 2.6 2.5 2.4 1.9
Cellulosics * 2.6 2.8 2.7 2.8 3.0 3.2 3.2 3.4 3.7 3.3
Others 0.2 0.2 0.3 0.3 0.3 0.4 0.4 0.4 0.5 0.5
TOTAL 29.4 31.1 31.6 33.5 35.2 37.5 39.5 40.9 44.2 42.2
* since 2002 with Tencel® included
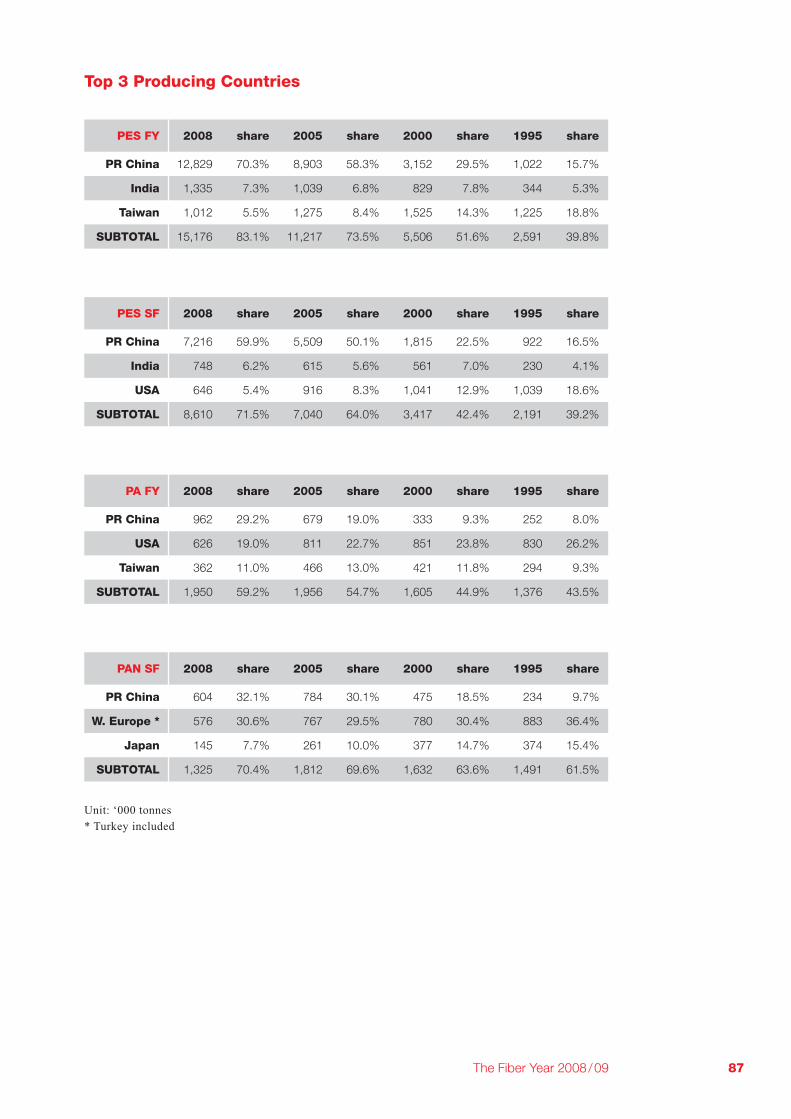
87The Fiber Year 2008/09
Top 3 Producing Countries
Unit: ‘000 tonnes
* Turkey included
PES FY 2008 share 2005 share 2000 share 1995 share
PR China 12,829 70.3% 8,903 58.3% 3,152 29.5% 1,022 15.7%
India 1,335 7.3% 1,039 6.8% 829 7.8% 344 5.3%
Taiwan 1,012 5.5% 1,275 8.4% 1,525 14.3% 1,225 18.8%
SUBTOTAL 15,176 83.1% 11,217 73.5% 5,506 51.6% 2,591 39.8%
PES SF 2008 share 2005 share 2000 share 1995 share
PR China 7,216 59.9% 5,509 50.1% 1,815 22.5% 922 16.5%
India 748 6.2% 615 5.6% 561 7.0% 230 4.1%
USA 646 5.4% 916 8.3% 1,041 12.9% 1,039 18.6%
SUBTOTAL 8,610 71.5% 7,040 64.0% 3,417 42.4% 2,191 39.2%
PA FY 2008 share 2005 share 2000 share 1995 share
PR China 962 29.2% 679 19.0% 333 9.3% 252 8.0%
USA 626 19.0% 811 22.7% 851 23.8% 830 26.2%
Taiwan 362 11.0% 466 13.0% 421 11.8% 294 9.3%
SUBTOTAL 1,950 59.2% 1,956 54.7% 1,605 44.9% 1,376 43.5%
PAN SF 2008 share 2005 share 2000 share 1995 share
PR China 604 32.1% 784 30.1% 475 18.5% 234 9.7%
W. Europe * 576 30.6% 767 29.5% 780 30.4% 883 36.4%
Japan 145 7.7% 261 10.0% 377 14.7% 374 15.4%
SUBTOTAL 1,325 70.4% 1,812 69.6% 1,632 63.6% 1,491 61.5%

88 The Fiber Year 2008/09
Manmade Fibers Industry 2008/07
Polyester Textile Yarn Industrial Yarn Staple Fiber TOTAL
2007 2008 2007 2008 2007 2008 2007 2008
Europe 465 333 232 194 738 666 1,436 1,192
NAFTA 337 240 167 148 813 679 1,317 1,067
South America 116 99 28 24 172 174 316 297
PR China 11,854 12,379 370 450 7,027 7,216 19,251 20,046
India 1,392 1,334 1 1 868 748 2,262 2,084
Japan 179 169 83 75 204 191 465 435
Korea 524 510 185 170 556 477 1,265 1,157
Taiwan 1,162 954 69 65 582 503 1,813 1,522
ROW 1,119 1,092 50 26 1,491 1,401 2,659 2,519
SUBTOTAL
Polyamide Textile Yarn Industrial Yarn Carpet Yarn TOTAL
2007 2008 2007 2008 2007 2008 2007 2008
Europe 221 198 227 204 181 160 628 561
NAFTA 75 61 120 101 725 611 920 772
South America 54 54 40 30 1 1 95 85
PR China 573 620 305 314 25 28 903 962
India 27 28 68 65 0 0 95 93
Japan 44 41 65 63 8 7 117 111
Korea 86 74 60 52 6 5 152 131
Taiwan 384 302 70 60 0 0 454 362
ROW 131 121 94 81 15 13 241 215
SUBTOTAL 970 959 824
Unit: ‘000 tonnes
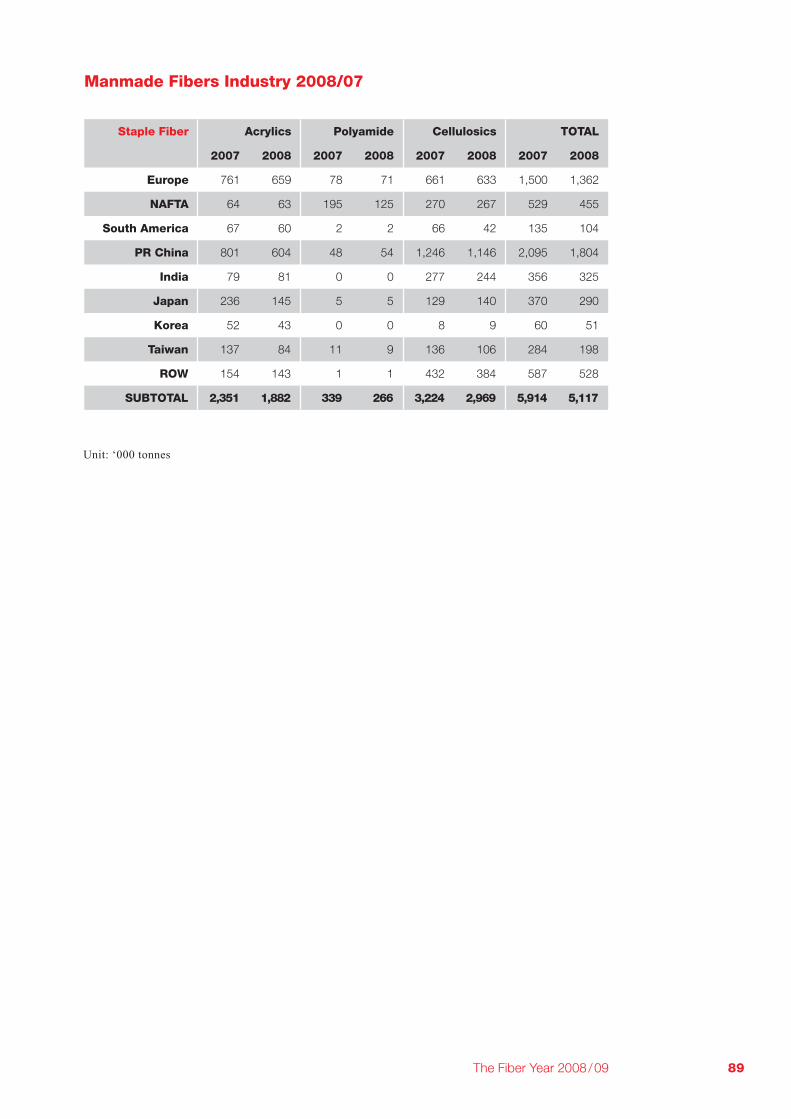
89The Fiber Year 2008/09
Manmade Fibers Industry 2008/07
Staple Fiber Acrylics Polyamide Cellulosics TOTAL
2007 2008 2007 2008 2007 2008 2007 2008
Europe 761 659 78 71 661 633 1,500 1,362
NAFTA 64 63 195 125 270 267 529 455
South America 67 60 2 2 66 42 135 104
PR China 801 604 48 54 1,246 1,146 2,095 1,804
India 79 81 0 0 277 244 356 325
Japan 236 145 5 5 129 140 370 290
Korea 52 43 0 0 8 9 60 51
Taiwan 137 84 11 9 136 106 284 198
ROW 154 143 1 1 432 384 587 528
SUBTOTAL 339 266
Unit: ‘000 tonnes

90 The Fiber Year 2008/09
Yarn 2008 share 2005 share 2000 share 1995 share
Filament 23,879 40.4% 21,403 37.0% 16,514 36.0% 11,557 30.9%
Spun 35,295 59.6% 36,435 63.0% 29,368 64.0% 25,895 69.1%
TOTAL 59,174 57,838 45,882 37,452
Yarn 2008 AAGR 2005 AAGR 2000 AAGR 1995 AAGR
Filament 23,879 3.7% 21,403 5.3% 16,514 7.4% 11,557 6.4%
Spun 35,295 -1.1% 36,435 4.4% 29,368 2.5% 25,895 -0.6%
TOTAL 59,174 0.8% 57,838 4.7% 45,882 4.1% 37,452 1.2%
Yarn 2008 AAGR 2005 AAGR 2000 AAGR 1995 AAGR
Cotton 20,383 -1.9% 21,595 4.8% 17,109 2.2% 15,345 -1.5%
Polyester 9,837 3.1% 8,979 6.4% 6,573 7.3% 4,629 3.7%
Acrylics 1,789 -10.2% 2,473 0.4% 2,440 1.9% 2,225 0.6%
Cellulosics 1,891 2.0% 1,781 4.6% 1,417 -1.7% 1,545 -1.4%
Wool 1,027 -1.4% 1,073 -2.0% 1,185 -4.1% 1,460 -5.4%
Others 368 -11.7% 534 -3.7% 644 -1.4% 691 2.8%
TOTAL 35,295 -1.1% 36,435 4.4% 29,368 2.5% 25,895 -0.6%
Unit: ‘000 tonnes
Unit: ‘000 tonnes
Unit: ‘000 tonnes
Global Yarn Production
Dynamics in Yarn Production
Fiber Types in Spun Yarn Production

Imprint
Oerlikon Textile GmbH & Co. KG
Leverkuser Strasse 65
42897 Remscheid
Germany
www.oerlikontextile.com
Editor and responsible for content
Andreas Engelhardt
Tel. +41-71-4475189
Editors
Andreas Engelhardt

www.oerlikontextile.com