The fate of riverine nutrients on Arctic shelves
19
HAL Id: hal-01089953 https://hal.archives-ouvertes.fr/hal-01089953v1 Submitted on 3 Dec 2014 (v1), last revised 7 Nov 2019 (v2) HAL is a multi-disciplinary open access archive for the deposit and dissemination of sci- entific research documents, whether they are pub- lished or not. The documents may come from teaching and research institutions in France or abroad, or from public or private research centers. L’archive ouverte pluridisciplinaire HAL, est destinée au dépôt et à la diffusion de documents scientifiques de niveau recherche, publiés ou non, émanant des établissements d’enseignement et de recherche français ou étrangers, des laboratoires publics ou privés. The fate of riverine nutrients on Arctic shelves V. Le Fouest, M. Babin, J.-É. Tremblay To cite this version: V. Le Fouest, M. Babin, J.-É. Tremblay. The fate of riverine nutrients on Arctic shelves. Bio- geosciences, European Geosciences Union, 2013, 10 (6), pp.3661 - 3677. 10.5194/bg-10-3661-2013. hal-01089953v1
Transcript of The fate of riverine nutrients on Arctic shelves
HAL Id: hal-01089953https://hal.archives-ouvertes.fr/hal-01089953v1
Submitted on 3 Dec 2014 (v1), last revised 7 Nov 2019 (v2)
HAL is a multi-disciplinary open accessarchive for the deposit and dissemination of sci-entific research documents, whether they are pub-lished or not. The documents may come fromteaching and research institutions in France orabroad, or from public or private research centers.
L’archive ouverte pluridisciplinaire HAL, estdestinée au dépôt et à la diffusion de documentsscientifiques de niveau recherche, publiés ou non,émanant des établissements d’enseignement et derecherche français ou étrangers, des laboratoirespublics ou privés.
The fate of riverine nutrients on Arctic shelvesV. Le Fouest, M. Babin, J.-É. Tremblay
To cite this version:V. Le Fouest, M. Babin, J.-É. Tremblay. The fate of riverine nutrients on Arctic shelves. Bio-geosciences, European Geosciences Union, 2013, 10 (6), pp.3661 - 3677. �10.5194/bg-10-3661-2013�.�hal-01089953v1�

Biogeosciences, 10, 1–17, 2013www.biogeosciences.net/10/1/2013/doi:10.5194/bg-10-1-2013© Author(s) 2013. CC Attribution 3.0 License.
EGU Journal Logos (RGB)
Advances in Geosciences
Open A
ccess
Natural Hazards and Earth System
Sciences
Open A
ccess
Annales Geophysicae
Open A
ccess
Nonlinear Processes in Geophysics
Open A
ccess
Atmospheric Chemistry
and Physics
Open A
ccess
Atmospheric Chemistry
and Physics
Open A
ccess
Discussions
Atmospheric Measurement
Techniques
Open A
ccess
Atmospheric Measurement
Techniques
Open A
ccess
Discussions
Biogeosciences
Open A
ccess
Open A
ccess
BiogeosciencesDiscussions
Climate of the Past
Open A
ccess
Open A
ccess
Climate of the Past
Discussions
Earth System Dynamics
Open A
ccess
Open A
ccess
Earth System Dynamics
Discussions
GeoscientificInstrumentation
Methods andData Systems
Open A
ccess
GeoscientificInstrumentation
Methods andData Systems
Open A
ccess
Discussions
GeoscientificModel Development
Open A
ccess
Open A
ccess
GeoscientificModel Development
Discussions
Hydrology and Earth System
Sciences
Open A
ccess
Hydrology and Earth System
Sciences
Open A
ccess
Discussions
Ocean Science
Open A
ccess
Open A
ccess
Ocean ScienceDiscussions
Solid Earth
Open A
ccess
Open A
ccess
Solid EarthDiscussions
The Cryosphere
Open A
ccess
Open A
ccess
The CryosphereDiscussions
Natural Hazards and Earth System
SciencesO
pen Access
Discussions
The fate of riverine nutrients on Arctic shelves
V. Le Fouest1, M. Babin2, and J.-E. Tremblay2
1Laboratoire d’Oceanographie de Villefranche, BP 8, UMR7093TS1, CNRS & Univ. Pierre et Marie Curie (Paris VI), 06238Villefranche-sur-Mer Cedex, France2Takuvik Joint International Laboratory, Universite Laval (Canada) & Centre National de la Recherche Scientifique (France),Departement de Biologie, 1045, Avenue de la Medecine, Quebec (Quebec), G1V 0A6, Canada
Correspondence to:V. Le Fouest ([email protected])
Received: 2 August 2012 – Published in Biogeosciences Discuss.: 2 October 2012Revised: 19 February 2013 – Accepted: 7 May 2013 – Published:
Abstract. CE1Present and future levels of primary produc-tion (PP) in the Arctic Ocean (AO) depend on nutrient in-puts to the photic zone via vertical mixing, upwelling andexternal sources. In this regard, the importance of horizon-tal river supply relative to oceanic processes is poorly con-strained at the pan-Arctic scale. We compiled extensive his-torical (1954–2012) data on discharge and nutrient concen-trations to estimate fluxes of nitrate, soluble reactive phos-phate (SRP), silicate, dissolved organic carbonCE2(DOC),dissolved organic nitrogen (DON), particulate organic ni-trogen (PON) and particulate organic carbon (POC) from 9large Arctic rivers and assess their potential impact on thebiogeochemistry of shelf waters. Several key points can beemphasized from this analysis. The contribution of river-ine nitrate to new PP (PPnew) is very small at the regionalscale (< 1 % to 6.7 %) and negligible at the pan-Arctic scale(< 0.83 %), in agreement with recent studies. By consum-ing all this nitrate, oceanic phytoplankton would be able touse only 14.3 % and 8.7–24.5 % of the river supply of sili-cate at the pan-Arctic and regional scales, respectively. Cor-responding figures for SRP are 28.9 % and 18.6–46 %. On theBeaufort and Bering shelves, riverine SRP cannot fulfil phy-toplankton requirements. On a seasonal basis, the removalof riverine nitrate, silicate and SRP would be the highest inspring and not in summer when AO shelf waters are nitrogen-limited. Riverine DON is potentially an important nitrogensource for the planktonic ecosystem in summer, when am-monium supplied through the photoammonification of re-fractory DON (3.9× 10⁹ mol N) may exceed the combinedriverine supply of nitrate and ammonium (3.4× 10⁹ mol N).Nevertheless, overall nitrogen limitation of AO phytoplank-ton is expected to persist even when projected increases of
riverine DON and nitrate supply are taken into account. Thisanalysis underscores the need to better contrast oceanic nutri-ent supply processes with the composition and fate of chang-ing riverine nutrient deliveries in future scenarios of planktoncommunity structure, function and production in the coastalAO.
1 Introduction
Fifty years ago, the Arctic Ocean (AO) was perceived as asmall contributor to the global carbon cycle because of itsextensive sea-ice cover and the relatively low light levels ex-perienced by phytoplankton (English, 1961). The AO is nowthought to contribute ca. 14 % of the global uptake of at-mospheric carbon dioxide (Bates and Mathis, 2009) and, assuch, is an important actor in the global carbon cycle. As aconsequence of warming, the AO tends to switch towards amore sub-Arctic state. The earlier and longer exposure of sur-face waters to sunlight triggers earlier vernal blooms in someparts of the Arctic Ocean (Kahru et al., 2010TS2). Also, ithas been suggested based on ocean colour remote sensingdata that annual primary production (PP) is increasing (Ar-rigo et al., 2008). However, recent observations show that thedensity stratification (i.e. pycnocline) is persistent through-out the year (Tremblay et al., 2008) and strengthening as aresult of increasing river discharge (Li et al., 2009). Theseconditions limit the vertical supply of nutrients offshore andfavour small phytoplankton cells at the expense of large ones(Li et al., 2009).
Present and future trends in Arctic PP will depend on nu-trient inputs into the photic zone, driven either by ocean mix-
Ple
ase
note
the
rem
arks
atth
een
dof
the
man
uscr
ipt.
Published by Copernicus Publications on behalf of the European Geosciences Union.

2 V. Le Fouest et al.: The fate of riverine nutrients on Arctic shelves
ing, upwelling or external sources (Tremblay and Gagnon,2009). Mixing and upwelling replenish the photic zone withnew nutrients transported upwards from below the pycno-cline. These nutrients originate mostly from the local rem-ineralization of settling organic matter and from the inflow ofAtlantic and Pacific waters. Upward supply can result fromtidal or wind-driven erosions of the pycnocline (Wassmannet al., 2006; Hannah et al., 2009; Le Fouest et al., 2011), up-welling when wind blows in a suitable direction along theshelf break (Tremblay et al., 2011) or the ice edge (Mundyet al., 2009) and eddy pumping in shallow anticyclonic ed-dies (Timmermans et al., 2008). The contribution of theseoceanic processes relative to horizontal nutrient supply fromrivers and adjacent seas to the Arctic PP regime is poorlyconstrained at the pan-Arctic scale (Tremblay and Gagnon,2009).
Continental rivers surrounding the AO are a potentiallysignificant source of nutrients for circum-Arctic shelf seas.Arctic river discharge is high, representing 10 % of the globalfreshwater discharge pouring into only 1 % of the globalocean volume (Opshal et al., 1999). While the estimatedinput of allochthonous inorganic and organic compoundsby rivers into the Arctic Ocean is not negligible (Holmeset al., 2000; Dittmar and Kattner, 2003), its biogeochemi-cal significance in shelf waters remains unclear (McClellandet al., 2012). Riverine nitrate is derived from soil leaching(i.e. moved or dissolved and carried through soil by water)and terrestrial surface run-off (i.e. transported over land inthe excess water when soil is infiltrated to full capacity).Soluble reactive phosphorusCE3 (SRP) originates from theweathering of crustal minerals (e.g. aluminium orthophos-phate, apatite) and silicate from weathering of silicate andaluminosilicate minerals. Along the river path, the specificityof the lithological substrate and permafrost and the terrestrialvegetation are important factors governing the riverine nutri-ent flux. Glacial or thermokarst lakes also control the nutri-ent transport from the soil to the river. Around delta lakes,inorganic nutrients can be enhanced via processes involvingfloodwater percolation among flooded vegetation and soils(e.g. Emmerton et al., 2008). Human activity may also pro-vide nitrate and SRP in the White Sea, which has one ofthe most industrialized Arctic coastlines. By contrast withnitrogen-limited marine waters, phosphorus is the most lim-iting element in rivers mostly because its supply to the fresh-water system is limited by erosion. Particulate and dissolvedorganic forms of nitrogen, phosphorus and carbon are alsotransported to the ocean by rivers. Their fate in the marine en-vironment depends of their lability, of which little is knownin Arctic settings.
Previous estimates of riverine nutrients fluxes to thecoastal Arctic were either based on annual mean concen-trations (Gordeev et al., 1996) or on monthly mean con-centrations but derived from a single data set and limitedto a portion of the Arctic Basin (Holmes et al., 2000). Re-cently, an important modelling effort constrained by mea-
surements from the PARTNERS (2003–2007) and StudentPartners (2005–2008) projects during the last decade wasmade to assess deliveries of riverine dissolved nutrients andtheir seasonality (Holmes et al., 2011). In the present study,we expanded this effort by compiling extensive historical(1954–2012) data including dissolved nutrients and partic-ulate matter for 9 large Eurasian and North American rivers.The aim was to establish a historical baseline of river fluxesand assess their impact on the biogeochemistry of shelf wa-ters. Particular attention is paid to phosphorus, silica andparticulate organic nitrogen (PON), which in recent papersreceived less attention than dissolved nitrogen (Tank et al.,2011) and carbon (Manizza et al., 2009). We provide thebiogeochemical modelling community with time series ofmonthly averaged concentrations of nitrate, SRP, silicate,and dissolved organic carbon (DOC) and nitrogen (DON)to help constrain riverine boundary conditions in pan-Arcticphysical–biological models.
2 Material and methods
We compiled riverine nitrate (n = 2436), SRP (n = 1618),silicate (n = 1683), DOC (n = 509), DON (n = 380), POC(n = 160) and PON (n = 160) data for 9 large Arctic rivers:the Yenisey (Kara Sea; at Igarka (67.4◦ N, 86.5◦ E) andDudinka (69.2◦ N, 86.1◦ E)), Lena (Laptev Sea; at Zhi-gansk (66.8◦ N, 123.4◦ E), Kyusur (70.7◦ N, 127.4◦ E) andStolb (72.37◦ N, 126.80◦ E)), Ob (Kara Sea; at Salekhard(66.6◦ N, 66.6◦ E)), Mackenzie (Beaufort Sea; at Tsiige-htchic (67.46◦ N, 133.7◦ W)), Yukon (Bering Sea; at Pi-lot Station (61.93◦ N, 162.88◦ W)), Pechora (Barents Sea;at Oksino (67.6◦ N, 52.2◦ E)), Northern Dvina (WhiteSea; at Ust’ Pinega (64.1◦ N, 41.9◦ E) and Arkhangelsk(64.3◦ N, 40.3◦ E)), Kolyma (East Siberian Sea; at Kolym-skoye (68.7◦ N, 158.7◦ E) and Cherskii (68.4◦ N, 161.2◦ E))and Indigirka (East Siberian Sea; at Chokurdakh (70.4◦ N,147.6◦ E)). Data were gathered from 8 publications (Reederet al., 1972; Macdonald et al., 1987; Letolle et al., 1993;Lara et al., 1998; Holmes et al., 2000; Millot et al., 2003;Savenko and Shevchenko, 2005; Finlay et al., 2006) and 5databases. The latter are from the PARTNERS project (e.g.McClelland et al., 2008) extended as the Arctic Great RiversObservatory (Arctic-GRO) project (http://arcticgreatrivers.org/data.html), the United Nations GEMS/WATER Pro-gramme (http://www.gemswater.org), United States Geo-logical Survey (USGS) Water-Quality Data for the Nation(http://waterdata.usgs.gov/nwis/qw) and the United FederalService for Observation and Control of Environmental Pol-lution (OGSNK/GSN) (Holmes et al., 2000). Data span from1954 to 2012 with most of the measurements starting fromthe mid-1980s. The data sets used for each river samplinglocation are given in Table 1. With respect to data qual-ity, only a total of 2 dubious nitrate measurements (97 and117 mmol N m−3 measured in the Yenisey River at Igarka)
Ple
ase
note
the
rem
arks
atth
een
dof
the
man
uscr
ipt.
Biogeosciences, 10, 1–17, 2013 www.biogeosciences.net/10/1/2013/

V. Le Fouest et al.: The fate of riverine nutrients on Arctic shelves 3
Table 1.Data sets of nitrate, silicate, SRP, DOC, DON, POC and PON concentration used for each river sampling location. The number ofdata for each data set is given between brackets.
River Site Nitrate Silicate SRP DOC DON POC PON
Yenisey Igarka GEMS/WATER (143) GEMS/WATER (151) GEMS/WATER (92)
DudinkaOGSNK/GSN (56) A-GRO (56) OGSNK/GSN (56) A-GRO (56) A-GRO (56) PARTNERS (16) PARTNERS (16)A-GRO (56) PARTNERS (17) A-GRO (56) PARTNERS (16) PARTNERS (17) A-GRO (10) A-GRO (10)PARTNERS (17)
Lena ZhiganskA-GRO (56) A-GRO (57) A-GRO (57) A-GRO (57) A-GRO (56) PARTNERS (17) PARTNERS (17)PARTNERS (17) PARTNERS (17) PARTNERS (17) PARTNERS (17) A-GRO (10) A-GRO (10)
KyusurGEMS/WATER (71) GEMS/WATER (70) GEMS/WATER (60)OGSNK/GSN (59) Publication (1) OGSNK/GSN (57)Publication (1)
StolbGEMS/WATER (94) GEMS/WATER (114) GEMS/WATER (27)Publication (1) Publication (3) Publication (1)
Ob SalekhardGEMS/WATER (533) GEMS/WATER (366) OGSNK/GSN (57) A-GRO (52) A-GRO (52) PARTNERS (15) PARTNERS (15)PARTNERS (17) A-GRO (52) A-GRO (52) PARTNERS (17) PARTNERS (16) A-GRO (10) A-GRO (10)A-GRO (52) PARTNERS (17)
MackenzieTsiigehtchic
A-GRO (57) A-GRO (57) GEMS/WATER (84) A-GRO (57) A-GRO (57) PARTNERS (14) PARTNERS (14)PARTNERS (17) GEMS/WATER (48) A-GRO (57) PARTNERS (17) PARTNERS (17) A-GRO (13) A-GRO (13)Publication (2) PARTNERS (17) Publication (1)
Publication (2)
Yukon Pilot StationUSGS (67) USGS (158) USGS (54) USGS (67) A-GRO (47) PARTNERS (16) PARTNERS (16)A-GRO (47) A-GRO (47) A-GRO (47) A-GRO (47) PARTNERS (15) A-GRO (13) A-GRO (13)PARTNERS (3) PARTNERS (3) PARTNERS (11)
Pechora Oksino OGSNK/GSN (155) OGSNK/GSN (156)
Northern Ust’ Pinega GEMS/WATER (481) GEMS/WATER (400) GEMS/WATER (337)Dvina
Arkhangelsk OGSNK/GSN (170) OGSNK/GSN (171)
Kolyma Kolymskoye GEMS/WATER (134) GEMS/WATER (84)
CherskiiOGSNK/GSN (40) PARTNERS (17) OGSNK/GSN (40) Publication (64) PARTNERS (17) PARTNERS (16) PARTNERS (16)PARTNERS (17) A-GRO (13) A-GRO (13) PARTNERS (17) A-GRO (13) A-GRO (10) A-GRO (10)A-GRO (13) A-GRO (13)
Indigirka Chokurdakh OGSNK/GSN (60) OGSNK/GSN (60)
All rivers 2436 1683 1618 509 380 160 160
were removed from the data set considering maximum ni-trate concentrations of ca. 37 mmol N m−3 in the Yeniseywatershed (e.g. Frey et al., 2007). Ammonium concentra-tions used in this study are restricted to those of the PART-NERS database, because concentrations measured along theEurasian side are considered dubious as a result of method-ological problems (Holmes et al., 2000, 2001). DON con-centrations are also derived from the PARTNERS database.DON concentrations were obtained by subtracting nitrate, ni-trite and ammonium from the total dissolved nitrogen pool.SRP is the phosphorus content measured as the orthophos-phates prior to the hydrolysis of the dissolved organic phos-phorus (DOP).
The source nutrient data were log-transformed to reduceskewness and approach a Gaussian frequency distribution.For nutrients, only geometric monthly averages were usedin the remainder of this study. They were obtained byback-transforming the arithmetic averages calculated on log-transformed data. Missing monthly concentrations resultingfrom the lack of data were estimated using a linear interpo-lation procedure. The monthly averaged nutrient data weremultiplied by the monthly integrated river flow rates from
the R-ArcticNet database (http://www.r-arcticnet.sr.unh.edu/v4.0/index.html) to compute the monthly-integrated nutri-ent fluxes. On average, the monthly integrated flow rates liewithin ca. 3–4 % (May–October, ca. 82 % of the annual flow)of the mean annual values reported in the modelling study ofHolmes et al. (2011). Nutrient fluxes in the polar mixed layerthrough Bering Strait and the Barents Sea opening were com-puted using the geometric mean annual concentrations calcu-lated between 0 and 50 m from the World Ocean Atlas 2005(National Oceanographic Data Centre, 2006) for SRP, nitrateand silicate. Values of 0.83 Sv (1 Sv= 106 m3 s−1) and of0.2 Sv were used as the mean volume transported throughBering Strait (Roach et al., 1995) and the Barents Sea open-ing (Ingvaldsen et al., 2004), respectively.
3 Results and discussion
3.1 Concentrations and fluxes of riverine nutrients
The different nutrients show distinct seasonal patterns in con-centration, as demonstrated by the monthly data from sta-tions located as far downriver as possible (Figs. 1 and 2).
www.biogeosciences.net/10/1/2013/ Biogeosciences, 10, 1–17, 2013
4 V. Le Fouest et al.: The fate of riverine nutrients on Arctic shelves�
���
�����
�%�����2�����
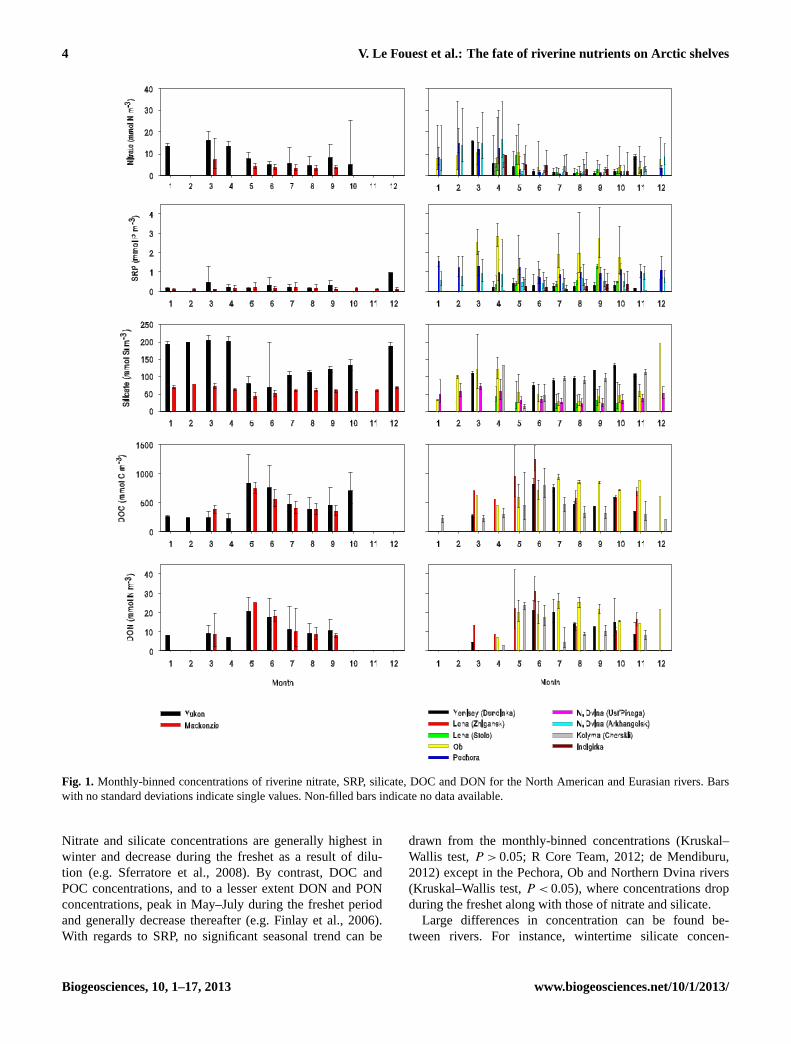
Fig. 1. Monthly-binned concentrations of riverine nitrate, SRP, silicate, DOC and DON for the North American and Eurasian rivers. Barswith no standard deviations indicate single values. Non-filled bars indicate no data available.
Nitrate and silicate concentrations are generally highest inwinter and decrease during the freshet as a result of dilu-tion (e.g. Sferratore et al., 2008). By contrast, DOC andPOC concentrations, and to a lesser extent DON and PONconcentrations, peak in May–July during the freshet periodand generally decrease thereafter (e.g. Finlay et al., 2006).With regards to SRP, no significant seasonal trend can be
drawn from the monthly-binned concentrations (Kruskal–Wallis test,P > 0.05; R Core Team, 2012; de Mendiburu,2012) except in the Pechora, Ob and Northern Dvina rivers(Kruskal–Wallis test,P < 0.05), where concentrations dropduring the freshet along with those of nitrate and silicate.
Large differences in concentration can be found be-tween rivers. For instance, wintertime silicate concen-
Biogeosciences, 10, 1–17, 2013 www.biogeosciences.net/10/1/2013/

V. Le Fouest et al.: The fate of riverine nutrients on Arctic shelves 5�
���
�����
�%�����2�����
�����
� �����
Fig. 2. Monthly-binned concentrations of riverine POC and PON for the North American and Eurasian rivers. Bars with no standard devia-tions indicate single values. Non-filled bars indicate no data available.
trations are significantly higher in the Yukon River(ca. 200 mmol Si m−3) than in any other river (Kruskal–Wallis test,P < 0.05), and the seasonal variations are large(130 mmol Si m−3) compared with the Mackenzie River(ca. 25 mmol Si m−3), for example. Greater silicate concen-trations in the Yukon River can be explained by the higherdissolved silica yield in the Yukon catchment (Durr et al.,2011). Regarding SRP, wintertime concentrations are gen-erally significantly higher in the Ob, Pechora and North-ern Dvina rivers than in North American rivers (Kruskal–Wallis test,P < 0.05). The Ob River shows the highest SRPconcentrations (up to 3 mmol P m−3) prior to and after theseasonal peak discharge in July. Apart from the Ob River,Eurasian rivers exhibit significant differences in DOC andDON concentrations throughout the year (Kruskal–Wallistest,P < 0.05) but comparable maximum values in spring(ca. 1000 mmol C m−3 and 20–30 mmol N m−3) (Kruskal–Wallis test,P < 0.05). In August and September, the concen-trations of DOC and DON in the Ob River are significantlyhigher than those of its North American and Eurasian coun-terparts (Kruskal–Wallis test,P < 0.05). The concentrationsof PON and POC are also significantly higher than those ofits Eurasian counterparts (Kruskal–Wallis test,P < 0.05), butnot significantly different from those of its North Americancounterparts (Kruskal–Wallis test,P > 0.05).
The standard deviations calculated on concentrations aregenerally high for all variables except silicate and high val-ues are not restricted to the period of maximum river dis-charge. The effect of synoptic and interannual variability indischarge (Holmes et al., 2011), which can alter concentra-
tions, in calculating monthly averages likely contributed tothe large standard deviations and impacted nutrient flux esti-mations. Furthermore, the monthly binning procedure in cal-culating nutrient fluxes prevented any coupled variations innutrient concentrations and water discharge within month.For constituents that are positively (negatively) correlatedwith discharge, this leads to underestimation (overestima-tion). Nevertheless, the mean annual fluxes of riverine nu-trients estimated in this study show overall agreement withpreviously published ones (Table 2). Note that we incorpo-rated measurements made at stations located upstream anddownstream of those used in Holmes et al. (2000, 2011). Acomparison of flux estimates between stations sampled at dif-ferent sites along the paths of the Yenisey, Lena, NorthernDvina and Kolyma rivers showed differences for SRP, sili-cate and, though to a lesser extent, for nitrate. These differ-ences may result, as mentioned above, from uncoupled varia-tions between nutrient concentrations and water discharge inthe flux calculation, and/or from differences in data qualityamongst data sets (e.g. Holmes et al., 2001). Note that us-ing older data sets did not necessarily translate into higheruncertainty in fluxes. For instance, in the Lena River, themean annual fluxes of SRP at Zhigansk and Kyusur are sim-ilar using either recent (A-GRO, 2009–2010) or older datasets (GEMS/WATER, 1984–1992, and OGSNK/GSN, 1984–1995) (Table 2). This is, however, not the case for silicate(Table 2). Differences can also be partly explained by discon-tinuities within the rivers’ watersheds (Frey et al., 2009TS3;Gustafsson et al., 2011). In the Lena River, Semiletov etal. (2011) report a substantial variation in Si and total or-
Ple
ase
note
the
rem
arks
atth
een
dof
the
man
uscr
ipt.
www.biogeosciences.net/10/1/2013/ Biogeosciences, 10, 1–17, 2013

6 V. Le Fouest et al.: The fate of riverine nutrients on Arctic shelves�
� �
��� �
�%���� 2�����
Fig. 3.Monthly flux estimates of riverine nitrate, SRP, silicate, DOC and DON for the North American and Eurasian rivers.
ganic carbon concentrations (20 % and 60 %, respectively)along the 1200 km stretch separating the Lena delta fromYakutsk. The difficulty to quantitatively distinguish betweenthese possible factors is a limitation in our attempt to quan-tify precisely the riverine nutrient fluxes. At the seasonalscale, nutrient fluxes are highest during the freshet season(May to July) and generally peak in June (Figs. 3 and 4).They decrease in summer and, in some cases, show a secondpeak in September–November (Yenisey, Ob, Lena and Yukon
rivers). This second peak is not linked to an intensification offreshwater discharge but to an increase in nutrient concentra-tion in the rivers, which possibly results from changes in thewatershed (e.g. enhanced permafrost melting, decompositionand/or changes in basin hydrology). The Yenisey, Lena andOb rivers show the highest nutrient fluxes as well as the high-est annual freshwater discharge and amplitude of seasonalvariations, especially during the spring to summer transition.
Biogeosciences, 10, 1–17, 2013 www.biogeosciences.net/10/1/2013/
V. Le Fouest et al.: The fate of riverine nutrients on Arctic shelves 7
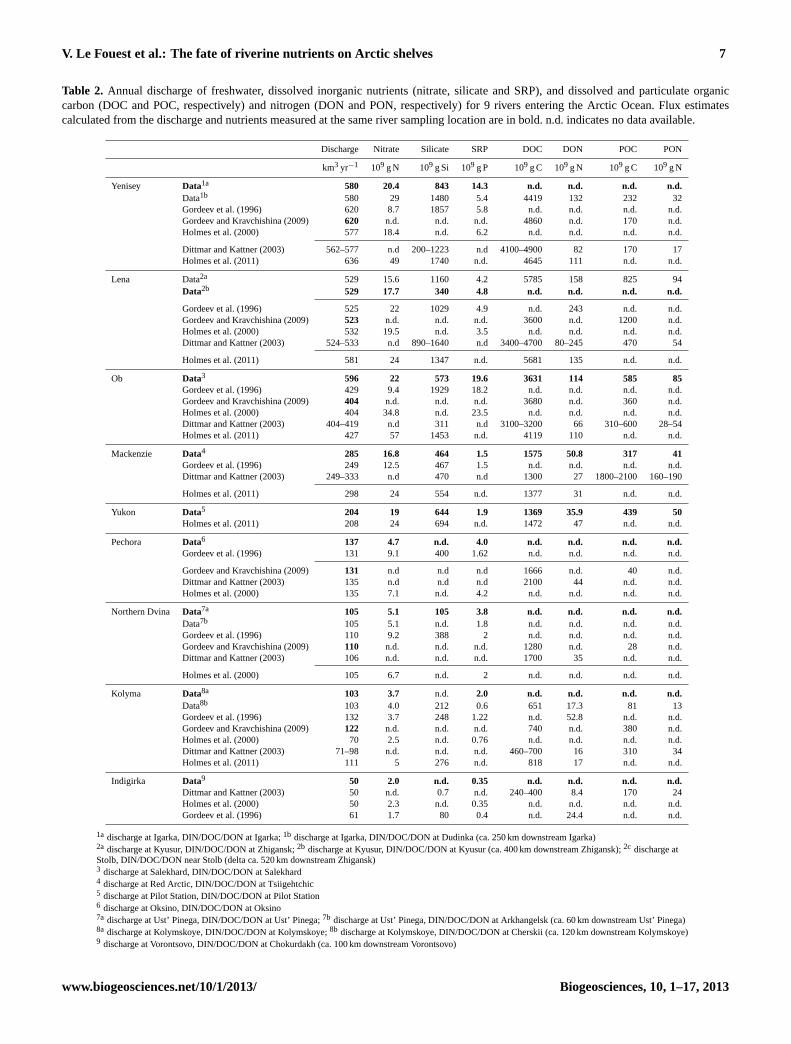
Table 2. Annual discharge of freshwater, dissolved inorganic nutrients (nitrate, silicate and SRP), and dissolved and particulate organiccarbon (DOC and POC, respectively) and nitrogen (DON and PON, respectively) for 9 rivers entering the Arctic Ocean. Flux estimatescalculated from the discharge and nutrients measured at the same river sampling location are in bold. n.d. indicates no data available.
Discharge Nitrate Silicate SRP DOC DON POC PON
km3 yr−1 109 g N 109 g Si 109 g P 109 g C 109 g N 109 g C 109 g N
Yenisey Data1a 580 20.4 843 14.3 n.d. n.d. n.d. n.d.Data1b 580 29 1480 5.4 4419 132 232 32Gordeev et al. (1996) 620 8.7 1857 5.8 n.d. n.d. n.d. n.d.Gordeev and Kravchishina (2009) 620 n.d. n.d. n.d. 4860 n.d. 170 n.d.Holmes et al. (2000) 577 18.4 n.d. 6.2 n.d. n.d. n.d. n.d.
Dittmar and Kattner (2003) 562–577 n.d 200–1223 n.d 4100–4900 82 170 17Holmes et al. (2011) 636 49 1740 n.d. 4645 111 n.d. n.d.
Lena Data2a 529 15.6 1160 4.2 5785 158 825 94Data2b 529 17.7 340 4.8 n.d. n.d. n.d. n.d.
Gordeev et al. (1996) 525 22 1029 4.9 n.d. 243 n.d. n.d.Gordeev and Kravchishina (2009) 523 n.d. n.d. n.d. 3600 n.d. 1200 n.d.Holmes et al. (2000) 532 19.5 n.d. 3.5 n.d. n.d. n.d. n.d.Dittmar and Kattner (2003) 524–533 n.d 890–1640 n.d 3400–4700 80–245 470 54
Holmes et al. (2011) 581 24 1347 n.d. 5681 135 n.d. n.d.
Ob Data3 596 22 573 19.6 3631 114 585 85Gordeev et al. (1996) 429 9.4 1929 18.2 n.d. n.d. n.d. n.d.Gordeev and Kravchishina (2009) 404 n.d. n.d. n.d. 3680 n.d. 360 n.d.Holmes et al. (2000) 404 34.8 n.d. 23.5 n.d. n.d. n.d. n.d.Dittmar and Kattner (2003) 404–419 n.d 311 n.d 3100–3200 66 310–600 28–54Holmes et al. (2011) 427 57 1453 n.d. 4119 110 n.d. n.d.
Mackenzie Data4 285 16.8 464 1.5 1575 50.8 317 41Gordeev et al. (1996) 249 12.5 467 1.5 n.d. n.d. n.d. n.d.Dittmar and Kattner (2003) 249–333 n.d 470 n.d 1300 27 1800–2100 160–190
Holmes et al. (2011) 298 24 554 n.d. 1377 31 n.d. n.d.
Yukon Data5 204 19 644 1.9 1369 35.9 439 50Holmes et al. (2011) 208 24 694 n.d. 1472 47 n.d. n.d.
Pechora Data6 137 4.7 n.d. 4.0 n.d. n.d. n.d. n.d.Gordeev et al. (1996) 131 9.1 400 1.62 n.d. n.d. n.d. n.d.
Gordeev and Kravchishina (2009) 131 n.d n.d n.d 1666 n.d. 40 n.d.Dittmar and Kattner (2003) 135 n.d n.d n.d 2100 44 n.d. n.d.Holmes et al. (2000) 135 7.1 n.d. 4.2 n.d. n.d. n.d. n.d.
Northern Dvina Data7a 105 5.1 105 3.8 n.d. n.d. n.d. n.d.Data7b 105 5.1 n.d. 1.8 n.d. n.d. n.d. n.d.Gordeev et al. (1996) 110 9.2 388 2 n.d. n.d. n.d. n.d.Gordeev and Kravchishina (2009) 110 n.d. n.d. n.d. 1280 n.d. 28 n.d.Dittmar and Kattner (2003) 106 n.d. n.d. n.d. 1700 35 n.d. n.d.
Holmes et al. (2000) 105 6.7 n.d. 2 n.d. n.d. n.d. n.d.
Kolyma Data8a 103 3.7 n.d. 2.0 n.d. n.d. n.d. n.d.Data8b 103 4.0 212 0.6 651 17.3 81 13Gordeev et al. (1996) 132 3.7 248 1.22 n.d. 52.8 n.d. n.d.Gordeev and Kravchishina (2009) 122 n.d. n.d. n.d. 740 n.d. 380 n.d.Holmes et al. (2000) 70 2.5 n.d. 0.76 n.d. n.d. n.d. n.d.Dittmar and Kattner (2003) 71–98 n.d. n.d. n.d. 460–700 16 310 34Holmes et al. (2011) 111 5 276 n.d. 818 17 n.d. n.d.
Indigirka Data9 50 2.0 n.d. 0.35 n.d. n.d. n.d. n.d.Dittmar and Kattner (2003) 50 n.d. 0.7 n.d. 240–400 8.4 170 24Holmes et al. (2000) 50 2.3 n.d. 0.35 n.d. n.d. n.d. n.d.Gordeev et al. (1996) 61 1.7 80 0.4 n.d. 24.4 n.d. n.d.
1a discharge at Igarka, DIN/DOC/DON at Igarka;1b discharge at Igarka, DIN/DOC/DON at Dudinka (ca. 250 km downstream Igarka)2a discharge at Kyusur, DIN/DOC/DON at Zhigansk;2b discharge at Kyusur, DIN/DOC/DON at Kyusur (ca. 400 km downstream Zhigansk);2c discharge atStolb, DIN/DOC/DON near Stolb (delta ca. 520 km downstream Zhigansk)3 discharge at Salekhard, DIN/DOC/DON at Salekhard4 discharge at Red Arctic, DIN/DOC/DON at Tsiigehtchic5 discharge at Pilot Station, DIN/DOC/DON at Pilot Station6 discharge at Oksino, DIN/DOC/DON at Oksino7a discharge at Ust’ Pinega, DIN/DOC/DON at Ust’ Pinega;7b discharge at Ust’ Pinega, DIN/DOC/DON at Arkhangelsk (ca. 60 km downstream Ust’ Pinega)8a discharge at Kolymskoye, DIN/DOC/DON at Kolymskoye;8b discharge at Kolymskoye, DIN/DOC/DON at Cherskii (ca. 120 km downstream Kolymskoye)9 discharge at Vorontsovo, DIN/DOC/DON at Chokurdakh (ca. 100 km downstream Vorontsovo)
www.biogeosciences.net/10/1/2013/ Biogeosciences, 10, 1–17, 2013

8 V. Le Fouest et al.: The fate of riverine nutrients on Arctic shelves
Relative to the contribution of Bering Strait, the riverineflux of DIN and SRP into the polar mixed layer (PML) is mi-nor at the AO scale (Fig. 5). The combined nutrient flux fromthe 8 rivers (the Yukon was not accounted for as it pours outin the Bering Shelf) is in fact similar to that of the BarentsSea, except for silicate. Rivers account for only ca. 2 % and4 % of the total horizontal input of allochthonous nitrate andSRP in the surface layer, respectively, whereas their contribu-tion for silicate reaches ca. 11 %. As such, rivers and BeringStrait strikingly differ in their potential relative contributionto primary production (PP).
3.2 Contribution of riverine nutrients to shelf waterbiogeochemistry
SRP, nitrate and silicate are key nutrients needed by diatomsto grow and form blooms. Diatom blooms are responsiblefor new (i.e. nitrate-based) PP (PPnew) and for a majorityof this newly produced organic matter to the deep ocean.To assess the contribution of riverine nutrients to PPnew inthe AO, we used nutrient fluxes estimated as far as possibledownstream at stations where discharge and nutrient mea-surements coincided (Table 2). Note, however, that these lo-cations are hundreds of kilometres upstream from the estuar-ies. As such, the nutrient fluxes do not account for potentialremoval and enrichment processes occurring in the interven-ing transition zone (see Emmerton et al., 2008, and the dis-cussion in Tanks et al., 2011). The Lena River, for whichfluxes are based on measurements from the delta itself, is anexception. We converted the fluxes of phosphorus, nitrogenand silica into carbon equivalents (PPnewTS4) using a mo-lar C : N : P : Si consumption ratio of 112: 14 : 1 : 26 (Trem-blay et al., 2008). The resulting “potential” PPnew reflectshow much each nutrient and each advective source, whenconsidered separately, would contribute to AO new primaryproduction if all were converted into organic carbon throughphytoplankton growth (PPnew). However, since the elemen-tal ratios in source waters depart from the algal requirementsobserved during blooms, the lowest of the N-, P- or Si-basedestimate of carbon consumption is taken as an upper boundon overall PPnew. In other words, the first nutrient to be usedup limits PPnew in Liebig’s sense and the other nutrientsremain in excess. Utilization of these “leftovers” can occurwhere the source waters mix with waters in which other nu-trients are in excess. We compare our river-related PPnewestimates with PPnew values derived from total primary pro-duction rates and f-ratios obtained from field measurementsand reported in Sakshaug (2004) for the whole AO and itsancillary shelf seas.
The N : P molar flux ratio varies between seasons andrivers (Fig. 6). During the AO productive season (May toSeptember), the N : P molar flux ratio in the Yenisey, Ob,Pechora and Northern Dvina rivers is always below theN : P= 14 : 1 molar consumption ratio in shelf waters (Simp-son et al., 2008), but it can lie above the latter in the Lena,
Kolyma, Indigirka, Yukon and Mackenzie rivers. N : P mo-lar flux ratios below the N : P= 14 : 1 molar consumptionratio result from SRP or nitrate fluxes respectively higherand lower relative to those from their North American coun-terparts (Fig. 3), where nitrate exceeds SRP. In estuarieslike in the Mackenzie, SRP is removed in the river and nodissolved inorganic phosphate is supplied to marine waters(Macdonald and Yu, 2006). Hence, other sources of phos-phorus are needed for phytoplankton to consume the river-ine nitrate such as dissolved organic phosphorus and the ad-mixture of Pacific-derived waters enriched in SRP and sil-icate relative to nitrate (Yamamoto-Kawai et al., 2006). Inlate winter prior to the bloom period, SRP is present in ex-cess relative to nitrate in the high AO (N : P : Si= 4.2 : 1 : 13;from Canadian Arctic Shelf Exchange Study and Circum-polar Flaw Lead data) and in the Pacific waters flowingin through Bering Strait (N : P : Si= 5.5 : 1 : 16; from theWorld Ocean Atlas 2005, National Oceanographic Data Cen-tre, 2006). Integrated over January to March, the molarfluxes of nitrate and SRP entering the AO are respectively81× 109 mol N and 15× 109 mol P through the Bering Straitand 1.4× 10⁹ mol N and 0.1× 10⁹ mol P from rivers. If allnitrate supplied by the Bering Strait were taken up by phy-toplankton according to a molar consumption ratio of 14: 1,9.2× 109 mol P would remain in Pacific-derived waters. Theinorganic phosphorus present in Arctic shelf waters is thussufficient to support the total consumption of inorganic ni-trogen brought by rivers as well as Bering Strait.
On an annual basis, the mean riverine nitrate contributionto AO PPnew (< 0.83 %, Table 3) is small relative to that ofthe Bering Strait inflow (< 41.2 %), in accord with previousstudies (Gordeev et al., 1996; Tank et al., 2011). However,large differences are found across shelf seas (Fig. 7). Riverscontribute the least to PPnew in the Barents Sea (0.04 %),the Bering Shelf (0.11 %) and the East Siberian Sea (0.4 %),and the most in the White Sea (6.7 %). The Kara and theBeaufort seas show intermediate values (2.7–4.7 %). Ac-counting for the higher range of uncertainty relative to ni-trate concentrations makes this contribution to PPnew riseto 6.7–8.3 % in the White, Kara, Laptev and Beaufort seas.However, the 9 most important rivers taken into account inthis study only represent a fraction of the total continentalfreshwater flow into shelf seas. Using total (i.e. river andgroundwater) freshwater discharge estimates from literature,and assuming a proportional relationship with the mean ni-trate flux given in Table 2, we can provide a coarse esti-mate of how much PPnew might be supported in shelf seasif all continental inputs of fresh water were accounted for.The total discharge (river+ groundwater) is estimated to be1630 km3 yr−1, 802 km3 yr−1, and 267 km3 yr−1 in the Kara,Laptev and East Siberian seas, respectively (Gordeev et al.,1999). This is respectively 38 %, 60 % and 57 % more thanthe freshwater discharge by the Ob and Yenisey rivers, theLena River, and the Kolyma and Indigirka rivers. In the Beau-fort Sea, the Colville River, the second most important river
Ple
ase
note
the
rem
arks
atth
een
dof
the
man
uscr
ipt.
Biogeosciences, 10, 1–17, 2013 www.biogeosciences.net/10/1/2013/

V. Le Fouest et al.: The fate of riverine nutrients on Arctic shelves 9�
���
�����
�%�����2��� �
�����
� �����
Fig. 4.Monthly flux estimates of riverine POC and PON for the North American and Eurasian rivers.�
���
�����
�%�����2�����
� �����
Fig. 5. Annual lateral influx of SRP (109 g P), nitrate (109 g N) andsilicate (109 g Si) from Bering Strait, 8 circum-Arctic rivers (seetext for details) and the Barents Sea.
after the Mackenzie River (285 km3 yr−1), has a dischargeof ca. 15 km3 yr−1 (source: USGS). Accounting for the to-tal freshwater discharge in shelf seas, the mean riverine ni-trate contribution to PPnew would rise to 3.8 % (Kara Sea),5.4 % (Laptev Sea), 0.8 % (East Siberian Sea) and 5.3 %(Beaufort Sea) but would still remain relatively low. Nev-ertheless, it could be much larger at a local scale. Based onocean colour data, PPnew close to the mouth of the Macken-zie River would reach 0.24 Tg C yr−1 (S. Belanger, personalcommunicationCE4). Here, riverine nitrate would meet, onaverage, 37 % of phytoplankton nitrogen requirements. Note,however, that this contribution to PPnew is probably less thanestimated here since potential biological uptake in the estu-
arine transition zone (e.g. Emmerton et al., 2008) is not in-cluded in the calculation.
The Si : N molar flux ratio departs by one to two orders ofmagnitude from the molar Si : N ratio (1.8) of phytoplank-ton consumption estimated for the Mackenzie Shelf (Trem-blay et al., 2008) and Franklin Bay (Simpson et al., 2008)(Fig. 6). Using a Si : N ratio of 1.8, we assessed how muchriverine silicate would be removed by phytoplankton if theentire riverine nitrate pool were used for PPnew (Fig. 8). Forthe whole AO, 14.3 % of the riverine silicate would be re-moved. This percentage is lower in the East Siberian Sea,the Beaufort Sea, Bering Shelf and Kara Sea (9.7 %, 8.7 %,9.6 % and 11.4 %, respectively) and higher in the Laptev andWhite seas (24.5 % and 17.5 %, respectively). This explainswhy silicate behaves quasi-conservatively when riverine andoceanic waters mix in the coastal zone (Simpson et al., 2008,for the Beaufort Sea; Letolle et al., 1993, for the Laptev Sea).With respect to riverine SRP and using a molar N : P con-sumption ratio of 14: 1, 28.9 % of riverine SRP would beremoved by phytoplankton across the whole AO if riverinenitrate were fully consumed. The fraction of riverine SRPused by phytoplankton generally increases from the westernEurasian Basin (18.6 %, 21.2 % and 19.8 % in the Barents,White and Kara seas, respectively) towards its eastern coun-terpart (46 % and 38.4 % in the Laptev and Eastern Siberianseas, respectively) (Fig. 8). By contrast, on the North Ameri-can side, riverine SRP does not fulfil phytoplankton require-ments, and 1.6-fold and 1.8-fold more SRP, likely of oceanicorigin, are required to allow riverine nitrate to be fully con-sumed in the Bering Shelf and Beaufort Sea, respectively.Note that these estimates ignore other processes (e.g. bio-
www.biogeosciences.net/10/1/2013/ Biogeosciences, 10, 1–17, 2013

10 V. Le Fouest et al.: The fate of riverine nutrients on Arctic shelves�
���
�����
�%�����2��� �
� �����
Fig. 6. N : P (top panels) and Si : N (bottom panels) molar flux ratios computed from monthly flux estimates for the North American andEurasian rivers.
Table 3. Annual primary production (total (PP) and new (PPnew)), riverine nitrate flux, and contribution of riverine nitrate to new primaryproduction for the high Arctic Ocean and its river-influenced shelf seas. In the last three columns, the average (between brackets) is givenalong with the average± standard deviation.
PP (Tg C)∗ f-ratio∗ PPnew (Tg C)∗ Riverine nitrate flux Riverine nitrate flux Riverine nitrate PPnew(109g N) in carbon equivalent contribution to
(Tg C) (%)
High Arctic Ocean > 329 0.2 > 65.8 213.7–50.8 (97.7) 0.29–1.2 (0.55) < 0.44–1.8 (0.83)Barents Sea 136 0.5 68 9.6–2.5 (4.7) 0.01–0.05 (0.03) 0.01–0.07 (0.04)White Sea 2 0.24 0.48 6.4–2.8 (5.1) 0.02–0.04 (0.03) 4.2–8.3 (6.7)Kara Sea 37 0.24 8.9 112.8–19.9 (42.4) 0.11–0.64 (0.24) 1.2–7.2 (2.7)Laptev Sea 16 0.25 4 47.3–11.7 (23) 0.07–0.27 (0.13) 1.7–6.7 (3.2)East Siberian Sea 30 0.25 7.5 11.2–2.65 (5.7) 0.01–0.06 (0.03) 0.13–0.8 (0.4)Bering Shelf > 300 0.32 96 37.1–12.3 (19) 0.07–0.21 (0.11) 0.07–0.22 (0.11)Beaufort Sea 8 0.24 1.9 26.4–11.3 (16.8) 0.06–0.15 (0.09) 3.1–7.9 (4.7)
∗ From Sakshaug (2004).
logical uptake, transfer of SRP to the sediment via chemi-cal reactions with iron), which may influence concentrationsalong the river–coastal ocean transition zone (Macdonald andYu, 2006). Nevertheless, our result is consistent with the highSRP removal reported in the estuarine transition zone (Em-merton et al., 2008) of the Mackenzie River in the BeaufortSea.
So far our analysis ignored the seasonality of riverinefluxes with respect to primary production. The general pic-ture in our data is that the riverine inorganic flux peaks dur-ing the phytoplankton bloom period occurring in May–Junein Arctic shelf waters. The bloom accounts for ca. 55 % ofannual PP (Pabi et al., 1998) and is mostly sustained by ni-trate (f-ratio ca. 0.7; e.g. Le Fouest et al., 2011). In sum-
mer when phytoplankton face nitrogen or silica limitation(Walsh and McRoy, 1986; Reigstad et al., 2002; Simpsonet al., 2008), PP represents ca. 45 % of annual PP (Pabi etal., 1998TS5) and it is mostly regenerated (f-ratio ca. 0.2;e.g. Le Fouest et al., 2011, 2012). Here we assessed the ef-fect of seasonality for the Mackenzie Shelf, where the in-flowing Mackenzie River shows one of the highest annualdischarge and riverine nitrate contribution to PPnew (Ta-bles 2 and 3). In this analysis, the contribution of river-ine nitrate to PPnew is only 0.92 % (0.028 Tg C) during thebloom (total of 3.1 Tg C) but rises to 5.5 % (0.04 Tg C) inJuly–October (total of 0.72 Tg C). The corresponding propor-tions of riverine silicate needed to fully consume riverine ni-trate would be 14.5 % (0.634× 10⁹ mol Si) during the bloom,
Ple
ase
note
the
rem
arks
atth
een
dof
the
man
uscr
ipt.
Biogeosciences, 10, 1–17, 2013 www.biogeosciences.net/10/1/2013/

V. Le Fouest et al.: The fate of riverine nutrients on Arctic shelves 11�
���
�����
�%�����2��� �
� �����
Fig. 7.Contribution of riverine nitrate to new primary production.�
���
�����
�%�����2�����
�����
Fig. 8. Fraction of riverine SRP and silicate consumed by phyto-plankton in case all riverine nitrate is taken up. Note there were nosilicate data for the Pechora River (Barents Sea).
decreasing to 9.6 % (0.905× 10⁹ mol Si) afterwards. SRP in-puts from the Mackenzie River are not sufficient for phyto-plankton to fully take up riverine nitrate. More SRP, likelyof oceanic origin, would be required in a larger quantity inJuly–October (56 %, 0.013× 10⁹ mol P) than in May–June(48 %, 0.008× 10⁹ mol P). While riverine nitrate potentiallycontributes more to summer PPnew, the effect must be con-fined to surface waters due to the strong seasonal stratifica-tion (e.g. Li et al., 2009) and isolated from the productivedeep-chlorophyll maximum responsible for most of summerPP. In this respect, riverine nutrient contributions would belimited to the spring bloom period. A possible mismatch be-tween river floods and shelf blooms (e.g. Kahru et al., 2010)might not affect shelf blooms’ intensity owing to the smallcontribution of terrigenous nutrients.
The summer season is characterized by the highest river-ine inputs of dissolved and particulate organic matter (Figs. 3and 4). In the Ob, Yenisey, Lena, Kolyma and Mackenzierivers, the mean DOC : POC mass flux ratio lies in the range
of 2.8–24.2 between July and October indicating the pre-dominant contribution of DOC versus POC to the organiccarbon flux. Conversely, the lower DON : PON mass fluxratio (0.5–4.3) suggests a higher contribution of PON thanDON to the organic nitrogen flux. The potential contribu-tion of riverine PON as a significant source of inorganic ni-trogen available for phytoplankton growth is, however, lim-ited. The POC : PON molar ratio averaged for July–Augustfor the Ob, Yenisey, Lena, Kolyma and Mackenzie riversis ca. 9.1, which is higher than the bacterial C : N molarratio (5–7; Anderson and Williams, 1998; Fukuda et al.,1998). Higher POC : PON molar ratios would promote ni-trogen limitation of bacteria attached on riverine particles.As a consequence, the nitrogen resulting from riverine PONdegradation would rather be consumed by bacteria than byoceanic phytoplankton. Measurements made during the Ma-lina project in summer 2009 in the Beaufort Sea showed thatPON could also be photo-degraded into ammonium under theaction of the ultraviolet radiation (photoammonification pro-cess). Nevertheless, the ammonium hereby photo-produced(ca. 0.002 mmol N m−2 d−1 in August; Xie et al., 2012) inthe upper 10 m is negligible with respect to phytoplanktonnitrogen demand for PP (> 0.1 mmol N m−2 d−1 from dataof the summer 2009 Malina cruise).
Riverine DON is another substantial source of nitrogenfor AO shelf waters (Table 2; see also Holmes et al. 2011).When summing the total riverine fluxes for the Yenisey,Lena, Ob, Mackenzie and Kolyma rivers, the input of DON(33.7× 10⁹ mol N yr−1) is ca. 5-fold higher than the corre-sponding input of riverine nitrate (6.8× 10⁹ mol N yr−1). Butthe relative contribution of DON varies amongst rivers. Forinstance, the DON flux is 7-fold higher than the flux of ni-trate in the Laptev Sea but only 3-fold higher in the BeaufortSea. The labile fraction of DON is reported to vary from 30to 40 % in river water (Dittmar et al., 2001; Stepanauskas etal., 2002) to less than 10 % in marine water (Jørgensen et al.,1999; Dittmar et al., 2001). Labile terrigenous DON is ac-tively degraded by marine bacteria (Jørgensen et al., 1999),whereas the refractory pool is either exported to the deepocean (Dittmar, 2004) or photoammonified and subsequentlyused by bacteria and phytoplankton (Vahatalo et al., 2011;Le Fouest et al., 2012). Xie et al. (2012; this issue) estimatedthat ca. 16 % of the total refractory DON in surface waters ofthe Beaufort Sea was potentially photoammonified betweenJune and August. From the data, ca. 70 % of the combinedsupply of DON (i.e. 23.4× 10⁹ mol N) from the Ob, Yenisey,Lena, Kolyma and Mackenzie rivers takes place betweenJune and August. Applying this rate to this flux, rivers couldindirectly supply 3.9× 10⁹ mol N in the form of photochemi-cally produced ammonium, which is fairly comparable to thedissolved inorganic nitrogen that could be produced throughmicrobial degradation of riverine DON (e.g. Letscher et al.,2013). This photochemically produced ammonium exceedsthe riverine nitrate flux in summer for the same 5 rivers(ca. 2.8× 10⁹ mol N for the June–August period from the
www.biogeosciences.net/10/1/2013/ Biogeosciences, 10, 1–17, 2013

12 V. Le Fouest et al.: The fate of riverine nutrients on Arctic shelves
monthly flux estimates). For comparison, the June–Augustriverine ammonium flux summed up for the same 5 riversis only 0.6× 10⁹ mol N. Photoammonification of refractoryriverine DON is potentially a greater source of nitrogen forphytoplankton production than the direct combined supplyof nitrate and ammonium by rivers. In the Beaufort Sea,the photochemical production of ammonium from refractoryDON would support directly (through phytoplankton uptake)and indirectly (through food web remineralization) 60 % ofthe total pelagic primary production within the top 10 m ofthe water column (Le Fouest et al., 2012).
If all the ammonium photo-produced in summer(3.9× 10⁹ mol N) were to be consumed by phytoplanktonin shelf waters, the remaining stock of dissolved inorganicphosphorus would be 8.92× 10⁹ mol P. Even with a pro-jected 50 % increase of riverine DON and nitrate in responseto global warming (Frey et al., 2007; McClelland et al.,2007), there would still be sufficient SRP (8.05× 10⁹ mol P)in shelf waters to sustain the consumption of nitrogen derivedfrom this pool. The sum of the ammonium photo-produced insummer (3.9× 10⁹ mol N) and the annual riverine influx ofammonium (3.5× 10⁹ mol N) and nitrate (6.8× 10⁹ mol N)gives an estimated DIN input of 14.2× 10⁹ mol N in coastalwaters. Assuming no change in the input of SRP and ni-trate from Bering Strait or SRP from rivers, a 9-fold increaseof riverine DIN supply would be necessary to enable phy-toplankton to consume all the SRP present in shelf watersand induce a shift from a nitrogen-limited PP regime to aphosphorus-limited PP regime. These results support the hy-pothesis of Tremblay and Gagnon (2009) that primary pro-duction is nitrogen-limited in the AO and is likely to remainthat way in the face of rapid physical changes in the environ-ment.
4 Concluding remarks
In this study we compiled historical measurements of dis-solved inorganic nutrients (nitrate, SRP and silicate) and dis-solved and particulate organic (carbon and nitrogen) matterfrom the 9 most important rivers in terms of annual dis-charge. We used these data to compute monthly averagedconcentrations (given in the appendix) and annual fluxes.
From these data, several key points can be emphasized:
1. On an annual basis, the regional contribution of river-ine nitrate to AO PPnew lies between< 1 % and 6.7 %.Nevertheless, this contribution is negligible at the pan-Arctic scale (< 0.83 %). This result is in line with pre-vious studies (Gordeev et al., 1996; Tank et al., 2012).
2. Only 14.3 % of the riverine silicate would be removedby phytoplankton at the Arctic scale (8.7–24.5 % re-gionally) if all riverine nitrate were consumed.
3. Excluding estuarine removal processes from the calcu-lations, 28.9 % of the riverine SRP would be removed
by phytoplankton at the Arctic scale (18.6–46 % region-ally) assuming all riverine nitrate was consumed. A totalof 1.6-fold and 1.8-fold more SRP from sources otherthan riverine are required in the Bering Shelf and Beau-fort Sea, respectively.
4. On a seasonal basis, the removal of riverine nitrate, sili-cate and SRP would be the highest in spring and not insummer when AO shelf waters are nitrogen-limited.
5. The AO will likely remain nitrogen-limited even whenconsidering projected increases in the supply of river-ine dissolved inorganic and organic nitrogen. A 9-foldincrease of riverine DIN supply would be necessary toinduce a shift from a nitrogen-limited PP regime to aphosphorus-limited PP regime.
Setting biogeochemical conditions at river points in pan-Arctic physical–biological models is relevant in a contextof increasing river discharge (Shiklomanov and Lammers,2011) and permafrost melt (Frey and Smith, 2005) result-ing from the Arctic warming. River discharge accounts forca. 38 % of the Arctic freshwater budget (Serreze et al., 2006)and is equivalent to a 0.5 m layer made of riverine fresh wa-ter in the PML (ca. 50 m in average). This fresh waterCE5
spreads onto the continental plateau, which makes up 53 %of the total surface area of the AO and ensures ca. 80 % oftotal AO PP (Sakshaug, 2004). In addition, there is someevidence of an increase in riverine nitrate concentration perunit of discharge in the western Arctic (McClelland et al.,2007), and future projections suggest that riverine nutrient in-puts will increase substantially by the end of this century. InWest Siberia, predicted warming has been linked to a prob-able increase of riverine total dissolved nitrogen and DONby 30–50 % and 32–53 %, respectively (Frey and al., 2007).Nevertheless, more data relative to Arctic rivers DON andDOC lability and trophic pathways (e.g. balance between au-totrophic and heterotrophic processes) are needed to accu-rately assess their effect on shelf biogeochemistry (e.g. Mc-Clelland et al., 2012). Dissolved silica mobilization into theNorth American Arctic river system is also projected to in-crease between 35 % and 70 % (Moosdorf et al., 2010), butit might impact new primary production in North Atlanticwaters rather than the Arctic waters. This analysis under-scores the need to better contrast oceanic nutrient supply pro-cesses (i.e. mixing, upwellings and mesoscale activity) withthe composition and fate of changing riverine nutrient de-liveries in future scenarios of plankton community structure,function and production in the coastal AO.
Supplementary material related to this article isavailable online at:http://www.biogeosciences.net/10/1/2013/bg-10-1-2013-supplement.pdf.
Ple
ase
note
the
rem
arks
atth
een
dof
the
man
uscr
ipt.
Biogeosciences, 10, 1–17, 2013 www.biogeosciences.net/10/1/2013/

V. Le Fouest et al.: The fate of riverine nutrients on Arctic shelves 13
Appendix A
Table A1. Monthly-binned riverine concentrations of nitrate (mmol N m−3). Linearly interpolated values are shown in italicTS6
Jan Feb Mar Apr May Jun Jul Aug Sep Oct Nov Dec
Northern Dvinaa 7.8 17.1 16.4 21.5 1.6 1.2 1.0 0.9 1.0 1.0 2.2 4.7Northern Dvinab 7.4 14.1 14.6 16.6 2.0 0.8 1.3 1.6 1.3 1.7 3.6 8.8Pechora 8.0 14.8 12.3 12.8 2.9 1.6 0.7 1.1 1.0 1.7 2.9 3.0Yeniseyc 0.8 0.7 18.2 12.1 6.5 1.1 1.0 1.0 1.1 1.1 1 0.9Yeniseyd 12.1 14 15.9 5.6 4.2 2.0 1.4 1.0 1.2 1.8 8.310.2Ob 7.8 9.4 10.7 7.9 10.7 3.8 1.0 1.1 1.3 3.6 3.5 7.4Lenae 9.8 12.4 15.1 16.0 4.3 1.4 1.2 1.0 1.7 2.4 4.5 7.2Lenaf 4.2 5.1 6.1 7.0 8.0 3.1 1.1 1.7 1.2 1.3 2.3 3.2Lenag 3.6 4.1 4.7 5.3 9.5 1.3 1.6 2.9 1.8 2.4 3.0Indigirka 5.6 6.8 8.1 9.3 4.8 4.5 1.4 2.7 2.7 1.9 3.1 4.4Kolymah 7.4 9.0 10.7 6.5 4.7 2.8 1.5 2.1 2.0 2.4 4.1 5.7Kolymai 4.0 4.6 5.3 6.0 5.0 2.4 4.1 1.7 2.2 2.4 2.6 3.3Yukon 13.4 14.8 16.1 13.7 7.7 5.0 5.3 4.4 8.3 5.0 7.8 10.6Mackenzie 6.2 6.7 7.3 5.7 4.1 3.7 3.4 3.3 3.9 4.5 5.0 5.6
a Ust’ Pinega;b Arkhangelsk;c Igarka;d Dudinka;e Zhigansk;f Kyusur;g Stolb;h Kolymskoye;i Cherskii
Table A2. Monthly-binned riverine concentrations of SRP (mmol P m−3). Linearly interpolated values are shown in italic.
Jan Feb Mar Apr May Jun Jul Aug Sep Oct Nov Dec
Northern Dvinaa 1.21 1.24 1.52 1.36 1.36 1.01 0.90 0.89 0.98 0.84 0.92 1.33Northern Dvinab 0.58 0.74 0.90 0.86 0.44 0.42 0.42 0.65 0.53 0.50 0.89 0.70Pechora 1.54 1.19 1.29 0.98 1.20 0.69 0.88 0.95 0.91 1.12 1.02 1.09Yeniseyc 0.60 0.58 1.10 1.69 0.88 0.86 0.60 0.80 0.62 0.670.65 0.63Yeniseyd 0.19 0.21 0.22 0.23 0.38 0.33 0.28 0.26 0.30 0.33 0.170.18Ob 1.23 1.86 2.49 2.83 1.09 0.78 1.92 1.98 2.77 1.771.19 0.60Lenae 0.24 0.24 0.24 0.23 0.23 0.25 0.26 0.27 0.26 0.26 0.25 0.25Lenaf 0.23 0.24 0.24 0.24 0.24 0.43 0.21 0.18 0.25 0.23 0.23 0.23Lenag 0.44 0.42 0.40 0.38 0.39 0.38 0.37 0.56 1.30 0.49 0.47 0.45Indigirka 0.32 0.31 0.29 0.28 0.26 0.20 0.14 0.24 0.37 0.37 0.35 0.34Kolymah 0.21 0.18 0.16 0.14 0.35 0.95 0.33 0.58 0.49 0.270.25 0.23Kolymai 0.07 0.06 0.06 0.06 0.24 0.18 0.17 0.23 0.22 0.10 0.070.07Yukon 0.17 0.32 0.46 0.22 0.18 0.30 0.20 0.14 0.290.52 0.74 0.97Mackenzie 0.11 0.11 0.11 0.14 0.37 0.27 0.25 0.18 0.14 0.14 0.13 0.12
a Ust’ Pinega;b Arkhangelsk;c Igarka;d Dudinka;e Zhigansk;f Kyusur;g Stolb;h Kolymskoye;i Cherskii
Table A3. Monthly-binned riverine concentrations of silicate (mmol Si m−3). Linearly interpolated values are shown in italic.TS7
Jan Feb Mar Apr May Jun Jul Aug Sep Oct Nov Dec
Northern Dvinaa 48.3 57.9 71.4 57.8 33.0 34.5 28.3 21.6 22.5 32.0 37.8 51.5Yeniseyb 128.2 155.0 40.7 46.4 45.5 39.3 43.8 49.2 55.8 47.874.6 101.4Yeniseyc 109.1 110.2 111.4 98.6 85.9 73.1 87.0 97.2 118.2 132.6 106.7107.9Ob 34.1 98.2 121.4 121.5 54.1 40.9 29.5 28.4 43.4 45.4 57.045.6Lenad 129.7 125.8 121.9 132.5 58.0 60.4 71.3 82.1 94.9 107.6 137.5 133.6Lenae 31.5 30.6 29.6 28.7 27.7 14.4 27.4 20.3 31.3 34.4 33.4 32.5Lenaf 34.1 37.7 41.3 44.9 27.3 23.7 20.1 23.4 31.7 23.2 26.8 30.4Kolymag 121.9 125.8 129.8 133.7 12.7 47.0 92.4 89.1 97.3105.7 114.0 117.9Yukon 192.4 200 205.3 202.6 80.6 68.6 105.7 112.2 120.7 133.0160.9 188.7Mackenzie 69.3 76.7 72.3 63.9 44.9 51.3 61.1 60.9 59.1 58.1 60.8 68.3
a Ust’ Pinega;b Igarka;c Dudinka;d Zhigansk;e Kyusur; f Stolb;g Cherskii
www.biogeosciences.net/10/1/2013/ Biogeosciences, 10, 1–17, 2013

14 V. Le Fouest et al.: The fate of riverine nutrients on Arctic shelves
Table A4. Monthly-binned riverine concentrations of DON (mmol N m−3). Linearly interpolated values are shown in italic.
Jan Feb Mar Apr May Jun Jul Aug Sep Oct Nov Dec
Yeniseya 6.6 5.5 4.5 10.0 15.5 21.0 20.1 13.8 12.3 14.8 8.6 7.6Ob 18.0 14.4 10.7 7.1 20.0 19.1 25.6 25.0 21.7 15.5 14.1 21.6Lenab 14.9 14.1 13.3 8.7 22.0 31.2 21.8 12.4 11.5 10.6 16.5 15.7Kolymac 6.0 5.0 4.1 3.1 23.3 17.6 4.5 8.7 10.2 9.1 7.9 6.9Yukon 7.9 8.4 8.9 7.1 20.6 17.6 11.1 9.1 10.6 9.9 9.3 8.6Mackenzie 8.2 8.2 8.3 16.6 24.9 17.9 10.1 8.7 7.9 8.0 8.0 8.1
a Dudinka;b Zhigansk;c Cherskii
Table A5. Monthly-binned riverine concentrations of DOC (mmol C m−3). Linearly interpolated values are shown in italic.
Jan Feb Mar Apr May Jun Jul Aug Sep Oct Nov Dec
Yeniseya 300 282 265 452 640 827 753 465 441 583 334 317Ob 609 612 616 458 589 696 942 857 849 708 889 605Lenab 692 696 700 558 946 1252 915 577 583 589 684 688Kolymac 212 218 223 311 456 797 463 316 312 310 307 196Yukon 245 241 234 219 842 759 464 382 459 710555 400Mackenzie 368 373 379 560 740 559 403 381 345 351 356 362
a Dudinka;b Zhigansk;c Cherskii
Table A6. Monthly-binned riverine concentrations of PON (mmol N m−3). Linearly interpolated values are shown in italic.
Jan Feb Mar Apr May Jun Jul Aug Sep Oct Nov Dec
Yeniseya 1.86 1.74 1.62 2.62 3.61 4.61 4.73 4.12 3.94 3.45 2.21 1.98Ob 2.93 3.98 5.03 8.61 21.50 18.78 17.06 18.87 13.25 12.887.38 1.87Lenab 1.46 1.15 0.70 1.34 11.39 16.55 14.23 10.64 11.47 7.25 1.85 1.56Kolymac 3.30 4.29 5.29 6.29 8.42 10.56 9.10 9.83 8.21 4.75 1.30 2.30Yukon 3.42 2.94 2.45 3.74 22.04 18.86 24.08 21.24 15.6312.58 9.52 6.47Mackenzie 3.26 2.93 2.60 8.25 13.91 19.56 13.40 7.68 4.57 4.24 3.91 3.58
a at Dudinka;b at Zhigansk;c at Cherskii
Table A7. Monthly-binned riverine concentrations of POC (mmol C m−3). Linearly interpolated values are shown in italic.
Jan Feb Mar Apr May Jun Jul Aug Sep Oct Nov Dec
Yeniseya 16.7 15.6 14.4 23.2 32.0 40.8 49.1 24.3 26.3 24.1 19.1 17.9Ob 56.7 59.3 61.9 93.5 207.5 160.3 130.8 114.1 97.4 71.9 63.0 54.1Lenab 13.5 10.7 6.5 13.3 135.0 187.0 155.0 90.3 72.5 58.9 16.8 14.2Kolymac 27.7 34.3 40.9 47.5 126.7 77.6 53.9 56.5 59.737.1 14.5 21.1Yukon 47.6 37.8 27.9 50.9 283.7 200.0 257.2 255.8 94.682.9 71.1 59.4Mackenzie 30.1 29.7 29.3 77.0 124.6 172.3 145.1 58.8 31.7 31.3 30.9 30.5
a at Dudinka;b at Zhigansk;c at Cherskii
Acknowledgements.VLF also acknowledges support from theEuropean Space Agency and the Centre national d’etudes spatiales(CNES) as part of the MALINACE6 project, funded by the Institutnational des sciences de l’univers – Centre national de la recherchescientifique (CYBER/LEFE and PICS programmes), the Agencenationale de la recherche and the CNES. MB is supported by theCanada Excellence Research Chair in “Remote sensing of Canada’snew Arctic frontier”. JET is supported by the National Science
and Engineering Research Council of Canada (NSERC) and theArcticNet Network of Canadian Centres of Excellence. The authorswish to thank J. Finlay, R. M. Holmes, A. V. Savenko and S. Tankfor having kindly provided nutrient data.
Edited by: W. Miller
Ple
ase
note
the
rem
arks
atth
een
dof
the
man
uscr
ipt.
Biogeosciences, 10, 1–17, 2013 www.biogeosciences.net/10/1/2013/

V. Le Fouest et al.: The fate of riverine nutrients on Arctic shelves 15
The publication of this articleis financed by CNRS-INSU.
References
Anderson, T. R. and Le B. Williams, P. J.: Modelling the seasonalcycle of dissolved organic carbon at Station E1 in the EnglishChannel, Estuar. Coast. Shelf S., 46, 93–109, 1998.
Arrigo, K. R., van Dijken, G., and Pabi, S.: Impact of a shrinkingArctic ice cover on marine primary production, Geophys. Res.Lett., 35, 10.1029/2008GL035028, 2008.
Bates, N. R. and Mathis, J. T.: The Arctic Ocean marine carboncycle: evaluation of air-sea CO2 exchanges, ocean acidificationimpacts and potential feedbacks, Biogeosciences, 6, 2433–2459,doi:10.5194/bg-6-2433-2009, 2009.
de Mendiburu, F.: agricolae: Statistical Procedures for AgriculturalResearch, R package version 1.1–3,http://CRAN.R-project.org/package=agricolae, 2012.
Dittmar, T.: Evidence for terrigenous dissolved organic nitrogen inthe Arctic deep sea, Limnol. Oceanogr., 49, 148–156, 2004.
Dittmar, T. and Kattner, G.: The biogeochemistry of the river andshelf ecosystem of the Arctic Ocean: A review, Mar. Chem., 83,103–120, 2003.
Dittmar, T., Fitznar, H. P., and Kattner, G.: Origin and biogeochem-ical cycling of organic nitrogen in the eastern Arctic Ocean asevident from D- and L-amino acids, Geochim. Cosmochim. Ac.,65, 4103–4114, 2001.
Durr, H. H., Meybeck, M., Hartmann, J., Laruelle, G. G., andRoubeix, V.: Global spatial distribution of natural riverine sil-ica inputs to the coastal zone, Biogeosciences, 8, 597–620,doi:10.5194/bg-8-597-2011, 2011.
Emmerton, C. A., Lesack, L. F. W., and Vincent, W. F.: Nutrient andorganic matter patterns across the Mackenzie River, estuary andshelf during the seasonal recession of sea-ice, J. Marine Syst.,74, 741–755, doi:10.1016/j.jmarsys.2007.10.001, 2008.
English, T. S.: Some biological oceanographic observations in theCentral North Polar Sea, Drift Station Alpha, 1957–1958, ArcticInst. N. Am. Res. Pap. 13, 64 pp., 1961.
Finlay, J., Neff, J., Zimov, S., Davydova, A., and Davy-dov, S.: Snowmelt dominance of dissolved organic carbonin high-latitude watersheds: Implications for characterizationand flux of river DOC, Geophys. Res. Lett., 33, L10401,doi:10.1029/2006GL025754, 2006.
Frey, K. E. and McClelland, J. W.: Impacts of permafrost degrada-tion on arctic river biogeochemistry, Hydrol. Process., 23, 169–182, doi:10.1002/hyp.7196, 2009.
Frey, K. E. and Smith, L. C.: Amplified carbon release fromvast West Siberian peatlands by 2100, Geophys. Res. Lett., 32,L09401, doi:10.1029/2004GL022025, 2005.
Frey, K. E, McClelland, J. W., Holmes, R. M., and Smith, L. C.:Impacts of climate warming and permafrost thaw on the riverinetransport of nitrogen and phosphorus to the Kara Sea, J. Geophys.Res.-Biogeo., 112, G04S58, doi:10.1029/2006JG000369, 2007.
Fukuda, R., Ogawa, H., Nagata, T., and Koike, I.: Direct determi-nation of carbon and nitrogen contents of natural bacterial as-semblage in marine environments, Appl. Environ. Microbiol., 64,3352–3358, 1998.
Gordeev, V. V. and Kravchishina, M. D.: River flux of dissolved or-ganic carbon (DOC) and particulate organic carbon (POC) to theArctic Ocean: what are the consequences of the global changes?,in: Influence of Climate Change on the Changing Arctic and Sub-Arctic Conditions, edited by: Nihoul, J. C. J. and Kostianoy, A.G., Springer Science+ Buisiness Media B. V., 145–160, 2009.
Gordeev, V. V., Martin, J. M., Sidorov, I. S., and Sidorova, M. V.:A reassessment of the Eurasian river input of water, sediment,major elements, and nutrients to the Arctic Ocean, Am. J. Sci.,296, 664–691, 1996.
Gustafsson,O., van Dongen, B. E., Vonk, J. E., Dudarev, O. V.,and Semiletov, I. P.: Widespread release of old carbon acrossthe Siberian Arctic echoed by its large rivers, Biogeosciences,8, 1737–1743, doi:10.5194/bg-8-1737-2011, 2011.
Hannah, C. G., Dupont, F., and Dunphy, M.: Polynyas and tidalcurrents in the Canadian Arctic Archipelago, Arctic, 62, 83–95,2009.
Holmes, R. M., Peterson, B. J., Gordeev, V. V., Zhulidov, A. V.,Meybeck, M., Lammers, R. B., and Vorosmarty, C. J.: Flux ofnutrients from Russian rivers to the Arctic Ocean: Can we es-tablish a baseline against which to judge future changes?, WaterResour. Res., 36, 2309–2320, 2000.
Holmes, R. M., Peterson, B. J., Zhulidov, A. V., Gordeev, V. V.,Makkaveev, P. N., Stunzhas, P. A., Kosmenko, L. S., Kohler,G. H., and Shiklomanov, A. I.: Nutrient chemistry of the Oband Yenisey Rivers, Siberia: results from June 2000 expeditionand evaluation of long-term data sets, Mar. Chem., 75, 219–227,2001.
Holmes, R. M., McClelland, J. W., Peterson, B. J., Tank, S. E., Bu-lygina, E., Eglinton, T. I., Gordeev, V. V., Gurtovaya, T. Y., Ray-mond, P. A., Repeta, D. J., Staples, R., Stiegl, R. G., Zhulidov,A. V., and Zimov, S. A.: Seasonal and annual fluxes of nutri-ents and organic matter from large rivers to the Arctic Oceanand surrounding seas, Estuar. Coast, doi:10.1007/s12237-011-9386.6, 2011.TS8 TS9
Ingvaldsen, R. B., Asplin, L., and Loeng, H.: The seasonalcycle in the Atlantic transport to the Barents Sea dur-ing the years 1997–2001, Cont. Shelf. Res., 24, 1015–1032,doi:10.1016/j.csr.2004.02.011, 2004.
Jørgensen, N. O. G., Tranvik, L. J., and Berg, G. M.: Occurrenceand bacterial cycling of dissolved nitrogen in the Gulf of Riga,the Baltic Sea, Mar. Ecol.-Prog. Ser., 191, 1–18, 1999.
Kahru, M., Brotas, V., Manzano-Sarabia, M., and Mitchell, B.G.: Are phytoplankton blooms occurring earlier in the Arc-tic?, Glob. Change Biol., 17, 1733–1739, doi:10.1111/j.1365-2486.2010.02312.x, 2011.
Lara, R. J., Rachold, V., Kattner, G., Hubberten, H. W., Guggen-berger, G., Skoog, A., and Thomas, D.: Dissolved organic matterand nutrients in the Lena River, Siberian arctic: Characteristicsand distribution, Mar. Chem., 59, 301–309, 1998.
Le Fouest, V., Postlethwaite, C., M. Morales Maqueda, A.,Belanger, S., and Babin, M.: On the role of tides and strong windevents in promoting summer primary production in the BarentsSea, Ocean Sci., 7, 203–217, doi:10.5194/os-7-203-2011, 2011.
Ple
ase
note
the
rem
arks
atth
een
dof
the
man
uscr
ipt.
www.biogeosciences.net/10/1/2013/ Biogeosciences, 10, 1–17, 2013
16 V. Le Fouest et al.: The fate of riverine nutrients on Arctic shelves
Le Fouest, V., Zakardjian, B., Xie, H., Raimbault, P., Joux, F.,and Babin, M.: Plankton ecosystem functioning and nitrogenfluxes in the most oligotrophic waters of the Beaufort Sea, ArcticOcean: a modeling study, Biogeosciences Discuss., 9, 14751–14793, doi:10.5194/bgd-9-14751-2012, 2012.
Letolle, R., Martin, J. M., Thomas, A. J., Gordeev, V. V., Gusarova,S., and Sidorvo, I. S.:18O abundance and dissolved silicate inthe Lena delta and Laptev Sea (Russia), Mar. Chem. 43, 47–64,1993.
Letscher, R. T., Hansell, D. A., Kadko, D., and Bates, N. R.: Dis-solved organic nitrogen dynamics in the Arctic Ocean, Mar.Chem., 148, 1–9, doi:0.1016/j.marchem.2012.10.002,TS10
Li, W. K. W., McLaughlin, F. A., Lovejoy, C., and Carmack, E. C.:Smallest algae thrive as the Arctic Ocean freshens, Science, 326,539, 2009.TS11
Macdonald, R. W. and Yu, Y.: The Mackenzie Estuary of the ArcticOcean, in: Water Pollution: Estuaries, edited by: Wangersky, P.J., 5, Springer-Verlag, Heidelberg, 305 pp., 2006.
Macdonald, R. W., Iseki, K., O’Brien, M. C., McLaughlin, F. A.,McCullough, D., Macdonald, D. M., Carmack, E. C., Adams,H., Yunker, M., Miskulin, G., and Buckingham, S.: NOGAPB.6; Volume 5: chemical data collected in the Beaufort Sea andMackenzie river delta, March–July 1987, Can. Data Rep. Hy-drogr. Ocean Sci., 60, p. 103, 1987.
Manizza, M., Follows, M. J., Dutkiewicz, S., McClelland, J. W.,Menemenlis, D., Hill, C. N., Townsend-Small, A., and Peter-son, B. J.: Modeling transport and fate of riverine dissolved or-ganic carbon in the Arctic Ocean, Global Biogeochem. Cy., 23,GB4006, doi:10.1029/2008GB003396, 2009.
McClelland, J. W., Stieglitz, M., Pan, F., Holmes, R. M., and Peter-son, B. J.: Recent changes in nitrate and dissolved organic carbonexport from the upper Kuparuk River, North Slope, Alaska, J.Geophys. Res., 112, G04S60, doi:10.1029/2006JG000371, 2007.
McClelland, J. W., Holmes, R. M., Peterson, B. J., Amon, R.,Brabets, Cooper, T., L., Gibson, J., Gordeev, V. V., Guay,C., Milburn, D., Staples, R., Raymond, P. A., Shiklomanov,I., Striegl, R., Zhulidov, A., Gurtovaya, T., and Zimov, S.:Development of a panarctic Database for River Chemistry,EOS, Transactions American Geophysical Union, 89, 217TS12,doi:10.1029/2008EO240001, 2008.
McClelland, J. W., Holmes, R. M., Dunton, K. H., and Macdonald,R. W.: The Arctic Ocean estuary, Estuar. Coast., 35, 353–368,doi:10.1007/s12237-010-9357-3, 2012.
Millot, R., Gaillardet, J., Dupre, B., and Allegre, C. J.: Northern lat-itude chemical weathering rates; clues from the Mackenzie Riverbasin, Canada, Geoch. Cosmoch. Ac., 67, 1305–1329, 2003.
Moosdorf, N., Hartmann, J., and Lauerwald, R.: Changes in dis-solved silica mobilization into river systems draining NorthAmerica until the period 2081–2100, J. Geochem. Explor.,doi:10.1016/j.explo.2010.09.001, 2010.TS13TS14
Mundy, C. J., Gosselin, M., Ehn, J., Gratton, Y., Rossnagel, A., Bar-ber, D. Martin, G., J., Tremblay, J.-E., Palmer, M., Arrigo, K.,Damis, G., Fortier, L., Else, B., and Papakyriakou, T.: Contribu-tions of under-ice primary production to an ice-edge upwellingphytoplankton bloom in the Canadian Beaufort Sea, Geophys.Res. Let., 36, L17601, doi:10.1029/2009GL038837, 2009.
National Oceanographic Data Centre World Ocean Atlas 2005:Documentation accompanying WOA05 DVD (ASCII text andportable document format). Prepared by the Ocean Climate Lab-
oratory, National Oceanographic Data Center, Silver Springs,MD 20910, 12 pp, 2006.
Opsahl, S., Benner, R., and Amon, R. M. W.: Major flux of terrige-nous dissolved organic matter through the Arctic Ocean, Limnol.Oceanogr., 44, 2017–2023, 1999.
Pabi, S., van Dijken, G. L., and Arrigo, K. R.: Primary productionin the Arctic Ocean, 1998–2006, J.Geophys.Res., 113, C08005,doi:10.1029/2007JC004578, 2008.
R Core Team: R: A language and environment for statistical com-puting, R Foundation for Statistical Computing, Vienna, Austria,ISBN 3-900051-07-0,http://www.R-project.org, 2012.
Reeder, S. W., Hitchon, B., and Levinson, A. A.: Hydrogeochem-istry of the surface waters of the Mackenzie River drainage basin,Canada 1. Factors controlling inorganic composition, Geoch.Cosmoch. Ac., 36, 825–865, doi:10.1016/0016-7037(72)90053-1, 1972.
Reigstad, M., Wassmann, P., Wexels Riser, C., Oygarden, S., andRey, F.: Variation in hydrography, nutrients, and chlorophyll a inthe marginal ice-zone and the central Barents Sea, J. Marine Sys.,38, 9–29, 2002.
Roach, A. Aagaard, T., K., Pease, C. H., Salo, S. A., Weingartner,T., Pavlov, V., and Kulakov, M.: Direct measurement of transportand water properties through the Bering Strait, J. Geophys. Res.,100, 18443–18457, 1995.
Sakshaug, E.: Primary and secondary production in the Arctic seas,in: The organic carbon cycle in the Arctic Ocean, edited by:Stein, R. and MacDonald, R. W., Springer-Verlag, Berlin, 57–81,2004.
Savenko, A. V. and Shevchenko, V. P.: Seasonal variability of thedistribution of dissolved forms of biogenic elements and alka-linity in the Northern Dvina mouth, Water Res., 32, 417–421,doi:10.1007/s11268-005-0052-x, 2005.
Semiletov, I. P., Pipko, I. I., Shakhova, N. E., Dudarev, O. V., Pu-gach, S. P., Charkin, A. N., McRoy, C. P., Kosmach, D., andGustafsson,O.: Carbon transport by the Lena River from itsheadwaters to the Arctic Ocean, with emphasis on fluvial inputof terrestrial particulate organic carbon vs. carbon transport bycoastal erosion, Biogeosciences, 8, 2407–2426, doi:10.5194/bg-8-2407-2011, 2011.
Serreze, M. C., Barrett, A. P., Slater, A. G., Woodgate, R. A., Aa-gaard, K., Lammers, R. B., Steele, M., Moritz, R., Meredith, M.,and Lee, C. M.: The large-scale freshwater cycle of the Arctic, J.Geophys. Res., 111, C11010, doi:10.1029/2005JC003424, 2006.
Sferratore, A., Billen, G., Garnier, J., Smedberg, E., Humborg, C.,and Rahm, L.: Modelling nutrient fluxes from sub-arctic basins:Comparison of pristine vs. dammed rivers, J. Marine Syst., 73,236–249, 2008.
Shiklomanov, A. and Lammers, R. B.: River discharge (in Arc-tic Report Card 2011), available athttp://www.arctic.noaa.gov/reportcard/riverdischarge.htmlTS15, (last access: 1 June, 2012),2011.
Simpson, K. J., Tremblay, J.-E., Gratton, Y., and Price, N. M.: Anannual study of inorganic and organic nitrogen and phosphorusand silicic acid in the southeastern Beaufort Sea, J. Geophys.Res., 113, C07016, doi:10.1029/2007JC004462, 2008.
Stepanauskas, R., Jorgenson N. O. G., Eigaard, O. R., Zvikas A.,Tranvik L. J., and Leonardson L.: Summer inputs of riverine nu-trients to the Baltic Sea: bioavailability and eutrophication rele-vance, Ecol. Monogr., 72, 579–597, 2002.
Ple
ase
note
the
rem
arks
atth
een
dof
the
man
uscr
ipt.
Biogeosciences, 10, 1–17, 2013 www.biogeosciences.net/10/1/2013/

V. Le Fouest et al.: The fate of riverine nutrients on Arctic shelves 17
Tank, S. E., Manizza, M., Holmes, R. M., McClelland, J.W., and Peterson, B. J.: The processing and impact of dis-solved riverine nitrogen in the Arctic Ocean, Estuar. Coast.,doi:10.1007/s12237-011-9417-3, 2011.TS16
Timmermans, M. L., Toole, J., Proshutinsky, A., Krishfield, R., andPlueddemann A.: Eddies in the Canada basin, Arctic Ocean, ob-served from ice-tethered profilers, Am. Meteorol. Soc., 38, 133–145, doi:10.1175/2007JPO3782.1, 2008.
The Arctic-GRO (Arctic Great Rivers Observatory) project, avail-able at:http://arcticgreatrivers.org/data.html, (last access: 1 Au-gust 2012), 2012.
The R-ArcticNet database of panarctic river discharge, available at:http://www.r-arcticnet.sr.unh.edu/v4.0/index.html, (last access: 1August 2012), 2012.
The United Nations GEMS/WATER Programme, Accessed on theinternet athttp://www.unep.org/gemswater, (last access: 1 Au-gust 2012), 2012.
The USGS (United States Geological Survey) Water-Quality Datafor the Nation, available at:http://waterdata.usgs.gov/nwis/qw, ,(last access: 1 August 2012), 2012.
Tremblay, J.-E. and Gagnon, J.: The effects of irradiance and nutri-ent supply on the productivity of Arctic waters: a perspective onclimate change, in: Influence of climate change on the changingArctic and Subarctic conditions, edited by: Nihoul, J. C. J. andKostianoy, A. G., NATO Science for Peace and Security Series-C: Environmental Security, 73–93, 2009.
Tremblay J.-E., Simpson, K., Martin, J. J., Miller, L., Gratton, Y.,Barber, D., and Price, N. M.: Vertical stability and the annualdynamics of nutrients and chlorophyll fluorescence in the coastal,southeast Beaufort Sea, J. Geophys. Res.-Oceans, 113, C07S90,2008.
Tremblay, J.-E., Belanger, S., Barber, D. G., Asplin, M., Martin,J., Darnis, G., Fortier, L., Gratton, Y., Link, H., Archambault,P., Sallon, A., Michel, C., Williams, W. G., Philippe, B., andGosselin, M.: Climate forcing multiplies biological productiv-ity in the coastal Arctic Ocean, Geophys. Res. Lett., 38, L18604,doi:10.1029/2011GL048825, 2011.
Vahatalo, A. V., Aarnos, H., Hoikkala, L., and Lignell, R.: Photo-chemical transformation of terrestrial dissolved organic mattersupports hetero- and autotrophic production in coastal waters,Mar. Ecol.-Prog. Ser., 423, 1–14, doi:10.3354/meps09010, 2011.
Walsh, J. J. and McRoy, C. P.: Ecosystem analysis in the southeast-ern Bering Sea, Cont. Shelf Res., 5, 259–288, 1986.
Wassmann, P., Slagstad, D., Wexels Riser, C., and Reigstad, M.:Modelling the ecosystem dynamics of the Barents Sea includingthe marginal ice zone. II. Carbon flux and interannual variability,J. Marine Syst., 59, 1–2, 2006.
Xie, H., Belanger, S., Song, G., Benner, R., Taalba, A., Blais, M.,Lefouest, V., Tremblay, J.-E., and Babin, M.: Photoproductionof ammonium in the Southeastern Beaufort Sea and its biogeo-chemical implications, Biogeosciences Discuss., 9, 4441–4482,doi:10.5194/bgd-9-4441-2012, 2012.
Yamamot-Kawai, M., Carmack, E. C., and McLaughlin, F. A.: Briefcommunications: Nitrogen balance and Arctic throughflow, Na-ture, 443, doi:10.1038/443043a, 2006.TS17
Ple
ase
note
the
rem
arks
atth
een
dof
the
man
uscr
ipt.
www.biogeosciences.net/10/1/2013/ Biogeosciences, 10, 1–17, 2013
Remarks from the English Copy-Editor
CE1 British English has been made consistent throughout the manuscript.CE2 All abbreviations must be defined in the abstract and again in the manuscript.CE3 In the abstract, “SRP” stands for “soluble reactive phosphate”. Which one is correct?CE4 Please give date of personal communication.CE5 The word “freshwater” written together is a modifier (e.g. freshwater discharge.)CE6 In the text, the project is written as “Malina”. Which one is correct?
Remarks from the Typesetter
TS1 Please check UMR.TS2 According to the reference list, the year is 2011. Please check.TS3 Should it be Frey and McCelland, 2009?TS4 Should “new” be subscripted?TS5 According to the reference list, the year is 2008. Please check.TS6 Please note and confirm change from “in red” to “in italic” in all appendix tables, as colours cannot be displayedanymore.TS7 Please indicate if the numbers in bold have a special meaning.TS8 Please provide volume and pages.TS9 Please check doi.TS10 Is the year 2013?TS11 Please provide full page range.TS12 Single page or total pages.TS13 Please provide volume and pages.TS14 Please check doi.TS15 Please check link.TS16 Please provide volume and pages.TS17 Please provide pages.