The fate of haphthenic acids in wetland sediments...
136
THE FATE OF HAPtITHENIC ACIDS IN WETLAND SEIIIhIENTS: MIC'RORIAI, METARO1,ISM AND COMMlJNITY STRUCTURE I ,uis Fernando Del Rio B.Sc., Sinlon Fraser llniversity, 200 1 MASTER 01: SCIENCE In the Dcp.1 'I -t mcnt 0 f Molecular Biology a i d Biochemistry ((9 1,uis 1;ernando Del Rio 2003 S I M O N 1:RASI:R IJNIV1~RSIr1'Y Fall 2004 A11 rights reserved. 'I'his ~vorlc may not be I-C~I-O~LI~C~ in whole or in part, by photocopy or other means, witlio~~t permission of the author
-
Upload
truongnguyet -
Category
Documents
-
view
213 -
download
0
Transcript of The fate of haphthenic acids in wetland sediments...
T H E FATE O F HAPtITHENIC ACIDS IN W E T L A N D SEIIIhIENTS: MIC'RORIAI, METARO1,ISM AND COMMlJNITY STRUCTURE
I ,uis Fernando Del Rio B.Sc., Sinlon Fraser llniversity, 200 1
MASTER 0 1 : SCIENCE
In the Dcp.1 ' I -t mcnt 0 f
Molecular Biology a i d Biochemistry
((9 1,uis 1;ernando Del Rio 2003
S IMON 1:RASI:R IJNIV1~RSIr1'Y
Fall 2004
A11 rights reserved. 'I'his ~vorlc may not be I - C ~ I - O ~ L I ~ C ~ in whole or in part, by photocopy
or other means, w i t l io~~ t permission of the author
APPROVAL
Name:
Degree:
Title of Thesis
Luis Fernando Del Rio
Master of Science
The fate of naphthenic acids in wetland sediments: microbial metabolism and community structure
Examining Committee:
Chair: Dr. Dipankar Sen Professor Molecular Biology and Biochemistry Simon Fraser University
Dr. Margo Moore Senior Supervisor Associate Professor Biological Sciences Simon Fraser University
Dr Rosemary Cornell Supervisor Professor Molecular Biology and Biochemistry Simon Fraser University
Dr. Fiona Brinkman Supervisor Assistant Professor Molecular Biology and Biochemistry Simon Fraser University
Dr. Erika Plettner Supervisor Assistant Professor Chemistry Simon Fraser University
Dr. Leah Bendell-Young Internal Examiner Professor Biological Sciences Simon Fraser University

SIMON FRASER UNIVERSITY
PARTIAL COPYRIGHT LICENCE
The author, whose copyright is declared on the title page of this work, has granted to Simon Fraser University the right to lend this thesis, project or extended essay to users of the Simon Fraser University Library, and to make partial or single copies only for such users or in response to a request from the library of any other university, or other educational institution, on its own behalf or for one of its users.
The author has further granted permission to Simon Fraser University to keep or make a digital copy for use in its circulating collection.
The author has further agreed that permission for multiple copying of this work for scholarly purposes may be granted by either the author or the Dean of Graduate Studies.
It is understood that copying or publication of this work for financial gain shall not be allowed without the author's written permission.
Permission for public performance, or limited permission for private scholarly use, of any multimedia materials forming part of this work, may have been granted by the author. This information may be found on the separately catalogued multimedia material and in the signed Partial Copyright Licence.
The original Partial Copyright Licence attesting to these terms, and signed by this author, may be found in the original bound copy of this work, retained in the Simon Fraser University Archive.
W. A. C. Bennett Library Simon Fraser University
Burnaby, BC, Canada
ABSTRACT
Naphthenic acids (NA) are naturally occurring carboxylic acids released from bitumen
during oil sands processing. NA's are acutely toxic to aquatic organisms and are
primarily removed by microbial degradation. The purpose of this study was to isolate
microorganisms capable of NA degradation and to determine the extent of NA surrogate
degradation by microbial communities.
To determine the NA-degrading ability of native microorganisms, microcosms were
incubated with "c-labelled NA surrogates cyclohexane carboxylic acid (CCA), and
decahydronaphthoic acid (DHNA), and " ~ 0 ~ evolution was monitored. All microcosms
degraded CCA however, previous exposure to NA's is necessary for DHNA degradation
to occur.
Using NA's as the sole carbon source, two bacterial strains identified as Psc~lrdonloi7as
species, were isolated from enrichment cultures, and NA degradation was monitored by
GC-MS. Co-cultures degraded >99% of NA within 4 weeks. However each bacterium
degraded 15% of the total NA mixture.
Keywords: Biodegradation, naphthenic acids, GC-MS. CCA, DHNA.

DEDICATION
This thesis is dedicated to my maternal grandparents Raul Velarde Pareja and
Gladys Jochamowitz Ixigll.

ACKNOWLEDGEMENTS
I would like to thank my senior supervisor, Margo Moore, for her mentorship.
support, and especially friendship throughout the course of my degree. Your lectures
during my undergraduate studies inspired me to pursue an advanced degree.
I wish to thank my committee members, Drs. Rosemary Cornell, Erika Plettner.
and Fiona Brinkman for helpful discussions and encouragement during committee
meetings as well as being available in person or by email.
A very special thanks you to Mrs. Linda Pinto for several insightful conversations
around the teapot about science and life in general and especially for keeping me sane the
last few years.
To the members of the Moore Lab: Ana Gifford, Luba Vasiluk, Alison Hadwin,
Jas Minhas, and Mark Warwas, because of all of you my graduate studies have been an
amazing experience. I have many warm-hearted memories because of you including a
certain kayaking party in which a lab mate who shall remain nameless fell into Deep
Cove. Seriously you have been like a family and I will miss you.
Finally I would like to thank my family especially my mother Rosario and my
sister Lia for their love and support throughout the years. 1 couldn't have made i t this far
without you and it's good to have you with me. I'd also like to thank Ms. Anna
Muellling and her family for her love and support throughout the good and stressful
times, thank you sunshine.
TABLE OF CONTENTS
. . Approval ............................................................................................................................. 11
... Abstract ............................................................................................................................ III
. . Dedication ......................................................................................................................... IIV
............................................................................................................ Acknowledgements v
Table of Contents .............................................................................................................. vi
List of Figures ................................................................................................................... ix
..................................................................................................................... List of Tables xi . .
List of Abbreviations and Acronyms ............................................................................. XU
............................................................................................... Chapter One Introduction -1 ........................................................................ 1.1 Introduction to the oil sands industry 1
1.1 . 1 Mining and extraction ......................................................................................... 2 1.1.2 Tailings disposal ................................................................................................. 3 1.1.3 Reclamation of the fine tailings .......................................................................... 7
1.2 Microbial degradation of naphthenic acids ................................................................ 9 1.3 Introduction to microbial communities and their analysis ...................................... 1 1
1.3.1 Analysis based on single carbon source utilization ........................................ 13 1.3.2 Analysis based on direct extraction of biological markers ............................... 14
1.4 Aims of study ........................................................................................................... 22
Chapter Two Materials and Methods ............................................................................ 24 2.1 Description of wetlands visited ............................................................................... 24 2.2 Sampling methods ................................................................................................... 24 2.3 Microbial degradation of surrogate naphthenic acids in microcosms ..................... 26 2.4 Microbial comnlunity and biomass analysis ............................................................ 29
2.4.1 Lipid extraction ............................................................................................... 29 2.4.2 Lipid fractionation .......................................................................................... 30 2.4.3 Phospholipid fatty acid analysis ..................................................................... 30
2.4.3.1 . Mild alkaline methanolysis ................................................................... 30 2.4.3.2. Fatty acid methyl ester purification ...................................................... 31 2.4.3.3. Gas chroniatography and gas chromatography mass
3 1 spectrometry ........................................................................................ - 2.4.3.4 Fatty acid nomenclature ......................................................................... 32 2.4.4 Microbial biomass determinations ............................................................ 32
2.5 Microbial degradation of naphthenic acids in by mixed and pure cultures ............. 33 2.5.1 Naphtlienic acid-degrading enrichment cultures ............................................ 33 2.5.2 Identitkation of naphthenic acid degrading microorganisnls ........................ 34
2.5.2.1 Physiological identification of naphthenic acid degrading ............................................................................................... organisms 34
........ 2.5.2.1 Molecular identification of naphthenic acid degrading organisms 34 2.5.3 Extraction of naturally occurring naphthenic acids ........................................ 36 2.5.4 Microbial degradation of naphthenic acids ..................................................... 36
2.6 Statistical analysis .................................................................................................... 38
Chapter Three Results .................................................................................................... 40 3.1 Microbial community and biomass analysis ............................................................ 40
. .................................................................... 3.1 1 . Viable Biomass Determinations 40 .................................................................... 3.1.2. Microbial Community Analysis 43
3.2 Microbial degradation of surrogate naphthenic acids in microcosms ..................... 58 14 3.2.1. C-cyclohexane carboxylic acid (CCA) ....................................................... 58 14 ..................................................... 3.2.2. C-decahydro-2-naphthoic acid (DHNA) 64
3.3 Isolation of P.seudonzonus spp from naphthenic acids-degrading enrichment ..................................................................................................................... cultures 70
3.4 Microbial degradation of con~mercially available naphthenic acids ....................... 71
Chapter Four Discussion ................................................................................................. 79
Appendices ....................................................................................................................... 94
References ....................................................................................................................... 111

LIST OF FIGURES
Figure 1.1
Figure 1.2
Figure 2.1
Figure 3.1
Figure 3.2
Figure 3.3
Figure 3.4
Figure 3.5
Figure 3.6
Figure 3.7
Figure 3.8
Figure 3.9
General Scheme for the Clark process of oil extraction from the oil sands deposits . .. . .. .. . .. ... .. . . . .. ... .. . .. . .. . . . .. . ... . .. .. . .. .. . .. .. . .. .. . .. .. ... .. . .. . .. . . . .. . .. . .. . .. .. . .. ..4
Naphthenic acid structures and Z families ....................................................... 6
Chemical structure of the surrogate naphthenic acids used in this study ............................................................................................................... 27
The amount of viable microbial biomass in the various wetland sediments in 200 1 .......................................................................................... 42
Sediment microbial community comparisons based on the PLFA data obtained from sediments sampled in the year 2000 ....................................... 44
Sediment microbial community comparisons based on the PLFA data obtained from sediments sampled in the year 2001 ....................................... 45
The proportion of Gram-positive aerobes vs. Gram-negative anaerobes in wetland sediments ..................................................................... 49
The proportion of Gram-positive aerobes vs. Gram-negative anaerobes in wetland sediments ..................................................................... 50
The proportion of pseudomonads in the total microbial community of sediment samples .... ... .. .. . .. .. ... .. . .. . .. . .. . . ,. . ... . .. ... .. . .. ... .. ... .. ... .. ................ .. ......... 52
The proportion of actinomycetes in the total microbial community of sediment samples ..... ... .. ... .. .. . .. . .. . .. . .. . ... . ... ... ... ... ... .. ... .. .... . .. .. . .. . .. ... ... .. . .. . .. ...... 54
The proportion of microeukaryotes such as fungi and algae in the total microbial community ............................................................................. 55
The proportion of microorganisms in stationary phase in the total microbial communities of wetland sediments ........................................ 57
Figure 3.10 A typical CCA mineralization profile by three sediment microbial . .
communlt~es ................................................................................................... 59
Figure 3.1 I "c-CCA mineralization by sediment samples collected in 2000 ................. 60
Figure 3.12 "c-CCA mineralization by sediment samples collected in 200 1 ................. 62
Figure 3.13 CCA mineralization rates of sediment microorganisms ................................ 63
Figure 3.14 A typical '"c-DHNA mineralization profile of sediment samples collected in 200 1 . .. . .. . .. ... .. . .. .. . .. ... . .. . .. . . ... . ... . .. . . .. . .. . .. . .. . .. . .. ... .. . .. ... .. . .. .. . .. . .. .. . .. .65
Figure 3.15 Total I 4 C - ~ ~ N A mineralization by wetland sediments collected in 2000 ............................................................................................................... 66
Figure 3.16 "c-DHNA mineralization by wetland sediments collected in 2001 ............. 68
............... Figure 3.17 DHNA mineralization rates of wetland sediment microorganisms 69
Figure 3.18 GCIMS (RIC) profiles showing the biodegradation of commercially available NA's . by a mixed culture composed of P.sc~udonionu.s putidu
....................................................................... and P.seudonlonu.s~ f l z ~ o ~ c ~ s w n . ~ 73
Figure 3.19 NA degradation profile after incubation with by a mixed culture of P . . .............................................................. ~f1uove.scen.s LDI and P yutidu LD2 74
Figure 3.20 NA degradation profile by pure cultures ....................................................... 76
Figure 3.2 1 NA degradation by pure and mixed cultures ................................................. 77
Figure 3.22 Comparison of "aged" Suncor NA's Vs . Kodak Na's after 4 weeks of incubation with the mixed culture ................................................................. 78
Figure A 1 : Calibration curve for biomass determination .................................................. 94
Figure A2: Calibration curve for NA biodegradation ...................................................... 106

LIST OF TABLES
Table 1 . 1 Example of signature PLFA's ....................................................................... 21
Table 2.1 The location and description of the eleven wetlands and one tailings pond sampled in this study ............................................................................ 25
Table 2.2 Components of Focl~t's mineral salts medium .............................................. 34
Table 3.1 Viable microbial biomass in various wetland sediments for the year 2001 ............................................................................................................... 41
Table 3.2 Mole percentage distribution of PLFA's in sediment samples ...................... 47

LIST OF ABBREVIATIONS AND ACRONYMS
BAMES
BDL
CT
CCA
DHNA
dpm
FAMES
GC
G U M S
LP
MFT's
NA
PLFA
TPW
bacterial acid methyl esters
below detection limit
nonsegregating tailings known as consolidated tailings at Suncor Inc. and composite tailings at Syncrude Canada Ltd.
cyclohexane carboxylic acid
decahydronaphthoic acid
disintegrations per minute
fatty acid methyl esters
gas chromatograph
gas chro~natographylmass spectrometry
lipid phosphate
mature fine tailings
naphthenic acids
phospholipid fatty acids
tailings pond water
CHAPTER ONE: INTRODUCTION
1.1 An introduction to the oil sands industry
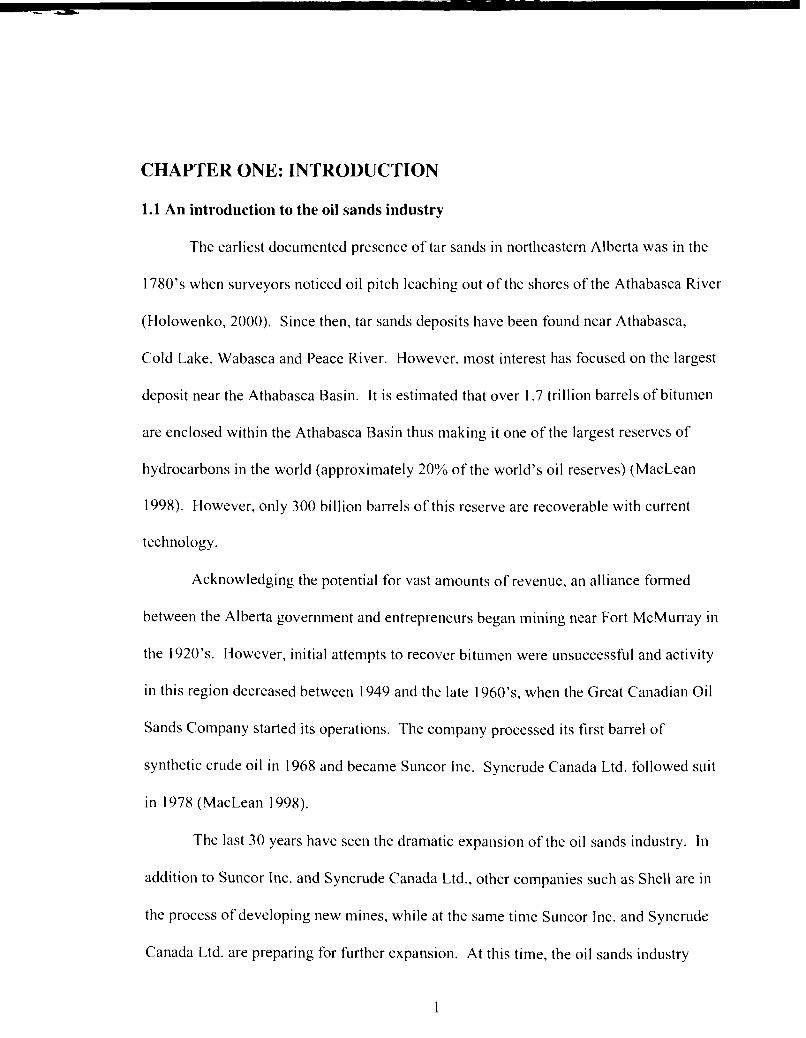
The earliest documented presence of tar sands in northeastern Alberta was in the
1780's when surveyors noticed oil pitch leaching out of the shores of the Athabasca River
(Holowenko, 2000). Since then, tar sands deposits have been found near Athabasca,
Cold Lake, Wabasca and Peace River. However, most interest has focused on the largest
deposit near the Athabasca Basin. It is estimated that over 1.7 trillion barrels of bitumen
are enclosed within the Athabasca Basin thus making it one of the largest reserves of
hydrocarbons in the world (approximately 20% of the world's oil reserves) (MacLean
1998). However, only 300 billion barrels of this reserve are recoverable with current
technology.
Acknowledging the potential for vast amounts of revenue, an alliance formed
between the Alberta government and entrepreneurs began mining near Fort McMurray in
the 1920's. However, initial attempts to recover bitumen were unsuccessful and activity
in this region decreased between 1949 and the late 1960's, when the Great Canadian Oil
Sands Company started its operations. The company processed its first barrel of
synthetic crude oil in 1968 and became Suncor Inc. Syncrude Canada Ltd. followed suit
in I978 (MacLean 1998).
The last 30 years have seen the dramatic expansion of the oil sands industry. In
addition to Suncor Inc. and Syncrude Canada Ltd., other companies such as Shell are in
the process of developing new mines, while at the same time Suncor Inc. and Syncrude
Canada Ltd. are preparing for further expansion. At this time, the oil sands industry
generates over 120 million barrels of synthetic crude oil per year and is expected to
increase to 400 million barrels per year within the next 10 years (Clemente et al., 2003).
Approximately 20 to 25% of Canada's oil supply comes from the oil sands; however this
value is pro-jected to increase to over 50% as the more established oil sources continue to
be depleted (Holowenko, 2000).
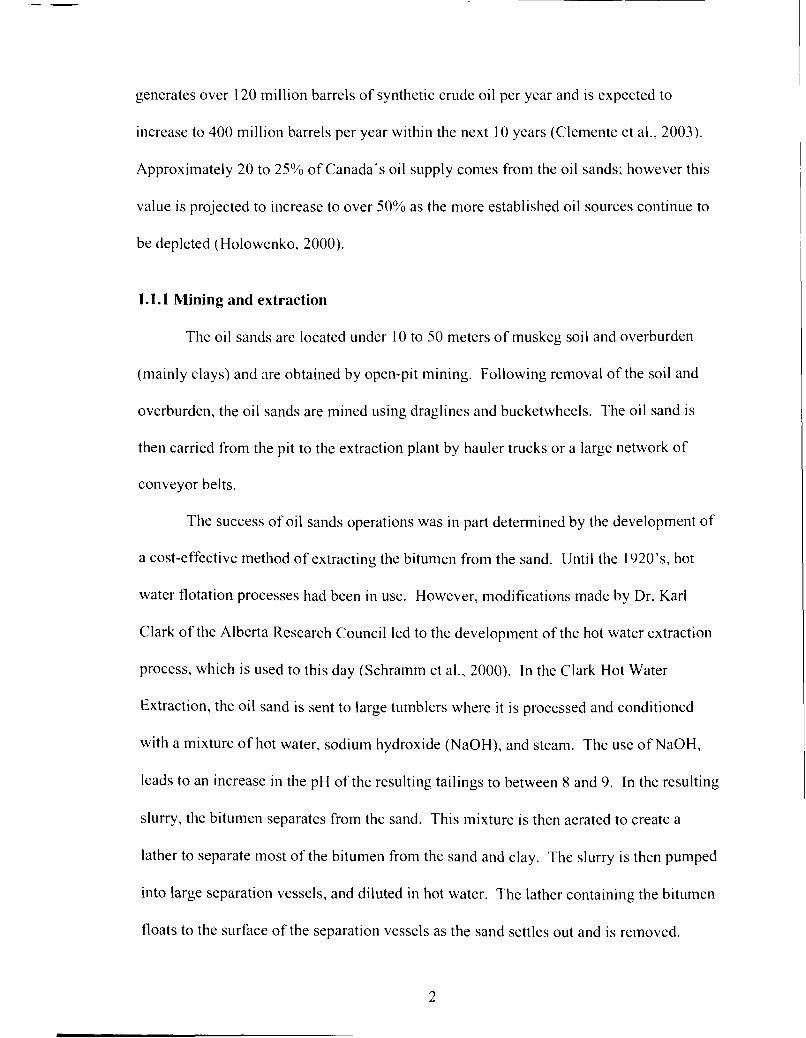
I .1.1 Mining and extraction
The oil sands are located under 10 to 50 meters of muskeg soil and overburden
(mainly clays) and are obtained by open-pit mining. Following removal of the soil and
overburden, the oil sands are mined using draglines and bucketwheels. The oil sand is
then carried from the pit to the extraction plant by hauler trucks or a large network of
conveyor belts.
The success of oil sands operations was in part determined by the development of
a cost-effective method of extracting the bitumen from the sand. Until the 1 XO's, hot
water flotation processes had been in use. However, modifications made by Dr. Karl
Clark of the Alberta Research Council led to the development of the hot water extraction
process, which is used to this day (Schramm et al., 2000). In the Clark Hot Water
Extraction, the oil sand is sent to large tumblers where it is processed and conditioned
with a mixture of hot water, sodium hydroxide (NaOH), and steam. The use of NaOH,
leads to an increase in the pH of the resulting tailings to between 8 and 9. In the resulting
slurry, the bitumen separates from the sand. This mixture is then aerated to create a
lather to separate most of the bitumen from the sand and clay. The slurry is then pumped
into large separation vessels, and diluted in hot water. The lather containing the bitumen
floats to the surface of the separation vessels as the sand settles out and is removed.
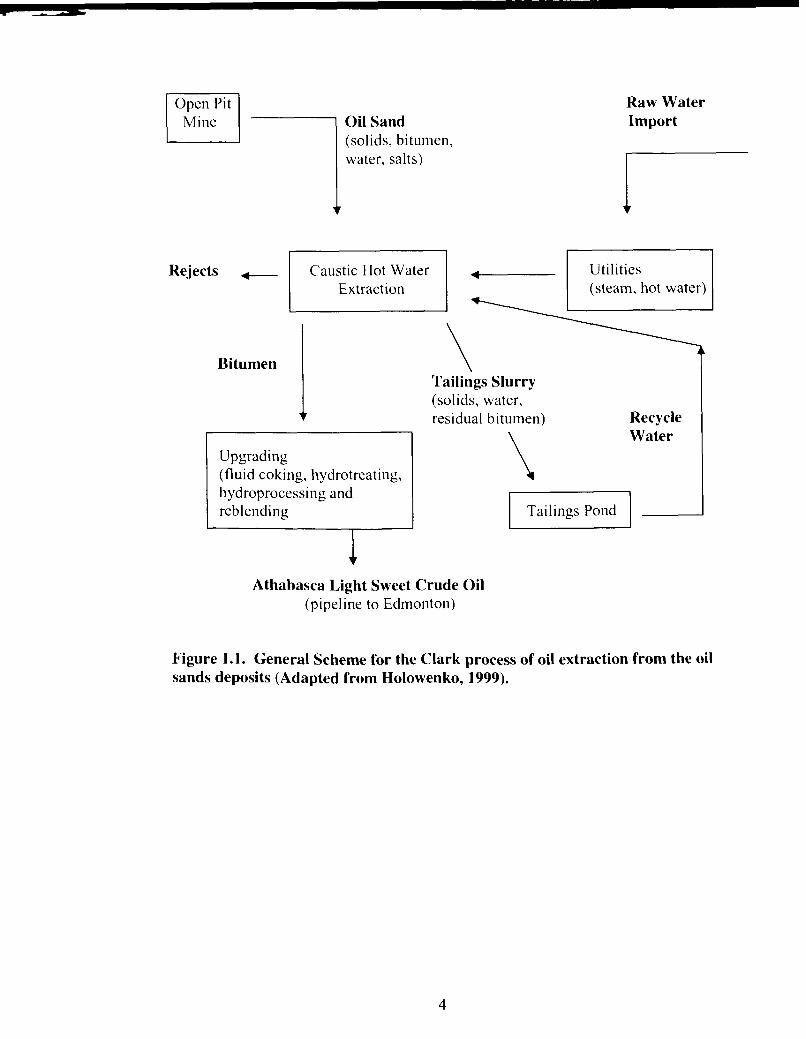
Meanwhile, the slurry is further processed in order to recover any residual oil, which did
not separate with the lather. Following the removal of water and fine solids from the
lather, the bitumen undergoes various refining stages where it is converted to synthetic
crude oil, which is then transported to Edmonton via pipeline. This process is
summarized in figure 1.1 (MacKinnon, 1989).
1.1.2 Tailings disposal
Bitumen extraction from the oil sands requires up to 3 m' of water for every m' of
oil sand and produces an average 4 m' of waste. This waste is composed mainly of
solids, process-affected water, organics and residual bitumen (Gulley and MacKinnon,
1993). Approximately 3 in' of this waste consists of water and fine tailings (91.67 and
8.33 % respectively), while the remaining 1 m' is tailings sand, which settles out and is
then used to create dykes and beaches (List and Lord, 1997). Due to the Alberta
government's "zero discharge" policy, Syncrude Canada Ltd. and Suncor Inc., do not
release any waste products from their leases. As a result, all fine tailings are contained on
site, predominantly in large tailings ponds. Suncor Inc. has five tailings ponds, covering
a total of I6 km2 and containing over I00 x 10" m3 of fine tailings (Holowenko. 2000).
Syncrude Canada Ltd. has several settling basins containing an excess of 300 x 10" m3 of
fine tailings (Holowenko, 2000). In the ponds, the fine tailings go through a slow process
of sedimentation and consolidation. This results in an upper layer of clear water, which
is recycled back to the extraction plant (Figure 1.1 .) thereby providing 75 % of the water
needed for extraction operations (MacKinnon, 1989). Located under the water layer is a
transition zone containing a suspension of fine tailings slurry. As depth increases, the
Mine Oil Sand (solids, bitumen, water, salts)
Bitumen
Rejects -
Upgrading (fluid coking, hydrotreating, hydroprocessing and reblending
Caustic Hot Water Extraction
Raw Water Import
~ a i l i n ~ s Slurry (solids, water, residual bitumen) Recycle
\ Water
Utilities (steam, hot water)
\
- I Tailings Pond I
Athabasca Light Sweet Crude Oil (pipeline to Edmonton)
Figure 1.1. General Scheme for the Clark process of oil extraction from the oil sands deposits (Adapted from Holowenko, 1999).
fine tailings develop into a denser and thicker gel-like structure, identified as mature fine
tailings (MFT's) (MacKinnon, 1%')).
Oil sands tailings pond water (TPW) is acutely toxic to aquatic organisms, with
~ ~ 5 0 ' values in 96-hour fish bioassays 11 0 % and EC~; values in the Microtox assay of
less than 30%. The toxicity of TPW is highly influenced by the amount of solids and
residual bitumen in the pond. In addition, these waters possess high chemical and
biological oxygen demand, resulting in low levels of dissolved oxygen (Mackinnon and
Boerger, 1986).
The primary compounds responsible for this toxicity are a group of organic acids
collectively known as the naphthenic acids (NA's) (McKinnon and Boerger, 1986,
Farwell and Dixon, 2000). In addition. Rogers et al. (2002) have demonstrated that NA's
cause hepatotoxicity in rodents receiving high oral doses. NA's are a native component
of bitumen and are concentrated and liberated into the wastewater during the process of
extraction. NA concentrations in the tailings pond surface water range between 80 to 120
mglL. Not much is known about the chemical coniposition of these compounds except
that they are a complex mixture of cyclic and acyclic alkanes possessing a carboxylated
side chain (Figure 1.2) (Lower, 1987). The number of rings in the structure can vary as
can the length of the carboxylated side chain as denoted by the subscript m. Little is
known about the R group, except that it is thought to be aliphatic. NA's have the general
formula C,,H2,,1,02 (Z = 0, -2, -4.. .- 12) and are categorized into Z groups or families,
corresponding to the number of hydrogen atoms lost as their structure becomes denser.
I Dcfincd as the concentration at which 50% of the tcst organisms arc obscrvcd to exhibit a Icthal response. ' Dcfincd as the concentration at which SO'%, of thc tcst organisms arc observed to exhibit a specific non- Icthal rcsponsc.

Figure 1.2. Naphthenic acid structures and Z families (adapted from Morales et al, 1993). The letter m is greater than or equal to one.

NA's in the Z = 0 group lack a ring structure and are believed to be highly branched
rather than straight-chained fatty acids (Clemente et a]., 2003, Cason and Graham, 1965).
NA's with one ring belong to the Z = -2 family, while bicyclic NA's belong to the Z= -4
group and so on. Analysis of tailings ponds extract by fast atom bombardment mass
spectrometry (FABMS) and gas chromatography-mass spectrometry (GCIMS) has
resulted in the identification of ions corresponding to NA's with 0, 1 , 2 and 3 rings
corresponding to Z values of 0, -2, -4 and -6, respectively (Morales et al, 1993,
Holowenko et al, 200 1 ).
1.1.3 Reclamation of the fine tailings
There are several options being investigated for the remediation of fine tailings.
These include a dry landscape approach, a wet landscape by means of either natural or
constructed wetlands, and more recently, composite or consolidated tailings (List and
Lord, 1997). These options must meet the following requirements: There must be a
restriction in the direct contact or release of contaminants into the environment as well as
in their off-site transport by seepage. There must also be a restriction on the hydrological
impacts of the fine tailings deposits. Finally, the landscape must be stable as well as
productive and self-sustaining (Gulley and McKinnon, 1993).
The wet landscape approach has been the most commonly used method for the
remediation of the large volumes of fine tailings waste (Gulley and McKinnon, 1993).
There are two types of wet landscapes termed surface flow and subsurface flow wetlands
(Hamilton et al., 1993). In the surface flow wetland approach, process-affected waters
are transferred from tailings ponds and enter natural or constructed wetlands over which a
layer of water can be placed, thus creating a water-capped lake (Boerger et al, 19%).

The water cap must be deep enough to isolate the fine tailings and prevent sediment
suspension thus creating a self-sustaining ecosystem (Lawrence et al, 1991). In this lake
ecosystem, the fine tailings would form the sediment and be covered with detritus. This
would minimize the mixing of the fine tailings with the water cap thus creating a
biologically active zone. In addition, over time, chemical degradation and
~nicroorganisms in the lake would degrade any organic compounds moving up the water
column from the fine tailings layer thereby detoxifying the process-affected water
(Gulley and McKinnon, 1993). Nonetheless, for this approach to work, it is of the utmost
importance that the tailings be mature, that is they must have low permeability, high
density, high yielding strength and high viscosity. These characteristics would help
ensure that a well-stratified lake ecosystem would develop (FTFC, 1995).
In the subsurface flow wetland approach, water flows below the surface through a
gravel, crushed rock or soil bed that has been penetrated by the roots of aquatic
vegetation. In this type of wetland, the media is saturated but there is no surface water,
instead water flows through the vegetation mat and the underlying substrate. Although
the water flow is through a largely anaerobic zone, some oxygen is received through the
roots of certain aquatic plants. The relative performance of either option in removing
pollutants from wastewater is dependant on the nature of the waste and local
environmental conditions. However, an advantage of the subsurface flow approach is the
fact that odour and mosquito problems are limited (Reed, 1988).
The major drawbacks to the wet landscape approach arise from the fact that the
lakes ecosystems formed possess three environments, which can be classified as aerobic
(water layer), anoxic (water:fine tailings interface) and anaerobic (fine tailings layer) with

the anaerobic layer being the largest (Holowenko, 2000). A study by Sobolewski ( 1999),
found that a significant amount of the anaerobic microorganisms in an artificial wetland
constructed by Syncrude Canada Ltd. were methane-producing microorganisms also
known as methanogens. It is quite possible that methane production is detrimental to the
reclamation of the fine tailings because methane released from the sediments may affect
the densification rate of the fine tailings, gas released from the MFT layer may resuspend
the fine tailings and move toxic compounds into the water layer, and methane in the
water layer could be consumed along with Oz by methanotrophs (aerobic methane-
utilizing bacteria) (Gulley and MacKinnon, 1993). This could lead to anoxic condition
thereby preventing the establishment of an ecosystem with higher forms of life. Finally
methane is a greenhouse gas and as such its release into the environment is undesirable.
In the consolidated or composite tailings approach, TPW is treated with gypsum
( C a S 0 ~ 2 H 2 0 ) . This results in the precipitation of the fine tailings into a nonsegregating
slurry known as consolidated tailings (Suncor) and composite tailings (Syncrude).
Settling of the slurry is followed by the quick release of water. This process allows a dry
landscape approach to tailings reclamation in which the CT's are buried under a layer of
overburden followed by a layer of soil (List and Lord, 1997).
1.2 Microbial degradation of naphthenic acids
Previous research has shown that NA's are primarily removed by sediment
microorganisms (Nix et al., 1993) although the precise mechanism of degradation is
unknown. Morales et al. (1993) have shown that in samples obtained from oil sands
process-affected waters, the majority of NA's belong to the Z= -4 family, and that the
rate of biodegradation is inversely proportional to the number of carbons (especially >I 7)
and the degree of cyclization. A study by Herman et al. (1994) showed that an
enrichment culture composed of Pseutlon~onus stutzeri and Alcct1igc.ne.s tlenitrjficurts,
which was isolated from oil sands tailings using a commercial mixture of NA's was able
to convert over 50% of the organic carbon into C 0 2 and resulted in the complete absence
of detectable toxicity as measured by the MlCROTOX assay following the
biodegradation of NA's. Moreover incubation of the same enrichment culture with
organic acids extracted from the oil sands tailings resulted in mineralization of
approxin~ately 20% of the organic carbon as well as a reduction of acute toxicity to
approximately one half of the original level. In addition, it was found that the NA
mixtures were degraded by the mixed culture only (Herman et al., 1994).
A microcosm study by Lai et al. ( 1 996) measured the effect of phosphate addition
on the degradation rates of radiolabelled surrogate NA's and toxicity of tailings pond
water (TPW). The addition of phosphate to TPW led to a twofold increase in the rate of
surrogate degradation as well as an increase in the rate of oxygen consumption. These
results are in agreement with those of an earlier study by Herman et al. ( 1 993) in which
they measured the degradation of several carboxylated cycloalkanes by microbes
indigenous to the oil sands tailings. In this study, the researchers showed that compounds
with methyl substituents on the cycloalkane ring were more recalcitrant than the
unsubstituted compounds. They also showed that microbial activity was both nitrogen-
and phosphorus-limited (Herman et al., 1993).
Lai et al. ( 1 996) also showed that phosphate addition resulted in a significant
decrease in the acute toxicity of TPW to fathead minnows and that decreases in dissolved
oxygen concentration resulted in a decrease in the rate of surrogate NA degradation, thus
indicating that NA degradation is an aerobic process. Further evidence that the majority
of NA's removal is via aerobic metabolism comes from a study by Holowenko et al.
(2001). In this study, the effects of mono and bicyclic surrogate NA's, commercially
available NA's, and organic acids extracted from the oil sands tailings on methanogenesis
were examined in anaerobic microcosms composed of either oil sands fine tailings or
domestic sewage sludge. The results of this study showed that neither NA mixture was
able to stimulate the production of methane in the anaerobic microcosms, nor did the
mixtures inhibit methanogenesis. However, they did show that the monocyclic
surrogates were used as methanogenic substrates in oil sands fine tailings microcosms.
The bicyclic surrogate was not degraded under anaerobic conditions. These results
indicate that although a methanogenic consortium may degrade some of the simpler NA's
(such as those belonging to the Z= 0 and -2 families), other NA's in the mixture (i.e.
those belonging to the Z= -4 and higher families) might inhibit the anaerobic degradation
process. Hence NA removal is primarily an aerobic process.
1.3 Introduction to microbial communities and their analysis
Knowledge of microbial community structure is essential to a variety of
ecological and environmental studies in seemingly unrelated disciplines such as chemical
and environmental engineering, soil microbiology, biodegradation and bioremediation,
and marine microbiology (Ogram and, Feng, 1996). A variety of techniques are currently
available for analyzing various aspects of community structure, and many of these
techniques are easily applied with slight modifications to cotnmunities for which they
were not originally intended. Although analysis of microbial community structure is of
the utmost importance in environmental microbiology, it is also one of the most
technically challenging (Ogram and Feng, 1996).
The majority of microorganisms present in many environments may not be
readily cultured by current technologies and therefore are most likely not included in
most analyses. Current estimates suggest that less than 1 % of microorganisms present in
many environments are readily culturable, indicating that techniques based on laboratory
cultivation are significantly biased (Torsvik et al. 1990a and b). It is therefore possible
that most species in many microbial communities have never been described. Even if all
the microorganisms present in a community were culturable, because of time constraints
it is not feasible to enumerate all species present except in rather simple communities.
Therefore, many approaches either study small, well-defined groups of microorganis~ns,
such as those involved in nitrification or degradation of a particular xenobiotic, or use a
broader-spectrum approach and define the relative numbers of individuals capable of
utilizing an array of carbon sources (Kennedy, 1994) or possessing characteristic fatty
acids (Vestal et al. 1989).
To avoid the difficulties and restrictions associated with laboratory cultivation,
many techniques have been developed that do not require cultivation. These techniques
are based on the direct extraction of biological markers such as nucleic acids or fatty
acids from environmental samples have been developed (Sayler and Layton, 1990 and
Vestal et al, 1989). The composition of the extracted biological markers can be analyzed
and depending on the nature of the analysis, information regarding the structure, activity
and in some cases the nutritional state of the community can be obtained. All of these
techniques have their limitations and biases that must be taken into account during the

interpretation of community analysis data. A summary of several currently used
techniques is presented below.
1.3.1 Analysis based on single carbon source utilization
To understand the role of microbial communities in different environments, it is
essential to possess knowledge of microbial community function as well as functional
diversity (Preston-Mafham et al., 2002). Microbial conlmunity function refers to the
actual catabolic activity expressed whereas functional diversity refers to the ability of the
microbial community to adapt their metabolism and their relative composition to a
variety of environmental parameters. To obtain information on functional diversity,
Garland and Mills ( 199 1 ) introduced the use of the commercially available BIOLOG
Mi~roPlate ' '~, which is based on the utilization patterns of 95 single carbon sources.
This technique was originally developed for the rapid identification of bacterial
isolates by single-carbon-source utilization. The substrates are coupled to a tetrazolium
dye. Metabolism of the substrate in a particular well leads to the reduction of the
tetrazolium dye resulting in colour change on the plate thereby providing a unique
metabolic fingerprint. Several types of BIOLOG Microplates containing different
substrates are available and are extensively reviewed by Preston-Mafham et al., (2002).
The major advantage of this technique to the analysis of microbial communities is
the fact that it is very quick and simple to implement thus allowing the analysis of a large
number of samples in a relatively short period of time. There are however several factors
that must be taken into consideration. First, collecting environmental samples invariably
causes disturbances on the san~ple's physical, chemical, and biotic components resulting
in an altered environment. Thus, time between sample collection and plate inoculation
must be kept to the minimum in order to prevent major shifts in the communities as a
result of the altered environment (Pennanen, 2000). Second, in order to overcome the
effects of different inoculum densities 011 colour formation, the plates must be monitored
over an extended period of time in order to determine the kinetics of colour development
(Preston-Mafham et al., 2002). Third, the substrates may not be able to support growth
of all members of the communities thereby providing a biased representation of the
functional/metabolic capabilities of the soil community (Bossio and Scow, 1995).
Nonetheless, the extensive range of carbon sources results in an array of selection
pressures, thus allowing normally unculturable organisms to survive and contribute to
colour formation (Smalla et al., 1998). Finally, the substrates used in the plates may not
reflect the natural environment from which the samples were collected (Glimm et al.,
1997). Because of these and other reasons, analysis of microbial communities by single
carbon source utilization provides insight into the functional ability of the communities
and is better suited for the comparison of communities rather than community
characterization.
1.3.2 Analysis based on direct extraction of biological markers
To avoid the existing limitations and biases associated with laboratory cultivation
of microorganisms, a number of alternative methodologies have been developed which
are based on the analysis of biological markers extracted directly from environmental
samples. The most frequently used biological markers are nucleic acids (DNA and RNA)
and phospholipid fatty acids (PLFA). Analysis of these molecules generates different
information regarding the structure and activity of microbial communities, and the user
should choose the molecule and the method that best suits the specific application.

Nucleic acid based approaches to the analyses of microbial communities
Gene probes
Hybridization of gene probes to nucleic acids extracted directly from
environmental samples provides information which is largely dependent on the target
nucleic acid. Hybridization to DNA is useful for the rapid identification of a specific
characteristic of community structure such as the presence and relative concentrations of
genes encoding a specific function. In contrast, RNA hybridization is an indicator of the
relative activities of the target groups (Ogram, and Bezdicek, 1994). The activities of
certain non-rRNA genes may be estimated by using mRNA as the target, although many
mRNA's are too unstable to be detected in this way (Ogram and Feng, 19%).
The greatest advantage of the application of gene probes to microbial community
analysis is the fact that it can be a very specific means of detecting and enumerating
individual genotypes. Its greatest limitation is the lack of knowledge concerning the
molecular genetics of microbial communities in their environment. In the event that
more than one gene is responsible for a given function, hybridization may underestimate
the total concentration of target organisms. On the other hand, if regions of the probe
hybridize with non-target genes in the sample, overestimation of the target gene may
occur. It is for these reasons, that gene probes should be relatively short (preferably no
longer than 500 bp) segments of an internal region of a well-characterized gene and the
hybridization should be carried out under highly stringent conditions (Ogram and Feng,
1996). Alternatively, Vourdouw et al. ( 1993) have developed reverse sample genome
probing method in which the sample DNA is labelled and used as a probe against a set of
known genes of interest thus generating a community fingerprint.

Comparisons of communities by percent G + C profiles
Holben and Harris, (1991) have compared the distributions of G + C content in
the community DNA to analyze shifts in microbial community structure over time or
following an environmental disturbance. The rationale behind this method is that
bacterial chromosomes have G + C contents that are characteristic of their taxonomic
groups. Therefore, it is believed that the relative proportions of G + C contents in DNA
extracted from a community are consequently characteristic of the relative proportions of
specific taxonomic groups within the community. In that study, they were able to show
that changes in the G + C content of the microbial community DNA arose as a result of
organic amendments, chloroform fumigation and aerobic versus anaerobic conditions.
Analysis of rRNA and rDNA
Analysis of the diversity of rRNA and rDNA is of great value in characterizing
community structures and the relative activities of phylogenetic groups of interest. There
are a wide variety of strategies that can be used such as; sequencing and phylogenetic
analysis (Giovannoni et al. 1990, Liesack and Stackebrandt, 1992), hybridization with
group specific probes (Amman et al, 1995), classification by RFLP patterns for the
placement into different operational taxonomic units (Moyer et al. 1994), and denaturing
gradient gel electrophoresis (DGGE) (Muyzer et al. 1993). Because the sample DNA
includes DNA from all members of a community, total community structure analyses are
conducted on rDNA rather than rRNA molecules. However, when the interests of the
study lie in the analysis of the metabolically active members of the community, rRNA
should be analyzed rather than rDNA.

The simplest approach to analysis of rDNA is hybridization with phylogenetic
probes, using procedures similar to those described above. Amman et al. ( 1995) have
listed a variety of probes that have been designed to hybridize exclusively to specific
phylogenetic groups. Although this approach is very useful in the characterization of
active groups within a community, its major limitation is the fact that it cannot be used
for the identification of specific members of the community, since probes are directed
toward broad phylogenetic groups (Ogram and Feng, 1996).
The DGGE method of analysis is based on the separation of DNA fragments of
identical or nearly identical length but differing in sequence. This method was first
developed for the detection of single-base changes in genes for the diagnosis of genetic
diseases and in genetic linkage studies (Myers et al. 1987). More recently, DGGE has
been extended to characterize microbial populations in environmental samples by
separating PCR amplification products generated by using primers flanking conserved
genes such as the 16s rRNA gene (Muyzer et al. 1993). Separation is based on changes
in the electrophoretic mobility of similar-sized DNA fragments migrating in a gel
containing an increasing gradient of denaturing agents such as urea and formamide. The
changes in electrophoretic mobility are related to the denaturation of double stranded
DNA in certain regions referred to as the melting domains (Stahl, 1996). Since the
temperature of the gel is held constant, the melting temperature for each melting domain
varies according to the concentration of denaturant and therefore by its position in the
gel. When the DNA enters a region of the gel containing sufficient denaturant, partial
denaturation occurs resulting in an arrest of electrophoretic mobility. Sequence variation
within the melting domains affects their denaturing behaviour, and sequence variants of

tlic diffcrcnt amplificatiori products stop migrating at differc~lt positions in ths denaturing
gel (Lcrman ct al. 1984).
DCGE analysis of' PC'R-amplified 16s rDNA fragments provides with a relatively
rapid method fbr the characterization of comn~unity structure in a wide variety of
ciivirorimcnts including microbial mats and deep-sea Iiydrotliermal vents (Ferris et at.
1905, and 'I'cskc ct al. 1906). More specific community structure information can be
obtained by firrtlier analysis of the DGGE banding pattern via scqucncing or
hybridization (Mi~yzcr ct 31. 1003)

The most detailed information concerning the phylogenetic affiliations of the
individual members of the community is obtained by sequencing each of the individual
clones. This is being increasingly done, however cost is quite prohibitive for many
laboratories therefore many of these studies are only conducted on communities with low
species diversities, such as those found in hot springs, and in bioreactors.
Finally, Venter et al. (2004) have adapted the whole genome shotgun sequencing
method, which was previously used for the rapid sequencing of individual
organisms'genomes to the study of microbial communities in the Sargasso Sea. That
study resulted in the discovery of 150 new bacterial species as well as the identification
of over 1.2 million new genes thus denionstrating a previously unseen level of microbial
diversity in seawater. However although this method is still prohibitively expensive for
routine use.
Phospholipid fatty acid analysis
PLFA's extracted from environmental samples have been used to study microbial
community structures and metabolic states and to compare similarities and differences
among different microbial comlnunities (Bobbie and White, 1978, and Frostegard et al.
1993).
The relative concentrations of different kinds of polar lipids in each membrane are
characteristic for the type of membrane, cell type, and the species; however, the fatty acid
components of the individual membrane lipids are not fixed and may vary with
nutritional state and environmental conditions in order to maintain membrane fluidity
(Kicft et al. 1094). By studying the changes of fatty acid profiles, especially the presence
of certain PLFA as bio~narkcrs for certain microbial types, an indication of the metabolic
activity of the microbial community may be obtained (Frostegard et al. 1993, and
Guckert et al. 1986).
PLFA patterns derived from environmental samples provide quantitative analysis,
however the elucidation in terms of precise components may not be possible due to
overlapping composition between constituents (White et al. 1996). That is, quantitative
comparisons of total community PLFA patterns accurately mirror shifts in community
composition but may not provide definitive analysis of shifts in specific microorganisms.
Examples of signature PLFA's are shown in Table 1.1.
In PLFA analysis it is of the utmost importance to consider the environment from
which the sample was obtained when interpreting the results. For example, terminally
branched saturated PLFA are common to Gram-positive aerobes as well as to some
Gram-negative anaerobes such as the sulphate-reducing bacteria (White et al. 1996).
Monocnoic PLFA's are found in all Gram-negative organisms and many types of
n~icroeukaryotes. Polyenoic PLFA are indicative of microeukaryotes as are saturated
PLFA longer than 20 carbons. Bacteria usually contain greater amounts of 16 carbon
Fatty acids whereas cukaryotcs contain greater amounts of 18 carbon fatty acids (White et
al. 1906).
As mentioned above, PLFA analysis can be used to obtain insight into the
nutritional and physiological status of the microbial community. Starvation and
stationary-phase growth lead to the conversion of monoenoic PLFA to cyclopropyl
p1,j;~. Increases in cyclopropyl PLFA formation have also been associated with a shift
toward anaerobic metabolism in facultative heterotrophic bacteria in monoculture studies
(White et al. I OO(, ) . Starvation or environmental stress often results in a relative increase
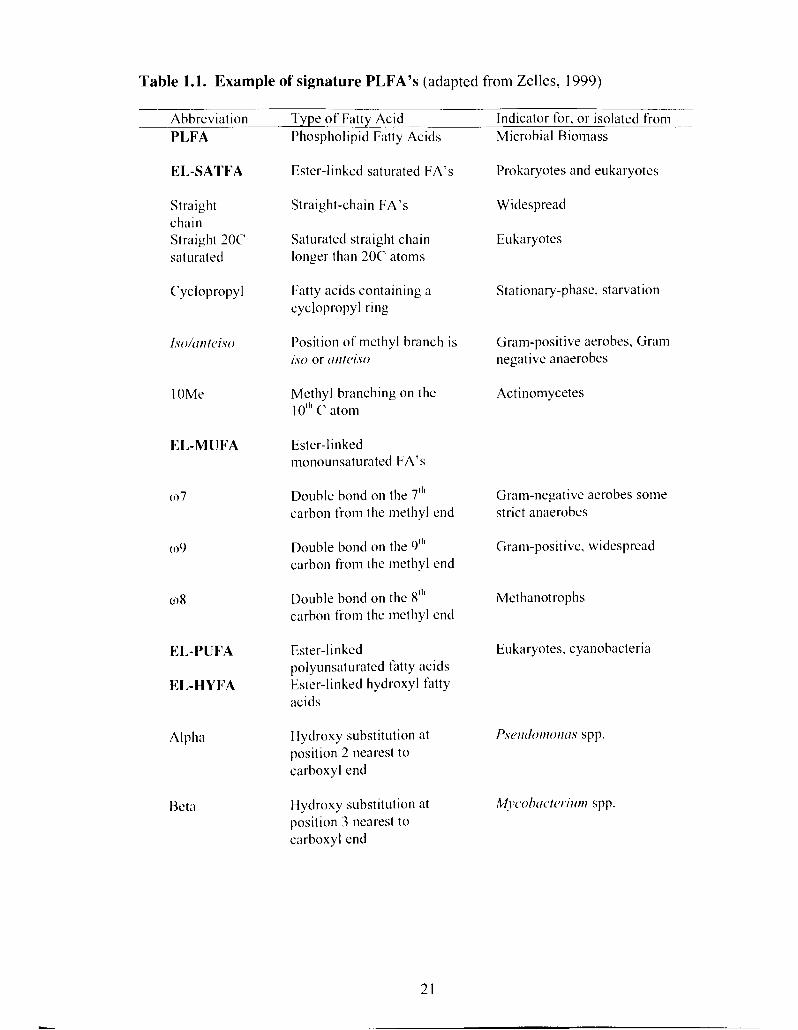
Table 1.1. Example of signature PLFA's (adapted from Zelles, 1999)
Abbreviation Type of Fatty Acid Indicator for, or isolated from Microbial Biomass Phospholipid Fatty Acids P I N A
EL-SATFA
Straight chain Straight 20<' saturated
('yclopropyl
l.so/trntc~i.~o
l OMe
ELMUFA
(07
(09
to 8
El,-PIJFA
EL-HYFA
Alpha
Beta
Ester-linked saturated FA's
Saturated straight chain longer than 20C atoms
Fatty acids containing a cyclopropyl ring
Position of methyl branch is iso or trnteiso
Methyl branching on the 10'" C atom
Ester-linked non noun saturated FA's
Double bond on the 7'" carbon from the methyl end
1)ouble bond on the 9'" carbon from the methyl end
Double bond on the 8'" carbon from the methyl end
Ester-linked polyunsaturated fatty acids Ester-linked hydroxyl fatty acids
Hydroxy substitution at position 2 nearest to carboxyl end
llydroxy substitution at position 3 nearest to carboxyl end
Prokaryotes and eukaryotes
Widespread
Eukaryotes
Stationary-phase, starvation
Gram-positive aerobes, Gram negative anaerobes
Actinomycetes
Gram-negative aerobes some strict anaerobes
Gram-positive, widespread
Methanotrophs
Eukaryotes, cyanobacteria
in the truns-monoenoic PLFA compared to the cis isomers (Guckert et al. 1986). For
example, Heipieper et al. (1 992) have showed that Pseuu'onzonu.~ putidu P8 increases its
production of truns-unsaturated fatty acids as a result of exposure to phenol.
The major limitation of this method is that it is difficult to correlate the changes in
PLFA patterns with the dynamics of specific groups of organisms, and more data is often
required (Frostegard et al. 1993). This can be complemented with the analysis of other
signature lipids such as sterols for fungi, nematode, algae, and protozoa (Nes, 1977 and,
White et al. 1 %O), and by genetic studies such as DGGE.
1.4 Aims of Study
This study formed part of a larger study, the purpose of which was to determine
whether there are particular physico-chemical features of wetlands that receive process-
affected water, that are associated with high rates of microbial degradation of NA's.
Specifically, the rates of degradation of two surrogate NA's by sediment microbial
communities was measured, as well as the composition of the microbial communities.
Community structure analysis was performed using PLFA analysis.
Specific Aims of the Thesis Research
1. To determine whether as NA concentration correlates with high rates of surrogate NA
degradation in a large number of diverse on and offsite wetlands.
2. To characterize the sediment microbial communities in these wetlands by obtaining a
"fingerprint" of the sediment microbial commuliities via PLFA analysis to determine
whether particular communities possess enhanced NA degradation.

3. To determine whether NA concentration correlates with high rates of surrogate NA
degradation in a large number of diverse on and offsite wetlands.
4. To isolate and identify microorganisms able to grow on NA's as their sole carbon
source and to determine the extent of NA degradation it1 vitro.
CHAPTER TWO: MATERIALS AND METHODS
All studies described in this chapter were performed by the author with the exception of
the surrogate NA mineralization studies, which were also performed by Ms. Linda Pinto
and Ms. Alison Hadwin.
2.1 Description of wetlands visited
Water and sediment samples were obtained for analysis in the summers of 2000
and 200 1. For both years, the sites were visited in late June, July and August. The same
twelve sites were sampled in each visit. For each site, sediment and water samples were
taken approximately three meters apart on a transect; these subsamples are referred to as
A, B and C. Of the eleven wetlands, Highway 63, Tower Road, and Fort McKay are all
"off site" wetlands and do not receive any process-affected water. The rest of the
wetlands are exposed to process-affected waters by dyke seepage or by direct exposure.
Pond 5 is an active tailings pond that receives fresh input waters (both regular and
corlsolidated tails) and is not a wetland etivironment (see Table 2.1 for a general
description of each site).
2.2 Sampling methods
Sediments were taken from the top 10 CIII at sites A, B and C as noted above. All
sediments were immediately passed through a 2 mm metal sieve and samples divided into
clcan plastic containers. All sediments were stored in cleaned polypropylene jars except
fbr the samples intended Sbr PLFA analysis. These were stored in a 5% formalin solution
in sterile 50 ml polypropylene tubes (Falcon) as described by Federle and White ( 1 982).

Table 2.1. The location and description of the twelve sites sampled in this study. - --
SFU Code
Site (letter Latitude Longitude Observations abbreviation) (N) (w)
Natural Wetland (NW)
Scirpus Pond (9 ' )
West I lummock ( W W
I lighway 63 ( I 163)
I ligh S~llphatc I'ond (HSI')
I:ort McKay (FMK)
'l'owcr Koad ('I'K)
I'ond 5 (1'5)
I 1 1 " 30.6 18 On-site, large dyke seepage wetland
1 I 1 " 33.179 On site, reclaimed area, dyke seepage, parkland and bird sanctuary
I I 1 " 3 1.864 Newly formed wetland where consolidated tailings have been covered with muskeg
1 1 1 " 3 1.826 On site shallow pool created by seepage from dyke around tailings pond 3
I 1 I " 3 I .008 Shallow wetland on-site, receives some input
I I I " 28.382 Offsite. control wetland small shallow lake
I I I " 33.197 1,arge wetland on site in reclaimed area
I 1 1 " 36.15 1 Offsite, control wetland beside Athabasca river
1 I 1 " 29.883 Offsite, control wetland on outskirts of Fort McKay
I 1 l"3 1.593 Tailings pond receiving fresh CT water, oily patches in water and sediments
1 1 I 32.092 Well established on site pond, no longer receives input
I I l o 32.092 Well established on site pond. no longer receives input
Free water and sediments were stored at 4•‹C until shipped by road to SFU or Syncrude's
Edmonton Research Centre for water chemistry analysis (performed by Dr. M.
MacKinnon).
2.3 Microbial degradation of surrogate naphthenic acids in microcosms
The NA surrogates chosen were '?-labelled cyclohexane carboxylic acid (CCA)
(radiolabel on the carboxyl group) and decahydro-2-naphthoic acid-8-I4c (DHNA) (Z = -
2 and -4 surrogates respectively) (Figure 2.1). CCA was obtained from American
Isotopes. DHNA (98%, 7.5 mCi/mmol) was synthesized for our laboratory by Sigma
Radiochemicals and was used as the Z = -4 surrogate (Figure 2.1). Microcosms
containing sieved sediments and natural waters were incubated at 20•‹C and the headspace
gas was sampled for I4co2 evolution as described by Schley et al. (1 998). Briefly, sieved
sediment was added to sterile 20 ml with open-top caps sealed with Teflon/silicon septa.
One-gram samples of water saturatcd sediment was weighed out for each sediment
subsample (A, B and C) and the vials were then incubated with 5 ml of each sediment's
appropriate pore water. The amount of radiolabel added to each sample was
approximately 320,000 disintegrations per minute (dpm, Idpm = 1.66 x Bq).
Control samples were also weighed out in triplicate and 5 ml of the appropriate pore
water was added. These samples had been autoclaved three times with 24 hours between
each autoclaving. and were used as killed controls for the detection of abiotic 14C release.
Dry weigllt values were determined for each sediment and the data was normalized to dry
weight.

Figure 2.1. Chemical structure of the surrogate naphthenic acids used in this study. (A) Cyclohexane carboxylic acid (CCA), and (B) cis-Decahydro-2-naphthoic acid (DHNA). * Denotes the position of the radiolabelled carbon.
The headspace gas in each sediment was withdrawn into a 60 cc plastic syringe
and bubbled through 5 ml of a ' " ~ 0 2 and 14~-volat i les trapping solution, SCMMEA,
which is a mixture of Ready Gel liquid scintillation cocktail (Beckman Instruments Inc.,
Mississauga, ON, Canada), 40% methanol (reagent-grade, Anachemia Science, Montreal,
PQ, Canada) and 10% monoetlianolamine (Anachemia Science) (Abbott et al, 1992).
The "C in each scintillation vial was determined by liquid scintillation counting. Counts
per minute were converted to dpm using the quench curve and the following equation:
dpm = (cpm/%efficiency) x 100, and corrected for background. Background counts were
determined from killed control vials. After each sampling for " ~ 0 2 . each vial was
sparged with approximately 15 cc of sterile room air delivered through a 0.2pm filter.
Dissolved oxygen and pH values were determined in a set of parallel vials that received
no radioactive substrate. DO concentrations were measured on a YSI 58 dissolved
oxygcn rncter (Yellow Spring Instruments Co., Ohio USA).
Vials were incubated at 20•‹C for two weeks. Each vial was sampled daily in the
first week and three times per week in the second week for a total of 8 readings per
sample. The ratcs were determined as follows: the cuniulative counts at the end of the
experiment (DHNA) or at the time point were they reached a plateau (CCA) were divided
by the number of days required to reach that point by each replicate. The three rates were
then averaged and the standard deviation determined. The nine replicate dry weight
determinations were also averaged and standard deviations obtained. The average
percent dpmlday was then divided by the average dry weight and the new standard
deviation calculated. In order to simplify the analysis, the samples were combined into
the fbllowi~lg tlirce categories: Offsite (NA levels < 5 mg/L and comprising H63, FMK,
and TR), Low impact (NA levels between 5 and 10 mg/L and comprising CL and HS)
and high impact (NA levels > 10 mg/L and comprising NW, ImCT, SP, WH, P5, MFTS
and MFTN) and new standard deviations were calculated by combining the previously
obtained standard deviations.
2.4 Microbial community and biomass analysis
2.4.1 Lipid extraction
All solvents used were of analytical grade. Glassware was washed in Micro
phosphate-free detergent, rinsed ten times with double distilled water, and five times with
water purified with a four-cartridge nanopure system (Barnstead), and then baked at
2 5 0 " ~ for 48 hours. Preserved sediments were centrifuged at 2500 g in order to remove
excess formalin. The supernatants were then removed and the sediments lyophilized for
twenty-four hours. The lyophilized sediments were either combined into composites of
the three samples A, B, and C, prior to extraction (for PLFA analysis) or extracted
directly (for biomass analysis). The lyophilized sediments were extracted by a
modification of the method of Bligh and Dyer ( 1 959). Briefly, the sediments were
extracted overnight in a one-phase mixture composed of chloroform, methanol and
phosphate-buffered saline (PBS) (1 :2:0.X, v/v/v) except when the extracted lipids were to
be used in lipid-phosphate determination. In that case, water was used instead of PBS.
The extraction sample was then centrifuged at 9000 g and the supernatants transferred to
new centrifuge tubes. The sediment residue was resuspended in a mixture of chloroform
a ~ l d methanol (2: I , vlv), reextracted for 30 minutes and recentrifuged at 7000 rpm. The
supernatants wcre pooled and the monophasic system was separated with the addition of
eq~lal volumes of chloroform and PBS (Sml). The lipid-containing phase was

concentrated in vorrm at 37 "C to a volume of approximately 2ml and transferred to glass
vials. The lipids were then dried under a stream of N2 and stored at -20 "C until use.
2.4.2 Lipid fractionation
Lipids were fractionated in order of increasing polarity by a modification of the
method developed by Zelles and Bai (1 993). Briefly, the lipid extract was resuspended in
a minimal amount of chloroform and transferred to a silica gel solid phase extraction
cartridge (Supelco, Oakville, ON), which had been previously conditioned with 5 ml
methanol followed by 5 ml of chloroform. The lipids were then fractionated into neutral,
glyco- and phospholipid-containing polar lipids with 5 ml of chloroform, 10 ml of
acetone and 5 ml of methanol respectively. The phospholipid-containing polar lipid was
fraction retained and dried at 40 "C under a stream of N2.
2.4.3 Phospholipid fatty acid analysis
2.4.3.1. Mild alkaline methanolysis
Prior to methanolysis, known amounts of methyl tridecanoate (1 3:0) and methyl
nonadecanoate ( 1 9:0) (Aldrich, Oakville, ON) were added to the polar lipid mixture. The
phospholipids were then subjected to a mild alkaline methanolysis by the method of
Dowling et al, ( 1986). Polar lipids were dissolved in 1 ml methanol/toluene ( I : I , vh) , 1
ml of 0.2 M KOH in dry methanol was added and the mixtures were heated at 37 ('c for
I5 minutes. Sequential additions of 2 ml hexane, 0.3 1 M acetic acid and 2 ml water
were made. The resulting biphasic mixture was vortexed. and the hexane (upper) layer
containing the fatty acid methyl esters (FAMES), was removed. The aqueous phase was

reextracted twice more with 2 ml hexane. The hexane fractions were combined, dried
under a stream of N2 and stored at -20 OC.
2.4.3.2. Fatty acid methyl ester purification
Crude FAMES were loaded onto a thin layer silica gel (Whatman KG, 0.25mm,
20 x 20 cm) plate. Methyl nonadecanoate was spotted on the end lanes of each plate.
The TLC plates were then developed in hexaneldiethyl ether (1 : 1, vlv). After
development the end lanes were cut out and sprayed with 0.01% (wlv) rhodamine to
detect the standard. The end lanes were then aligned with the rest of the TLC plate and
areas at R, values corresponding to the standards were then scraped off from the plate and
the FAMES were eluted from the silica gel with 6 ml of hexane:diethyl ether (9: 1 , vh ) .
The solvent was dried under a stream of N2 and stored at -20 "c.
2.4.3.3. Gas chromatography and gas chromatography mass spectrometry
The purified FAMES were dissolved in 0.1 ml hexane and analyzed on a Hewlett-
Packard 5890 gas chromatograph equipped with a flame ionization detector (FID). The
colulnn used was a 30m x 0.25mm id DB-5 capillary column (phenylmethyl silicone, J &
W Scientific, Folsonl CA). Hydrogen was used as the carrier gas and injections were
made in splitless mode. The temperature program was as follows: initial temperature of
80 ('c for I minute, increasing at 20 OC min-' to I60 "c, then increasing at 5 "C min-' to
the final temperature of 270 "c, which was held for 10 minutes. Relative retention times
of FAMES were with those ofbacterial fatty acid methyl ester (BAME)
standards (Supelco, Oakvillc, ON) ( ~ ~ p e n d i x 2).
Gas chromatographylmass spectrometry analyses were carried out with a Varian
3800 gas chromatograph coupled to a Varian Saturn 2000 MS detector in El mode. The
GC conditions were identical to those described above, but helium was used as the carrier
gas and the GC oven was held at 80 "C for 2 minutes. Energy in the electron impact was
70 eV.
2.4.3.4 Fatty acid nomenclature
Fatty acids were named according to the convention X:YoZ, where "X" is the number of
carbon atoms in the chain, "Y" is the number of double bonds, and "Z" is the number of
carbon atoms from the methyl end of the molecule to where the first double bond is
encountered. Prefixes are as follows: "i" = iso-branched (methyl branch on the second
carbon from the methyl end), "a" = anteiso-branched (methyl branch on the third carbon
from the methyl end), " 10Me" = methyl branch on the tenth carbon from the carbox~l
end, and "cy" = cyclopropyl, 2-OH and 3-OH indicate hydroxyl substituents on the
second and third carbon from the carboxyl end, respectively. The suffixes "c" and "t"
stand for the cis and truns geometric isomers of the double bond, respectively.
2.4.4 Microbial biomass determinations
The microbial biomass was determined for the sediment samples collected in
2001 by analysis of the lipid-phosphate content after digestion of extracted lipids with
potassium persulfate (Findlay et al., 1989). Briefly, the dried lipid samples were
incubated overnight at 9 5 " ~ with 0.45 m1 of a saturated potassium persulfate solution
(5% W/V) (Aldrich). Phosphate released by digestion was determined by the method of
Van Veldhoven and Mannaerts (I 987). A solution of 0.1 ml of ammonium molybdate
[2.5% (NH4)hMo7024 4H20 in 5.72 N H2S04] was added to the digested samples, and
the mixture was allowed to stand for 10 minutes. This was followed by the addition of
0.45 tnl of a solution containing 0.1 I 1 % polyvinyl alcohol (1 00% hydrolyzed, average
molecular weight 14,000) and 0.01 I % malachite green in water (prepared by dissolving
the polyvinyl alcohol at XO()C, allowing to cool and adding the malachite green). The
solution was then allowed to stand for 30 minutes and the A(,Io was then measured on a
Pharmacia LKB Ultrospec 111 spectrophotomter (zero set with a cuvette filled with
deionized water). Amounts of phosphate were calculated by using the regression line
from a standard curve prepared by digesting 5, 10, 15 and 20 nmol glycerol phosphate as
described above after subtracting a reference blank.
2.5 Microbial degradation of naphthenic acids in by mixed and pure cultures
2.5.1 Naphthenic acid-degrading enrichment cultures
A sample of wetland sediment (Natural Wetland, 1.0g, wet weight) was
suspended into 25 ml of mineral salts medium containing 0.04% (wlv) of commercially
available NA mixture (Kodak Chemicals, Rochester NY) as the sole carbon source.
NA's were dissolved in 0.1 M NaOH to a stock concentration of 20 mglml and filter
sterilized tl1rough a Whatman 0.45 ~111 filter. The mineral salts medium used throughout
this study was that of Focht adjusted to pH 8.2 ( 1 994) (see table 2.1 for a description of
the components). Successive transfers (4% v/v) of the enrichment culture into fresh NA
containing mediuln were made on a twice-weekly basis, and incubated at 28•‹C on a
rotary shaker ( 1 00 rpm). After four successive transfers, 0.2 ml aliquots of the
enrichment culture were spread-plated on R2A (Difco) plates and incubated at 2 8 " ~ for
48 hours.

2.5.2 Identification of Naphthenic acid degrading microorganisms
2.5.2.1 Physiological identification of naphthenic acid degrading organisms
Individual colonies were removed from the R2A plates, streaked onto fresh plates
to ensure purity, and then subjected to taxonomic evaluation. Phenotypic identification
was performed using API 20 N E identification strips (Biomerieux, Lyons, France).
Inoculation of the strips was performed according to the manufacturer's instructions and
identification was done using the API 20 telephone database.
Table 2.2. Components of Focht's mineral salts medium
.-
Stock solutions Additions (ml) Final concentration (mM)
Nallll'04, I M (NH4)?S04, I M
MgSO4, 1 M ('a(N07)2, 1 M Fe(NOi)2, 1 M
Trace Minerals (below) M n S 0 4 %nS04 ('uS04 N i SO4 ('oS04
N a 2 M o 0 4
2.5.2.1 Molecular identification of naphthenic acid degrading organisms
Individual colony types from the R2A plates were streaked onto fresh plates to
cnsure purity. Subsequently, single colonies were used to inoculate 5 ml of tryptic soy
broth (TSR) (BDH), which was then incubated overnight at 2 8 ' ) ~ on a rotary shaker at
100 rpm Thesc cultures were then transferred to 15 ml pol~propylene centrifuge tubes
(Falcon), ccntrifiiged for 15 minutes at 2500 g. To remove residual medium, the pellets
DNA was extracted using a modification of the method of Dewettinck et al,
(2001 ). Briefly, the entire bacterial suspension was transferred to a 15 ml polypropylene
centrifuge tube and 3 ml of 0.1 M sodium phosphate buffer (pH 8.0) was added. An
additional I 1 ml of a solution containing 100 mM NaCI, 500 mM tris-HCI and 10% SDS
(pH 8.0) was then added. The mixture was boiled for 10 minutes after which time it was
cooled on ice and vortexed. A 5 ml aliquot was removed and 2 ml NH40Ac were added.
The sample was then cooled at 4•‹C for 5 minutes and 400 p1 were aliquoted to sterile 1.5
mi centrifuge tubes. DNA was then precipitated by the method of Sambrook et al.
( 1989). Briefly, 800 p1 of ice-cold 95% ethanol were added to the DNA containing
solution, followed by storing the samples at -20•‹C for 30 minutes after which time, the
samples were centrifuged at 14000 g, the supernatants removed and the pellet air dried.
The DNA samples were then resuspended in 100 p1 sterile H20.
Polylnerase chain reaction (PCR) analysis was carried out using primers flanking
the V8 region of the 16s rRNA gene (Marchesi 2001). Bacterial DNA fragments were
amplified in a total volume of 50 pl. The components of the PCR mixture were as
follows: 5 p1 of 10 X PCR buffer, 200 pM of deoxynucleotide triphosphate, 0.5 pM each
of the universal bacterial primers 986F and l406R (Invitrogen), 2 units of Vent DNA
polylnerase (New England Biolabs, Mississauga, ON). Thennocycling conditions were
as follows: initial denaturation at 94•‹C for 3 minutes; 25 cycles of 94•‹C for 30 S, 5 0 " ~ for
45 s, and q) seconds at 72•‹C'; followed by a final extension of 5 minutes. PCR products
were annlyrcd by ](yo /uprose gel electrophoresis separation and ethidium bromide
staining colllparing bands to a I -kb ladder molecular weight standard.
2.5.3 Extraction of naturally occurring naphthenic acids
Free-water from the NW and WH sites were collected in late August 200 1 and the
NA's were extracted by a modification of the method of Holowenko (2001 ). Briefly, 10
L of water from each site (containing the sodium salts of the NA's) were combined and
acidified with H2So4 to pH 2-3 to precipitate acids out of solution and was allowed to
settle for a week. After settling of the suspended solids, the water was siphoned off until
approximately 500 ml remained. The pH of the solution was then brought up to 9 and the
undissolved solids were filtered though a funnel, which had been plugged with glass
wool. This solution was again acidified to pH 2-3 with H2S04 and transferred to a
separatory funnel were i t was extracted 6 times with equal volumes of d ich lor~methan~.
0 The organic phase was concentrated in vuczto at 37 C to a volume of approximately 2 ml
alld transferred to pre-weiglied glass vials. The NA's were then dried under a stream of
N2, weighed and stored at -20 ('c until use.
2.5.4 Microbial degradation of naphthenic acids
Erlenmeyer flasks containing 5 ml of fresh mineral salts medium plus 0.04%
(wlv) of either Kodak NA or NA's extracted from NW and WH as the sole carbon source
were inocLllatod in duplicate wit11 200 p1 of the fourth transfer of microorgani~m~
0 obtained froln the enrichment cultures and incubated at 28 C for a period of one, two and
four weeks. Single culture studies were performed as described above except that the
mcdiurn was inoculated with a single colony isolated from the NA-degrading enrichment
cultures and incubated for a period of four weeks. Control flasks received an inoculum of
heat-killed cells.
After the incubation period, the cultures were transferred to 15 ml polypropylene
centrifuge tubes, and centrifuged for 25 minutes at 2500 g. The supernatants were
removed and transferred to separatory funnels. The pellets were resuspended in 5 m] of
NaH2P04 buffer (pH 10) and centrifuged twice more as described above to remove all
traces of NA, and the supernatants were pooled.
A 0.1 ml volume of caprylic acid (C8 straight chain fatty acid, 1 00ng/pl, Sigma)
was added to the separatory funnels containing the supernatants. The samples were
acidified to pH <2 using 50 pl of concentrated HCI and then extracted four times with 15
ml dichloromethane (OmniSolv grade, BDH) and the solvent was dried over anhydrous
NazSOj and flash evaporated at 35•‹C. The extracts were then transferred to 2 ml vials
and the solvent was evaporated under a gentle stream of N2. Carboxylic acids were
derivatized into their tert.-butyldimethylsilyl esters by the method of St. John et al.
( 1 998). Briefly, 100 pl of the derivatizing reagent (N-methyl-N-(tc.rf.-b~tyldimethylsil~l)
trifluoroacetamide (MTBSTFA, Aldrich) containing 1 % t-BDMS-chloride) was added to
the salnples, which were then heated at hoOc for 20 minutes. Following the incubation,
the sarnples were evaporated under a stream of N? in order to remove all traces of the
dcrivatiring reagent and stored at - 2 0 " ~ until used.
The samples were resuspended in 1 ml hexane and 2 pl were injected in splitless
mode into a Varian 3800 gas chromatograph fitted with a 301n x 0.25mm i.d. DB-5
capillary column ( J & W Scientific, Folsom CA). The temperature program was as
follows: I 0 0 ' ) ~ for three minutes, increasing at ~~ 'C /min to 3 0 0 ~ ) ~ where it as was held
0 for 10 minutes. The injector temperature was 280 C, and helium was used as the carrier
gas.
The eluted samples were detected with a Varian Saturn mass spectrometer in EI
mode (approximately 70 eV). The mass spectrometer was controlled using Saturn
2000.40 software. The MS did not collect ions for the initial 6 minutes of the run and
thereafter was set to report ions within the mass range of 100 to 555. Upon completion of
the run, the data from I0 minutes to the end was averaged to produce a single spectrum of
"averaged" ion intensities. No background subtraction was applied and approximately
3000 scans were averaged to obtain this data.
The tnolecular mass of the [M-571' ions and their averaged intensities were
grouped into Carbon number and Z family and entered into an Excel spreadsheet as
described by Holowenko et al. (200 1 ). The data was normalized as percentages and used
to generate three-dimensional plots. Total amounts of NA's were calculated by
converting the ion intensities into nanograms by using the regression line from a standard
curve generated by analyzing the averaged spectrum generated by 2, 20, 50 and 200 ng of
the tc>l-t.-butyldinietliylsilyl esters of caprylic acid as described above (Appendix 5).
2.6 Statistical analysis
The ~nol O/o of individual PLFA was entered on a spreadsheet into the JMP
program (SAS Institute) and dendrogra~ns were generated according to the Ward method.
Means comparisons for microbial biomass deterininations and selected PLFA were
performed ~lsing two way analysis of variance (ANOVA) and Student's t-test analysis
respectively also i n IMP. I n order to simplify the biomass and PLFA data, the samples
were co11lbincd into thc following two categories: Offsite (NA levels < 5 mg/L and
co~nprisillg H63, FMK, and TR) and Impacted (NA levels > 5WIL and comprising CL,
HS N W. I mCT, SP, WH, P5, MFTS and MFTN). Means comparisons were performed
between the two different categories for each month in the two sampling seasons. For the
biomass analysis the sample sizes were as follows: Offsjte n= 9, Impacted n= 27 except
for the Impactcd sites in June of 2001 in which n= 24. For the PLFA analysis data,
sample sizes were as follows: Offsite n=3, Impacted n= 9, except for the Impacted sites in
August of 2000 and June of 2001 in which n= 8.

CHAPTER THREE: RESULTS
3.1. Microbial community and biomass analysis
3.1.1. Viable Biomass Determinations
The amount of viable biomass in each wetland sediment for the samples collected
in 2001 was determined by the quantification of organic phosphate released from the
polar lipids in the total lipid extract by the method of Findlay et al. (1989, see Materials
and Methods). The amount of the lipid-phosphate in the individual sites is shown in
Table 3.1. In Figure 3.1, data from the 12 sites were grouped into Two categories:
Offsite (NA levels < 5 mg/L and comprising H63, FMK, and TR), Low and high impact
(NA levels > 5 mg/L and comprising NW, CL ,I mCT, SP, WH, HS, P5, MFTS and
M FTN)
Table 3.1 shows that the amount of viable biomass was highly variable in the
twelve sites ranging from 7.75 nmol lipid phosphatelg dry sediment (P5, August) to
278.89 nmol lipid phosphate/g dry sediment (CL, July). Nevertheless, a pattern emerged
such that with the exceptions of NW, WH, and TR, there was a decrease in the amount of
viable biomass between June and July followed by an increase in August. NW and WH
increased in July from 105.38 and 54.18 nmollg dry sediment to 167.50 and 98.7 1 nmol/g
dry sedi~nerlt respectively. TR also increased in July from 69.72 to 101.59 nmol of lipid-
dry sediment followed by a smaller increase to 1 16.47 nm0l of lipid-
phospIlate/g dry sedin~ent in August. The lowest amounts of viable biomass were found
in P5 ( 1 2.95 and 7.75 nmol of lipid-phosphatelg dry sedhnent in June and July
respectively). This is expected as p5 is an active tailings pond and is continuou~ly
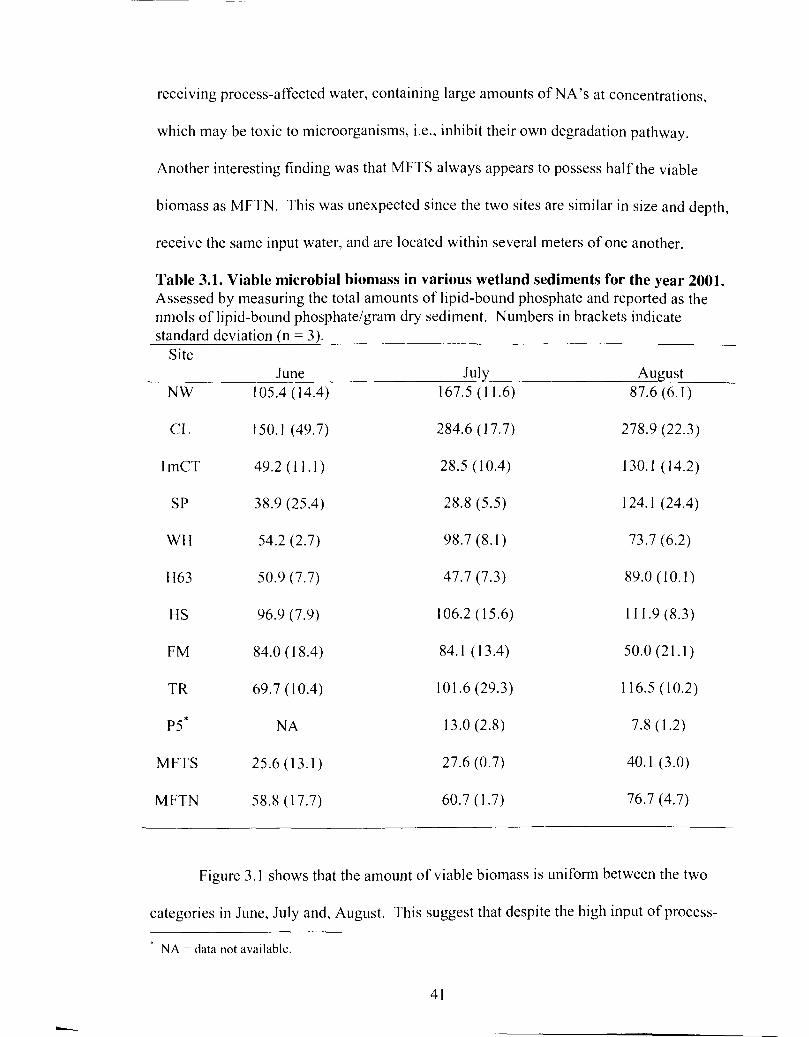
receiving process-affected water, containing large amounts of NA's at concentrations,
which may be toxic to microorganisms, i.e., inhibit their own degradation pathway.
Another interesting finding was that MFTS always appears to possess half the viable
biomass as MFTN. This was unexpected since the two sites are similar in size and depth,
receive the same input water, and are located within several meters of one another
Table 3.1. Viable microbial biomass in various wetland sediments for the year 2001. Assessed by measuring the total amounts of lipid-bound phosphate and reported as the nmols of lipid-bound phosphatelgram dry sediment. Numbers in brackets indicate standard deviation (n = 3).
Site June July August
NW 105.4 (14.4) 167.5 ( 1 1.6) 87.6 (6.1)
MFTS
MFTN 58.8 (1 7.7) 60.7 (1.7) 76.7 (4.7)
Figure 3.1 shows that the amount of viable biomass is uniform between the two
categories in June, July and, August. This suggest that despite the high input of process-
* N A = data not available.
4 1
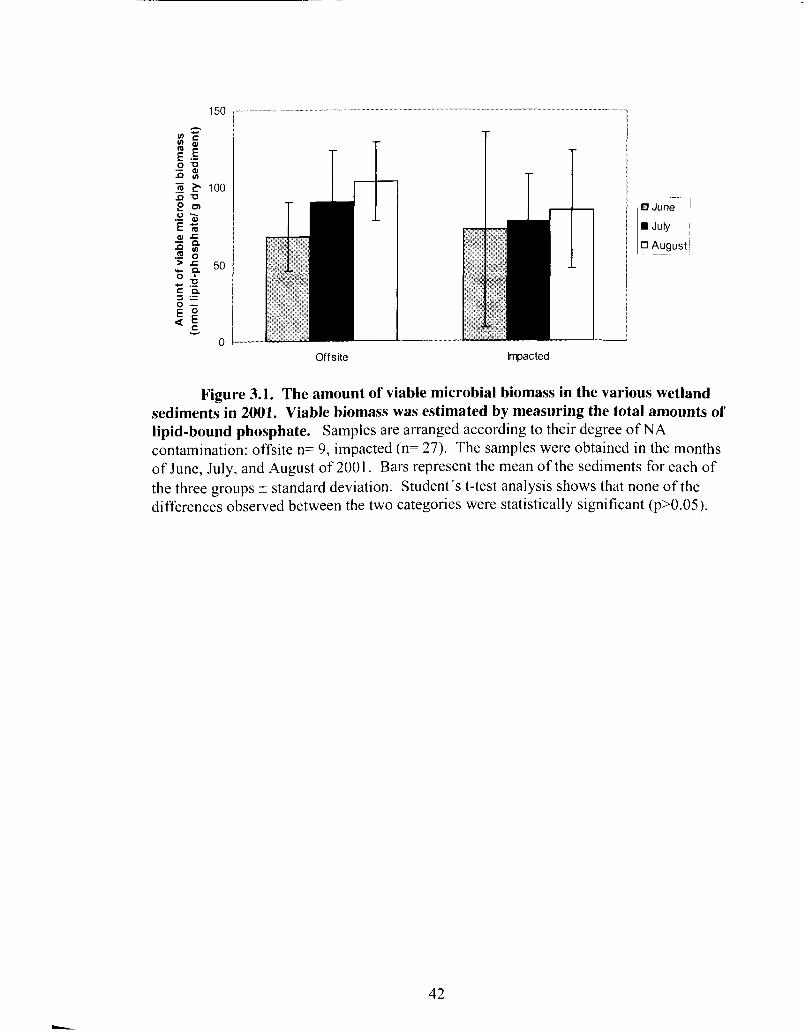
Offsite
0 August
Figure 3.1. The amount of viable microbial biomass in the various wetland sediments in 2001. Viable biomass was estimated by measuring the total amounts of lipid-bound phosphate. Samples are arranged according to their degree of NA contamination: offsite n= 9, impacted (n= 27). The samples were obtained in the months of June, July, and August of 2001. Bars represent the mean of the sediments for each of the three groups + standard deviation. Student's t-test analysis shows that none of the differences observed between the two categories were statistically significant (pXI.05).
affected water and its associated nutrients there may have been toxicity associated with
these higher input levels that prevented the microbial community from exploiting the
additional carbon present in the impacted sites. It should also be noted that microbial
biomass was not affected by particle size. This is supported by the fact that several sites
that possess a similar range of particle sizes such as P5, MFTS, and MFTN, (Appendix 2)
exhibited had very different amounts of microbial biomass.
3.1.2. Microbial Community Analysis
The differences in the microbial community structures of the various wetland
sediments was compared using a technique known as phospholipid fatty acid (PLFA)
analysis. In this technique, the fatty acid composition of phospholipids purified from the
various sediments was determined and quantified by GC and GCIMS analysis by the
method of Frostegard et al. (1997). The mol % of the individual PLFA was determined,
for each sediment, and these values were then entered into a spreadsheet in the JMP
program and dendograms were generated using Ward's method (Figures 3.2 and 3.3).
Our results for the year 2000 indicate that the differences in microbial community
structure assessed by PLFA analysis were unrelated to the amount of NA's in the free
water (Figure 3.2). However, the consistent clustering of sites 10, 1 1, and 12 (P5, MFTS,
and MFTN) may indicate an effect of sediment-bound oil on the microbial community.
This is possibly due to the hydrocarbons in the oil being a more readily degraded carbon
source thereby shifting the community structure towards an oil-degrading community.
However, in 200 1 there appeared to be no relationship between the sediment's microbial
communities and [NA] or sediment-bound oil (Figure 3.3). The dendograms also show
that in all three months of 2000 and in June and July 2001, sites I and 2 (NW and CL)

Oil Contamination Wetland Number
Figure 3.2. Sediment microbial community comparisons based on the PLFA data obtained from sediments sampled in the year 2000. Dendrograms were generated by Ward's method using the total PLFA data in mol %. From top to bottom: June, J ~ ] ~ and August 2000. L indicates low oil contamination (0-0.49 %), M indicates moderate oil contamination (0.50-0.75 %) and, H indicates high oil contamination (> 0.75%). See Materials and Methods p. 24 for each site's ~ ~ m e r i c a l code.
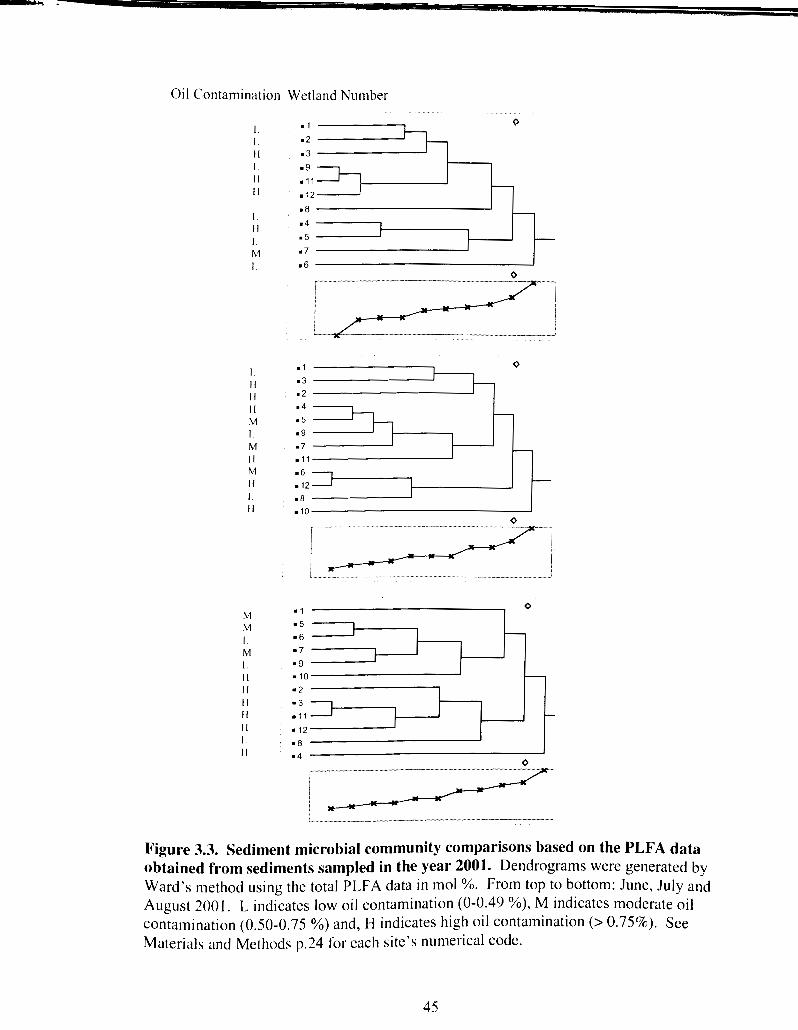
Oil Contamination Wetland Number
Figure 3.3. Sediment microbial community comparisons based on the PLFA data obtained from sediments sampled in the year 2001. Dendrograms were generated by Ward's method using the total PLFA data in mol %. From top to bottom: June, July and August 2001. L indicates low oil contamination (0-0.49 %), M indicates moderate oil contamination (0.50-0.75 %) and, H indicates high oil contamination (> 0.75%). See

cluster together (Figures 3.2 and 3.3) suggesting that their microbial communities are
similar. A1 though the extent of NA input is very different (NW has approximately ten
times the amount of NA's as CL), NW and CL are both very shallow (approximately one
meter), produce of large amount of anaerobic gas, possess similar amounts of sediment-
bound oil (0.2%), and support a wide variety of organisms including birds, frogs,
invertebrates and plants. These results indicate that PLFA clustering was influenced by
factors other than NA concentration. One similarity between these two wetlands was the
presence of large concentrations of macroinvertebrates (mainly chironomid larvae,
assessed visually) in the NW and CL wetlands, which may have influenced the PLFA
profiles.
The shifts in specific PLFA types as well as individual PLFA's was measured to
obtain information on the specific groups of microorganisms, which make up the various
microbial comlnunities as well as the communities' physiological status (White et al,
1996, Zellis, 1999). To simplify the interpretation, the 12 sites were grouped into two
categories related to their level of NA's: Offsite (NA levels < 5 mg/L and comprising
H63, FMK, and TR), Low impact (NA levels between 5 and 10 mg/L and comprising CL
and HS) and high impact (NA levels > 5 mg/L and comprising NW, CL, ImCT, SP, WH,
HS, P5, MFTS and MFTN). The PLFA data from these groups is summarized on Table
3.2.
The proportioll of Gram-negative anaerobes versus Gram-positive aerobes was
lmeasured as the ratios of the is() 1 5 :O/unteiso 1 5:O and PLFA and iso 1 7:0/anteiLso 1 7:O
PLFA with a rdfio of approximately 0.2 being indicative of Gram-positive aerobes and a
ratio greater than 5 indicating Gram-negative anaerobes (White et al. 1996). These data

Tab
le 3
.2. M
ole
perc
enta
ge d
istr
ibut
ion
of P
LF
A's
in s
edim
ent s
ampl
es. N
orm
al S
atur
ates
are
str
aigh
t cha
in s
atur
ated
P
LF
A's
, B
ranc
hed
satu
rate
s ar
e P
LF
A's
pos
sess
ing
a m
ethy
l bra
nch
in th
e ch
ain,
MU
FA a
re m
onou
nsat
urat
ed P
LF
A's
, cy
, are
P
LF
A p
osse
ssin
g a
cycl
opro
pyl c
hain
, Lin
is
lino
leni
c ac
id, a
nd H
ydro
xy a
re P
LFA
con
tain
ing
a hy
drox
y gr
oup
on c
arbo
ns
two
or th
ree.
Res
ults
sho
wn
are
the
mea
n * S
.D. (
in p
aren
thes
es, o
ffsi
te n
= 3,
Low
Im
pact
n=
2, a
nd H
igh
Impa
ct n
= 7
).
June
Ju
ly
Aug
ust
Off
site
L
ow
Hig
h O
ffsi
te
Low
H
igh
Off
site
L
ow
Hig
h Im
pact
Im
pact
Im
pact
Im
pact
Im
pact
Im
pact
P
LF
A ty
pe
Yea
r N
orm
al s
atur
ates
20
00
38.0
4 48
.32
39.1
9 68
.99
63.4
5 61
.67
36.4
4 31
.92
30.2
0
200
1
Bra
nche
d sa
tura
tes
2000
200
1
MU
FA
20
00
P
4
200
1
CY
20
00
200
1
Lin
20
00
200
1
Hyd
roxy
20
00
200
1

for 2001 and 200 1 are sliown in Figures 3.4 and 3.5, respectively. In the year 2000, the
iso I 5:Olunteiso 15:0 ratios indicate that the proportion of Gram-negative anaerobes was
relatively stable between the two categories in June and July. However a large increase
in the variability is observed in August as indicated by the size of the error bars (Figure
3.4). This rather large increase in variability can be partially explained for the impacted
sites by an unusually large increase in the proportion of Gram-negative anaerobes in the
CL site and is not statistically significant. This is supported by the observation that C L
produces a large amount of anaerobic gas. These results indicate a temporal effect in the
proportion of Gram-negative anaerobes versus Gram-positive aerobes for the year 2000.
In 200 1, the iso 1 5:Olunteiso 15:O was significantly lower and more uniform across the
three months within each category, (Figure 3.4). These results suggest that the increase
in the proportion of Gram-negative anaerobes versus Gram-positive aerobes observed in
August 2000 did not occur in 200 1.
In contrast, the large increase in the proportion of Gram-negative anaerobes in
the C L site was not observed when the iso17:Olunteiso 17:O PLFA ratios were calculated
(Figure 3.5). The results for 2000 and 2001 how that the proportion of Gram-negative
anaerobes was uniform in both categories for the three sampling months. However in
June 200 1, the off-site wetlands appear to have a higher proportion of Gram-negative
anaerobes due to a higher than usual ratio for the month of June in the H63 site (2.85
molx) . However these results are not statistically significant.
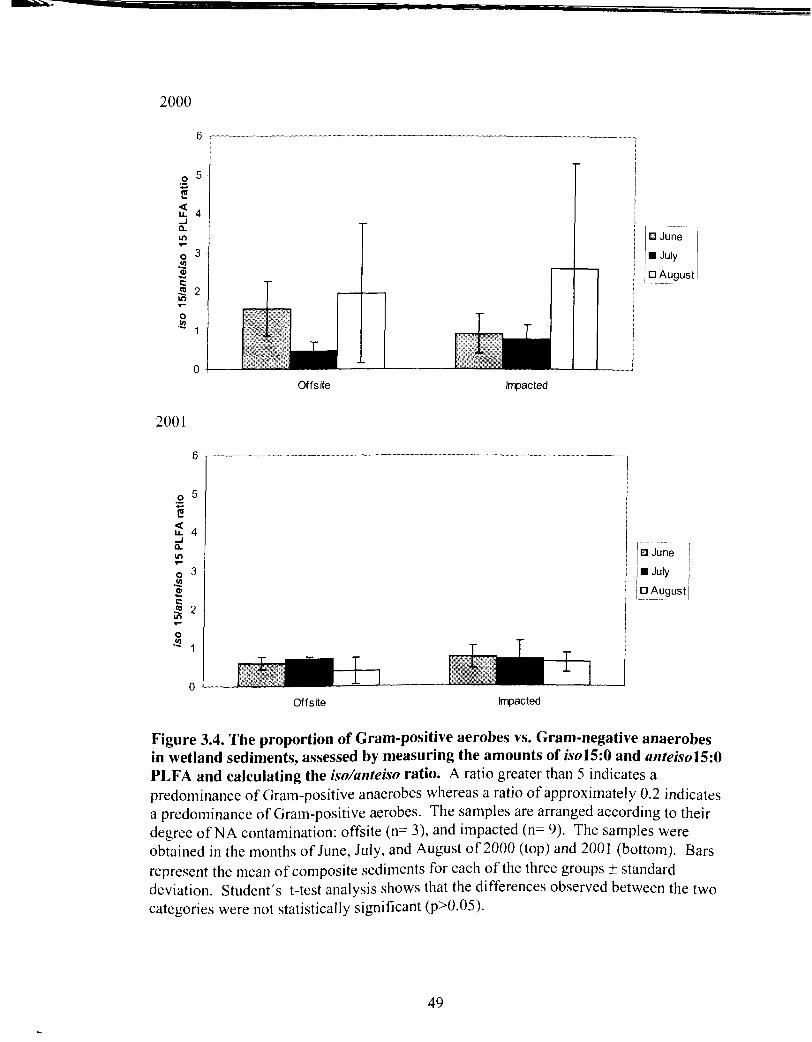
I
1 Ju"e
i W July
Offsite
200 1
Impacted
Offsite Impacted
Figure 3.4, The proportion of Gram-positive aerobes vs. Gram-negative anaerobes in wetland sediments, assessed by measuring the amounts of isol5:O and anteisol5:O PLFA and calculating the iso/anteiso ratio. A ratio greater than 5 indicates a predominance of Gram-positive anaerobes whereas a ratio of approximately 0.2 indicates a predominance of Gram-positive aerobes. The samples are arranged according to their degree of NA contamination: offsite (n= 3), and impacted (n= 9). The samples were obtained in the months of June, July, and August of 2000 (top) and 2001 (bottom). Bars represent the mean of composite sediments for each of the three groups + standard deviation. Student's t-test analysis shows that the differences observed between the two categories were not statistically significant (P0.05) .
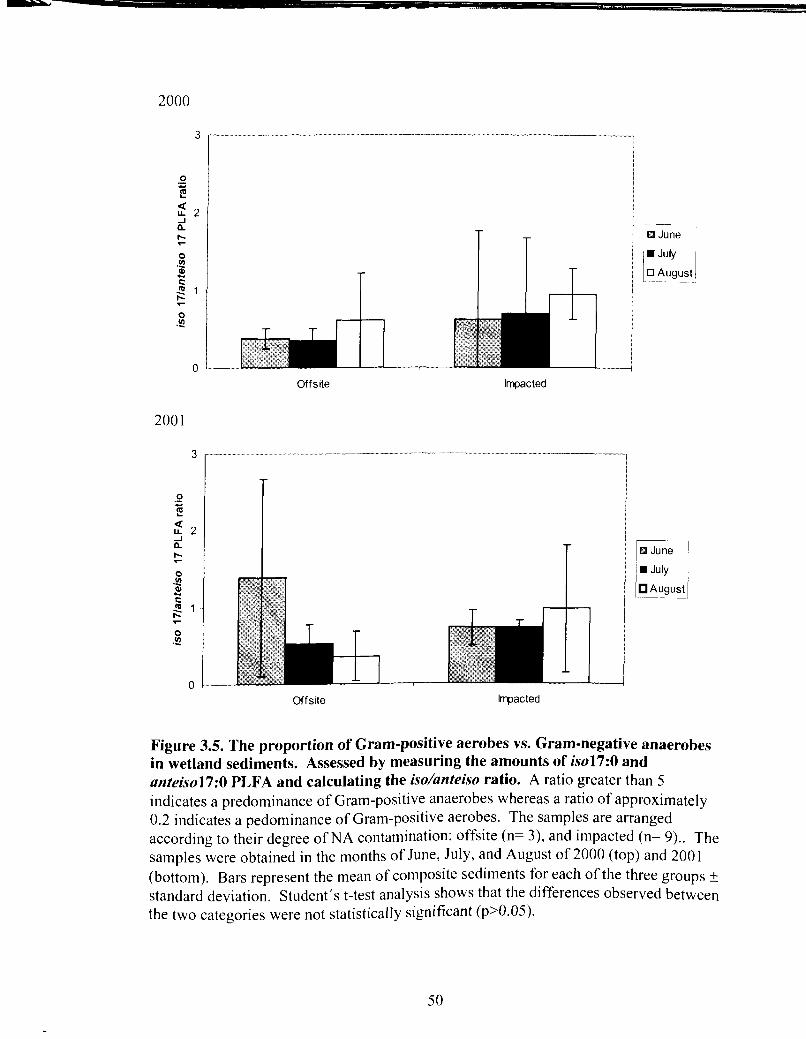
Offsite Impacted
I m T n e -
August
Offsite Impacted
Figure 3.5. The proportion of Gram-positive aerobes vs. Gram-negative anaerobes in wetland sediments. Assessed by measuring the amounts of isol7:O and antei.sol7:O PLFA and calculating the iso/anteiso ratio. A ratio greater than 5 indicates a predominance of ram-positive anaerobes whereas a ratio of approximately 0.2 indicates a pedominance of Gram-positive aerobes. The samples are arranged according to their degree of NA contamination: offsite (n= 3), and impacted (n= 9.. The samples were obtained in the months of June, July, and August of 2000 (top) and 2001 (bottom). Bars represent the mean of composite sediments for each of the three groups standard deviation. Student's t-test analysis shows that the differences observed between the two categories were not statistically significant (P0.05).
mineralization process both in nature and in sewage treatment (Prescott et al, 1996). The
proportion of pseudomonads in the sediment samples was measured as the sum of the 2-
hydroxy l4:O and 2-hydroxy l 6:O PLFA's (Zellis et al. 1999, Figure 3.6.). In 2000, the
number of pseudomonads were highest in June ( 1 2.42 and 8.86 mol % for the offsite and
impacted sites, respectively), decreased in July (1.63 and 3.36 for the offsite and
impacted sites, respectively) and increased slightly in August (3.69 and 7.2 1 mol % for
the offsite and impacted sites respectively). There was no relationship between the
proportion of pseudomonads and the degree of NA contamination. Rather, it was
dominated by the monthly and yearly seasonal changes. In 2001, the proportion of
pseudomonads decreased significantly in all sites, nevertheless, as observed in 2000,
values in June were the highest (Figure 3.6). It is possible that the differences observed in
the proportions of Gram-negative anaerobes and pseudomonads (Gram-negative aerobes)
were partly due to large differences in rainfall in 2000 vs. 2001 (possibly due to the
increase in nutrients such as carbon sources from decaying plants from run-off water that
is associated with higher precipitation).
Another group of soil microorganisms that have a wide metabolic capability are
the actinomycetes. These are Gram-positive bacteria that possess filamentous hyphae
that do not undergo fragmentation and produce asexual spores. Furthermore, they are
widely distributed and can degrade a wide variety of organic compounds. They are also
responsible for the production of the majority of the medically useful antibiotics
(Prescott, 1996). The proportion of actinomycetes in the sediment samples was measured
as the sum of the 10Me l6:0, 10Me l7:0 and the 10Me l8:O PLFA's (White et al, 1996).
The results in Figure 3.7 indicate that in 2000, the number of actinomycetes was uniform

Offsite Impacted
I August /
f E l June
July
0 Augusi
Offsite impacted
Figure 3.6. The proportion of pseudomonads in the total microbial community of sediment samples, Assessed by measuring the amounts of 2-hydroxy PLFA's. The samples arc arranged according to their degree of NA contamination: offsite (n= 3), and impacted (n= 9). The samples were obtained in the months of June. July, and August of 2000 (top) and 200 1 (bottom). Bars represent the mean of composite sediments for each of the three groups f stalldard deviation. Student's t-test analysis shows that the differences between the two categories were not statistically significant (p>0.05).

across the two categories in June and August, but decreased significantly in July in both
categories (from approximately 2.00 mol% to 0.80 and l .OO mol% for the offsite and
impacted sites, respectively). There was no relationship between the number of
actinomycetes and the degree of NA contamination. In 2001, the number of
actinomycetes was similar between the two categories except for August when the
proportion of actinomycetes more than doubled to about 2.00 mol% in the impacted sites
(Figure 3.7). These results also show that in August of 2000, the wetland conditions
caused a simultaneous increase in both the proportion of actinomycetes, the proportion of
Gram-negative anaerobes (Figures 3.4). However, only the results observed in June 200 1
were statistically significant.
Microeukarytes such as fungi and protozoans, can be predatory to the bacteria in
the wetland sediments thereby maintaining a fine balance between the microrganisms in
the sediments and possibly affecting the bioremediation potential of the different
sediments (Zelles, 1999). The proportion of microeukaryotes in the sediment samples
was measured as the amount of linolenic acid (1 8:203, White et al, 1996). Figure 3.8
shows that in the 2000 samples, the proportion of microeukaryotes was lower in the
offsite wetlands in June, uniform in July and lower in the impacted sites in August. The
proportion of microeukaryotes in 2001 was almost four-fold higher than in 2000 although
there was no difference between the two categories in the three months. However, only
the results observed in June 2000 were statistically significant.
Finally, another fictor affecting the degradation of organic compounds by
microorganisn~s i n wetland sediments is the presence or absence of nutrients. This is
reflected by thc physiological statc of the microorganisn~s with those in nutrient-poor

Offsite Impacted
~ u n e 1 ; H July ~ 1 0 August]
Offsite Impacted
Figure 3.7. The proportion of actinomycetes in the total microbial community of sediment samples, assessed by measuring the amounts of 10-methyl PLFA's. The samples are arranged according to their degree of NA contamination: offsite (n= 3). and impacted (n= 9). The samples were obtained in the months of June. July, and August of 2000 (top) and 200 1 (bottom). Bars represent the mean of composite sediments for each of the three groups + standard deviation. Student's t-test analysis shows that the differences observed between the offsite and impacted sites in June of 2001 were statistically significant ( ~ 4 . 0 5 ) .

Offsite Impacted
I
June 1
J u l y
0 August
Q June
July
0 ~ u ~ u s t 1
Offsite Impacted
Figure 3.8. The proportion of microeukaryotes such as fungi and algae in the total microbial community. Assessed by measuring the amounts of linolenic acid. The samples are arranged according to their degree of NA contamination: offsite (n= 3), and impacted (n= 9). The samples were obtained in the months of June (a), July (b), and August (c) of 2000 and 2001. Bars represent the mean of composite sediments for each of the three groups + standard deviation. Student's t-test analysis shows that the differences observed between the offsite and impacted sites in June of 2000 were statistically significant (~41.05) .
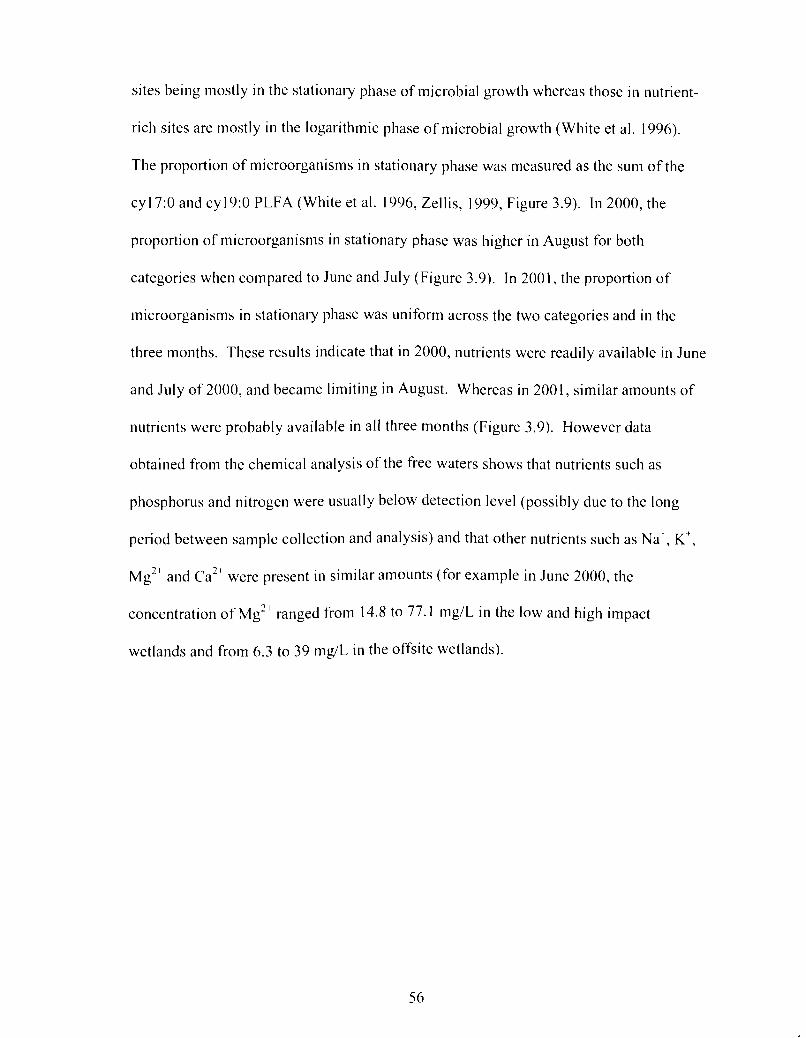
sites being mostly in the stationary phase of microbial growth whereas those in nutrient-
rich sites are mostly i n the logarithmic phase of microbial growth (White et al. 1996).
The proportion of microorganisms in stationary phase was measured as the sum of the
cy l7:O and cy 19.0 PLFA (White et al. 1996, Zellis, 1999, Figure 3.9). In 2000, the
proportion of microorganisn~s in stationary phase was higher in August for both
categories when compared to June and July (Figure 3.9). In 2001, the proportion of
microorganisms in stationary phase was uniform across the two categories and in the
three months. These results indicate that in 2000, nutrients were readily available in June
and July of 2000, and became limiting in August. Whereas in 2001, similar amounts of
nutrients were probably available in all three months (Figure 3.9). However data
obtained from the chemical analysis of the free waters shows that nutrients such as
phosphorus and nitrogen were usually below detection level (possibly due to the long
period between sample collection and analysis) and that other nutrients such as ~ a ' , K',
M ~ ' ' and ca" were present in similar amounts (for example in June 2000, the
concentration of ~ g ? ' ranged from 14.8 to 77.1 mg/L in the low and high impact
wetlands and from 6.3 to 39 mg/L in the offsite wetlands).
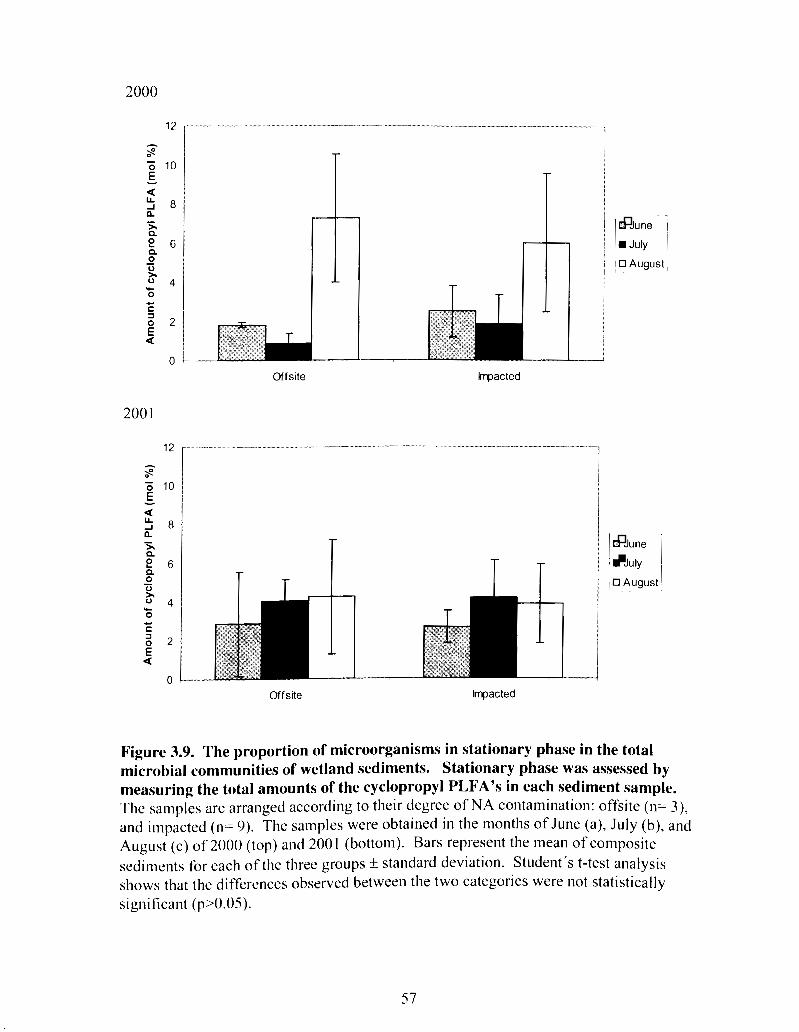
Offsite hpacted
_ ._ ._ _ . _ ^.
Offsite Impacted
June I . July ~ 0 August
June
July
0 August
Figure 3.9. The proportion of microorganisms in stationary phase in the total microbial communities of wetland sediments. Stationary phase was assessed by measuring the total amounts of the cyclopropyl PLFA's in each sediment sample. The samples are arranged according to their degree of NA contamination: offsite (n= 31, and impacted (n= 9). The samples were obtained in the months of June (a), July (b), and August (c) of 2000 (top) and 2001 (bottom). Bars represent the mean of composite sediments for each of the three groups f standard deviation. Student's t-test analysis shows that the differences observed between the two categories were not statistically significant (pX1.05).

3.2. Microbial degradation of surrogate naphthenic acids in microcosms
3.2.1. '4~-cyclohexane carboxylic acid (CCA)
The ability of the microbial communities in various wetland sediments to degrade
the monocyclic (Z - -2) NA surrogate cyclohexane carboxylic acid (CCA) was assessed
by incubating the sediments with their natural waters and 1 4 ~ - ~ ~ ~ . The release of I4Co2
from thc microcosms was monitored over a two-week period by trapping the C 0 2 in
scintillation fluid containing ethanolamine (SCMMEA) by the method of Lai et al. (1996)
(described in Materials and Methods pp. 25-27). The degradation rates were then
calculated from the linear portion of the '"c-CCA degradation profile (days 0-4, Figure
3.10). The rates or maximum amounts of CCA degraded over 14 days were arranged in
order of increasing N A concentration. To simplify the interpretation, and make the
results comparable to those obtained from the PLFA analysis, the individual CCA
degradation rates were combined into three categories: Offsite (comprising H63, FMK,
and TR), Low impact (comprising CL and HS) and High impact (comprising NW, I mCT,
SP, WH, p5, MFTS and MFTN) as described above.
In 2()()(), the total amount of I"-CCA mineralized was relatively uniform across all sites
wit11 20 to 30% of the radioactive label being released as '"02 (Figure 3.1 1). A
noticcable exception occurred in two off-site samples, the FM site in which the total
amount of 'YO? released was approximately 14 and 8%, in June and July respectively,
14 and in the H63 site in July in which the amount of CO? released was approximately
15%. 111 August, there was an observable decrease in the total amount of "c-CCA
degraded across the 12 sites with only 8.4 k 3.2% to 17.9 * 17.4% of the radioactive label

0 3 6 9 12 15
Time (days)
Figure 3.10. A typical CCA mineralization profile by three sediment microbial communities. The of "CO~ from I4c-labelled CCA was measured over 14 days in a lnicrc)cosm containing sediment pl11s water from an off-site wetland (H63). a large wetland in a reclaimed area containing very low levels of NA contamination (HS), and an active tailings pond (P5). Samples were collccted and analyzed in July 2001 as stated in Materials and Methods.
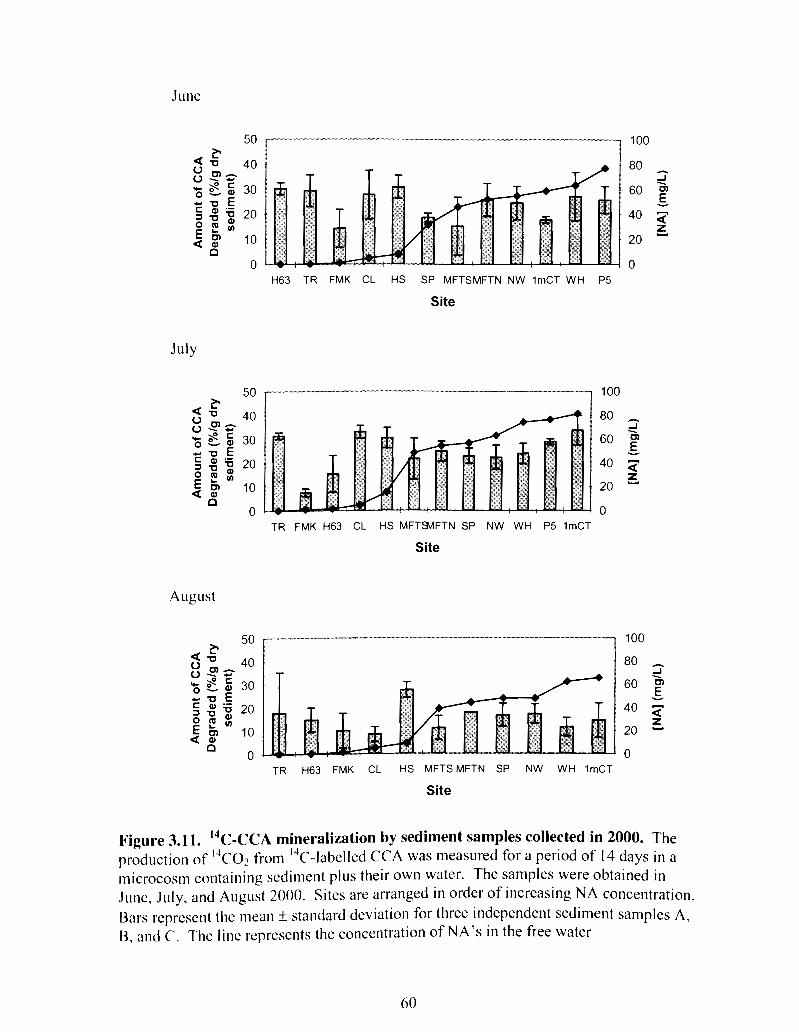
June
50
July
50
H63 TR FMK CL HS SP MFTSMFTN NW 1rnCT WH P5
Site
TR FMK H63 CL HS MFTWFTN SP NW WH P5 IrnCT
Site
August
"
TR H63 FMK CL HS MFTSMFTN SP NW WH 1mCT
Site
Figure 3.1 1. "C-CCA mineralization by sediment samples collected in 2000. The production of I4Co2 from "c-labelled CCA was measured for a period of 14 days in a microcosm containing sediment plus their own water. The samples were obtained i n June, July, and August 2000. Sites are arranpd in order of increasing NA concentration. Bars represent the inean + standard deviation for three independent sediment samples A, B, and C . he line rcpresellts the concentration of NA's in the free water
being released. An exception to this finding was observed in the HS site in which no
noticeable difference was observed (Figure 3.1 1).
In 2001 the total amount of '"c-CCA degraded also appeared to be uniform than
in 2000 with approximately 20 to 30% of the radioactive label being releases as ' " ~ 0 ~ .
Again. there was a noticeable decrease in the total amount of I 4 C - C c ~ degraded across
the 12 sites with 12 to 25% of the radioactive label being released (Figure 3.12).
The rate of '"c-CCA mineralization was uniform across the three categories in
2000 ranging between 2.0 and 6.5 %/day/g dry sediment. However it should be noted
that the high impact sites exhibited slightly lower mineralization rates and that there was
an observable decrease in the overall mineralization in August. In 2001, the I 4 c - C C ~
mineralization rates were also relatively uniform ranging between 2 and 6 %/day/g dry
sediment with the exception of HS in June, which exhibited an abnormally higher CCA
mineralization rate at 8.58 %/day/g dry sediment. As in 2000, the mineralization rates
were somewhat lower in the sites with higher amounts of NA contamination and in
~ u g u s t althougll these results were not statistically significant (Figure 3.13).
These results indicate that all sites possess microorganisms capable of degrading
'"-CCA and the there is a temporal effect on the mineralization rates such that the
August rates were lower compared to June and July. Figure 3.9 showed that the
proportion of microorganisms in the stationary phase of microbial growth increased in
August 2000 suggesting that the CCA mineralization rates decreased as the proportion of
microorganisms in stationary phase increased.

June
TR H63 FMK CL HS SP MFTS WH NW MFTN IrnCT
Site
July
TR FMK H63 CL HS MFTSMFTN NW SP IrnCT P5 WH
Site
August
., FMK TR H63 HS CL IrnCTMFTNMFTS SP NW WH P5
Site
Figure 3.12. I 4 M X 4 mineralization by sediment samples collected in 2001. The production of '.'CO~ from '.'c-labclled CCA was measured for a period of 14 days in a microcosm containing sediment plus water. The samples were obtained in June, July, and August, 2001. Sites are arranged in order of increasing NA concentration. Bars represent thc mean f standard deviation for three independent sediment samples A, B, and (.. The line represents the concentration of NA's in the free water.
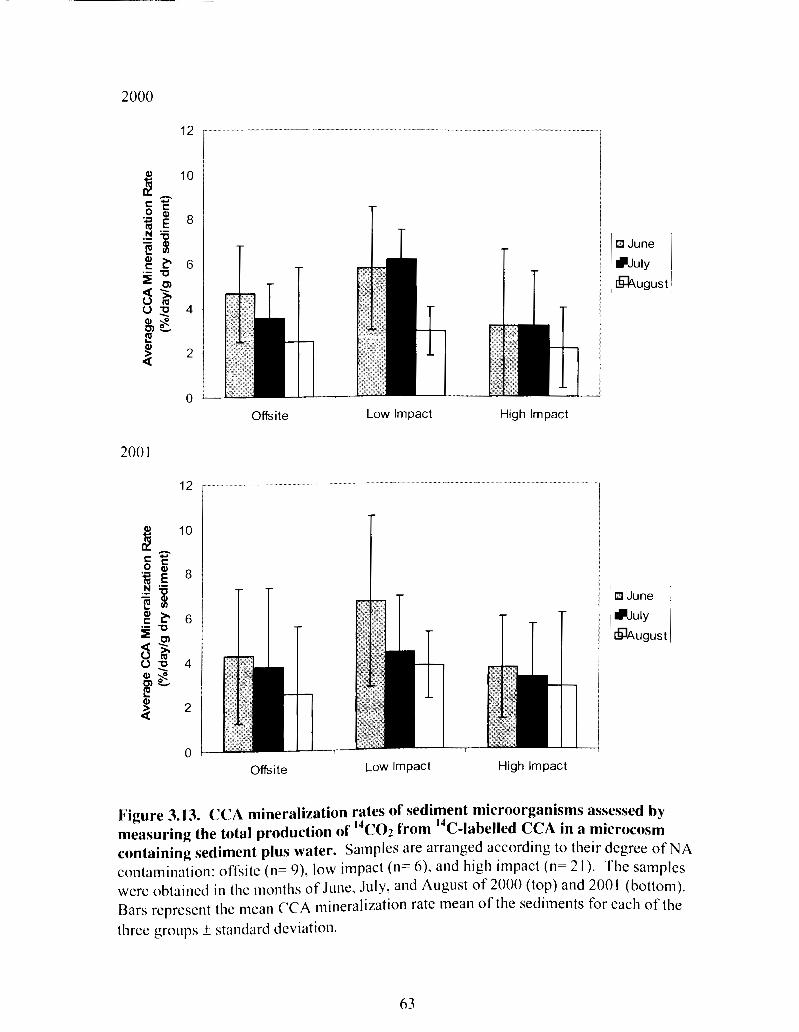
Offsite Low Impact High lmpact
Offsite LOW Impact High Impact
13 June
July
; August
13 June
July 1 1 August ~
Figure 3.13. CCA mineralization rates d sediment microorganisms assessed by measuring the total production of I 4 C ~ 2 from "c-labelled CCA in a microcosm containing sediment plus water. Samples are arranged according to their degree of N A contamination: offsitc (n= 9), low impact (n= 6). and high impact (n= 2 1) . The samples wcre obtained in the months of June. July. and August of 2000 (top) and 2001 (bottom). Bars rcprmcnt tllc illcan CCA mineralization rate mean of the sediments for each of the tlircc groups + standard deviation.

3.2.2. 14~-decahydro-2-naphthoic acid (DHNA)
Due to the fact that the majority of the NA's in samples obtained from oil sands
process-affected waters belong to the Z= -4 family and that the rate of biodegradation is
inversely proportional to the degree of cyclization (Morales et al. 1993), the ability of the
microbial communities in various wetland sediments to degrade the bicyclic (Z = -4) NA
surrogate (DHNA) was measured. This was performed by the same methods used to
study the degradation of ' 4 ~ - ~ ~ ~ . Degradation rates and the total amount degraded in
14 days were calculated from the linear portion of the ' k - D H N A degradation profile
(Figure 3.14). The rates and maximum amounts of DHNA degraded were arranged in
order of naphthenic acid concentration and these data are presented in Figures 3.15 to
3.17. To simplify the interpretation, the 12 wetland sediments were grouped into three
categories: Offsite wetlands (H63, FMK, and TR), Low impact (CL and HS) and High
impact (NW, I mCT, SP, WH, P5, MFTS and MFTN) as described above.
The degradation pattern observed with I4c- DHNA, was very different than that
observed with I 4 c - c c ~ . Whereas the amount and degradation rates of "c-CCA were
relatively constant and high across all wetlands (up to 30% degraded within 14 days),
Figure 3.15 shows that in 2000, the levels of '*c- DHNA degraded were much higher for
the samples that had been exposed to process-affected water than for the off-site wetlands
(from 22.4 +I . 1% in 1 mCT compared to 1 1.2 + 3.1% in TR, Figure 3.15). I t should also
be boted tha in August of 2000, the amount of DHNA degraded decreased significantly
compared with that observed in June and July (from 2.4 f 2.1% in TR to 1 1.4 k3.2% in
In 200 1, the total amount of DHNA degraded was more uniform in June and July
again with the levels of '"c- DHNA degraded being negligible in the offsite wetlands and

0 3 6 9 12 15
Time (days)
Figure 3.14. A typical "c-DHNA mineralization profile of sediment samples collected in 2001. The production of I4c02 from 14~-labelled DHNA was measured over 14 days in a microcosm containing sediment plus water from an off-site wetland (H63), a large wetland in a reclaimed area containing very low levels of NA contamination (HS) and an active tailings pond (P5). Samples were collected and analyzed in July 2001. WH).
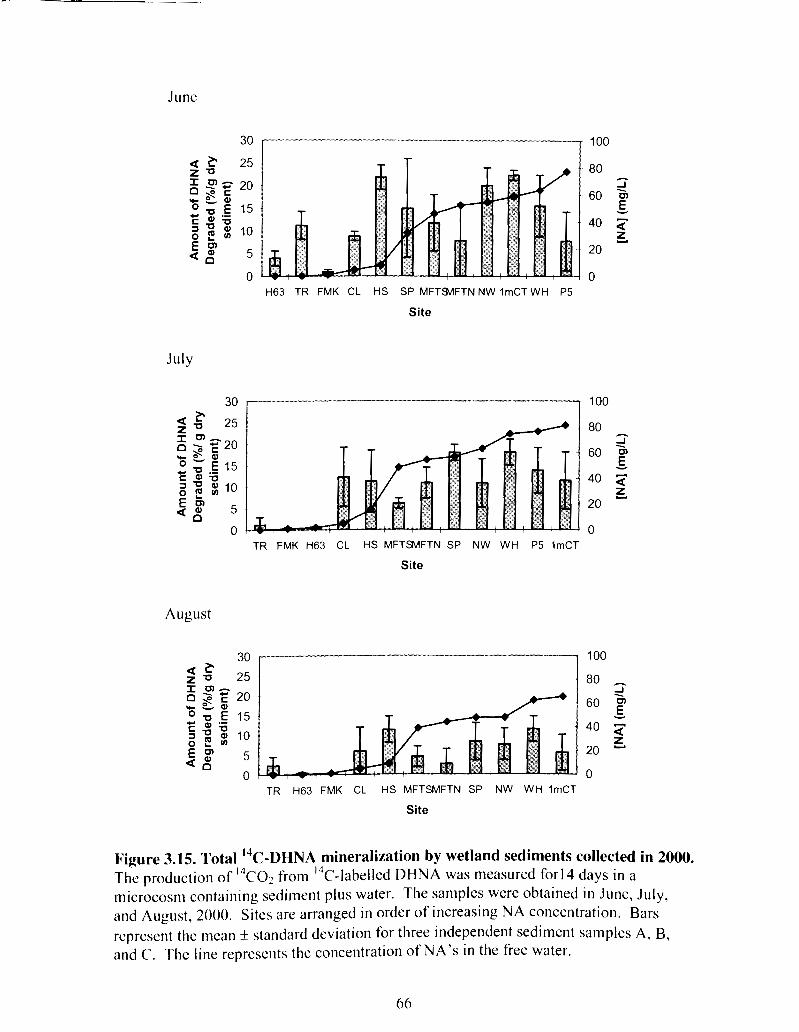
June
H63 TR FMK CL HS SP MFTWFTN NW lmCT WH P5
Site
July
TR FMK H63 CL HS MFTSMFTN SP NW WH P5 lmCT
Site
30 100
~6 25 80 ,
2 $ ~ 2 0 i - S o 0 60 -
40 - 20 t
0 0 TR H63 FMK CL HS MFTSMFTN SP NW WH ImCT
Site
Figure 3.15. Total "c-DHNA mineralization by wetland sediments collected in 2000. Thc production of '.'co: from "c-labelled DHNA was measured for14 days in a microcosm containing sediment plus water. The samples were obtained in June, July, and August, 2000. Sites arc arranged in order of increasing NA concentration. Bars represent thc mean f standard deviation for three independent sediment samples A, B, and C. ~ 1 1 ~ lint represents the concentration of NA's in the free water.

much higher for the samples that had been exposed to process-affected water (up to 15%,
Figure 3.16). However, it should be noted that in contrast to the results obtained in
August of 2000, the maximun~ amount of DHNA degraded increased in August of 2001
(Figures 3.15 and 3.16).
The ' 4 ~ - ~ ~ ~ ~ mineralization rates supported these observations. Together,
these data indicate that the mineralization rates of '"-DHNA were low to negligible in
off-site wetlands compared to sites that received even low amounts of process-affected
water. This pattern is consistent in all three months in 2000 and 2001 ( Figures 3.15 to
3.17). It should be noted that the DHNA mineralization rates were six to fifty times
lower than the CCA mineralization rates (from 0.65 to 1.5 %/day/g dry sediment for
DHNA versus 2.47 to 6.20 %/day/g dry sediment for CCA in 2000 and from 0.04 to 1.13
%/day/g dry sediment for DHNA compared versus 2.54 to 6.70 %/day/g dry sediment for
CCA in 2001).
These results show that the proportion of microorganisms responsible for the
mineralization of ' 4 ~ - ~ ~ ~ ~ decreased drastically in 2001. This correlates with the
results shown in Figure 3.6, which show that the proportion of pseudomonads decreased
significantly in 200 1 thereby suggesting that pseudmonads may be at least partially
responsible for the mineralization of DHNA and therefore of NA's belonging to the Z= -4
family and higher.

June
July
TR FMK H63 CL HS MFTWFTN NW SP ImCT P5 WH
Site
August
FMK TR H63 HS CL ImCTMFTMIIFTS SP NW WH P5
Site
Figure 3.16. "c-DHNA mineralization by wetland sediments collected in 2001. The production of "CO? from '4~-label led DHNA was measured for 14 days in a microcosm containing sediment plus water. The samples were obtained in the months of June, J ~ ] Y , and August, 200 I. Sites are arranged in order of increasing NA concentration. Bars represent the mean -t standard deviation for three independent sediment samples A, B, and C. The line represents the concentratioll of NA's in the free water.

Offsite Low Impact High lmpact
fa June
July
Augusl -
' June 1 August
Offsite Low Impact High Impact
Figure 3.17. DHNA mineralization rates of wetland sediment samples assessed by measuring 14c02 production from "c-labelled DHNA in a microcosm containing sediment plus water. Samples are arranged according to their degree of NA contamination: offsite (n= 9), low impact (n= 61, and high impact (n= 21). The samples were obtained in the months of June, July, and August of 2000 (top) and 2001 (bottom). Bars i-qresent the mean DHNA mineralization rate mean of the sediments for each of the three groups f standard deviation.
3.3. Isolation of Pseudonzonas spp from Naphthenic acid-degrading enrichment
cultures
Although it is well known that NA's are removed from process-affected waters by
microbial degradation, the precise metabolic pathways remain unknown (Nix et al. 1993,
Lai et al. 1996, Schley et al. 1998). Holowenko et al. (2002) have shown that in samples
obtained from aged process-affected waters, the majority of NA's had 22 or more carbon
atoms (termed the "C22+ cluster"). This increase in the C22+ cluster was also found to
correlate with a decrease in toxicity when compared with fresh process-affected waters
(Holowenko et al. 2002). The purpose of this study was to isolate NA-degrading
microrganisms in an effort to increase our understanding of the NA degradation process.
Using commercially-available NA's from Kodak as the sole carbon source and
sediments obtained from an active tailings pond, we isolated microbes of two distinct
colony types. One isolate grew much faster than the other on R2A media, and grew in
well-defined colonies. The other isolate appeared slimy with somewhat translucent
colonies. Both colony types secreted a diffusible yellow pigment and were Gram-
negative, oxidase-positive rods. PCR was used to amplify the V8 region of the 16s
rRNA gene (Marchesi et al, 2001 ). DNA sequencing and analysis of the amplicon using
the BLAST database identified these two organisms as members of the Pseu&monus
genus. Identification to species level was perfwmed using the API 20 NE identification
strips, wllicI1 are specific for Gram-negative lnicroorganisms isolated from ellvironmental
samples. The fast-growing bacterial isolate was identified as Pscudontonu.~ p / i & and
was designated as P, putid'/ LDI and the slow-growing isolate was identified as
I'.~err~io,~a~nu,s,fI~~o~e,sc'e~~,s and was designated P. fluorescens LD2.
3.4. Microbial degradation of naphthenic acids
Biodegradation studies were carried out using a mixed culture of the two
Pseudon~onas isolates, and commercially available NA's (Kodak) as well as a
combination of NA's extracted from the NW and WH sites (2.0 mg in a 5ml culture).
After 48 hours, the cultures became turbid when compared to the autoclaved controls
indicating that the mixed culture was able to grow on NA's as a sole carbon source.
To quantify the ability of the enrichment cultures to degrade the commercially
available NA mixture, culture supernatants were acidified, the remaining NA's were
extracted from the growth medium, derivatized into their tert.-butyldimethylsilyl esters
and analyzed by GUMS. Upon electron impact, these derivatives give rise to very few
fragments of which the base ion is the [M-C~HV] ' ion (loss of the t-butyl group or M-57).
Thus by derivatizing the NA's mixture, it is possible to obtain molecular mass and
structural information for its components by entering the ion intensities corresponding to
the M+57 peaks into a matrix such as the one shown in Appendices 6 and 7 (Holowenko
et al., 2001). The major limitation of this method is that it cannot distinguish between the
various isomers, such as cis and truns, R and S, and positional isomers of the R-group.
GC/MS analysis of the tert.-butyldimethylsilyl esters of the pure Kodak NA's showed a
series of unresolved peaks that created a "hump" in the chromatographic profile that
eluted just after the internal standard caprylic acid (Figure 3.18 A). When the NA
mixture was inoculated with the NA-degrading enrichment culture a reduction in the size
of the hump was observed (Figure 3.18 C). Within one week, the NA "hump" was much
smaller, compared to the control flasks that contained autoclaved microorganisms (Figure
3.18 B). Samples taken two and four weeks after inoculation showed further decreases in

the NA"humpW s ~ z e (Figure 3.18 D and E). Partial resolution and quantification of
individual NA's was achieved by a modification of the method by Holowenko et al.
(2001, see Materials and Methods pp.36-37). Figure 3.19 shows that the mixed culture of
two pseudomonads was able to mineralize over 95 % of the NA's present in the culture
flasks. In contrast, GCIMS analysis of the NA mixture inoculated for four weeks with
citlier 1'. putitluLD 1 or P. flzrorescensLD2 alone did not show a noticeable reduction in
tlie size of the NA hump. Quantification of the remaining NA's showed that after four
weeks, the single-organisms were each able to remove approximately 15% of the NA's
whereas the mixcd culture removed over 95% of the NA's present (Figure 3.20). Partial
resolution of tlie NA's by GCIMS showed that the pure cultures primarily degraded the
NA's belonging to the Z = 0 and -2 families compared to the autoclaved controls (Figure
3.2 1 , controls not sliown). It should also be noted that incubation of the mixed culture of
strains LDI and LD2 with "aged" NA purified from sites number 1 and 5 (Natural
Wetland and Wcst Hummock, respectively) resulted in undetectable changes to the NA
profile. Partial resolution of the aged NA showed that their composition (measured as
their percent abundance) was almost identical to that of the kodak NA after four weeks of
&gradation by the mixed culture (Figure 3.22). This indicates that aged NA from the
Suncor I nc. site arc recalcitrant to degradation by these Pseudomonus species.
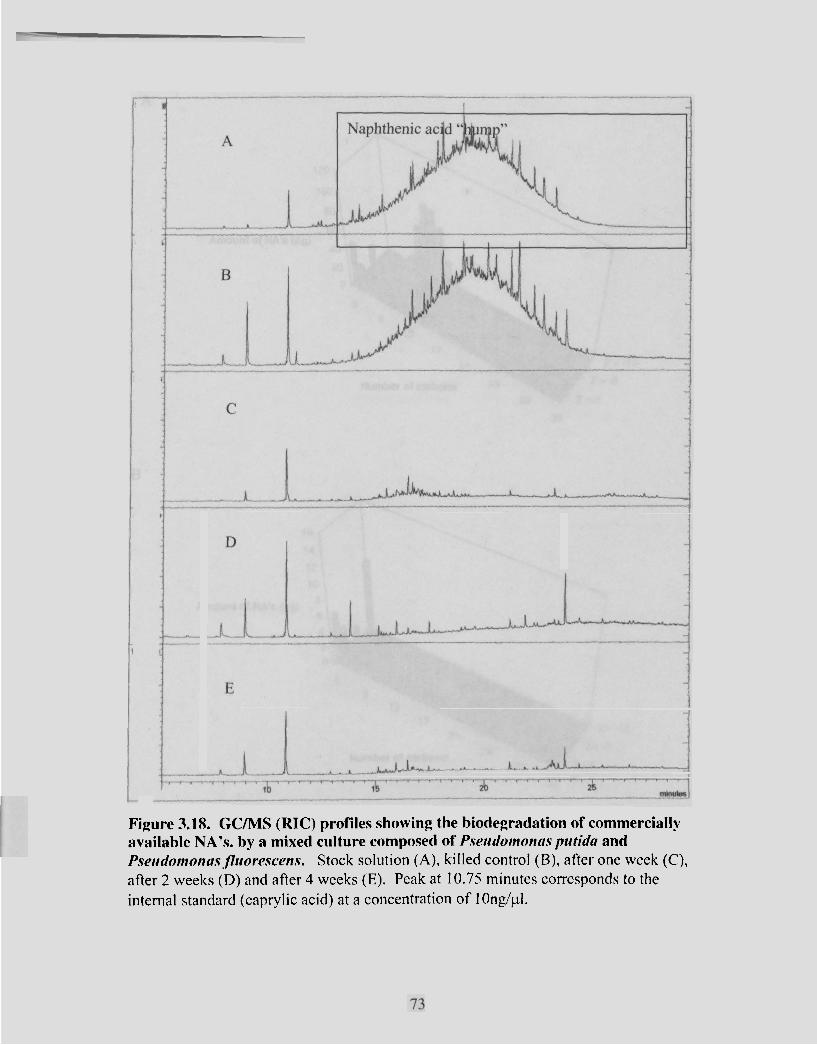
Figure 3.18. GCIMS (RIC) profiles showing the biodegradation of commercially available NA's. by a mixed culture composed of Pseridorr~onas putida and Pseirdomonas~flrioresce~~s. Stock solution (A), killed control (B), after one week (C), after 2 weeks (D) and after 4 weeks (E). Peak at 10.75 minutes corresponds to the internal standard (caprylic acid) at a concentration of I Ong/pl.
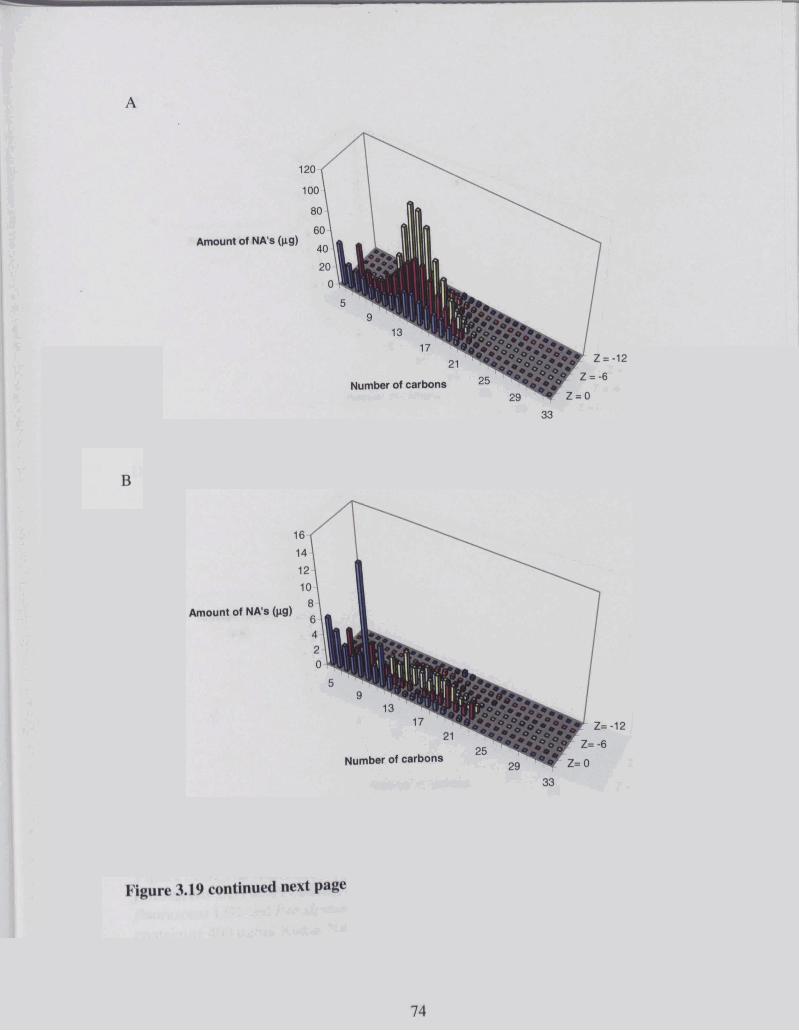
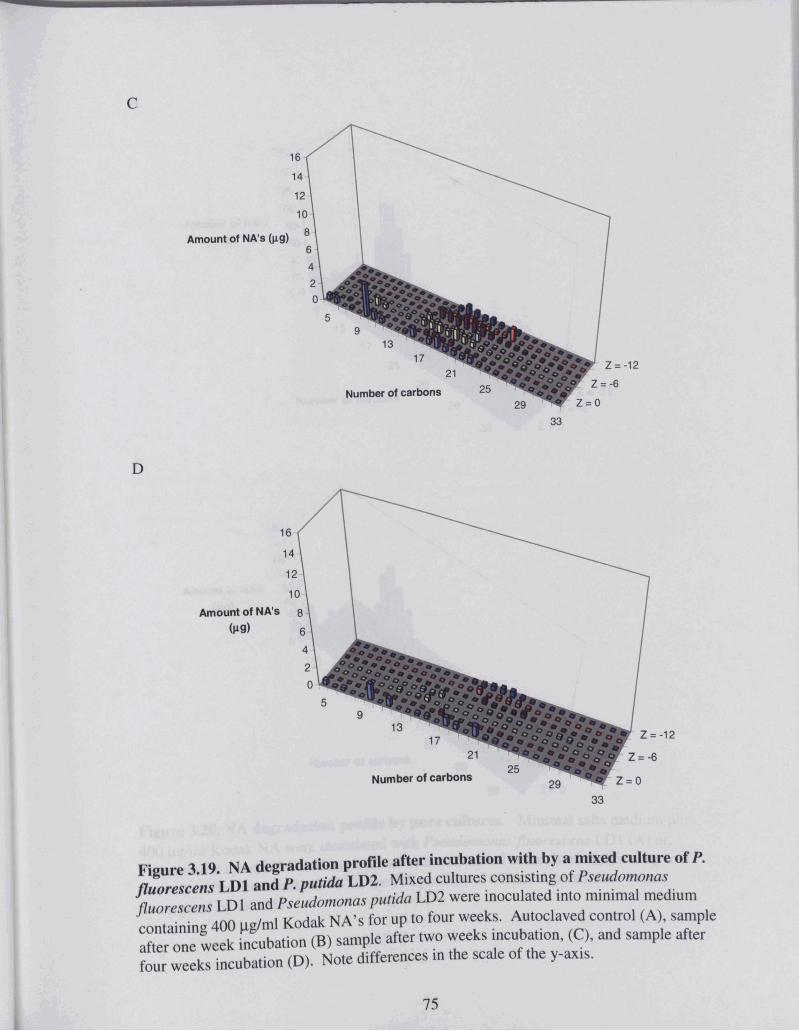
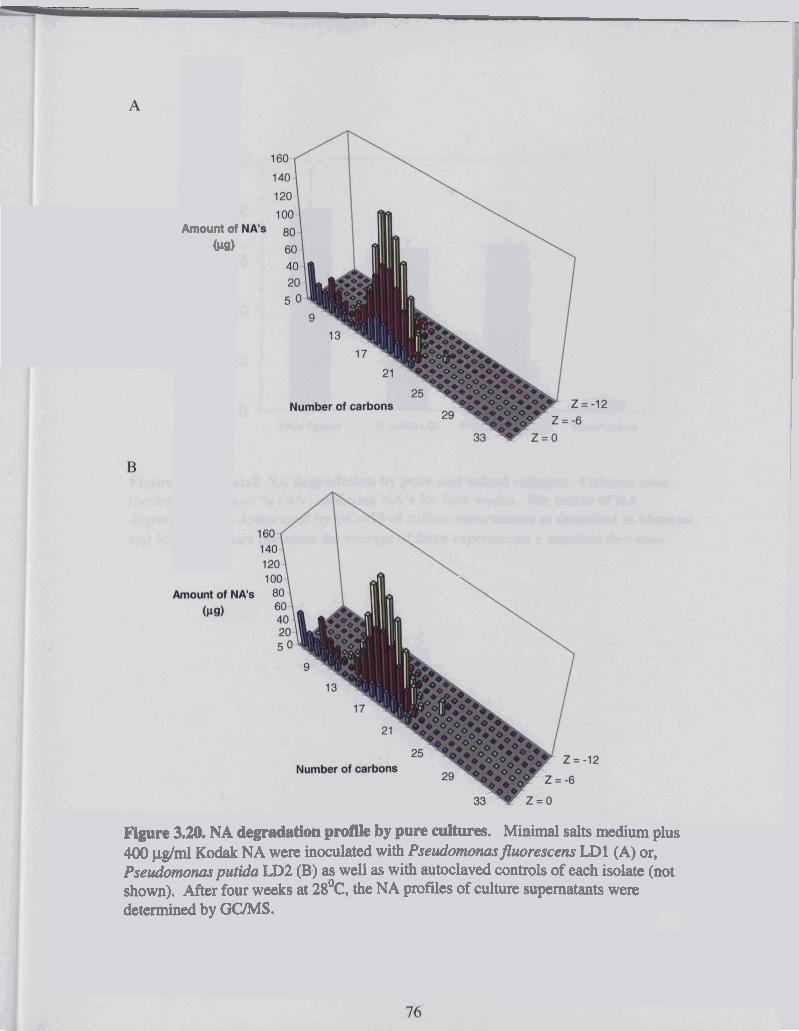
Amount 0t W)
Figure 3.20. NA degradstio. p a by pure fdtures. Minimal salts d u r n plus 400 pg/ml Kodek NA wen inoculated with Pseudomnasfluorescms LD1 (A) or, Pseudomonus putida LD2 (B) as well as with sutoclaved controls of each isolate (not shown). After four weeks at 28O~, the NA profiles of culture supernatants were determined by OC/MS.

- Killed Control P. putida LD1 P. fluorescens LDI Mixed Culture
Figure 3.21. Kodak NA degradation by pure and mixed cultures. Cultures were incubated wit11 0.04 % (wiv) of Kodak NA's for four weeks. The extent of NA degradation was determined by GC-MS of culture supernatants as described in Material ilnd Methods. Bars represent the average of three experiments + standard deviation.
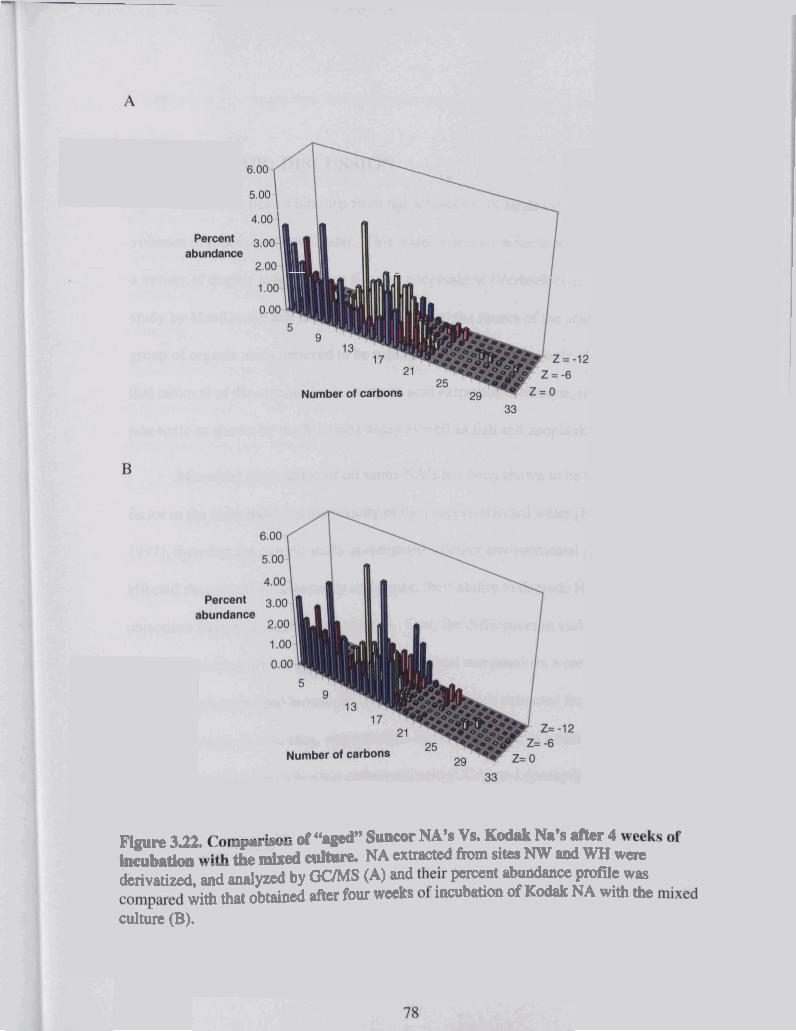
flguW 3.22 d 6 6 M S- NA's Vs. Kodak Na's after 4 in^^^ ae *& C&UIS NA extracted from sites NW lad WH were derivatized, a d s n d y d by OClMS (A) ~ n d p n t a b d m pmHe was
with that o~tdnd iftrr four MCLS iocubrrtion d Kodrlt NA with chc
cult& (B).
CHAPER FOUR: DISCUSSION
The extraction of bitumen from the Athabasca oil sands deposit generates large
volumes of process-affected water. This water is acutely toxic to aquatic organisms from
a variety of trophic levels such as fish and zooplankton (Verbeek et al. 1993). A previous
study by MacKinnon and Boerger ( 1 986) showed the source of the acute toxicity to be a
group of organic acids believed to be naphthenic acids. In this study, they demonstrated
that rc~noval of the organic acids, using an acid extraction technique, rendered the waters
non-toxic as shown by the Microtox assay as well as fish and zooplankton assays.
Microbial degradation of oil sands NA's has been shown to be the predominant
factor in the reduction of acute toxicity of the process-affected water (Nix and Bishay,
1997), therefore the current study investigated whether environmental parameters
affected the microbial community and hence, their ability to degrade NA's. The
objectives were achieved in several ways. First, the differences in viable microbial
biomass and col~~position of the sediment microbial con~munities were measured by
analysis of pllospholipid-bound phosphate and fatty acids extracted from phospholipids
purified from the twelve sites, respectively. Second, the rates of mineralization ofthe
two surrogate NA's, cyclohexane carboxylic acid (CCA) and decahydro naphthoic acid
(DHNA), bclorlging to the z = -2 and -4 families, respectively, were measured in twelve
sudimcllts obtained froin wetlands that contained varying degrees of NA contamination.
'I7llird, dcgrad;,tion o f8 commercially available mixture of NA's by an enrichment culturc
composed of microorganisms isolated from a wetland whose waters contained high levels
of NA's.
The viable microbial biomass was assessed as the amount of phospholipid-bound
phosphate by the method developed by Findlay et al. ( 1 989). This method was developed
spccifically for the analysis of lipid-bound phosphates in sediments and has become the
method of choice for the determination of microbial biomass in environmental samples
(White et al. 1996a). Lipid phosphate analysis is an attractive alternative to other
methods used in the determination of microbial biomass such as ATP content, acridine
orange direct counts and chloroform fumigation. This is because it is fast and
inexpensive, does not require specialized equipment and has been shown to correlate with
the results obtained with the chloroform fumigation method (White et al. 1996a).
Lipid-phosphate analysis provides a quantitative measure of the viable biomass
because all intact cells contain phospholipids and organisms without intact cellular
menlbranes are not viable. In cell death, phospholipases rapidly transform the
pllospholipi& in cell membranes to diglycerides by removing the phosphate-containing
head groups (White and Tucker, 1969). The major limitation of this technique is the
difficulty in converting the amount of lipid-phosphate into cell numbers. This is due to
tilc fdct that bacterial volumes can vary over three orders of magnitude (Guckert et al.
1985 and Norland, 1993) and therefore different organisms possess different amounts of
phospholipids. For example. Brinch-lverson and King (1990) have shown that i n
bacterial enricllmcllts and isolates from the sea, the lipid-phosphate content varies
betwccn 34 3x0 pn~ol per gram of carbon for aerobes, compared to 1 18 and 250
p i o l per gram of carbon for anaerobes.
Figure 3.1 shows that the viable microbial biomass did not vary significantly
within each wetland category, indicating that the sites are at equilibrium. This is in
agreement with the PLFA data, which showed that in 200 1 (the year for which the
biomass determinations were made), the proportion of organisms in stationary phase was
constant in the three months and across the three categories. An interesting observation
is the fact that the offsite and high impact sites possessed similar amounts of viable
biomass. However, the sites in the low impact category (namely CL and HS) had twice
as much viable biomass as the other sites. This is in agreement with the visual
observations, which showed that the low impact sites were able to sustain a variety of
higher organisms such as frogs and birds. It is possible that in these low-impact sites, the
low levels of NA contamination are sufficient to stimulate microbial activity, which in
turn would be able to support higher trophic levels. Conversely, in the high impact sites,
the high alnount of NA's inhibited the survival of microbes (except for those adapted to
NA degradation as indicated by the high DHNA degradation rates in the high impact
sites) as well as higher trophic levels. A study by Bendell-Young et al. (2000), supports
this llypothesis. They compared off-site wetlands to a low-impact wetland created by
seepage of process-affected water from the tailings ponds (NW in this study) and found
that NW supported the growth of large numbers of microinvertebrates such as
chironolnid larvae and plants such as cattail; however, fish did not survive in these
wetlands. Pollet and Bendell-Young, (2000) exposed tadpoles of the northern Canadian
toad (bli/i) hor.c~a,s) and the wood frog (Runt1 svlvtltiW) to process-affected waters and the
effects on paral~ieters such as survival, growth, development rate and physical
dcformitics were measured. Their data showed that wetlands created from process-

affected water seepage were unable to support amphibian populations thereby
demonstrating that process-affected water is toxic to higher trophic levels.
PLFA analysis has been used as a measure of microbial community in several
studies involving a variety of soil as sediments such as Antarctic continental shelf
sediments (Bowman et al. 2003), hydrothermal vents (Summit et al. 2000) and manure
hot spots (Frostegard et al. 1997). PLFA analysis is a useful measure because
phospholipids are essential components of all biological membranes and are rapidly
degraded upon cell death. Therefore, unlike techniques based on nucleic acid analysis,
PLFA analysis is specific for the viable components of the microbial community.
The dcndrograms obtained in 2000 as well as June and July of 2001 showed that
the NW and CL sites cluster together (Figures 3.2 and 3.3) indicating that their microbial
colnpodtion is very similar. This is also suggested by their physical features: both
wetlands arc shallow, produce a high amount of anaerobic gas, and support a wide variety
oforganislns including birds, frogs, invertebrates and plants. The clustering of these two
wetlands was ~~nrelated to process-affected water exposure since NW has approxi~natel~
ten times the amount of NA's in the free water compared to CL (Appendix 8). However,
they do possess similar amounts of sediment-bound oil (approximately 0.2 %). Similarly,
i n 2()()(), the PS, MFT-s and, MFT-n clustered together strongly suggests that the
djffcrcnccs i l l colllmunity structure may be more closely related to the amount of oil in
ttlc than on the amount of NA's in the free water. This is supported by the fact
that s i tcs comparable amounts of NA's such as SP and WH as well as the off-
wetlands also did not cluster with thc above-mentioned sites. Straight chain
Ilydroc;lrholls i n tile oil ;Ire more amenable to biodegradation due to their ease of
oxidation into fatty acids via aerobic and anaerobic pathways (Cozzarelli et al. 1995).
Therefore, the changes in community structure in 2000 may reflect the amount of oil in
the sediments. This relationship was not as clear in 2001, indicating that other factors
may have influenced the changes in community structure.
Although individual components of the microbial community cannot be identified
from the PLFA profile, certain groups of microorganisms possess distinct PLFA's, and
the presence or absence of these biomarkers is an indicator of the presence or absence of
these groups (Summit et al. 2000). For ex~mple , White et al. (1 996) has shown that
monounsaturated PLFA are indicative of Gram-negative bacteria, while the branched
saturated PLFA are found in Gram-positive organisms. Cyclopropyl PLFA are found in
Gram-negative bacteria and their abundance increases as the organisms enter stationary
phase (Kieft et al. 1994). However, the absence of biomarkers does not mean that the
specific groups of microorganisms are not present in the communities under study since
other factors such as environmental parameters and phase of growth may also influence
the types of PLFA present (Summit et al, 2000).
The results of the PLFA analysis show that although it is possible to observe
differences in community structure, the results are highly variable and change from
month to month thus indicating that seasonal changes have a great impact on community
structure. The data also indicates that the PLFA profiles of the twelve sites are highly
dynamic. However, due to the fact that composite sediments (of three samples A, B, C)
were used to generate the PLFA data, it was not possible to evaluate the community
dynamics within a given wetland.
It is also possible that the differences in community structure were caused by
other physico-chemical parameters such as an abnormally high amount of rainfall
observed in 2001, which may have introduced other nutrients or microbes due to runoff
from the adjacent soil. This may explain the observed relationship between the amount
of sediment-bound oil and community structure in 2000 but not in 2001. The PLFA-
based conimunity structure analysis differed from that obtained from a study by A.
Hadwin on the same sediments (personal communication). Using DGGE profiles,
Hadwin (personal communication) found that the microbial community structures in June
and July of 2001 were affected by NA concentration. This is possibly due to the fact that
PLFA analysis focuses on the major biomarkers present in the functional (i.e. active)
lncmbcrs of the ~nicrobial community whereas DGGE analysis is a PCR-based technique
and therefore may detcct even the inactive members of the community. It is also possible
that D(;GE analysis provides a greater degree of community resolution due to the fact
that several pLFA biomarkers exhibit a significant overlap between different
microorganisms.
The biodegradation studies using I 4 c - C c ~ as the Z = -2 surrogate NA showed
14 that for both sampling seasons the C-CCA mineralization rates were relatively uniform
across all sites and that they tended to decrease in August. This indicates that all
sediments, illcluding those obtained from off-site wetlands possess microorganisms
capable of degrading monocyclic NA's (1.e.. those belonging to the Z = -2 family). These
results agree wit11 those of Herman et al. (1993). which showed that microbes indigenous
to tilc tailings readily degraded carboxylated cycloalkanes, and that
rcc;llci~r;lllcc due prtially to alkyl substitutions in the ring structures.
The fact that the CCA mineralization rates decreased in August suggested that the
microorganisms responsible for CCA mineralization entered the stationary phase of
growth. This was supported by the PLFA data especially in 2000, which showed that the
amount of cyclopropyl PLFA, which are indicative of stationary phase growth (Kieft et
a]. 1994) increased in August (Figure 3.9). An exception to this was the HS site, which
showed a high rate of CCA degradation across the three months in both sampling seasons
regardless of the amount of cyclopropyl PLFA. This implies that although the majority
of the microbial community entered stationary phase, the CCA-degrading organisms did
not.
The results also showed that the sites with the highest degree of NA
contamination, particularly P5, which receives the greatest amount of process-affected
water, exhibited lower CCA mineralization rates. It is unlikely that the lower rate was
due to nutrient limitation since the nutrient levels in P5 were comparable if not higher
than those found in other sites. For example, in June of 2000, the concentration of Mg"
in P5 was 15.8 mg/L compared with 1 1.7 mglL in TR. The amounts of the limiting
nutrients such as nitrogen and phosphorus were found to be below detection limit for the
majority of the sites studied except for Pond 5 for which the concentration of nitrogen
available as ammonia was high (for example 9.3 mg/L in June of 2000). The decrease in
the CCA mineralization rates may therefore have been caused by the presence of
inhibitory in the contaminated sites. Finally, the fact that no lag period was
observed when 1 4 c - C c ~ was added to the sediments in vitro indicates that an active
lnicrobia] community was already present.

A different pattern was observed when I4c- DHNA, (Z = -4) was used as a NA
surrogate. Although the amount and degradation rates of "c-CCA were relatively
uniform in all wetlands regardless of their level of NA contamination, the levels of I4c-
DHNA degradation by the off-site sediments were significantly lower compared to the
sites that received input of process-affected water (Figures 3.13 and 3.17). This suggests
that off-site sediments are not exposed to significant levels of compounds related to
DHNA, despite the high natural levels of petroleum in the surface sediments throughout
the Fort McMurray area. However, once sediments are exposed to even low levels of
process-affected water (e.g., the low impact sites, CL and HS), the microbial
communities adapted to degrade the Z = -4 compounds. This finding is supported by a
study by Morales et al. ( I 993), which found that the majority of NA's in natural effluents
belonged to the Z= -4 family. Unlike the CCA degradation, P5 did not exhibit lower
rates of DHNA degradation, suggesting that either compounds that interfere with DHNA
degradation were not abundant or that the microorganisms in this site adapted to
metabolize DHNA.
In both 2000 and 2001, the DHNA mineralization rates were significantly lower
than those observed for CCA. For example in June of 2000, the CCA mineralization
rates in the low impact sites were six times higher than those observed for DHNA
wllereas in June of 200 1 , the CCA mineralization rate in the off-site wetlands were 150
times higher than those observed for DHNA. This suggests that the bicyclic surrogates
arc less amenable to biodegradation than the Z = -2 surrogates. This supports the
obscrvatiorl that the rate of NA biodegradation is inversely proportional to the degree of
cycliz~i~ioll (Morales et al. 1993). In August of 2000. there was a significant decrease in

the amounts of DHNA degraded indicating that the sediment microorganisms had entered
the stationary phase of growth (Figure 3.16). However, in August of 200 1, there was a
major increase in the amount of DHNA degraded. Indicating that the sediment
microorganisms were still actively metabolizing DHNA. This was supported by the
PLFA data, which showed that the amount of cyclopropyl PLFA increased in August
2000 whereas it remained uniform throughout 2001.
Another interesting observation was the fact that based on their ' v - D H N A
mineralization profiles, (Figures 3.15 and 3.16), the low-impact sites (CL and HS)
behaved more like the high impact sites (i.e. higher DHNA mineralization) in 2000
whereas in 2001 they behaved more like off-site wetlands (i.e. DHNA mineralization
decreased over 10 fold). This phenomenon may be explained by the decrease in the
proportion of pseudomonads observed in the sediment samples collected in 200 1 (Figure
3.6.1, which may also partially explain the overall decrease in DHNA mineralization
observed in 200 I.
1t is well known that biodegradation studies involving complex mixtures of
industrial pollutants can present several difficulties (Herman et al. 1994). Naphthenic
acids extracted from oil sands are an extremely complex mixture from which individual
compounds have not yet been isolated, and representative compounds are not
colnmercially available. At present, it is impossible to separate the individual NAVs in a
mixtljre by classical chromatographic methods: the method developed by St. John et
( I 99x1 and modified by Holowenko et al. (2001 ) is capable of only identifying NA
groups based on their carbon number and Z family distribution. Previous studies have
o n l y becn to determine the relative percentage of each Z number and carbon group.
Therefore, in this study an internal standard was validated so that quantitative changes in
NA composition could be monitored.
A mixed culture composed of Pseudonzonus putidu LD1 and PseudomonaLs
,fZuore.scen.s LD2 was isolated from enrichment on minimal medium containing
commercially available NA's as their sole carbon source. GC analysis of the culture
supernatants showed a reduction in the size of the unresolved NA's hump indicating that
the NA's were metabolized and almost completely degraded after approximately four
weeks at 28 "C (Figure 3.20). Quantification of NA's was achieved by GUMS analysis
using a modification of the method by Holowenko et al. (2001), in which caprylic acid
was used as the internal standard. The results showed that over 95 % of the NA's present
were removed by the mixed culture. Moreover, these results showed that all NA's in the
mixture were degraded regardless of carbon number or Z family. However due to the
fact that neither COz evolution nor dry weight of the NA-degrading cultures were
performed, it is impossible to determine what proportion of NA's were mineralized
versus those that were degraded to a terminal metabolite. Nevertheless, our studies with
radiolabelled surrogates, (CCA and DHNA) shows that microbial mineralization of both
Z= -2 and Z= -4 NA's can occur.
When either P. fluorescens LDI or P. putidu LD2 were tested individually, only
15 % of the NA's were removed. Moreover, the majority of these belonged to the Z = 0
and z = -2 families (Figures 3.20 and 3.2 1 ). The synergistic effect of the two organisms
in mixed culture indicates that unique metabolic pathways in both organisms are
necessary to completely degrade the NA mixture. These results agree with those of
Herman et (1 994) in which they were able to isolate a mixed culture composed of
Pseudomonas stutzeri and Alculigenes denitrzficuns, which was capable of degrading
NA's (assessed as a visible reduction of the NA hump) but no single NA's-degrading
microorganism was found. The synergistic effect observed in the mixed culture is
possibly due to a co-metabolism process in which one organism partially metabolizes the
NA's and the other one completes the mineralization process.
Unfortunately, we were unable to isolate any NA metabolites in the culture
supernatants. However, since the ion peaks analyzed corresponded to aliphatic and
saturated carboxylic acids it is possible that the metabolites were missed during the
analysis. It is also possible that biodegradation occurred via P-oxidation thereby
converting the NA's into a series of homologous organic acids which would be hidden
within the components of the NA's hump. Evidence for the P-oxidation hypothesis of
microbial metabolism of NA's is provided by two studies performed by Blakley (1 978)
and Blakley and Papish (1 982). In these studies, a strain of Pseudomonas putida and an
Alculigene,s spp were grown on minimal medium containing the monocyclic surrogate
NA CCA as their sole carbon source. Following extraction and identification of the
major metabolites, they postulated that CCA is degraded via P-oxidation. Therefore it is
quite possible that degradation of at least monoc~clic NA occurs via the P-oxidation
pathway. Although the degradation pathway for bicyclic NA's has not yet been
several studies have identified DHNA as a terminal metabolite of naphthalene
degradation under anaerobic conditions (Annweiler et a]. 200 1 and 2002).
The fact that DHNA is observed as a terminal metabolite of naphthalene under
anaerobic implies that NA's belonging to the Z= -4 family are not degraded
via p-oxidation. This is due to the fact that B-oxidation is a widely available catabolic
pathway for a variety of organic compounds under aerobic and anaerobic anaerobic
conditions. For example Rontani et a], ( 1 999) found that two different bacterial
communities isolated from marine sediments under aerobic and denitrifying conditions
were able to completely mineralize (E)-phytol (3,7,11,15-tetramethylhexadec-2(E)-en- 1 -
01) and that in both cases the mineralization ocurred by alternating P-
decarboxymethylation and P-oxidation. A possible mechanism for the aerobic
biodegradation of bicyclic NA's is the P-oxidation of the carboxylated sidechain
followed by a decarboxylation reaction to give the bicyclic hydrocarbon, which in turn
can be hydroxylated followed by an oxidation reaction to give the corresponding cyclic
ketone. The resulting ketone can then undergo a biologjcal Baeyer-villiger oxidation
reaction mediated by a specialized type of cytochrome P450 to give the corresponding
ketone, which is followed by ring cleavage via hydrolysis and finally oxidized via P-
oxidation. This hypothesis is supported by a study by Schwab et al, (1 994) which found
that the organophosphorus insecticide Heptenophos (7-chlorobicyclo(3,2,O)hepta-2,6-
dien-6-yl dimethyl phosphate, which is somewhat similar in structure to DHNA) was
metabolized by a dephosphorylation reaction followed by mineralization by the above
mechanism.
Conclusion
This study was part of a larger study, which attempted to determine whether there
are any physico-chemical features of wetlands that receive process-affected water from
the oil sands extraction process, that are associated with high rates of microbial
degradation of NA's. It is hoped that an understanding of these parameters will lead to
improvements in the design of artificial wetlands so as to optimize the extent of NA
degradation thereby providing an economically viable water treatment method.
This study has determined that significant microbial degradation of the Z= -2 NA
surrogate CCA was observed across the twelve sites under study (between and 2.47 and
6.2 %/day/g dry sediment) thus indicating that all wetland sediments possess microbial
communities capable of mineralizing Z= -2 NA's regardless of prior exposure to process-
affected waters. In contrast, microbial degradation of the Z= -4 NA surrogate DHNA
only occurred in wetlands containing intermediate to high levels of NA exposure. This
implies that only those sediments that have been previously exposed to process-affected
waters will contain microbial communities capable of degrading at least some Z= -4
NA's. We have also determined that for although there are significant differences in
microbial community structures as determined by PLFA analysis, in the year 2000, the
major differences do not appear to be due to the NA concentration in the free water but
rather to the levels of sediment-bound oil although this relationship was not observed in
2001. ~t is possible that the results obtained in 2001 were affected by an abnormally
large amount of precipitation compared to previous years and which carried additional
nutrients into the wetlands. Finally, this study has also resulted in the isolation o fa
mixed culture composed of two microorganisms, which together, are capable of
degrading over 95% of the NA's present in a commercially available mixture of N A ' ~ .
However incubation of the mixed culture with aged NA's isolated from a shallow
receiving some input of process-affected water exhibited negligible degradation
thus suggesting that some of these compounds are recalcitrant. However more research is
needed to understand the mechanisms responsible for the microbial metabolism of N A ' ~
although circumstantial evidence points to a biological Baeyer-Villiger type oxidation
reaction. These results suggest that it may be possible to manipulate the existing
environmental conditions to select for a microbial community exhibiting higher rates of
NA degradation.

Future Directions
Previous exposure to NA's predicts the ability of a microbial community's ability
to degrade NA's. At present, it is unknown how long it takes for an optimal NA-
degrading community to develop upon exposure of pristine sediments to process-affected
waters. Therefore, a future study in which pristine microcosms are incubated with
process-affected waters for a set time period after which the mineralization rates
radiolabelled NA surrogates can be determine would help determine the time after
exposure required for enhanced NA degradation to occur. In this study the differences in
community structure could be analyzed over time using a combination of the PLFA,
DGGE and BIOLOG techniques. Concurrently GC-MS analysis could be used to
determine the types of NA's (carbon and Z number) degraded at different times
throughout the study.
Another future study would be the determination of the DHNA degradation
pathway. A variety of DHNA-degrading microcosms could be incubated with c I4-
labelled DHNA for a predetermined time followed by separation of the sediments by
centrifugation and acidification and extraction of the DHNA metabolites. HPLC or TLC
could then be used separate these metabolites and determine their Rf values and elution
times. This could be followed by a repeat of the experiment using unlabelled DHNA,
followed by tentative identification via GC, GCIMS, IR and NMR. Finally, the
enzynle(s) responsible for DHNA degradation could be purified and tested against a
variety of NA surrogates.

APPENDICES
Appendix 1 : Calibration curve for glycerol-3-phospate
0 5 10 15 20
Amount of Phosphate (nmol)
Figure Al: Calibration curve for biomass determination. Each point represents the mean of triplicate analyses + standard deviation.

Appendix 2: Particle size distribution for the twelve wetland sediments (% less than) Determined by Dr. Mike MacKinnon at the Syncrude Research Centre, Edmonton, Alta.
June 2000


Appendix 3: Relative retention times (rrt) for bacterial fatty acid methyl ester (BAME) standards.
BAME standard 1 RRT 1
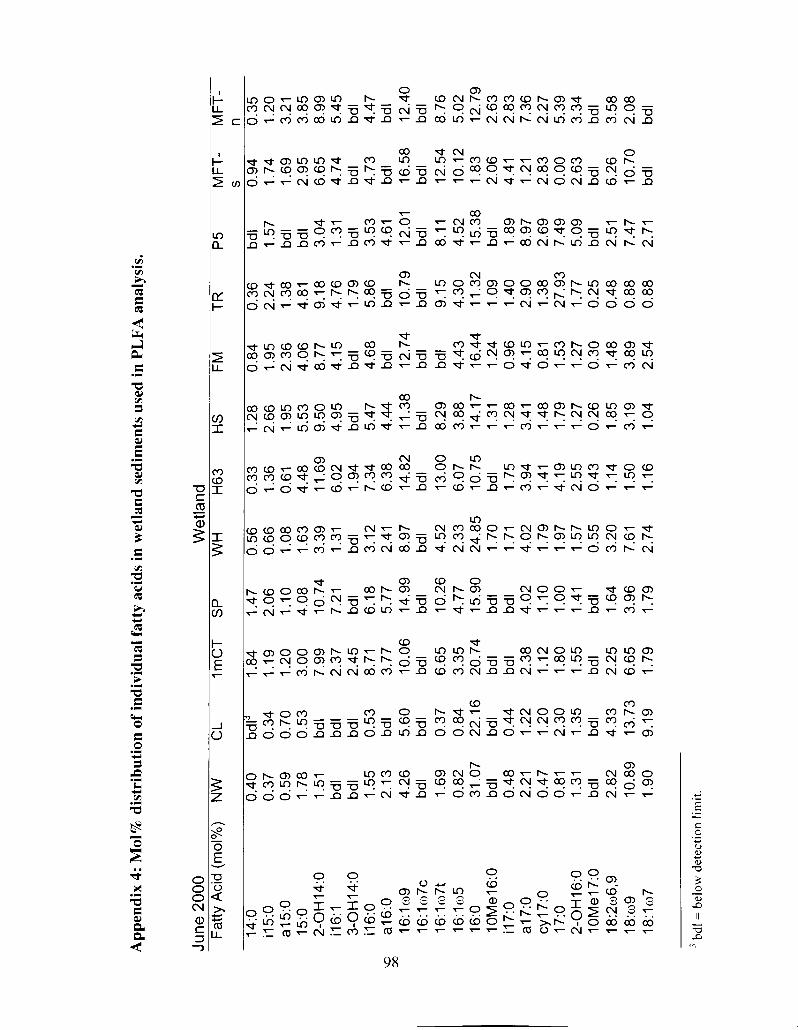
App
endi
x 4:
Mol
% d
istr
ibut
ion
of in
divi
dual
fatt
y ac
ids
in w
etla
nd s
edim
ents
use
d in
PL
FA
ana
lysi
s.
June
200
0 W
etla
nd
Fat
ty A
cid
(mol
0/0)
N
W
CL
ImC
T
SP
W
H
H63
H
S
FM
T
R
P5
MF
T-
MF
T-
s n
14:O
0.
40
bdl'
1.84
1.
47
0.56
0.
33
1.28
0
.84
0.
36
bdl
0.94
0
.35
0.
37
0.59
1
.78
1.
51
bdl
bdl
1.55
2.
13
4.26
bd
l 1.
69
0.82
31
.07
bd l
0.48
2.
21
0.47
0.
81
1.31
bd
l 2.
82
10.8
9 1.
90
0.34
0.
70
0.53
bd
l bd
l bd
l 0.
53
bdl
5.60
bd
l 0.
37
0.84
22
.16
bdl
0.44
1.
22
1.2
0
2.30
1.
35
bdl
4.33
13
.73
9.19
1 .I9
1.
20
3.00
7
.99
2.
37
2.45
8.
71
3.77
10
.06
bd l
6.65
3.
35
20.7
4 bd
l bd
l 2.
38
1.12
1.
80
1.55
bd
l 2.
25
6.65
1
.79
2.06
1.
10
4.08
10
.74
7.21
bd
l 6.
18
5.77
14
.99
bd l
10.2
6 4.
77
15.9
0 bd
l bd
l 4.
02
1.10
1 .
oo
1.41
bd
l 1.
64
3.96
1.
79
0.66
1.
36
1.08
0.
61
1.63
4.
48
3.39
11
.69
1.31
6.
02
bdl
1.94
3.
12
7.34
2.
41
6.38
8.
97
14.8
2 bd
l bd
l 4.
52
13.0
0 2.
33
6.07
24
.85
10.7
5 1.
70
bdl
1.71
1.
75
4.02
3.
94
1.79
1.
41
1.97
4.
19
1.57
2.
55
0.55
0.
43
3.20
1.
14
7.61
1.
50
2.74
1.
16
2.66
1.
95
5.53
9.
50
4.95
bd
l 5.
47
4.44
1 1
.38
bdl
8.29
3.
88
14.1
7 1.
31
1.28
3.
41
1.48
1.
79
1.27
0.
26
1.85
3.
19
1.04
1.95
2.
36
4.06
8.
77
4.15
bd
l 4.
68
bd l
12.7
4 bd
l bd
l 4.
43
16.4
4 1.
24
0.96
4.
15
0.81
1.
53
1.27
0.
30
1.48
3.
89
2.54
2.24
1.
38
4.81
9.
18
4.76
1.
79
5.86
bd
l 10
.79
bd l
9.15
4.
30
11.3
2 1 .
O9
1.40
2.
90
1.38
27
.93
1.77
0.
25
0.48
0.
88
0.88
1.57
bd
l bd
l 3
.04
1.
31
bdl
3.53
4.
61
12.0
1 bd
l 8.
1 1
4.52
15
.38
bdl
1.8
9
8.97
2.
69
7.49
5.
09
bdl
2.51
7
.47
2.
71
1.7
4
1.6
9
2.9
5
6.6
5
4.74
bd
l 4.
73
bdl
16.5
8 bd
l 12
.54
10.1
2 1.
83
2.06
4.
41
1.21
2.
83
0.00
2.
63
bdl
6.26
10
.70
bdl
1.20
3.
21
3.85
8.
99
5.45
bd
l 4.
47
bdl
12.4
0 bd
l 8.
76
5.02
12
.79
2.63
2.
83
7.36
2.
27
5.39
3.
34
bd l
3.58
2.
08
bdl
' bdl
= b
elow
det
ecti
on l
imit
.
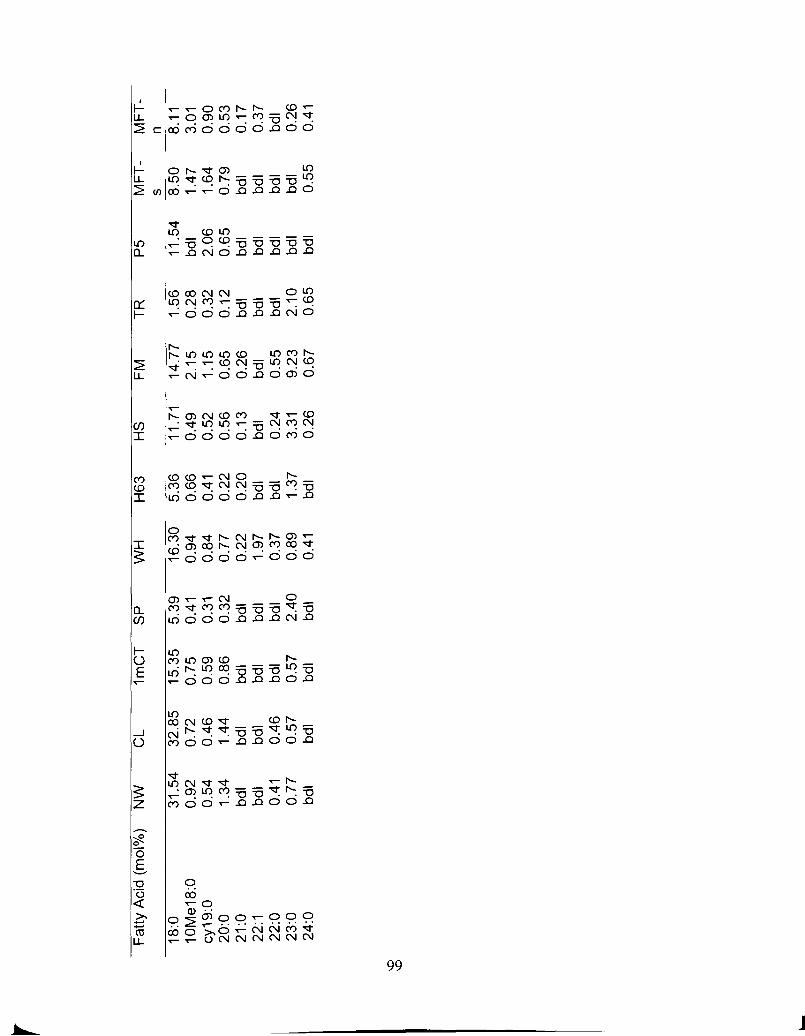
Fatt
y A
cid
(mol
%)
NW
C
L
31.5
4 0.
92
0.54
1.
34
bdl
bdl
0.41
0.
77
bdl
32.8
5 0.
72
0.46
1.
44
bdl
bdl
0.46
0.
57
bdl
I m
CT
15.3
5 0.
75
0.59
0.
86
bdl
bdl
bdl
0.57
bd
l
SP
5.39
0.
41
0.31
0.
32
bdl
bdl
bdl
2.40
bd
l
H63
5.36
0.
66
0.41
0.
22
0.20
bd
l bd
l 1.
37
bdl
11.7
1 14
.77
0.49
2.
15
0.52
1.
15
0.56
0.
65
0.13
0.
26
bdl
bdl
0.24
0.
55
3.31
9.
23
0.26
0.
67
TR
1.56
0.
28
0.32
0.
12
bdl
bdl
bdl
2.10
0.
65
P5
11.5
4 bd
l 2.
06
0.65
bd
l bd
l bd
l bd
l bd
l
MF
T-
MF
T-
s n
8.50
8.
1 1
1.47
3.
01
1.64
0.
90
0.79
0.
53
bdl
0.17
bd
l 0.
37
bd l
bdl
bdl
0.26
0.
55
0.41

July
200
0 W
etla
nd
Fat
ty A
cid
(mol
0/0)
N
W
CL
ImC
T
SP
W
H
H63
H
S
FM
T
R
P5
MF
T-s
M
FT
-n
14:O
6.
85
1.9
9
5.16
1.
10
0.93
0.
60
3.1
6
0.2
8
1.17
bd
l 1
.76
1.
47
0.5
8
0.9
0
1 .I4
0
.72
0
.30
0.
00
0.61
0.
69
bdl
1.0
8
bdl
0.73
35
.84
0.03
0.
24
1 .O
4 0.
03
1.4
2
0.0
4
0.26
1.
77
5.04
1
.17
37
.79
bd l
0.0
9
0.88
0
.14
0.40
0
.58
0
.89
0.
93
0.50
bd
l 0.
72
0.62
bd
l 1.
49
bdl
0.88
30
.93
0.16
0.
39
1.32
0
.20
1.
85
0.15
0.
39
2.12
5.
50
1.33
44
.70
0.03
0.
08
1 .oo
0.
13
0.39
0.
91
0.55
1
.48
1
.27
2
.25
0.
58
4.44
0
.23
1.
70
bdl
1.76
0.
61
3.30
0
.51
3
.70
bd
l bd
l 0.
71
7.92
bd
l bd
l bd
l 5.
15
49.9
3 18
.87
0.14
bd
l 0.
62
0.91
0.
19
2.27
0.
22
1.19
2.
82
0.92
0.
08
0.99
1.
38
0.34
6.
28
1.62
13
.34
4.39
5.
31
2.68
1.
93
26.5
8 0.
12
bdl
0.16
3.
01
3.52
0.
73
0.91
bd
l
2.04
3.
00
2.46
3.
82
2.25
0.
51
2.78
2.
87
bdl
10.7
8 bd
l 5.
90
14.8
8 0.
46
0.91
1.
36
1.59
0.
94
0.58
0.
09
2.30
5.
18
8.33
23
.86
0.27
0.
14
0.87
bd
l
1.42
3.
28
1.4
6
2.12
0
.97
bd
l 2.
37
1.58
bd
l 8.
17
bdl
5.35
14
.02
0.54
0
.91
1.
75
1.20
1.
13
0.7
4
0.1
0
3.23
6.
44
6.67
32
.06
0.19
0.
14
1.44
0.
14
2.79
6.
47
3.03
3.
96
1.62
bd
l 3.
05
2.05
bd
l 10
.71
bdl
5.30
20
.91
0.57
0.
78
1.70
2.
00
1.02
0.
45
bdl
1.93
4.
71
6.20
12
.30
0.27
1.
37
0.72
2.
23
0.08
0.
79
0.29
1.
09
0.12
1.
68
bdl
2.36
bd
l 0.
53
bd l
0.8
0
0.19
1.
65
bd l
bdl
bdl
4.85
1.
50
bdl
0.18
bd
l 0.
46
3.08
15
.70
21.6
2 0.
12
0.32
0.
32
0.35
1.
05
1.58
0.
29
0.45
1.
50
0.98
0.
05
0.81
0.
53
bd l
2.57
1.
49
6.37
4.
99
3.80
1.
79
60.5
7 39
.04
0.14
0.
29
0.08
0.
50
2.04
1.
73
0.10
bd
l
0.5
4
0.7
8
0.3
2
0.8
4
0.8
9
2.17
2
.42
4
.49
bd
l 1
.64
0
.49
bd
l 1.
55
2.51
1.
07
2.58
bd
l 3.
53
6.60
2.
15
2.8
7
3.47
bd
l 1.
85
17.9
0 20
.86
bdl
0.71
0.
58
1.13
1.
67
3.07
2.
87
0.86
1.
20
1.38
1.
07
1.26
bd
l 0
.40
3.
1 1
1.68
8.
63
5.33
9.
15
3.36
26
.96
26.3
7 1.
08
0.96
0.
75
0.63
1
.16
1.
03
0.33
0.
21
0.87
1
.26
1
.22
2
.20
0.
29
bd l
1.21
0.
96
bdl
4.52
2
.66
bd
l 27
.32
0.42
0.
59
1.91
1
.14
1
.78
0.
82
bdl
1.92
4.
55
4.73
33
.47
0.53
0.
34
1.36
bd
l
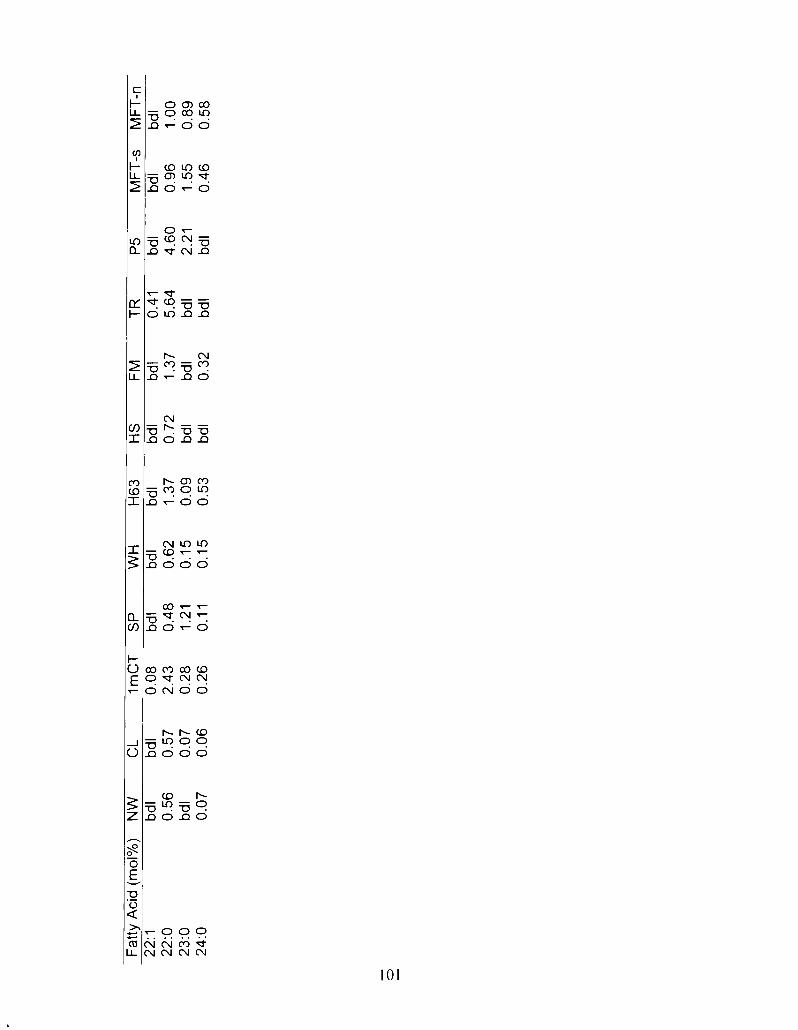
Fat
ty A
cid
(rno
l0/~
) N
W
CL
ImC
T
SP
W
H
H63
H
S
FM
T
R
P5
MF
T-s
M
FT
-n
22: 1
bd
l bd
l 0.
08
bdl
bdl
bd l
bd l
bdl
0.41
bd
l bd
l bd
l 22
:O
0.56
0.
57
2.43
0.
48
0.62
1.
37
0.72
1.
37
5.64
4.
60
0.96
1 .
OO
23:O
bd
l 0.
07
0.28
1.
21
0.15
0.
09
bdl
bd l
bd l
2.21
1.
55
0.89
24
:O
0.07
0.
06
0.26
0.
11
0.15
0.
53
bdl
0.32
bd
l bd
l 0.
46
0.58

Aug
ust
2000
W
etla
nd
Fat
ty A
cid
(mol
O/~
) NW
C
L Im
CT
S
P
WH
H
63
HS
F
M
TR
P
5
MF
T-s
M
FT
-n
14:O
2.
22
1.58
3.
22
1.22
1.
46
1.36
2.
48
4.50
0.
94
NIA
0.
91
2.49
4.
27
2.81
7.
18
13.2
9 3.
65
3.91
5.
06
6.27
10
.33
bdl
8.97
4.
40
10.2
1 2.
30
3.50
3.
58
2.35
bd
l 1.
30
bdl
bdl
1.24
bd
l 1.
48
bdl
0.28
bd
l bd
l
10.4
5 1.
35
2.34
5.
66
1.38
2.
99
4.40
7.
68
bdl
6.44
4.
62
5.38
17
.11
2.58
4.
13
4.90
3.
83
3.41
0.
75
bd l
bd l
1.07
0.
98
2.54
1.
14
2.01
0.
08
0.40
6.52
1.
92
5.01
1.
69
4.84
1.
12
bdl
1.96
bd
l bd
l 1.
25
0.48
0.
70
bdl
0.73
2.
31
0.91
bd
l bd
l 4.
40
2.51
3.
93
bd l
2.81
18
.45
14.2
0 5.
95
4.79
9.
45
8.33
5.
88
7.63
7.
15
7.48
4.
33
5.58
2.
50
3.36
bd
l bd
l bd
l bd
l 1.
51
6.56
2.
30
3.56
1.
82
6.09
bd
l bd
l 3.
80
3.47
bd
l bd
l 2.
60
1.27
2.94
2.
45
1.83
2.
15
6.81
1.
52
11.3
3 3.
71
3.53
0.
74
4.22
1.
39
6.58
2.
78
5.82
4.
49
12.3
0 5.
18
bdl
bdl
8.58
4.
10
4.84
2.
43
10.0
0 13
.36
2.31
3.
69
3.80
7.
37
3.93
6.
1 1
3.29
5.
20
bdl
4.05
1.
94
2.53
bd
l bd
l 0.
32
0.66
0.
82
2.75
0.
90
2.39
0.
44
5.19
bd
l bd
l 0.
75
4.84
bd
l bd
l bd
l 2.
59
2.30
4.
36
1.31
2.
69
bdl
1.98
2.
36
1.38
2.
22
7.91
bd
l 4.
72
19.4
9 1.
42
2.59
2.
74
4.02
1.
74
0.39
bd
l 2.
50
7.88
11
.38
5.37
bd
l 1.
67
0.79
0.
46
3.10
4.
48
1.53
2.
01
0.47
1.
05
1.73
bd
l bd
l 9.
57
bdl
5.40
20
.84
1.35
1.
64
2.71
2.
08
bdl
0.55
bd
l 4.
94
8.31
11
.67
6.82
bd
l 1.
58
0.44
0.
38
4.17
1 .
O4
1.18
0.
90
bd l
1.16
1.
57
1.69
bd
l 5.
42
bdl
5.20
15
.16
2.41
5.
12
bdl
3.84
3.
30
1.66
bd
l 3.
53
5.85
6.
34
14.4
8 bd
l 4.
27
2.16
2.
14
NIA
N
/A
NIA
N
IA
NIA
N
IA
NIA
N
IA
NIA
N
IA
NIA
N
IA
NIA
N
IA
NIA
N
IA
NIA
N
IA
NIA
N
IA
NIA
N
IA
NIA
N
IA
NIA
N
IA
NIA
N
IA
6.92
1 .
I6
1.79
1.
84
bdl
1.92
1.
94
bdl
bdl
5.43
bd
l 6.
82
16.2
1 3.
77
3.20
4.
47
4.73
1.
07
1.36
bd
l 2.
20
4.30
9.
41
7.29
bd
l 3.
63
0.72
2.
34
3.77
3.
76
3.50
2.
16
1.42
1.
66
3.25
4.
25
bd l
10.2
5 2.
69
3.30
16
.50
1.38
1.
54
3.36
2.
43
1.81
0.
61
bdl
2.35
4.
76
9.62
4.
94
bdl
0.98
0.
61
0.40
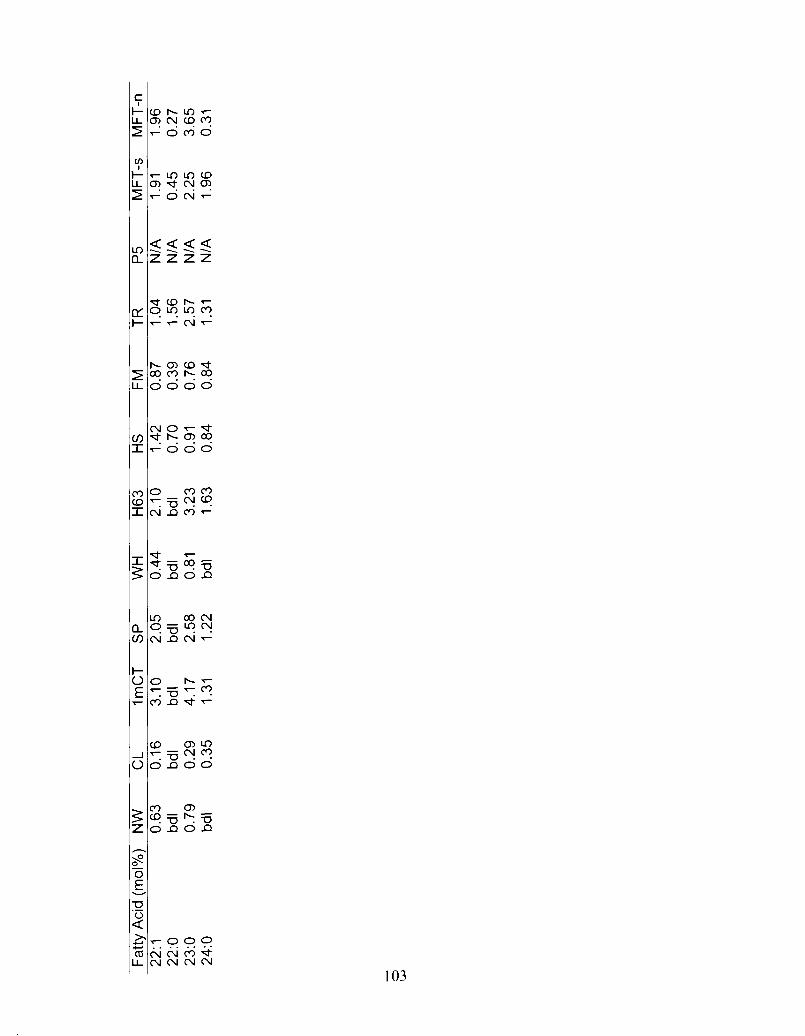
Fat
ty A
cid
(mo
lO/~
) NW
C
L Im
CT
S
P
WH
H
63
HS
F
M
TR
P5
MF
T-s
M
FT
-n
22: 1
0
.63
0.
16
3.10
2.
05
0.44
2.
10
1.42
0.
87
1.04
N
IA
1.91
1.
96
22:O
bd
l bd
l bd
l bd
l bd
l bd
l 0.
70
0.39
1.
56
NIA
0.
45
0.27
23
:O
0.79
0.
29
4.17
2.
58
0.81
3.
23
0.91
0.
76
2.57
N
IA
2.25
3.
65
24:O
bd
l 0.
35
1.31
1.
22
bdl
1.63
0.
84
0.84
1.
31
NIA
1.
96
0.31
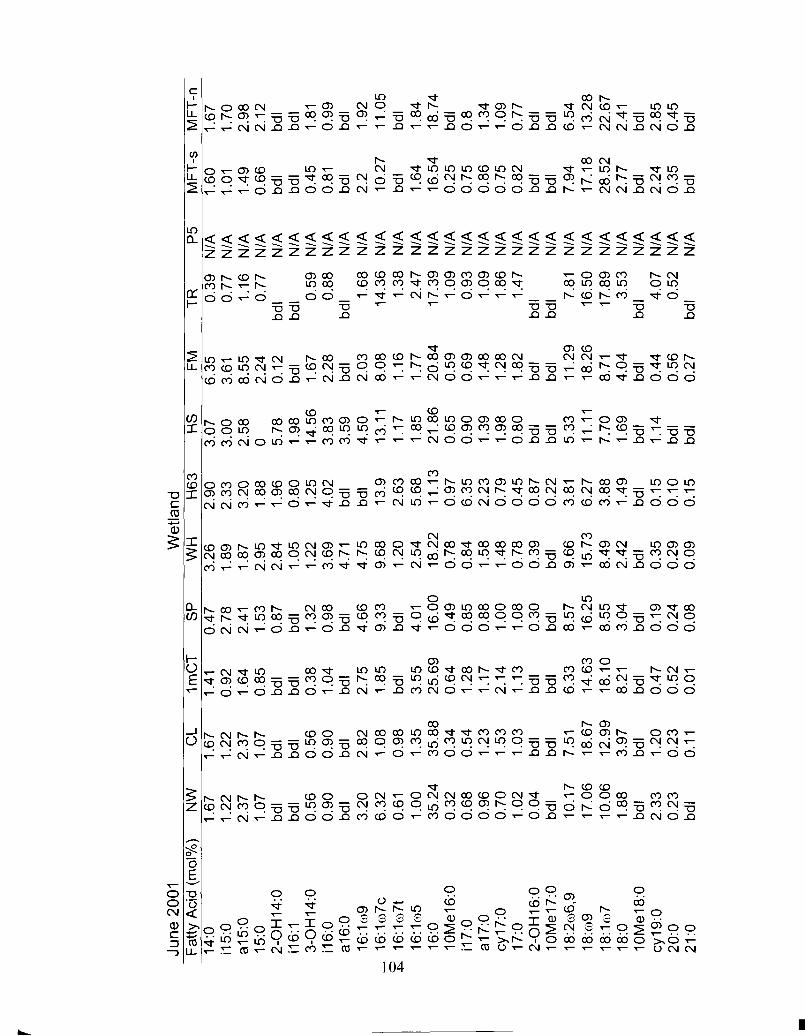
June
200
1 W
etla
nd
Fat
tv A
cid
(rnol
0/o\
N
W
CL
ImC
T
SP
W
H
H63 -
1.22
2.
37
1.07
bd
l bd
l 0.
56
0.90
bd
l 3.
20
6.32
0.
61
1 .oo
35
.24
0.32
0.
68
0.96
0.
70
1.02
0.
04
bd l
10.1
7 17
.06
10.0
6 1.
88
bdl
2.33
0.
23
bdl
1.22
2.
37
1.07
bd
l bd
l 0.
56
0.90
bd
l 2.
82
1.08
0.
98
1.35
35
.88
0.34
0
.54
1
.23
1.
53
1.03
bd
l bd
l 7.
51
18.6
7 12
.99
3.97
bd
l 1.
20
0.23
0.
1 1
0.92
1.
64
0.85
bd
l bd
l 0.
38
1.04
bd
l 2.
75
1.85
bd
l 3.
55
25.6
9 0.
64
1.28
1.
17
2.14
1.
13
bdl
bdl
6.33
14
.63
18.1
0 8.
21
bdl
0.47
0.
52
0.01
2.78
2.
41
1.53
0.
87
bdl
1.32
0.
98
bdl
4.66
9.
33
bd l
4.01
16
.00
0.49
0.
85
0.88
1 .
oo
1.08
0.
30
bdl
8.57
16
.25
8.55
3.
04
bdl
0.19
0.
24
0.08
1.89
1.
87
2.95
2.
84
1.05
1.
22
3.69
4.
71
4.75
9.
68
1.20
2.
54
18.2
2 0.
78
0.84
1.
58
1.48
0.
78
0.39
bd
l 9.
66
15.7
3 8.
49
2.42
bd
l 0.
35
0.29
0.
09
2.33
3.
20
1.88
1.
96
0.80
1.
25
4.02
bd
l bd
l 1
3.9
2.
63
5.68
17
.13
0.97
6.
35
2.23
0.
79
0.45
0.
87
0.22
3.
81
6.27
3.
88
1.49
bd
l 0.
15
0.10
0.
15
3.00
2.
58
0 5.78
1.
98
14.5
6 3.
83
3.59
4.
50
13.1
1
1.17
1.
85
21.8
6 0.
65
0.90
1.
39
1.98
0.
80
bdl
bdl
5.33
11
.11
7.70
1.
69
bdl
1.14
bd
l bd
l
3.61
8.
55
2.24
0.
12
bdl
1.67
2.
28
bdl
2.03
8.
08
1.16
1.
77
20.8
4 0.
59
0.69
1.
48
1.28
1.
82
bdl
bdl
11.2
9 18
.26
8.71
4.
04
bdl
0.44
0.
56
0.2
7
0.77
N
IA
1.1
6
NIA
0.
77
NIA
bd
l N
/A
bdl
N /A
0.
59
NIA
0.
88
NIA
bd
l N
IA
1.68
N
IA
14
.36
N
IA
1.38
N
IA
2.47
N
IA
17.3
9 N
IA
1.09
N
IA
0.93
N
IA
1.09
N
IA
1.86
N
IA
1.4
7
NIA
bd
l N
IA
bdl
NIA
7.
81
NIA
16
.50
NIA
17
.89
NIA
3.
53
NIA
bd
l N
IA
4.07
N
IA
0.52
N
IA
bdl
NIA
1.01
1.
49
0.66
bd
l bd
l 0.
45
0.81
bd
l 2
.2
10.2
7 bd
l 1.
64
16.5
4 0.
25
0.75
0.
86
0.75
0.
82
bdl
bd l
7.94
17
.18
28.5
2 2.
77
bdl
2.24
0.
35
bdl
1.70
2.
98
2.12
bd
l bd
l 1.
81
0.99
bd
l 1.
92
11.0
5 bd
l 1.
84
18.7
4 bd
l 0.
8 1.
34
1.09
0.
77
bdl
bdl
6.54
13
.28
22.6
7 2.
41
bd l
2.85
0.
45
bdl

2 s s s s z z z z
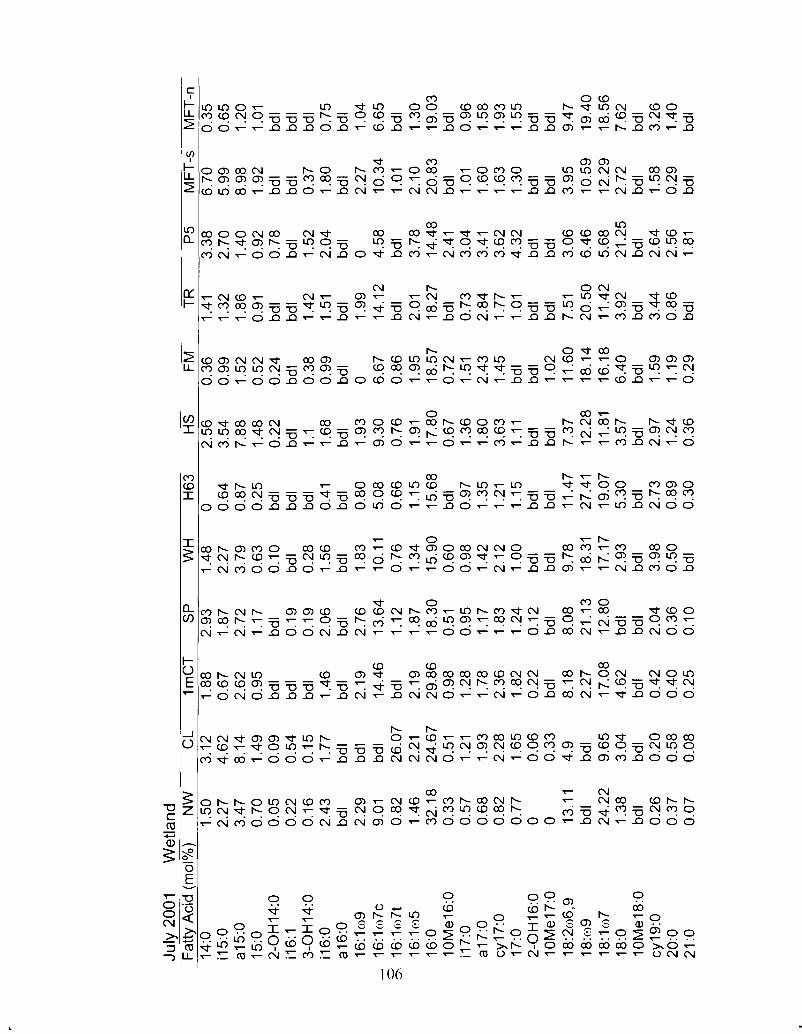
July
200
1 W
etla
nd
Fat
ty A
cid
(mol
%)
NW
C
L Im
CT
S
P
WH
H
63
HS
F
M
TR
P
5 M
FT
-s
MF
T-n
2.27
3
.47
0
.70
0.
05
0.22
0.
16
2.43
bd
l 2.
29
9.01
0.
82
1.46
32
.18
0.3
3
0.5
7
0.68
0.
82
0.7
7
0 0 13.1
1
bd l
24
.22
1.
38
bd l
0.26
0.
37
0.07
4.62
8.
14
1.49
0.
09
0.54
0.
15
1.77
bd
l bd
l bd
l 26
.07
2.21
24
.67
0.5
1
1.21
1.
93
2.28
1.
65
0.06
0.
33
4.9
bd
l 9.
65
3.04
bd
l 0.
20
0.58
0
.08
0.6
7
2.62
0.
95
bdl
bdl
bdl
1.46
bd
l 2.
19
14
.46
bd
l 2.
19
29.8
6 0
.98
1
.28
1.
78
2.36
1.
82
0.22
bd
l 8.
18
2.27
17
.08
4.62
bd
l 0.
42
0.4
0
0.25
1.87
2.
72
1.17
bd
l 0.
19
0.1
9
2.0
6
bd l
2.7
6
13.6
4 1 .
I2
1.87
18
.30
0.51
0.
95
1.17
1.
83
1.24
0.
12
bd l
8.08
21
.13
12.8
0 b
dl
bd l
2.0
4
0.36
2.27
3.
79
0.63
0.
10
bd l
0.28
1.
56
bdl
1.83
10
.11
0.76
1.
34
15.9
0 0.
60
0.98
1.
42
2.12
1 .
oo
bd l
bd l
9.78
18
.31
17.1
7 2.
93
bdl
3.98
0.
50
0.1
0
bdl
0 0.64
0.
87
0.25
bd
l bd
l bd
l 0.
41
bd l
0.80
5.
08
0.66
1.
15
15.6
8 bd
l 0.
97
1.35
1.
21
1.15
bd
l bd
l 11
.47
27.4
1 19
.07
5.30
bd
l 2.
73
0.89
0
.30
0.99
1.
52
0.52
0.
24
bdl
0.38
0.
99
bdl
0 6.67
0.
86
1.95
18
.57
0.72
1
.51
2.
43
1.45
bd
l bd
l 1.
02
11.6
0 18
.14
16.1
8 6.
40
bdl
1.59
1
.19
0.
29
1.32
2
.70
1.
86
1.4
0
0.91
0.
92
bdl
0.7
8
bdl
bd l
1.42
1.
52
1.51
2.
04
bdl
bdl
1.9
9
0 14
.12
4.58
bd
l bd
l 2.
01
3.78
18
.27
14.4
8 bd
l 2.
41
0.73
3.
04
2.84
3.
41
1.77
3.
62
1.01
4.
32
bdl
bdl
bdl
bdl
7.51
3.
06
20.5
0 6.
46
11.4
2 5.
68
3.92
21
.25
bd l
bdl
3.44
2
.64
0.
86
2.56
bd
l 1.
81
5.99
8.
98
1.9
2
bdl
bdl
0.37
1
.80
bd
l 2.
27
10.3
4 1.
01
2.10
20
.83
bdl
1.01
1
.60
1
.63
1
.30
bd
l bd
l 3.
95
10.5
9 12
.29
2.72
bd
l 1.
58
0.29
bd
l
0.65
1.
20
1.01
bd
l bd
l bd
l 0.
75
bdl
1.04
6.
65
bdl
1.30
19
.03
bdl
0.96
1.
58
1.93
1.
55
bdl
bd l
9.4
7
19.4
0 18
.56
7.62
bd
l 3.
26
1.40
bd
l
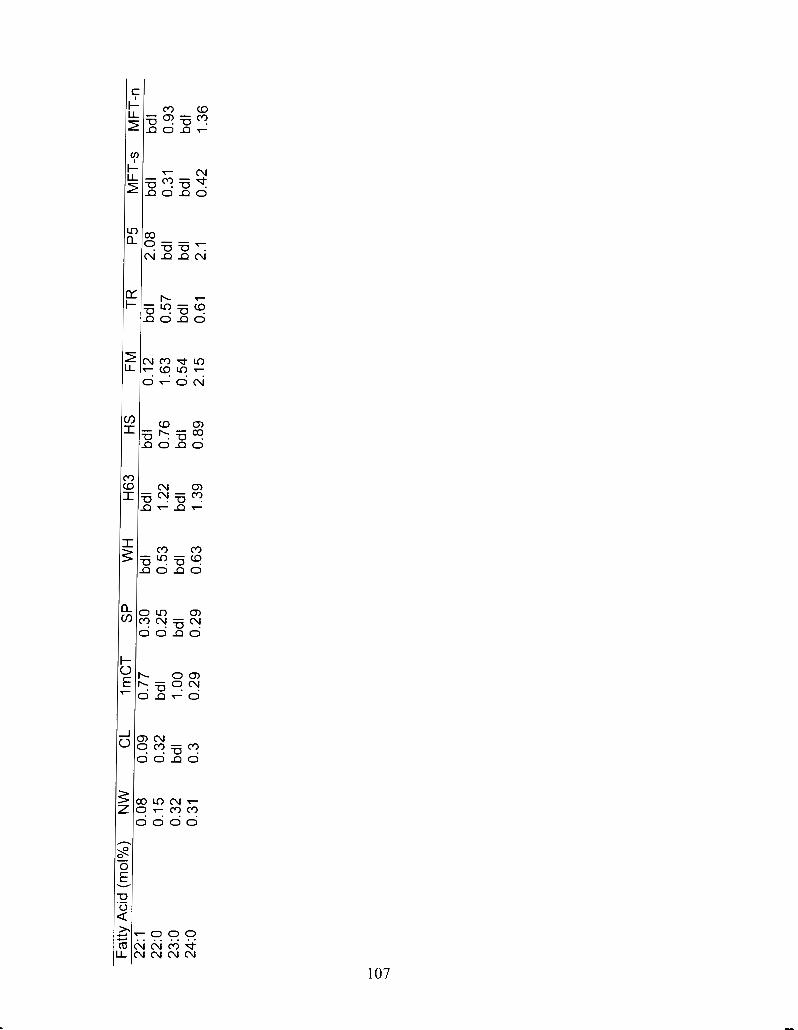
" ' a m = , ? ' i f 0 3 nono

Aug
ust 2
001
Wet
land
F
atty
Aci
d (m
ol%
) N
W
CL
ImC
T
SP
W
H
H63
H
S
FM
T
R
P5
MF
T-s
M
FT
-n
1 .I 1
1.
92
0.61
0.
10
0.68
0.
57
5.41
bd
l 4.
07
5.33
0.
59
bdl
20.0
2 0.
23
0.35
0.
67
0.54
0.
85
bd l
bdl
16.1
8 27
.42
7.50
1.
73
0.17
1.
66
0.27
0.
00
1.10
3.
42
0.63
0.
10
1.45
0.
66
1.34
bd
l bd
l 21
.85
0.77
bd
l 17
.73
0.39
0.
81
1.73
2.
04
1.68
bd
l bd
l 4.
43
10.7
9 22
.99
3.28
0.
29
0.64
0.
41
0.04
0.94
1.
53
0.47
bd
l 1.
24
1.60
1.
27
bd l
1.29
9.
41
bdl
bd l
22.0
4 bd
l 0.
63
1.32
2.
16
1.16
bd
l bd
l 7.
50
17.9
2 17
.82
5.26
1.
11
2.31
0.
59
bdl
3.15
3.
26
3.90
bd
l bd
l 19
.62
bdl
bdl
0.00
1.
73
0.00
bd
l 18
.13
1.21
7.
43
2.63
0.
00
2.89
bd
l bd
l 1.
67
13.7
3 6.
20
4.64
5.
05
bdl
bdl
bdl
2.48
4.
84
1.07
0.
25
1.42
3.
20
1.81
bd
l 2.
21
8.61
0.
87
bd l
21.3
6 bd
l 0.
57
1.43
1.
63
0.94
bd
l bd
l 5.
90
13.1
2 10
.14
6.61
1.
19
1.80
0.
70
bdl
2.79
2.
16
5.32
6.
06
1.09
1 .
OO
bd l
0.29
2.
72
1.57
3.
56
1.90
1.
40
2.24
bd
l bd
l 2.
32
2.12
11
.96
9.20
1.
73
0.71
bd
l bd
l 23
.41
20.2
5 b
d l
0.48
0.
63
0.92
1.
38
1.92
1.
49
2.99
0.
95
1.12
bd
l bd
l bd
l bd
l 4.
97
6.13
12
.35
12.3
6 9.
65
12.2
7 4.
32
3.54
bd
l 0.
67
0.80
3.
69
bdl
1.69
bd
l 0.
19
0.61
bd
l bd
l bd
l 2.
02
bdl
0.30
bd
l bd
l 3.
82
bdl
bdl
12.7
2 bd
l bd
l 1.
63
0.99
1.
23
bd l
bdl
12.5
6 25
.15
21.8
0 7.
17
1.22
1.
80
1 .I2
0.
35
2.03
3.
08
3.17
2.
84
0.93
0.
78
bdl
bd l
2.59
3.
18
1.99
11
.38
2.07
1 .
04
bdl
bd l
2.25
bd
l 11
.83
3.75
1.
25
bdl
bdl
bdl
19.4
7 21
.64
bdl
bdl
0.98
3.
29
1.56
2.
09
2.37
2.
72
7.05
1.
64
bd l
bdl
bdl
bdl
4.30
1.
76
13.5
1 10
.20
12.5
2 9.
18
5.17
7.
81
0.73
2.
04
5.27
1.
84
1.01
bd
l bd
l bd
l
0.96
1.
89
0.47
bd
l 1.
39
1.88
0.
58
bd l
bdl
6.26
bd
l bd
l 17
.57
bdl
0.77
1.
41
1.83
1.
54
bdl
bd l
6.50
15
.49
22.6
1 9.
49
1.39
3.
57
0.89
bd
l
1.66
2.
56
1.05
bd
l 0.
85
1.54
0.
65
bd l
bdl
5.94
bd
l bd
l 21
.03
1.20
2.
99
1.98
2.
27
1.76
bd
l bd
l 6.
92
16.3
6 15
.42
5.24
2.
41
3.31
0.
74
0.16
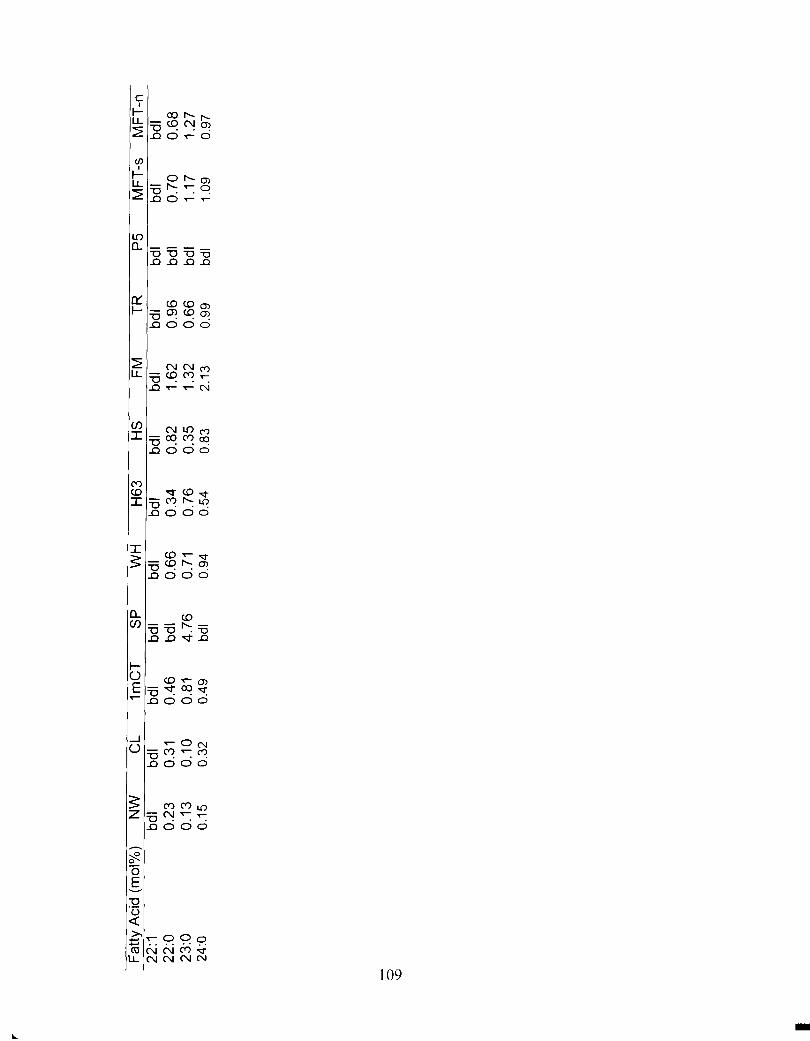
Fat
ty A
cid
(mot
%)
NW
C
L Im
CT
S
P
WH
H
63
HS
F
M
TR
P
5 M
FT
-s
MF
T-n
22
: 1
bdl
bdl
bdl
bd l
bd l
bdl
bdl
bdl
bdl
bdl
bdl
bdl
22:O
0.
23
0.31
0.
46
bdl
0.66
0.
34
0.82
1.
62
0.96
bd
l 0.
70
0.68
23
:O
0.13
0.
10
0.81
4.
76
0.71
0.
76
0.35
1.
32
0.66
bd
l 1.
17
1.27
24
:O
0.15
0.
32
0.49
bd
1 0.
94
0.54
0.
83
2.13
0.
99
bd 1
1.09
0.
97

Appendix 5: t-test analysis of the differences between selected PLFA for the three categories: Offsite, Low Impact and, High Impact. Positive values show pairs of means that are statistically significant.
Year 2000:
i17la17 PLFA ratios.
July Offsite -0.627 -0.144
lmpacted -0.144 -0.41 1
10-Me PLFA -
lmpacted -0.21 1 -0.666
Offsite Impacted - - --
2-hydroxy PLFA
August Offsite -0.789 -0.850
June Offsite -1 .018 -0.21 1
July Offsite -1.713
lmpacted -0.126 Offsite
lmpacted -0.850 -0.948
June Offsite -0.314
Offsite Impacted -
lmpacted -0.984
lmpacted -1.352 -2.389
July Offsite -3.650 -1.352
total cyclopropyl PLFA
lmpacted -2.785
-4.91 3 Offsite Impacted
June Offsite -1.569 -1 .I94
August Offsite -0.865
August Offsite -9.444 -4.659
June Offsite -7.505 -2.785
18:2 PLFA
lmpacted -0.639
lmpacted -4.659 -6.678
lmpacted -1.194 -1 .027
July Offsite -1.635 -1 . I87
lmpacted -5.752 -7.758
lmpacted -1. 187 -2.497
lmpacted -0.843 -1.834
Offsite Impacted
July Offsite -0.991 -0.553
lmpacted -1.960 -3.234
July Offsite -1.728 -1.960
August Offsite -6.334 -5.752
June Offsite -1.201 -0.843
lmpacted 0.069
-1.558 Offsite Impacted
lmpacted -0.553 -0.649
August Offsite -2.763 -0.262
June Offsite -2.381 0.069
lmpacted -0.262 -1.953
August Offsite -6.309 -4.746
lmpacted -4.746 -4.461

Year 2001 :
i17la17 PLFA ratios.
i15la15 PLFA ratios. July Offsite -0.533 -0.546
lmpacted -0.21 3 -0.584
Offsite Impacted
2-hydroxy PLFA
June Offsite -0.477 -0.21 3
July Offsite -0.1 77 -0.022
lmpacted -0.567 -1 .551
Offsite Impacted
I June I I Offsite I lm~acted
Offsite Impacted -
lmpacted -0.546 -0.998
June Offsite -1.266 -0.567
10-Me PLFA
lmpacted -0.022 -0.272
July I Offsite 1 Impacted
-4. 146 -2.479
18:2 PLFA
August Offsite -0.348 -0.171
total cyclopropyl PLFA
lmpacted -0.171
-0.228
August Offsite -0.91 0 -0.422
August Offsite
-2.479 -5.078
lmpacted -1.533 -1.528
July Offsite -1.872 -1.533
lmpacted -0.422 -1.391
lmrsacted
lmpacted 0.078
-0.380 Offsite Impacted
July Offsite -5.710 -2.326
lmpacted -2.326 -6.993
August Offsite -2.031 -0.987
June Offsite -0.537 0.078
lmpacted -2.546 -5.31 9
Offsite Impacted
July Offsite -4.293 -3.445
lmpacted -3.445 -3.505
-0.530 -0.378
lmpacted -0.987 -3.1 03
August Offsite -8.361 -7.352
June Offsite -3.071 -2.546
lmpacted -2.612 -2.071
Offsite Impacted
-0.166 -0.091
-0.378 -0.432
lmpacted -7.352 -10.241
August Offsite -5.290 -3.224
June Offsite -3.587 -2.612
-0.091 -0.108
lmpacted -3.224 -2.827
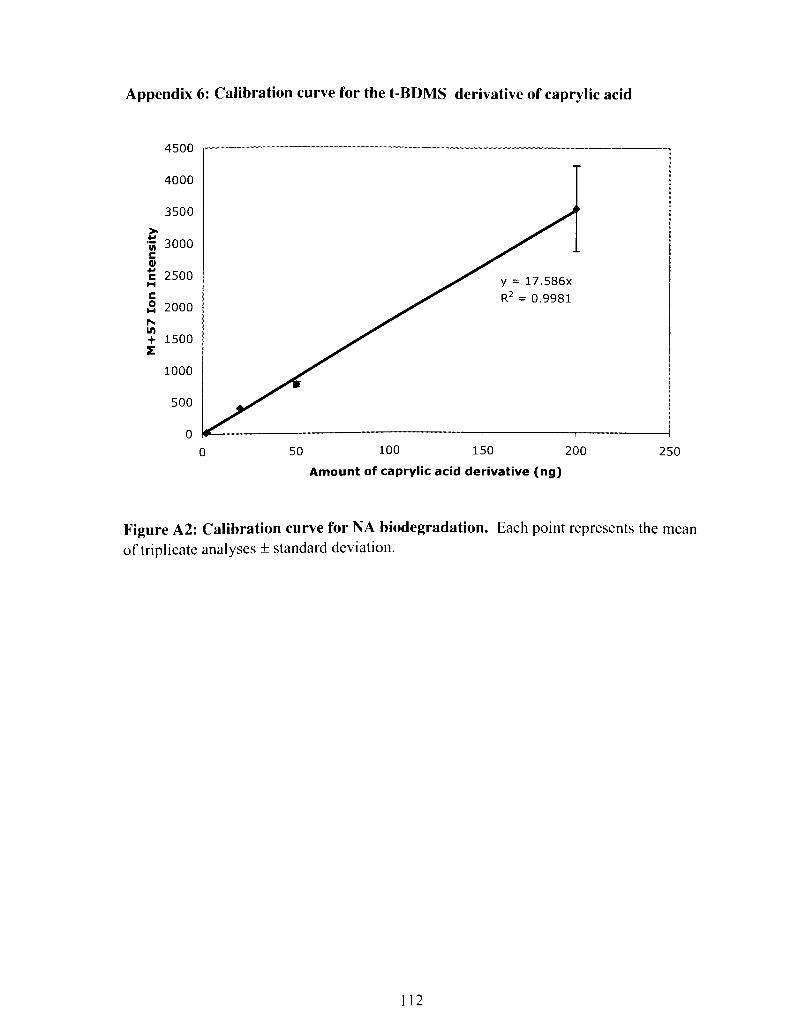
Appendix
4500
4000
3500
* CI -; 3000 c aJ
2500 u C 2 2000 h In + 1500 z
1000
500
0
6: Calibration curve for the t-BDMS derivative of caprylic acid
0 5 0 100 150 200 250
Amount of caprylic acid derivative (ng)
Figure A2: Calibration curve for NA biodegradation. Each point represents the mean of triplicate analyses 2 standard deviation.
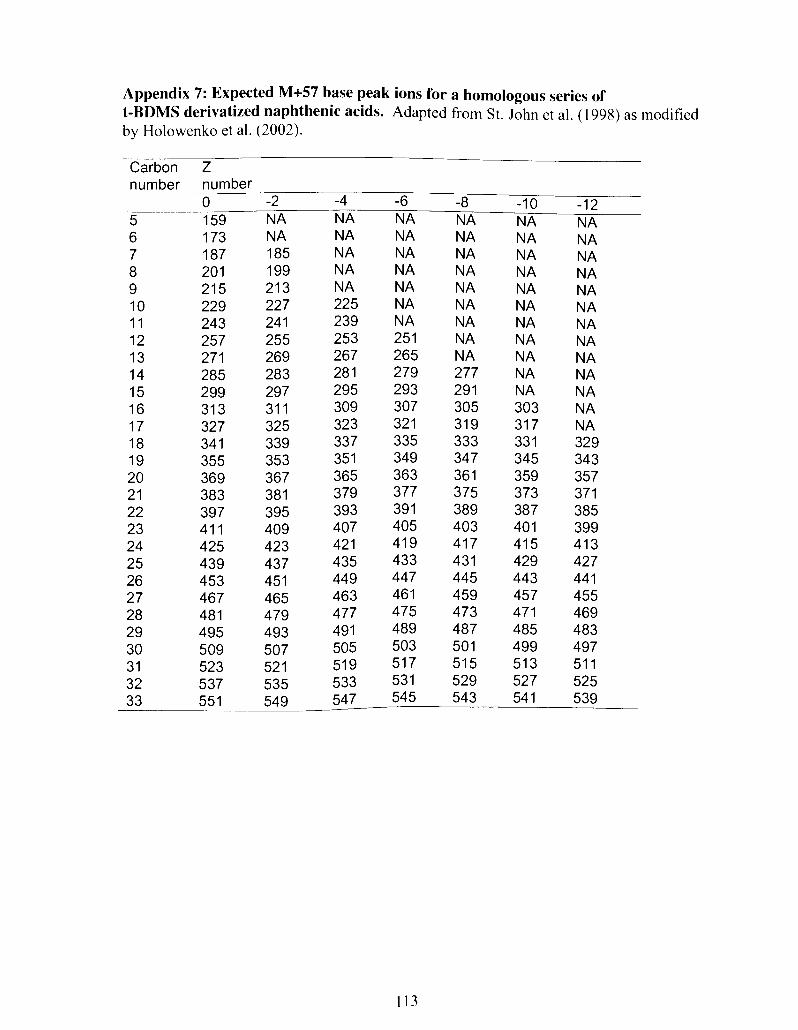
Appendix 7: Expected M+57 base peak ions for a homologous series of t-BUMS derivatized naphthenic acids. Adapted from St. John et al. ( 1 998) as modified by Holowenko et al. (2002).
Carbon Z number number
0 -2 -4 -6 -8 -1 0 -1 2 159 N A N A N A N A N A N A

Appendix 8: Sample matrix showing the amounts of different NA's (in pg)
found in 2 mg of the commercially available NA's mixture.
Carbon Z number number
-
0 -2 -4 -6 -8 -1 0 -1 2 5 46.39 0.00 0.00 0.00 0.00 0.00 0.00 6 25.84 0.00 0.00 0.00 0.00 0.00 0.00 7 22.92 45.41 0.00 0.00 0.00 0.00 0.00 8 19.48 20.19 0.00 0.00 0.00 0.00 0.00 9 14.23 15.82 0.00 0.00 0.00 0.00 0.00 10 14.22 18.1 1 12.69 0.00 0.00 0.00 0.00 11 14.46 27.98 20.13 0.00 0.00 0.00 0.00 12 17.34 33.68 48.90 7.80 0.00 0.00 0.00 13 20.06 43.57 82.81 16.77 0.00 0.00 0.00 14 29.20 54.76 108.55 28.23 11.67 0.00 0.00 15 31 . I2 62.15 105.95 35.47 13.08 0.00 0.00 16 26.10 59.81 92.74 40.73 12.72 10.36 0.00 17 25.05 48.36 62.99 29.92 9.88 9.71 0.00 18 20.98 36.56 47.00 18.37 6.37 6.70 4.09 19 20.39 26.03 28.29 10.22 5.13 4.28 3.13 20 15.23 17.56 14.97 5.09 3.00 2.64 2.94 2 1 6.45 9.68 7.56 2.84 1.45 1 . I 8 2.18 22 3.34 4.17 3.00 1 .25 0.67 0.63 1.04 2 3 2.40 1.89 1.28 0.55 0.36 0.57 0.92 24 1.69 0.94 0.64 0.38 0.57 0.80 1.24 2 5 0.77 0.41 0.28 0.27 0.41 0.75 1.52 26 0.50 0.20 0.17 0.21 0.28 0.80 1.41 2 7 0.18 0.07 0.13 0.16 0.21 0.50 0.92 28 0.13 0.04 0.11 0.24 0.14 0.23 0.38 2 9 0.04 0.06 0.10 0.21 0.16 0.14 0.14 30 0.06 0.03 0.01 0.07 0.1 1 0.1 1 0.06 3 1 0.09 0.06 0.06 0.03 0.10 0.10 0.10 32 0.18 0.11 0.04 0.06 0.04 0.09 0.1 1 3 3 0.41 0.34 0.06 0.10 0.21 0.17 0.28
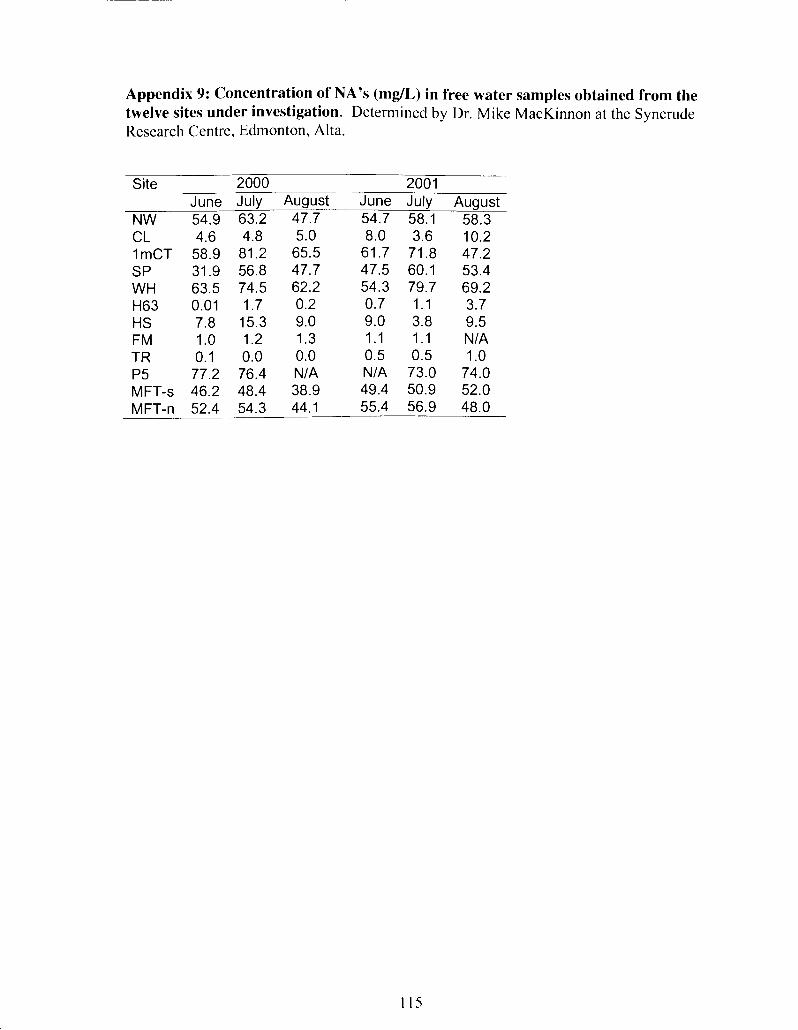
Appendix 9: Concentration of NA's (mg/L) in free water samples obtained from the twelve sites under investigation. Determined by Dr. Mike MacKinnon at the Syncrude Research Centre, Edmonton, Alta.
Site 2000 2001 P
June July August June July August NW 54.9 63.2 47.7 54.7 58.1 58.3
4.6 4.8 5.0 8.0 3.6 10.2 58.9 81.2 65.5 61.7 71.8 47.2 31.9 56.8 47.7 47.5 60.1 53.4 63.5 74.5 62.2 54.3 79.7 69.2 0.01 1.7 0.2 0.7 1.1 3.7 7.8 15.3 9.0 9.0 3.8 9.5 1.0 1.2 1.3 1.1 1.1 NIA 0.1 0.0 0.0 0.5 0.5 1.0 77.2 76.4 NIA NIA 73.0 74.0 46.2 48.4 38.9 49.4 50.9 52.0 52.4 54.3 44.1 55.4 56.9 48.0

Appendix 10: Amount of sediment-bound oil (weight %) obtained from the twelve sites under investigation. Determined by Dr. Mike MacKinnon at the Syncrude Research Centre, Edmonton, Aha.
Site 2000 2001 June July August June July August
NW 0.21 0.27 0.14 0.24 0.36 0.64 CL 0.23 0.13 0.26 0.14 1.13 0.87 ImCT 0.98 1.24 0.06 0.85 1.17 0.92 SP 0.69 0.48 0.32 0.89 0.87 1.14 WH 0.29 0.13 0.03 0.39 0.57 0.57 H63 0.21 0.54 0.20 0.24 0.55 0.47 HS 0.38 0.41 0.20 0.67 0.60 0.62 FM 0.22 0.26 0.08 0.25 0.17 0.25 TR 0.05 0.03 0.00 0.04 0.08 0.08 P5 1.41 1.26 NIA NIA 3.75 1.47 MFT-s 0.78 1.31 0.78 0.81 2.34 3.90 MFT-n 1.40 1.40 0.44 1.52 1.38 1.91
REFERENCES
Abbott, C.K., Sorensen, D.C., Sims, R.C. 1992. Use and efficiency of ethylene glycol monomethyl ether and monoethanolamine to trap volatilized [7-I4c] naphthalene and I4c02 . Environ. Toxicol. Chem. 11: 181-185.
Amman, R.I., Ludwig, W., and Schleifer, K.H. 1995. Phylogenetic identification and in situ detection of individual microbial cells without cultivation. Microbiol. Rev. 59: 143- 169.
Annweiler, E., Michaelis, W., and Meckenstock, R.U. 200 1 . Anaerobic cometabolic conversion of benzothiophene by a sulfate-reducing enrichment culture and in a tar-oil-contaminated aquifer. Appl. Environ. Microbiol. 67: 5077-5083.
Annweiier, E., Michaelis, W., and Meckenstock, R.U. 2002. Identical ring cleavage products during anaerobic degradation of naphthalene, 2- methylnaphthalene and tetralin indicate a new metabolic pathway. Appl. Environ. Microbiol. 68: 852-858.
Bendell-Young, L.I., Bennett, K., Crowe, A., Plant, A., Kermode, A., Moore, M., and Wood, A. 2000. Assessing the ecological viability of wetlands receiving oil sands effluent. Ecol. Appl. 10: 3 10-322.
Blakley, E.R. 1978. The microbial degradation of cyclohexane carboxylic acid by a P-oxidation pathway with simultaneous induction to the utilization of benzoate. Can. J. Microbiol. 24: 847-555.
Hlakley, E.R. and Papish, B. 1982. The metabolism of cyclohexanecarboxylic acid and 3-cyclohenecarboxylic acid by P.seudonlonus pctidu. Can. J. Microbiol. 28: 1324- 1329.
Bligh, E.G., and Dyer, W.M. 1959. A rapid method of lipid extraction and purification. Can. J. Biochem. Physiol. 35: 9 1 1-91 7.
Bobbie, R.J., and White, D.C. 1980. Characterisation of benthic microbial comn~unity by high resolution gas chromatography of fatty acid methyl esters. Appl. Environ. Microbiol. 39: 12 12- 1222.
Hoerger, H., MacKinnon, M., Van Meer, T., and Verbeek, A. 1992. Wet landscape option for reclamation of oil sands fine tails. 111 Proceedings: Second International Conference on Environmental Issues and Management of Waste in Energy, and Minerals Production. Edited by R.K. Singhal, A.K. Mehrora, K. Fytas and J-L Collins. A.A. Balkema. Rotterdam, Netherlands.

Bossio, D.D., and SCOW, K.M. 1995. Impact of carbon and flooding on the metabolic diversity of microbial communities in soils. Appl. Environ. Microbiol. 61: 4043-4050.
Bowman, J.P., McCammon, S.A., Gibson, J.A.E., Robertson, L., and Nichols, P.D. 2003. Prokaryotic metabolic activity and community structure in antarctic continental shelf sediments. Appl. Environ. Microbiol. 69: 2448- 2462.
Brinch-Iverson, J., and King, G.M. 1990. Effects of substrate concentration, growth rate, and oxygen availability on relationships among bacterial carbon, nitrogen and phospholipid phosphorus content. FEMS. Microbiol. 48: 755- 757.
Cason, J., and Graham, D.W. 1965. Isolation of isoprenoid acids from a California petroleum. Tetrahedron. 21: 47 1-485.
Clemente, J.S., Prasad, N.G.N., MacKinnon, M.D., and Fedorak, P.M. 2003. A statistical comparison of naphthenic acids characterized by gas chromatography-mass spectrometry. Chemosphere. 50: 1265- 1274.
Cozzarelli, I.M., Herman, J.S., and Baedecker, M.J. 1995. Fate of microbial metabolites of hydrocarbons in a coasta plain aquifer: The role of electron acceptors. Environ. Sci. Technol. 29: 458-469.
Dowling, N. J.E., Widdel, F., and White, D.C. 1986. Phospholipid fatty acid biomarkers of acetate-oxidizing sulphate-reducers and other sulphide-forming bacteria. J. Gen. Microbiol. 132: 181 5-1 825.
Farwell, A.J. and Dixon, D.G. 2000. The effect of oil sands derived chemicals, naphthenic acids and sodium sulphate on larval fathead minnows. Canadian Technical Report of Fisheries and Aquatic Sciences.
Federle, T.W., and White, D.C. 1982. Preservation of estuarine for lipid analysis of biomass and community structure and microbiota. Appl. Environ. Microbiol. 44: 1 166-1 169.
Ferris, M.J., Muyzer, G., and Ward, D. 1995. Analysis of native bacterial populations in a hot spring microbial mat using denaturing gradient gel electrophoresis (DGGE) of 16s rRNA fragments, abstr. N-26, p. 337. In Abstracts of the 95"' General Meeting of the American Society for Microbiology 1995. American Society for Microbiology, Washington D.C.
Findlay, R.H., King, G.M., and Watling, L. 1989. Efficiency of phospholipid analysis in determining microbial biomass in sediments. Appl. Environ. Microbiol. 55: 2888-2895.
Focht, D.D. 1994. Microbiological procedures for biodegradation research. [n R.W. Weaver, S. Angle, P. Bottomley, D. Bezdicek, S. Smith, A. Tabatabai and A. Wol lum (ed.), Methods of' Soil Anulvsis, part 2. Micwhiolo,gic.d (lnd ~j()~-hc>mic.ul Properties. Soil Science Society of America, Inc., Madison, Wis.
Frostegard, A., Tunlid, A., and Baath, E. (1 993). Phospholipid fatty acid composition, biomass, and activity of microbial communities from two soil types experimentally exposed to different heavy metals. Appl. Environ. Microbiol. 59: 3605-361 7.
Frostegard, A*, Petersen, S., Baath, E., and Nielsen, T.H. 1997. Dynamics of a microbial community associated with manure hot spots as revealed by phospholipid fatty acid analyses. Appl. Environ. Microbiol. 63: 2224-223 1.
FTFC (Fine Tailings Fundamentals Consortium). 1995. Volume 11. Fine Tails and Process Water Reclammation. In advances in Oil Sands Tailings Research. Alberta Department of Energy, Oil Sands and Research Division, Edmonton, AB.
Garland, J.L., and Mills, A.L. 199 1. Classification and characterization of heterotrophic microbial communities on the basis of patterns of community- level sole-carbon-source utilization. Appl. Environ. Microbiol. 57: 235 1 - 2359.
Glimm, E., Heuer, H., Engelen, B., Smalla, K., and Backhaus, H. 1997. Statistical comparisons of community catabolic profiles. J. Microbiol. Methods. 30: 7 1 -80.
Giovannoni, S.J., Britschgi, T.B., Moyer, C.L., and Field, K.G. 1990. Genetic diversity in Sargasso Sea bacterioplankton. Nature (London) 345: 60- 63.
Guckert, J.B., Hood, M.A., and White, D.C. 1986. Phospholipid, ester- linked fatty acid profile changes during nutrient deprivation of Vihrio ~ h o l ~ r u e : increases in the truns/cis ratio and proportion of cyclopropyl fatty acids. Appl. Environ. Microbiol. 52: 794-801.
Gulley, J.R., and MacKinnon, M. 1993. Fine tails reclamation utilization using a wet landscape approach. AB Chamber Resour., AOSTRA, Ener. Min & Resour. Can, Oil Sands: Our Petroleum Future Conference, Edmonton, AB. April 4-7, 1993.
Hamiltom, H., Nix, P.G., and Sobolewski, A. 1993. An overview of constructed wetlands as alternatives to conventional waste treatment systems. Water Poll. Res. J. Canada. 28: 529-548.
Heipieper, H.J., Diffenbach, R., and Keweloh, H. 1992. Conversion of ci.s unsaturated fatty acids to trans, a possible mechanism for the protection of phe~iol-degrading Pseudomonus yutidu P8 from substrate toxicity. Appl. Environ. Microbiol. 58: 1847- 1852.
Herman, D.C., Fedorak, P.M., and Costerton, J.W. 1993. Biodegradation of cycloalkane carboxylic acids in oil sand tailings. Can. J. Microbiol. 39: 576-580.
Herman, D.C., Fedorak, P.M., MacKinnon, M.D., and Costerton, J.W. 1994. Biodegradation of naphthenic acids by microbial populations indigenous to oil sands tailings. Can. J. Microbiol. 40: 467-477.

Holben, W., and Harris, D. 199 1. Monitoring of changes in microbial community composition by fractionation of total community DNA based on G + C content. Q22. In Abstracts 91" Annual Meeting of the American Society for Microbiology 1991. American Society for Microbiology, Washington, D.C.
Holowenko, F.M. 2000. Methanogenesis and Fine Tailings Waste from Oil Sand Extraction: A Microcosm-Based Laboratory Examination. MSc. Thesis.
Holowenko, F.M., MacKinnon, M.D., and Fedorak, P.M. 2001. Napthenic acids and surrogate naphthenic acids in methanogenic microcosms. Water Res. 35: 2595-2606.
Holowenko, F.M., MacKinnon, M.D., and Fedorak, P.M. 2002. Characterization of naphthenic acids in oil sands wastewaters by gas chromatography-mass spectrometry. Water Res. 36: 2843-2855.
Kennedy, A.C. 1994. Carbon utilization and fatty acid profiles for characterization of bacteria, pp. 543-553. In R.W. Weaver, S. Angle, P. Bottomley, D. Bezdicek, S. Smith, A. Tabatabai and A. Wollum (ed.), Mc.thods of'Soil Analvsis, part 2. Microbiological and Biochevlical Propc.rtie.s. Soil Science Society of America, Inc., Madison, Wis.
Kieft, T.L., Ringelberg, D.B., and White, D.C. 1994. Changes in ester- linked phospholipid fatty acid profiles of subsurface bacteria during starvation and dessication in a porous medium. Appl. Environ. Microbial. 60: 3292- 3299.
Lai, W.S., Pinto, L.J., Kiehlman, E., Bendell-Young, L.I., and Moore, M.M. 1996. Factors that affect the degradation of naphthenic acids in oil sands wastewater by indigenous microbial communities. Env. Toxicol. Chem. 15: 1482-1491.
Lawrence, G.A., Ward, P.R.B. and MacKinnon, M.D. 1991. Wind and wave induced suspension of mine tailings in disposal ponds-a case study. Can. J . Civil. Eng. 18: 1046-1053.
Lerman, L.S., Fischer, S.G., Hurley, I., Silverstein, K., and Lumelsky, N. 1984. Sequence determined DNA separations. Annu. Rev. Biophys. Bioeng. 13: 399-423.
Liesack, W., and Stackebrandt, E. 1992. Occurrence of novel groups of the domain Bacteria as revealed by analysis of genetic material isolated from an Australian terrestrial environment. J. Bacterial. 174: 5072-5078.
I,ist, R.R. and Lord, E.R.F. 1997. Syncrude's tailings management practices from research to implementation. CIM Bulletin. 90: 39-44.
Lower, E.S. 1987. Naphthenic acid. Specialty Chemicals. 7: 76-85.
MacKinnon, M. 1989. Development of the tailings pond at Syncrude's oil sands plant: 1978- 1987. AOSTRA J. Res. 5: 109- 133.
MacKinnon, M. and Roerger, H. 1986. Description of two treatment methods for detoxifying oil sands tailings pond water. Water Pollut. Res. J . Can. 21: 496-5 12.
MacLean, D. 1998. Syncrude facts. Syncrude Canada Ltd. Government and Public Affairs Department. Fort McMurray, AB.
Marchesi, J.R. 200 1. Primer Design for PCR Amplification of Environmental DNA Targets. In Rochelle, P.A. (Ed). Environmental molecular microbiology: protocols and applications. Horizon Scientific Press ; New York.
Morales, A., Hrudey, S.E., and Fedorak, P.M. 1993. Mass spectrometric characterization of naphthenic acids in oil sands wastewaters. Analysis of biodegradation and environmental significance. Alberta Department of Energy, Oil Sands Research Division, Edmonton, AB.
Moyer, C.L., Dobbs, F.C., and Karl, D. 1994. Estimation of diversity and community structure through restriction fragment length polymorphism distribution analysis of bacterial 16s rRNA genes from a microbial mat at an active, hydrothermal vent system, Loihi Seamount, Hawaii. Appl. Environ. Microbiol. 60: 87 1-879.
Muyzer, G., DeWall, E.C., and Uitterlinden, A.G. 1993. Profiling of complex microbial populations by denaturing gradient gel electrophoresis analysis of polymerase chain reaction-amplified genes coding for 16s rRNA. Appl. Environ. Microbiol. 59: 695-700.
Myers, R.M., Maniatis, T. and Lerman, L.S. 1987. Detection and localization of single base changes by denaturing gradient gel electrophoresis. Methods Enzymol 155: 50 1-527.
Nes, W.R. 1977. The biochemistry of plant sterols. Adv. Lipid. Res. 15: 233- 324.
Nix, P.G., and Bishay, F.S. 1997. Applications of constructed wetlands for the detoxification of Oil Sands wastewater: A research overview. Canadian Technical Report of Fisheries and Aquatic Sciences; 0(2 144), 1997, pgs 13- 23.
Nix, P.G., Hamilton, S.H., Bauer, E.D., and Gunter, C.P. 1993. Constructed wetlands for the treatment of oil sands wastewater: Technical Report 2. Alberta Oil Sands Technology and Research Authority, Edmonton, AB, Canada.
Norland, S. 1993. The relationship between biomass and volume of bacteria, pp. 303-307. In P.F. Kemp, B.F. Sherr, E.B. Sherr and J.J. Cole (Eds.), Handbook of Methods in Aquatic Microbial Ecology. Lewis Punlishers. Boca Raton, Fla.

Ogram, A.V., and Bezdicek, D.F. 1994. Nucleic acid probes, p. 665-687. In R.W. Weaver, S. Angle, P. Bottomley, D. Bezdicek, S. Smith, A. Tabatabai and A. Wollum (ed.), Methods of'Soil Anul~vsis, part 2. Microbiological und Biochenzicul Properties. Soil Science Society of America, Inc., Madison, Wis.
Ogram, A., and Feng, X. 1996. Methods of Soil Microbial Community Analysis. pp. 422-430. In Hurst, C.J., Knudsen, G.R., McInerney, M.J., Stetzenbach, L.D., and Walter, M.V. (ed.), Manual of'Envivonmentu1 Microbiologv. American Society for Microbiology, Washington, D.C.
Pennanen, T. 2001. Microbial communities in boreal coniferous forest humus exposed to heavy metals and changes in soil pH- a summary of the use of phospholipid fatty acids, BiologO, and ' ~ - t h ~ m i d i n e incorporation methods in field studies. Geoderma 100: 9 1 - 126.
Pollet, I., and Bendell-Young, L.I. 2000. Amphibians as indicators of wetland quality in wetlands formed from oil sands effluent. Env. Toxicol. Chem. 19: 2589-2597.
Preston-Mafham, J., Boddy, L., and Randerson, P.F. 2002. Analysis of microbial community functional diversity using sole-carbn-source utilisation profiles-a critique. FEMS. Microbiol. Ecol. 42: 1 - 14.
Reed, S.C., Middlebrooks, E.J., and Crites, R.W. 1988. Natural Systems for Waste Management and Treatment. McGraw-Hill, New York.
Reysenback, A.-L., Giver, L.J., Wickham, G.S., and Pace, N.R. 1992. Differential amplification of rRNA genes by polymerase chain reaction. Appl. Environ. Microbiol. 60: 1232- 1240.
Rogers, V.V., Liber, K., and MacKinnon, M.D. 2002. Acute and subchronic mammalian toxicity of naphthenic acids from oil sands tailings. Toxicol. Sci. 66: 347-355.
Rontani, J-F., Bonin, P.C., and Volkman, J.K. 1999. Biodegradation of free phytol by bacterial communities isolated from marine sediments under aerobic and denitrifying conditions. Appl. Environ. Microbiol. 65: 5484-5492.
St. John, W.P., Rughani, G., Green, S.A., and McGinnis, G.C. 1998. Analysis and characterization of naphthenic acids by gas chromatography electron impact mass spectrometry tert-butyldimethylsylil derivatives. J. Chromatog. A. 807: 24 1 -25 1 .
!jambrook, J., Fritsch, E.F., and Maniatis, T. 1989. Molecular Cloning: a Laboratory Manual, 2nd ed. Cold Spring Harbour Laboratory Press, Cold Spring Harbour, N.Y.
SayIer, G.S., and Layton, A.C. 1990. Environmental application of nucleic acid hybridization. Annu. Rev. Microbiol. 49: 1295-1 303.
Schwab, W., Dambach, P., and Buhl, H.J. 1994. Microbial degradation of heptenophos in the soil environment by a biological Baeyer-Villiger oxidation. J. Agric. Food Chem. 42: 1578-1 583.
Schramm, L.L. Stasiuk, E.N., and MacKinnon, M. 2000. Surfactants in the Athabasca oil sands slurry conditioning, flotation recovery and tailings processes. In Surfactants, fundamentals and applications in the petroleum industry. Edited by LL. Schramm. Cambridge University Press, U.K., pp. 365- 430.
Schley, P., Pinto, L., and Moore, M.M. 1998. Biodegradation of naphthenic acids in sediments receiving oil sands wastewater. Final report submitted to Suncor OSG c/o J. Gulley, Golder Associates, Calgary, AB. 41pp.
Smalla, K., Wachtendorf, U., Heuer, H., Liu, W.T. and Forney, L. 1998. Analysis of BlOLOG GN substrate utilization patterns by microbial communities. Appl. Environ. Microb. 64: 1220- 1225.
Sobolewski, A. 1999. Survey of anaerobic bacteria in in tailings sampled at the Syncrude Lease. Microbial Technologies (Vancouver, B.C.) prepared for Syncrude Canada Ltd. Contract Report. (D 1660-25).
Summit, M., Peacock, A., Ringelberg, D., White, D.C., and Baross, J.A. 2000. Phospholipid Fatty Acid-Derived Microbial Biomass and Community Dynamics in Hot, Hydrothermally Influenced Sediments From Middle Valley, Juan De Fuca Ridge. In Zierenberg, R.A., Fouquet, T., Miller, D.J., and Normark, W.R. (Eds.), Proc. ODP, Sci. Results 169: 1-19. Available from World Wide Web: http://~wwodp.tamu.edul~ub~icat~onsll 69-SRlVolun~e/Chapters/SR 169 - 03.P DF
Stahl, D.A. 1996. Molecular Approaches for the Measurement of Density, Diversity and Phylogeny. pp. 102-1 14. In Hurst, C.J., Knudsen, G.R., McInerney, M.J., Stetzenbach, L.D., and Walter, M.V. (eds.), Munuul of' ~nvironnzentul Mic*rohiolo~~. American Society for Microbiology, Washington, D.C.
Teske, A,, Wawer, C., Muyzer, G., and Ramsing, N.B. 1996. Distribution of sulfate-reducing bacteria in a stratified fjord (Mariager Fjord, Denmark) as evaluated by most probable-number counts and denaturing gradient gel electrophoresis of PCR-amplified ribosomal DNA fragments. Appl. Environ. Microbial. 62: 1405-141 5.
Torsvic, V., Sake, K., Sorheim, R., and Goksoyr, J. 1990. High diversity in DNA of soil bacteria. Appl. Environ. Microbiol. 56: 782-787.
Torsvic, V., Goksoyr, J., and Daae, F. 1990. Comparison of phenotypic diversity and DNA heterogeneity in a population of soil bacteria. Appl. Environ. Microbiol. 56: 776-78 1 .
Van Veldhoven, P.P., and Mannaerts, G.P. 1987. Inorganic and organic phosphate measurements in the nanomolar range. Analytical Chemistry. 161: 45-48.
Venter, J.C., Remington, K., Heidelberg, J.F., Halpern, A.L., Rusch, D., Eisen, J.A., Wu, D., Paulsen, I., Nelson, K.E., Nelson, W., Fouts, D.E., Levy, S., Knap, AH., Lomas, M.W., Nealson, K., White, O., Peterson, J., Hoffman, J., Parsons, R., Baden-Tillson, H., Pfannkoch, C., Rogers, Y-H., and Smith, H.O. 2004. Environmental Genome Shotgun Sequencing of the Sargasso Sea. Science. 304: 66-74.
Vestal, J.R., and White, D.C. 1989. Lipid analysis in microbial ecology. Bioscience 39: 535-54 1 .
Vourdouw, G., Shen, Y.,C., Harrington, C., Telang, A., Jack, T., and Westlake, D. 1993. Quantitative reverse sample genome probing of microbial communities and its application to oil field production waters. Appl. Environ. Microbial. 59: 4 10 1-4 1 14.
White, D.C., Bobbie, R.J., Nickels, J.S., Fazio, S.D., and Davis, W.M. I 980. Nonselective biochemical methods for the determination of of fungal mass and community structure in estuarine detrital microflora. Bot. Mar. 23: 239-250.
White, D.C., Pinkart, H.C., and Ringelberg, D.B. 1996. Biomass Measurements: Biochemical Approaches. pp. 9 1 - 10 1. I n Hurst, C.J., Knudsen, G.R., McInerney, M.J., Stetzenbach, L.D., and Walter, M.V. (ed.), M~lnlrtri of'Envir-onrnrntul Micr-ohiologv. American Society for Microbiology, Washington, D.C.
White, D.C., Stair, J.O., and Ringelberg, D.B. 1996. Quantitative comparisons of in situ microbial biodiversity by signature biomarker analysis. Journal of Industrial Microbiology 17: 185- 196.
White, D.C. and Tucker, A.T. 1969. Phospholipid metabolism during bacterial growth. J. Lipid. Res. 10: 220-233.
Zelles, L. 1999. Fatty acid patterns of phospholipids and lipopolysaccharides in the characterization of microbial communities in soil: a review. Biol. Ferti]. Soils. 29: 1 1 1 - 129.
Zelles, L., and Bai, Q.Y. 1993. Fractionation of fatty acids derived from soil lipids by solid phase extraction and their quantitative analysis by GC-MS. Soil. Biol. Biochem. 25: 495-507.