Challenges and Prospects of Developing in Asian Countries ...
Upload
dana-davisCategory
view
214download
0
The External Environment for Developing Countries
May 2010The World Bank
Development EconomicsProspects Group

CDS spreads – EU-5 vs. selected EMs
Brazil, Russia, China, Turkey, Indonesia (BRCTI)
Oct-09 Nov-09 Dec-09 Jan-10 Feb-10 Mar-10 Apr-10 May-1050
100
150
200
250
300
350
400
450
Average BRCTI (Brazil, Russia, China, Turkey, Indonesia)
Source: JPMorgan and World Bank data.

Claims of EU Periphery banks on EMs as percent of lender’s GDP
Portugal
Italy
Greece
Spain
Ireland
0% 5% 10% 15% 20% 25% 30%
EE LAC Africa / ME Asia
Source: IFC calculations based on BIS data.

OECD developments

Greek contagion fears were calmed by a momentous policy
package
Source: Bloomberg and DECPG staff calculations.
0
100
200
300
400
500
600
700
800
900
1000
Greece
Portugal
Ireland
Spain
5-year sovereign CDS spreads (bps) The €750 million EU package
Ratings downgrades of Greece, Portugal, and Spain
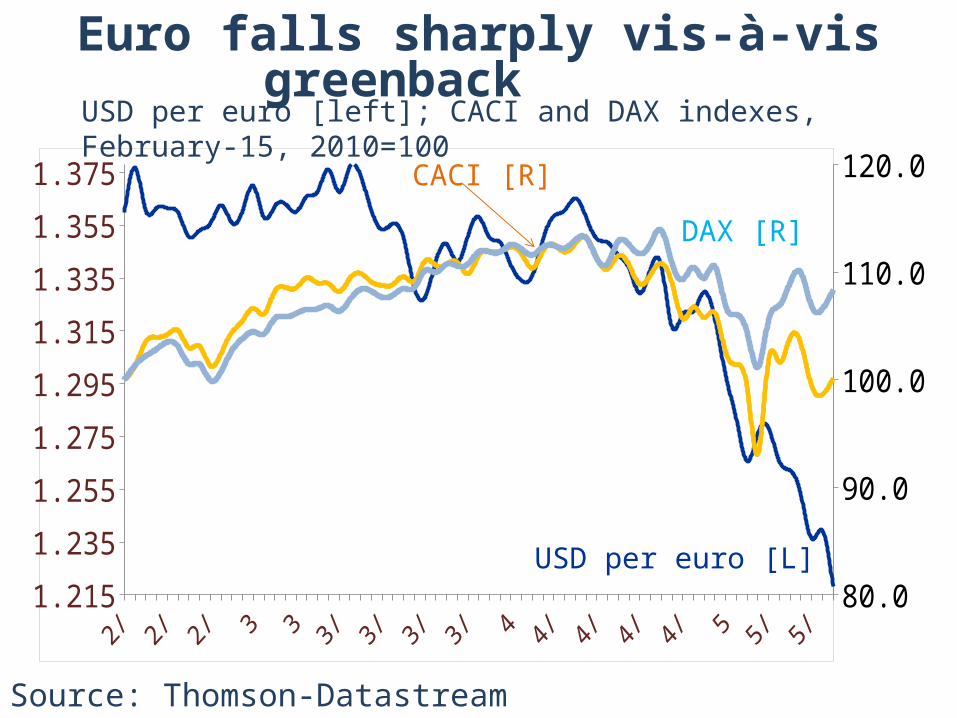
Source: Thomson-Datastream
Feb-10 Mar-10 Mar-10 Apr-10 Apr-10 May-10 May-101.215
1.235
1.255
1.275
1.295
1.315
1.335
1.355
1.375
80.0
90.0
100.0
110.0
120.0
Euro falls sharply vis-à-vis greenback
USD per euro [left]; CACI and DAX indexes, February-15, 2010=100
USD per euro [L]
DAX [R]
CACI [R]

Euro Zone growth dissapoints in first quarter
quarterly growth of real GDP, percentage change , q/q saar
Q3-2009 Q4-2009 Q1-2010-1
0
1
2
3Euro AreaGer-many
Source: Eurostat

German export orders revive in March
factory orders received from abroad and industrial production, ch% saar
Jan-08 May-08Sep-08 Jan-09 May-09Sep-09 Jan-10-75
-50
-25
0
25
50 German export ordersindustrial production
Source: Eurostat

U.S. GDP growth eases to 3.2% in Q1-2010
on stocks, investment and exports
Q3-2009 Q4-2009 Q1-2010-2
0
2
4
6
8
2.2
5.6
3.2
Prv Consumption Gvt ConsumptionFixed Investment change in Stocks
quarterly growth of real GDP (saar), and contributions to growth in percentage points
Source: World Bank, DEC Prospects Group.

U.S. employment gains now firmly in
positive territory… supporting demand
retail sales x autos ch% saar [left]; change in employment ‘000 (3mma) [right]
1/1/2008 6/1/2008 11/1/2008 4/1/2009 9/1/2009 2/1/2010-25.0
-17.5
-10.0
-2.5
5.0
12.5
-800
-600
-400
-200
0
200
400RS left
Source: U.S. Departments of Commerce and Labor.

-50.0
-37.5
-25.0
-12.5
0.0
12.5
25.0
37.5
50.0
97.5
100.0
102.5
105.0
107.5
110.0U.S. New Orders [L]DJIA [L]Lead Indicator [L]
Forward-looking indicators also favorable
Source: Thomsom/Datastream.
new orders (ch% saar), DJIA (ch%, y/y) [L]; LEI [R]

Japan orders, exports, and IP show moderate
sign of slack– waiting return of demand
private machinery orders, export volumes and production, ch% (3m/3m, saar)
Jan-08 May-08Sep-08 Jan-09 May-09Sep-09 Jan-10-75
-50
-25
0
25
50
75
Japan ordersindustrial production
Source: Japan Cabinet Office, METI.

Jan-08 May-08 Sep-08 Jan-09 May-09 Sep-09 Jan-10-4.0
-2.0
0.0
2.0
4.0
25.0
30.0
35.0
40.0
45.0
Retail sales volume [L]
Japanese consumer now adding
meaningfully to growth
Source: Japan Cabinet Office, METI.
retail sales volume, ch% year-on-year [L]; and Tokyo Consumer Confidence Index [R]

Country Focus:Brazil

1/1/2007 10/1/2007 7/1/2008 4/1/2009 1/1/2010-10
-5
0
5
10
15
20
-50
-40
-30
-20
-10
0
10
20
30
Retail sales volume [L]Industrial proud-ction [R]
retail sales and industrial production
Domestic demand continues to drive industrial production
inBrazil
Source: Thompson/Datastream.

Jan-07 Jun-07Nov-07Apr-08Sep-08Feb-09 Jul-09 Dec-093
4
5
6
7
8
9
10
11
12
13
14
Inflation [L]
SELIC Rate [R]
Inflationary pressures are building
Source: Thompson/Datastream.
Inflation, ch% yr-on-yr [L], SELIC rate, % [R]
1/1/2010 1/31/2010 3/2/2010 4/1/2010 5/1/2010150
170
190
210
230
250
300
320
340
360
380
400
420
440
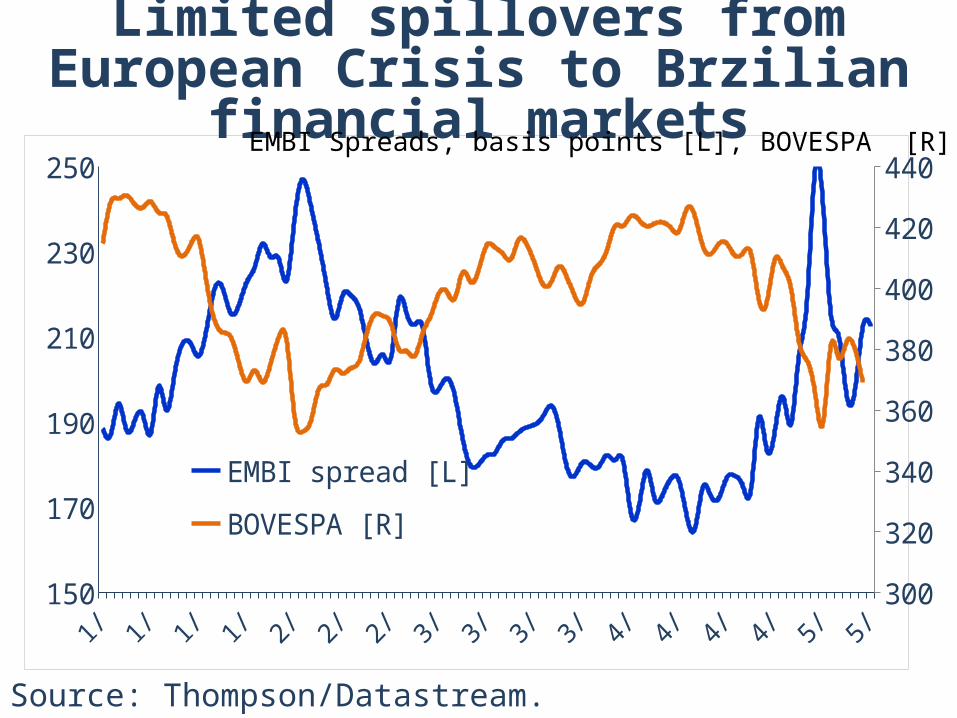
EMBI spread [L]
BOVESPA [R]
Limited spillovers from European Crisis to Brzilian
financial markets
Source: Thompson/Datastream.
EMBI Spreads, basis points [L], BOVESPA [R]

Industrial production

The shift to the right in the distribution of monthly growth in
IP points to recovery
-15 -10 -5 0 5 10 150
5
10
15
20
25
30
35
Monthly growth in March 2010
Monthly growth December 2009
Source: Development Prospects Group.

Industrial production exceeds pre-crisis peaks in selected countries
Source: Development Prospects Group.
Jan-07 Jul-07 Jan-08 Jul-08 Jan-09 Jul-09 Jan-1050
60
70
80
90
100
110
120
130
Brazil China India
Korea Thailand Taiwan
pre – crisis peak = 100

Strong IP carryover will ensure robust performance in the second
quarterpercent, 3m/3m saar
LativaEsto
niaSpain
TurkeyBrazil
Slovakia
Czech Republic
RomaniaKorea
SloveniaChina
Taiwan
Germany
Thailand
Singapore0
5
10
15
20
25
Source: Development Prospects Group.

International trade

Share of Southern Euro Zone in total exports
percent share of total exports in 2008
Source: World Bank, UN-COMTRADE.
EAP LAC Asia SSA ECA MENA0
5
10
15
20
3.74.5
5.7
8.810.0
19.3

1996 1998 2000 2002 2004 2006 20080%
20%
40%
60%
80%
100%
BRICs Other LMICs USA Other HICs EU 25
Share of world trade for developing countries
share of world imports in percent
Source: World Bank, UN-COMTRADE.

G20 use of selected temporary trade barriers
0
500
1000
1500
2000
2500
3000
3500
1997 1998 1999 2000 2001 2002 2003 2004 2005 2006 2007 2008 2009
China as exporterDeveloping economy as exporter (non-China)Developed economy as exporter
By import source, 1997-2009, unique product-exporter combinations
Source: Bown (2010), Global Anti-dumping Database.

Oil prices
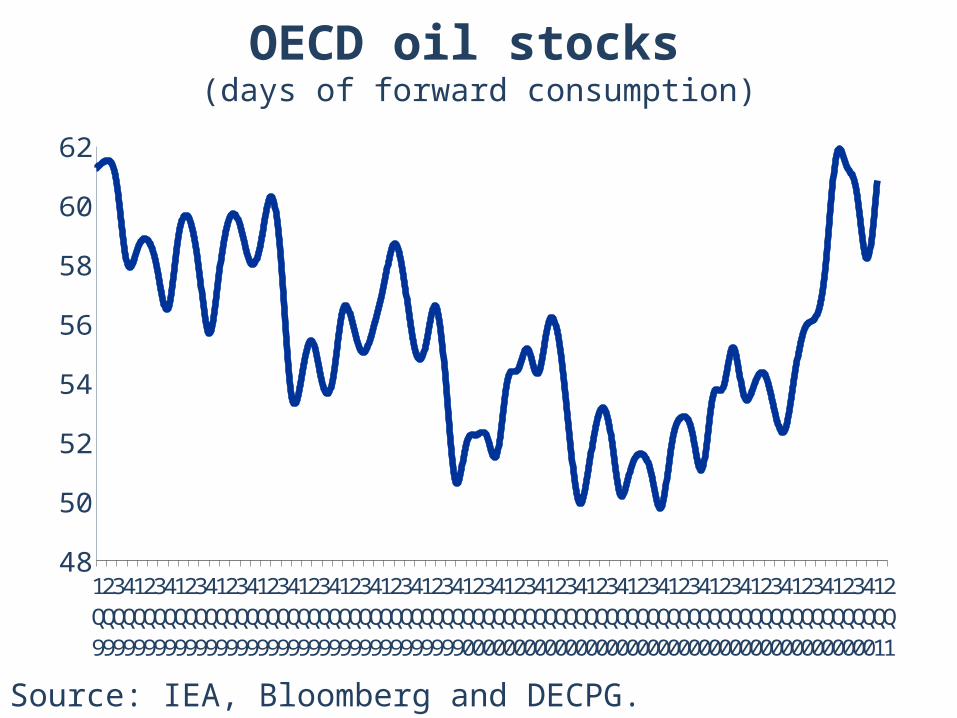
OECD oil stocks (days of forward consumption)
1Q91
2Q91
3Q91
4Q91
1Q92
2Q92
3Q92
4Q92
1Q93
2Q93
3Q93
4Q93
1Q94
2Q94
3Q94
4Q94
1Q95
2Q95
3Q95
4Q95
1Q96
2Q96
3Q96
4Q96
1Q97
2Q97
3Q97
4Q97
1Q98
2Q98
3Q98
4Q98
1Q99
2Q99
3Q99
4Q99
1Q00
2Q00
3Q00
4Q00
1Q01
2Q01
3Q01
4Q01
1Q02
2Q02
3Q02
4Q02
1Q03
2Q03
3Q03
4Q03
1Q04
2Q04
3Q04
4Q04
1Q05
2Q05
3Q05
4Q05
1Q06
2Q06
3Q06
4Q06
1Q07
2Q07
3Q07
4Q07
1Q08
2Q08
3Q08
4Q08
1Q09
2Q09
3Q09
4Q09
1Q10
2Q10
48
50
52
54
56
58
60
62
Source: IEA, Bloomberg and DECPG.

Crude oil prices drop and differentials skew
Jan-10Jan-10Jan-10Jan-10Jan-10Jan-10Jan-10Jan-10Jan-10Jan-10Jan-10Jan-10Jan-10Jan-10Jan-10Jan-10Jan-10Jan-10Jan-10Jan-10Jan-10Feb-10Feb-10Feb-10Feb-10Feb-10Feb-10Feb-10Feb-10Feb-10Feb-10Feb-10Feb-10Feb-10Feb-10Feb-10Feb-10Feb-10Feb-10Feb-10Feb-10Mar-10Mar-10Mar-10Mar-10Mar-10Mar-10Mar-10Mar-10Mar-10Mar-10Mar-10Mar-10Mar-10Mar-10Mar-10Mar-10Mar-10Mar-10Mar-10Mar-10Mar-10Mar-10Mar-10Apr-10Apr-10Apr-10Apr-10Apr-10Apr-10Apr-10Apr-10Apr-10Apr-10Apr-10Apr-10Apr-10Apr-10Apr-10Apr-10Apr-10Apr-10Apr-10Apr-10Apr-10Apr-10May-10May-10May-10May-10May-10May-10May-10May-10May-10May-10May-10May-1065
70
75
80
85
90
$/bbl
Brent
Dubai
Source: Datastream and DECPG.
WTI

WTI Futures Prices – NYMEXmonthly contract prices to Dec 2015* for select dates in
2010
60
70
80
90
100
Jan-10 Jan-11 Jan-12 Jan-13 Jan-14 Jan-15
May 18
$/bbl
Jan 29
Mar 31
Source: NYMEX.
Apr 30
* Futures prices extend semi-annually to Dec 2018

Non-oil commodity prices

100
150
200
250
300
Jan-05 Jan-06 Jan-07 Jan-08 Jan-09 Jan-10
Food Beverages
Raw Materials
Ag- gains led by raw materials and beverages
(2000=100)
Source: DECPG.

Metals prices fall on Eurozone woes
Jan-05Jan-05Jan-05Jan-05Jan-05Jan-05Jan-05Feb-05Feb-05Feb-05Feb-05Feb-05Feb-05Mar-05Mar-05Mar-05Mar-05Mar-05Mar-05Mar-05Mar-05Apr-05Apr-05Apr-05Apr-05Apr-05Apr-05Apr-05May-05May-05May-05May-05May-05May-05May-05Jun-05Jun-05Jun-05Jun-05Jun-05Jun-05Jun-05Jun-05Jul-05Jul-05Jul-05Jul-05Jul-05Jul-05Jul-05Aug-05Aug-05Aug-05Aug-05Aug-05Aug-05Aug-05Sep-05Sep-05Sep-05Sep-05Sep-05Sep-05Sep-05Sep-05Oct-05Oct-05Oct-05Oct-05Oct-05Oct-05Oct-05Nov-05Nov-05Nov-05Nov-05Nov-05Nov-05Nov-05Dec-05Dec-05Dec-05Dec-05Dec-05Dec-05Dec-05Jan-06Jan-06Jan-06Jan-06Jan-06Jan-06Jan-06Jan-06Feb-06Feb-06Feb-06Feb-06Feb-06Feb-06Mar-06Mar-06Mar-06Mar-06Mar-06Mar-06Mar-06Mar-06Apr-06Apr-06Apr-06Apr-06Apr-06Apr-06Apr-06May-06May-06May-06May-06May-06May-06May-06Jun-06Jun-06Jun-06Jun-06Jun-06Jun-06Jun-06Jun-06Jul-06Jul-06Jul-06Jul-06Jul-06Jul-06Jul-06Aug-06Aug-06Aug-06Aug-06Aug-06Aug-06Aug-06Sep-06Sep-06Sep-06Sep-06Sep-06Sep-06Sep-06Oct-06Oct-06Oct-06Oct-06Oct-06Oct-06Oct-06Oct-06Nov-06Nov-06Nov-06Nov-06Nov-06Nov-06Nov-06Dec-06Dec-06Dec-06Dec-06Dec-06Dec-06Dec-06Jan-07Jan-07Jan-07Jan-07Jan-07Jan-07Jan-07Jan-07Feb-07Feb-07Feb-07Feb-07Feb-07Feb-07Mar-07Mar-07Mar-07Mar-07Mar-07Mar-07Mar-07Mar-07Apr-07Apr-07Apr-07Apr-07Apr-07Apr-07Apr-07May-07May-07May-07May-07May-07May-07May-07Jun-07Jun-07Jun-07Jun-07Jun-07Jun-07Jun-07Jul-07Jul-07Jul-07Jul-07Jul-07Jul-07Jul-07Jul-07Aug-07Aug-07Aug-07Aug-07Aug-07Aug-07Aug-07Sep-07Sep-07Sep-07Sep-07Sep-07Sep-07Sep-07Oct-07Oct-07Oct-07Oct-07Oct-07Oct-07Oct-07Oct-07Nov-07Nov-07Nov-07Nov-07Nov-07Nov-07Nov-07Dec-07Dec-07Dec-07Dec-07Dec-07Dec-07Dec-07Jan-08Jan-08Jan-08Jan-08Jan-08Jan-08Jan-08Jan-08Feb-08Feb-08Feb-08Feb-08Feb-08Feb-08Feb-08Mar-08Mar-08Mar-08Mar-08Mar-08Mar-08Mar-08Apr-08Apr-08Apr-08Apr-08Apr-08Apr-08Apr-08May-08May-08May-08May-08May-08May-08May-08Jun-08Jun-08Jun-08Jun-08Jun-08Jun-08Jun-08Jul-08Jul-08Jul-08Jul-08Jul-08Jul-08Jul-08Jul-08Aug-08Aug-08Aug-08Aug-08Aug-08Aug-08Aug-08Sep-08Sep-08Sep-08Sep-08Sep-08Sep-08Sep-08Oct-08Oct-08Oct-08Oct-08Oct-08Oct-08Oct-08Oct-08Nov-08Nov-08Nov-08Nov-08Nov-08Nov-08Nov-08Dec-08Dec-08Dec-08Dec-08Dec-08Dec-08Dec-08Jan-09Jan-09Jan-09Jan-09Jan-09Jan-09Jan-09Jan-09Feb-09Feb-09Feb-09Feb-09Feb-09Feb-09Mar-09Mar-09Mar-09Mar-09Mar-09Mar-09Mar-09Mar-09Apr-09Apr-09Apr-09Apr-09Apr-09Apr-09Apr-09May-09May-09May-09May-09May-09May-09May-09Jun-09Jun-09Jun-09Jun-09Jun-09Jun-09Jun-09Jul-09Jul-09Jul-09Jul-09Jul-09Jul-09Jul-09Jul-09Aug-09Aug-09Aug-09Aug-09Aug-09Aug-09Aug-09Sep-09Sep-09Sep-09Sep-09Sep-09Sep-09Sep-09Oct-09Oct-09Oct-09Oct-09Oct-09Oct-09Oct-09Oct-09Nov-09Nov-09Nov-09Nov-09Nov-09Nov-09Nov-09Dec-09Dec-09Dec-09Dec-09Dec-09Dec-09Dec-09Jan-10Jan-10Jan-10Jan-10Jan-10Jan-10Jan-10Feb-10Feb-10Feb-10Feb-10Feb-10Feb-10Feb-10Mar-10Mar-10Mar-10Mar-10Mar-10Mar-10Mar-10Mar-10Apr-10Apr-10Apr-10Apr-10Apr-10Apr-10Apr-10May-10May-10May-10May-100
10,000
20,000
30,000
40,000
50,000
60,000
0
20
40
60
80
100
120
140
160
180$/ton ‘000 tons
Nickel price
LME stocks
Source: Datastream and DECPG.

Gold prices (per troy ounce)
Jan-09Jan-09Jan-09Jan-09Jan-09Jan-09Jan-09Jan-09Jan-09Jan-09Jan-09Jan-09Jan-09Jan-09Jan-09Jan-09Jan-09Jan-09Jan-09Jan-09Jan-09Jan-09Feb-09Feb-09Feb-09Feb-09Feb-09Feb-09Feb-09Feb-09Feb-09Feb-09Feb-09Feb-09Feb-09Feb-09Feb-09Feb-09Feb-09Feb-09Feb-09Feb-09Mar-09Mar-09Mar-09Mar-09Mar-09Mar-09Mar-09Mar-09Mar-09Mar-09Mar-09Mar-09Mar-09Mar-09Mar-09Mar-09Mar-09Mar-09Mar-09Mar-09Mar-09Mar-09Apr-09Apr-09Apr-09Apr-09Apr-09Apr-09Apr-09Apr-09Apr-09Apr-09Apr-09Apr-09Apr-09Apr-09Apr-09Apr-09Apr-09Apr-09Apr-09Apr-09Apr-09Apr-09May-09May-09May-09May-09May-09May-09May-09May-09May-09May-09May-09May-09May-09May-09May-09May-09May-09May-09May-09May-09May-09Jun-09Jun-09Jun-09Jun-09Jun-09Jun-09Jun-09Jun-09Jun-09Jun-09Jun-09Jun-09Jun-09Jun-09Jun-09Jun-09Jun-09Jun-09Jun-09Jun-09Jun-09Jun-09Jul-09Jul-09Jul-09Jul-09Jul-09Jul-09Jul-09Jul-09Jul-09Jul-09Jul-09Jul-09Jul-09Jul-09Jul-09Jul-09Jul-09Jul-09Jul-09Jul-09Jul-09Jul-09Jul-09Aug-09Aug-09Aug-09Aug-09Aug-09Aug-09Aug-09Aug-09Aug-09Aug-09Aug-09Aug-09Aug-09Aug-09Aug-09Aug-09Aug-09Aug-09Aug-09Aug-09Aug-09Sep-09Sep-09Sep-09Sep-09Sep-09Sep-09Sep-09Sep-09Sep-09Sep-09Sep-09Sep-09Sep-09Sep-09Sep-09Sep-09Sep-09Sep-09Sep-09Sep-09Sep-09Sep-09Oct-09Oct-09Oct-09Oct-09Oct-09Oct-09Oct-09Oct-09Oct-09Oct-09Oct-09Oct-09Oct-09Oct-09Oct-09Oct-09Oct-09Oct-09Oct-09Oct-09Oct-09Oct-09Nov-09Nov-09Nov-09Nov-09Nov-09Nov-09Nov-09Nov-09Nov-09Nov-09Nov-09Nov-09Nov-09Nov-09Nov-09Nov-09Nov-09Nov-09Nov-09Nov-09Nov-09Dec-09Dec-09Dec-09Dec-09Dec-09Dec-09Dec-09Dec-09Dec-09Dec-09Dec-09Dec-09Dec-09Dec-09Dec-09Dec-09Dec-09Dec-09Dec-09Dec-09Dec-09Dec-09Dec-09Jan-10Jan-10Jan-10Jan-10Jan-10Jan-10Jan-10Jan-10Jan-10Jan-10Jan-10Jan-10Jan-10Jan-10Jan-10Jan-10Jan-10Jan-10Jan-10Jan-10Jan-10Feb-10Feb-10Feb-10Feb-10Feb-10Feb-10Feb-10Feb-10Feb-10Feb-10Feb-10Feb-10Feb-10Feb-10Feb-10Feb-10Feb-10Feb-10Feb-10Feb-10Mar-10Mar-10Mar-10Mar-10Mar-10Mar-10Mar-10Mar-10Mar-10Mar-10Mar-10Mar-10Mar-10Mar-10Mar-10Mar-10Mar-10Mar-10Mar-10Mar-10Mar-10Mar-10Mar-10Apr-10Apr-10Apr-10Apr-10Apr-10Apr-10Apr-10Apr-10Apr-10Apr-10Apr-10Apr-10Apr-10Apr-10Apr-10Apr-10Apr-10Apr-10Apr-10Apr-10Apr-10Apr-10May-10May-10May-10May-10May-10May-10May-10May-10May-10May-10May-10May-10600
700
800
900
1,000
1,100
1,200
1,300 currency/toz
Gold in dollars
Gold in euros
Source: Datastream and DECPG.

International Finance
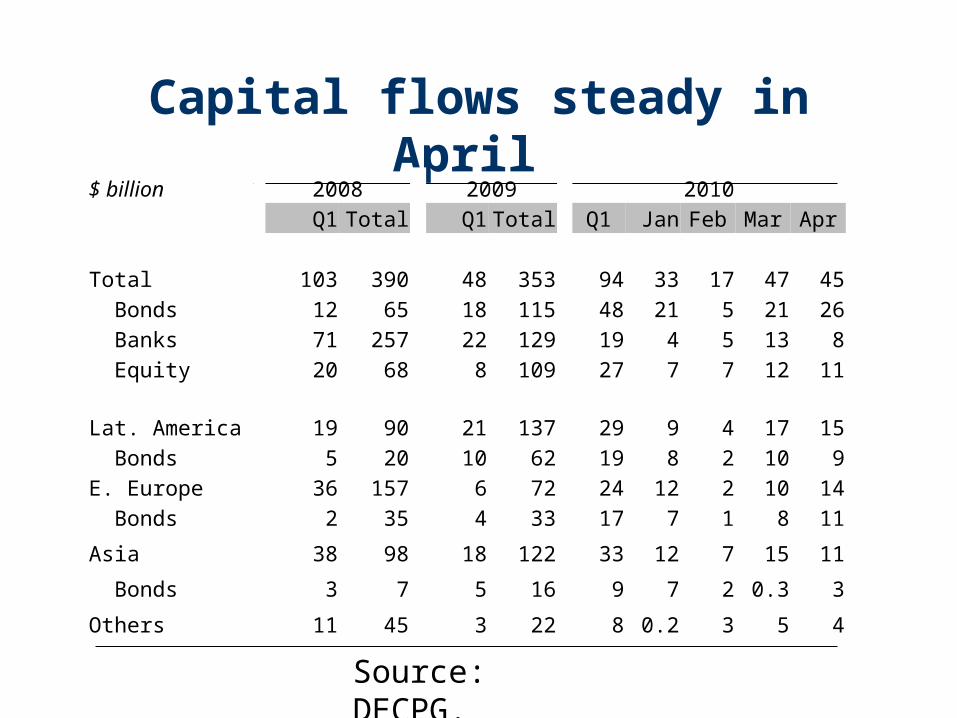
Capital flows steady in April
Source: DECPG.
$ billion 2008 2009 2010
Q1 Total Q1 Total Q1 Jan Feb Mar Apr
Total 103 390 48 353 94 33 17 47 45
Bonds 12 65 18 115 48 21 5 21 26
Banks 71 257 22 129 19 4 5 13 8
Equity 20 68 8 109 27 7 7 12 11
Lat. America 19 90 21 137 29 9 4 17 15
Bonds 5 20 10 62 19 8 2 10 9
E. Europe 36 157 6 72 24 12 2 10 14
Bonds 2 35 4 33 17 7 1 8 11
Asia 38 98 18 122 33 12 7 15 11
Bonds 3 7 5 16 9 7 2 0.3 3
Others 11 45 3 22 8 0.2 3 5 4

Relative to Lehman collapse, the magnitude of recent corrections
has been modest
Source: JP Morgan and Bloomberg.
Apr-08 Oct-08 Apr-09 Oct-09 Apr-1020,000
25,000
30,000
35,000
40,000
45,000
50,000
55,000
200
300
400
500
600
700
800
900
MSCI EM equity index [Left] EMBIG spread [Right]
Index Basis points Lehman collapse
Corrections in Jan/Feb and late-Apr/early-May

Signs of monetary tightening in some
emerging market countries
Sources: JP Morgan and DECPG staff calculations
Apr-09 Jun-09 Aug-09 Oct-09 Dec-09 Feb-10 Apr-10 Jun-104.0
4.5
5.0
5.5
6.0
6.5
7.0
3.95
4.00
4.05
4.10
4.15
4.20
4.25Emerging EuropeLatin AmericaEmerging Asia (right)
Official interest rate (GDP-weighted regional averages, percent)

Currencies and inflation

Jan-10 Feb-10 Mar-10 Apr-10 May-101.213
1.253
1.293
1.333
1.373
1.413
1.45388.50
90.00
91.50
93.00
94.50
Source: Thomson/Datastream.
yen/USD
USD/Euro (inverse)
Euro takes large loss vis-à-vis dollar on
“market failure” of EU/IMF Greek package
USD per Euro (inverse) [Left] and Yen per USD [right]

1/1/2010 2/1/2010 3/1/2010 4/1/2010 5/1/201080
85
90
95
100
105
U.S. dollar Jpn yen Czech korHun flrnt Trk lira Rus ruble
Euro- cross exchange rates show
obverse movements for C. European units
Source: Thomson/Datastream.
LCU per euro, index January 2008=100

1/1/2010 2/1/2010 3/1/2010 4/1/2010 5/1/20100.25
0.50
0.75
1.00
1.25LIBOR EURIBOR Euro-SterlingEuro-yen
Volatility in USD LIBOR not echoed in interbank rates for
other key currencies
Source: Thomson/Datastream.
LIBOR-6month rates.. US dollar, euro, sterling and yen

The External Environment for Developing Countries
May 2010The World Bank
Development EconomicsProspects Group