THE EXTENT THAT MERCHANDISE - WUR
27
THE EXTENT THAT MERCHANDISE DISPLAY INFLUENCES CONSUMER’S BUYING BEHAVIOUR Mannequin versus sales assistant Isabel Morales Belmar Wageningen 7 th of July 2016 BACHELOR OF SCIENCE MANAGEMENT AND CONSUMER STUDIES
Transcript of THE EXTENT THAT MERCHANDISE - WUR

THE EXTENT THAT MERCHANDISE
DISPLAY INFLUENCES CONSUMER’S
BUYING BEHAVIOUR
Mannequin versus sales assistant
Isabel Morales Belmar Wageningen 7th of July 2016
BACHELOR OF SCIENCE
MANAGEMENT AND CONSUMER STUDIES

THE EXTENT THAT MERCHANDISE
DISPLAY INFLUENCES CONSUMER’S
BUYING BEHAVIOUR
Isabel Elisa Maria Theresa Morales Belmar (941030583090)
BSc thesis Management and Consumer studies
Date: 7th of July 2016
Place: Wageningen
Study: Bachelor Management and Consumer studies
Thesis supervisor:
Dr. HWI van Herpen, Marketing and Consumer Behaviour Group
Thesis examiner:
Dr. HWI van Herpen
Dr. ARH Fischer
Wageningen University

ABSTRACT
The primary purpose of this thesis is to determine to what extent the outfit of mannequins and sales
assistants in a retail store have an influence on the purchase behaviour of consumers. There is not a
lot of literature available on the influence of the sales assistant’s outfit on consumers. For this reason
the author decided to combine the literature study with a natural experiment. The experiment was
conducted at a clothing store during a period of three weeks, the first week no extra emphasis was on
the outfit that would later on be worn by a mannequin in the window display and a sales assistant. The
second week a mannequin in the shop window wore the outfit, the third week every day another sales
assistant wore the outfit. The results were compared to a control store, another store of the same
brand in the same city that did not put any extra emphasis on the items of the outfit. The results of the
experiment were not significant, there was no relationship between the variables. This could be partly
due to weather circumstances, the short time span of the experiment or because the size of the
research was simply too small. The author recommends further research to perform the experiment
on a larger scale and over a longer period of time and to include the influence of weather
circumstances.

TABLE OF CONTENTS
INTRODUCTION .................................................................................................................................................................. 5
OBJECTIVES ...................................................................................................................................................................... 7
WHAT IS VISUAL MERCHANDISE –THE MESSAGE ............................................................................................. 8
EXPOSURE TO STIMULI AND EMOTIONS ........................................................................................................... 9
MANNEQUINS & WINDOW DISPLAYS AND THEIR ROLE IN VISUAL MERCHANDISE ................. 10
THE INFLUENCE OF THE SALES ASSISTANT ................................................................................................. 12
METHOD ............................................................................................................................................................................. 14
THE EXPERIMENT: .................................................................................................................................................... 15
RESULTS ............................................................................................................................................................................. 17
DISCUSSION ....................................................................................................................................................................... 22
REFERENCES .................................................................................................................................................................... 24
INTRODUCTION
When customers shop in a retail setting the visual displays evoke their mental imagery. When
one’s sensory pleasure increases by perceiving the items displayed and one imagines one’s self in
the display, it predicts their attitude towards that product (Fister, 2009).
Visual merchandise display is the presentation of selected merchandise in a defined area that
creates a mood, with intent to positively affect consumer’s approach behaviour. The importance
of visual merchandising is to make the environment as “digestible” as possible (Kerfoot et al.,
2003). Garaus (2011) defines visual merchandising as the art and science of presenting products
in the most visually appealing way, emphasizing on the communication with the customers
through images and presentations. The academic papers identify differences in the opinions on
visual merchandising as a concept, but most of them agree that it concerns specific communication
to the consumers that affects their buying behaviour (Gudonavičienė & Alijošienė, 2015). What
the consumer sees and experiences at the store is- among others- highly managed by retail design
and visual merchandising. It plays a crucial role in creating an atmosphere in which customer’s
satisfaction rate is at its highest. It is important for retail stores that customers have a positive
attitude towards their products as the store’s future depends on it. Visual merchandise tries to
communicate a particular image to consumers via various displays; merchandise displays, point
of sale displays and architectural displays (Kerkfoot, 2003). Together these displays form the
environment and atmosphere of the store, in which consumers hopefully feel comfortable enough
to browse around. Englis and Solomon (1996) called this environment ‘consumption
constellation’: "a cluster of complementary products, specific brands, and/or consumption
activities used to construct, signify, and/or perform a social role". There are two different kinds
of complementarity; the first is complementary in a product, for example an outfit of a mannequin.
The other is complementarity in the message stores send to their customers. For example Dutch
brand ‘Scotch and Soda’ is known for its vintage feeling, it uses paintings, poems, vintage clothing
items and other pieces of art as inspiration to give their store and window display an unique
feeling. They try to be different by mixing fabrics and patterns in order to create an unique
atmosphere that everyone recognizes as Scotch and Soda. This is exactly what marketers try to do
in their retail stores, form a strong context for their products, group consumption activities and
products instead of isolating them (Englis & Solomon, 1996).
Nowadays shopping is a welcome break from hectic schedules, it has transformed from a necessity
to an adventure. A good display makes people walk into the store and also helps in making them
feel like taking a look around (Jamnani & Daddikar, 2015). The results of the study of Oh and Petrie
(2012) indicate that visual perceptions of store window display influenced store entry decisions
but its influence depended on the interplay among display type, motivation, and cognitive load
effect. Impulse buying is frequently mentioned in the literature about visual merchandising, the
elements with the highest impact on impulse buying according to the literature are 1) window
displays, 2) in-store design, 3) promotional signage, 4) store layout and 5) store atmosphere
(Gudanoviciene & Alijosiene, 2015).
According to the results of the research of Jamnani and Daddikar (2015) apparel displayed on
mannequins inside the store and in shop windows have a significant impact on the purchase
decision of women. Mannequins are a component of visual merchandise that makes it possible to
display complementary items. There are three types of complementarity products according to
the paper of Englis and Solomon (1996); functional, aesthetic and sociocultural complementarity
in products. In functional complementarity products, there is a relation between the product and
the activity, so basketball clothes for when you play hoops. Aesthetic complementarity products
form a pleasant relationship with each other, the primary motivation of the consumption is the
aesthetic pleasure derived from their juxtaposition. And the third type is sociocultural
complementarity products, these are products grouped together through a sociocultural process
of association and provides the ability to communicate social messages within a particular culture
at a particular historic moment.
This last mentioned complementarity is most significant in the case of window display,
mannequins and visual merchandise in general of a retail store because as the authors themselves
explain, it gives marketers the opportunity to create new product groupings or associate products
with already existing complementary sets. It can also help consumers express social identity as
they can see which product groupings connote which identity and to enact the desired role (Englis
& Solomon, 1996). As mannequins wear clothes that can actually be purchased in the store,
customers are encouraged to visualize how the items would look on themselves. This created
realism also helps to comprehend the image of the brand or store (Fister, 2009). The outfit of a
mannequin is often carefully chosen, keeping seasons and trends in mind, new products are
introduced to the store with amazing speed, and window display transformation is usually two
times a week (Jamnani & Daddikar, 2015). At the same time the company’s policy and protocols
have to be followed to make sure the appearance coincides with other stores of the same brand in
order to keep the image of the brand worldwide identical.
The many competitors in the fashion store industry along with the fact that every store wants to
persuade customers to enter their store to spend money is a challenge each store has to deal with
(Jamnani & Daddikar, 2015). In order to persuade customers, marketers aim to present effective
displays and various marketing point-of-purchase materials (such as signage) to capture the
attention of consumers and try to reduce the influence of price on their purchase decisions
(Huddleston, 2015). Fashion retailers simply cannot rely on sole factors such as products, price,
promotion and place to win this competition among competitors (Jamnani and Daddikar, 2015).
It takes the whole package of visual merchandise to create a distinctive image among fashion
retailers. With whole package is meant: window and merchandise display, layout, coordination,
merchandise assortment, signage and lighting. Authors Jamnani and Daddikar (2015) perceive
visual merchandise as a ‘silent salesperson’, as the science and art of suggestive selling by display
and presentation.
In this study a mannequin in the shop window and a sales assistant will both wear the same
particular outfit but not at the same time. This in order to investigate which element of visual
merchandise has the most influence in the buying behaviour of consumers, namely the mannequin
or the sales assistant. Window display is a component of visual merchandise that is directly
related to an increase in sales (Sen et al., 2002). Whether this is true for this research and whether
it is also applicable for mannequins, will be examined by conducting the previously mentioned
experiment in a clothing store.
Those results will be combined with the found literature on the topic to answer the research
question:
‘To which extent influences merchandise display consumer’s buying behaviour in a
clothing store.’

The sub questions are:
‘To what extent influences the outfit of the mannequin consumer’s buying behaviour?’
‘To what extent influences the outfit worn by the sales assistant consumer’s buying
behaviour?’
The design of this paper will be as follow: first, visual merchandising as a whole will be discussed
briefly, then the research will narrow down to window displays and the role of mannequins in
that setting. Since there is not much literature available about the role and influence of sales
assistants in a retail setting, this sub question will have to be answered by a combination of found
literature and by the means of the experiment itself. Finally, the results regarding whether the
mannequin or the sales assistant do a better job in promoting the outfit will be discussed.
OBJECTIVES The aim of this study is to investigate to what extent a mannequin versus a sales assistant
influences the purchase behaviour in a retail store.
First objective is to review the current situation of scientific research on the influence of the outfit
of the mannequins and the outfit of the sales assistant to provide shopkeepers and marketers with
general information. The second objective is to obtain data about whether the items worn by the
mannequins or the sales assistant are sold more often than when those same items are just simply
displayed in the shop.
Both objectives will be answered by the combination of a literature study and an experiment.
The results can help marketers comprehend what the impact of their mannequins and sales
assistants is, perhaps create a change of focus points in the shop and can assist retailers in
designing more effective displays to keep the revenue and the overall satisfaction at the highest
level. There is not much literature available on this topic, hence this report might form a
framework for future research.

WHAT IS VISUAL MERCHANDISE –
THE MESSAGE
Stores send a message to their potential customers using visual merchandise. If the message is
decoded in a good way, which means it affects a positive psychological or behavioural outcome, it
leads to purchase (Kerfoot, 2003). This is why the message that is send by the store has to give
consumers an accurate idea about the items they can find in the store, they have to be displayed
and coordinated in a realistic manner in order to give the consumer an proper idea on how the
items should be worn. It is all related to imagined reality, one in which we vicariously “consume”
products we may or may not purchase, pretend we are other people in order to play out a
desirable role, and imagine the outcomes of events and even our own levels of future satisfaction
(Jones et al., 2006, p. 979; Holbrook & Hirschman, 1982; Shiv & Huber, 2000).
The process of reassuring customers is not easily done, visual merchandise is one of the ways
marketers can use to turn the store into a comfortable environment for customers. Visual
merchandise is a broad term and in this research the emphasis will be on how mannequins and
sales assistants help to influence the purchase intention of customers.
Numerous methods have been used in the art of merchandise display to communicate products
and brand to potential customers. There are so many different methods because the right
merchandise means the right target customers; a supermarket uses another display than a
clothing store and in each clothing store a vast number of different displays are used (Garaus,
2011). This not only includes instore interior such as mannequins, signage, layout, props and
displays but also exterior such as window display, facades and retail premises (Metha & Chugan,
2013). The person(s) who are responsible for the interior and exterior displays are visual
merchandisers. This job has become more demanding since there is a lot of competition and they
are challenged to making sales (Seock & Lee, 2013). Thus the task of visual merchandising has to
cover various aspects, that is why a lot of shopkeepers and retailers hire or have an in-house visual
merchandiser who designs and/or creates the image and interior display of their store. They
provide valuable information to consumers about the product category, its features and the
general information such as trends and innovations. Clothing retailers often show their latest
trends and fashionable lines of clothing in their window. The result is that consumers who wish
to keep their knowledge about fashion up to date can use that specific part of visual merchandising
(window display) as a retailer-based source of information (Sen, S., et al. ,2002).
When visual merchandising is doing its job correctly, the visual display of the store and of the
product will speak for itself. The customer can already tell by seeing for example the colour of the
packaging of the product which brand it is. Think about the signature red of Coca-Cola or Tiffany’s
blue box. It is not a coincidence that these brands stick to their signature product styles, according
to Kerfoot (2003) merchandise colours, among presentation style, awareness of fixtures, path
finding, sensory qualities of materials and lighting are most strongly linked to purchase intention.
It is in the retail store’s best interest that consumers picture themselves in so many items possible,
that is where the unity in variety principle comes in. It means that complementary products may
be evaluated in terms of their overall aesthetic, when they are displayed in an ensemble. It looks
as if the items portrayed together actually belong together because of the visual connection
between the products.
As mentioned a couple of times before, the difference between the two ways complementarity can
be used is very important; the first complements the image of the store and makes sure the
environment and atmosphere all match the image the store tries to send. The second is to
complement products in order that consumers know how the products can be used. The result of
making complementary sets is that the approach response of the consumer increases while the
perceived risk associated with the entire outfit is reduced. The perceived risk lays in the fact
consumers are not entirely certain whether the items will look good on themselves and/or if they
even match. As consumers can now see the items on the mannequin it enables them to visualize
the merchandise in a three-dimensional space, providing information about the fit and look of the
merchandise on a physical body (Oh & Petrie, 2012; Sen, Block, & Chandran, 2002).
EXPOSURE TO STIMULI AND EMOTIONS
The study of Sherman et al., (1997) about the effect of store environment on consumer emotions
concludes that retailers should pay attention to consumer’s in-store emotional state (pleasure and
arousal), because the emotions of consumers are important factors in buyer behaviour. Social
factors and the design of the store had a positive impact on pleasure, and ambience positively
affected arousal. Pleasure had a positive influence on money spent and liking the store, and
arousal had a positive impact on money spent in the store, time spent in the store, and the number
of items purchased in the store. According to the findings of Hefer and Cant (2013), visual
merchandise displays have an effect on consumer emotion, which means that at times, consumers
will buy items in a store without consciously thinking about it because their mood influences their
buying behaviour.
Since one purchase does not guarantee the continuity of the store, consumers have to be loyal to
the brand and enter the store over and over again. One of the challenges of visual merchandise is
to prevent that consumers get bored. When consumers are repeatedly exposed to the same
stimuli, they get disaffected with the stimuli and the benefits of positive affect decrease or even
completely vanish (Parsons, 2011). This is a genuine concern for the manager since a lot of budget
is invested in designing the atmosphere. The solution is change, move everything in the store
around to stimulate new incentives. Positive change according to Parsons (2011) consists out of
moving the stimuli to levels that are more likely to induce positive effect. Small changes have a
large effect, for example folding clothes in a different way leads to a different reaction of
consumers, see picture 1. Or a change of music played in the background, dimming the lights or
introducing another scent are small changes in stimuli but, if done right, have a significant effect
(Parsons, 2011).

Picture 1 (Jack and Jones folding protocols of summer 2016)
MANNEQUINS & WINDOW DISPLAYS AND THEIR ROLE IN VISUAL MERCHANDISE
There are many ways to portray clothes in a fashion store, brands use this strategic role of visual
merchandising to communicate the brand and its offer to similar target customers. They try to
differentiate merchandise and their retail concept from competitors in the same market (Mehta &
Chugan, 2013). The way products are displayed and promoted have an enormous influence on
customers and the revenue of the store (Hefer & Cant, 2013).
Window displays give shopkeepers the opportunity to portray a certain image to potential future
customers who walk by their shop. It almost works like business cards: there is only a short
moment to persuade customers to enter the store. As visual contact is very important for
consumers, merchandisers employ creative, theatrical and story-telling ways to display products.
It enables retailers to depict a certain image to potential consumers with merchandise of their
own shelves, that showcases elements of their design aesthetic, taste or brand personality, and
create and maintain an overall store image for targeted consumer segments (Oh & Petrie, 2012).
Successful implementation of such artistic window displays can grab shoppers’ attention, provoke
their curiosity and interest, effectively communicate store/brand image, and further draw them
into stores to purchase (Oh & Petrie, 2012). According to Jamnani and Daddikar (2015), an
effective window display will attract the passer-by and convert them into browsers and spenders,
this process „conversion’’ entails how many consumers that enter the store actually purchase
something.
From the window to the wall
Many potential influences can appear at the front of the store: building signs, neon writing, display
windows, merchandise presentation, and so on. The outside resembles the inside in the minds of
consumers, that is why the promotional campaigns that are launched are such an important
medium of communication to the customers, you can tell this by the increase in spending of retail
companies on both the environment and the fixtures and stylish fittings, emphatic lighting and
digital signage, in order to find the perfect combination for the best shopping experience for the
customer on the one hand and of course for the most profitable experience for the retailer
himself (Jamnani & Daddikar, 2015). The few studies that consider the exterior generally address
the effects of window displays, which are designed to help create and maintain an overall store
image. In a study conducted among clothing retailers, Sen et al. (2002) demonstrate that the
decision to enter a store relates to consumers’ acquisition of store-related information (e.g.,
image) from the window displays. The outside of the store thus appears to affect store image and
consumer decisions (Cornelis, Natter Faure 2010).
Not just creativity
Kernsom & Sahachaisaeree (2010) say window displays are designed in accordance with
corporate strategies, it involves two disciplines: where science meets art. The design follows
principles of compositional setting that embraces unity, harmony, repetition, balance, rhythm,
contrast and so on. The elements of art and design, such as colour, lighting, material, props, size,
textual style, mannequins, etc., are to be well composed and blended in effective window display
design. When the store and window are ‘dressed’, colour is a salient factor. There are two tones
of colour: warm and cool, these tones are used for example for the background in order to make
the product stand out more.
Another important factor is lighting, lights make consumers focus on the specific parts the visual
merchandiser wants them to see, and hides components he does not want them to see. Good
lighting makes consumers feel comfortable, interested and attracted to the retail environment.
Pleasant surroundings help consumers to be loyal to a store, and even goes a step further; the
intensity of the lighting used in the window display addresses various perceptual moods and
could affect consumer’s perception either favourably or unfavourably towards the products on
display (Kernsom & Sahachaisaeree, 2010. A good example of a store that draws the attention of
customers in such a way that it is even known for its window displays, is Bergdorf Goodman in
New York. Tourists often stop to take pictures of the spectacular displays, especially around the
holiday season (Lucca, 2014). This is exactly what marketers aim for; seek consumer’s attention
beyond the target segments to boost traffic flow and interest.
Mannequins provide information that helps consumers to understand products, in this case
clothes, on a cognitive level and adds to their social acceptability according to Park et al (2014).
But there are various types of mannequins; torso only, legs only, with or without a head, made of
different materials etc. For example, according to the research of Lindström et al., (2015), the
presence of a humanized head enhances purchase intention for the merchandise displayed on that
mannequin. Research has shown that consumers prefer a realistic human model over a
mannequin or laid-out flat display to see the silhouette of the garment and how the garment fits
the body (Then & DeLong, 1999). Fister (2009) pointed out that customers have a higher aesthetic
response and approach and lower perceived risk to clothing displayed on a full size mannequin
than to a flat display and often buy the entire outfit when it is portrayed on a full size mannequin.
Perhaps this is due to visualization of the object, visual information is preferred over textual as it
is perceived as more ‘real’. If customers like the outfit of the mannequin, it does not mean purchase
will take place, however according to Kerfoot (2003) it does make it four times more likely. Also,
he explains when the display is congruent with the customers expected image of himself, the store
or the brand and the customer is happy about this display, the conclusions he makes will be
positive.
Hypothesis about the influence of the mannequin on consumers’ buying behaviour If the mannequin wears the outfit, then there will be an increase in sales figures of the items of
that particular outfit compared to when there is no extra emphasis on the items.
THE INFLUENCE OF THE SALES ASSISTANT
Besides the silent salesperson being present in the store, there are also actual vivid employees
who try to persuade customers and make them feel comfortable (Van der Merwe et al., 2008).
According to Sharma (2001) the sales assistant plays a critical role in establishing the relationship
between the consumer and the retailer. The sales assistant is the first vivid thing consumers
stumble upon when they enter a store. Ambady et al. (2006) says consumers form their perception
of the sales assistant in the early stages of their interaction. Which means that the first impression
is very important and an indicator how the rest of the visit will turn out. There is a lot of literature
available on how salespeople influence consumers, how they try to persuade them to buy things
people often do not need. However, little is known about if the outfit of the sales assistant in any
way influences the customer to purchase the items he or she is wearing. Of course this is not
applicable to when the sales assistant is obliged to wear a standard uniform, luckily this is not the
case in this research.
According to Van der Merwe et al. (2008) sales assistants have to exceed expectations by creating
interesting and fun social interactions with customers, this personal touch is very important. They
also have to appear to be trustworthy and actively involved in the entire process. When the
consumer is satisfied for example because he or she has had a nice chat with the sales assistant, it
evokes particular emotions in the consumers. This feeling will determine if they had a good time
while shopping in the store and sometimes, whether they will purchase something (Jones, 1999).
Arnold et al. (2005) talks about interpersonal and non-interpersonal factors that are associated
with shopping experiences. Interpersonal factors refer to situations where the shopping
experience is considered as pleasant thanks to the salesperson who provides the service. Non
interpersonal factors are situations where the pleasant shopping experience is obtained by
product procurement or value attainment, so not the way how the consumer obtains the product,
but the product itself makes the shopping experience a delightful experience. The research of
Arnold et al. (2005) shows how important salespersons are, the research could imply that
sometimes consumers will experience their shopping trip as positive only due to the encounter
they had with the salesperson.
But there are also negative consequences possible due to the encounter with the sales person,
according to Sharma and Stafford (2000) salespeople should not be too easily available since they
will not have much luck persuading customers according to the schema-triggered affect theory.
The theory says that customers already have made up their mind automatically, because of the
presence of category-based expected cues. They also should not be too intrusive for example by
selling something before the consumer has shown interest, otherwise the shopping experience
and purchase decision will be influenced in a negative way (Jones, 1999).

What makes customers buy the outfit of the sales assistant?
What makes people like or trust other people, is explained by Cialdini (2001) with the term social
proof. Social proof means that people will follow the lead of similar others. That is why retailers
often seek sales persons who are congruent with their target customers. Retailers are not satisfied
enough with sales assistants who are knowledgeable and friendly, they often hire sales persons
who resemble their target group customers, they have to have a strong effect toward their
customers. So, when consumers realize they have something in common with the sales assistant,
they are approved. Sometimes a person unwittingly imitates the behaviour of another person, this
is nonconscious behavioural mimicry (Lakin & Chartrand, 2003). It could be that in this case the
outfit of the sales assistant will be copied by customers. The outfit of the sales assistant catches
the eye frequently since the sales person is on the move. The sales assistant helps customers
finding the right size, helps people in the changing room and operates the cash register. The
customer is confronted with the sales assistant numerous times. The mere exposure effect could
have an influence on the customers since the outfit of the sales assistant is a repeated,
unreinforced exposure which can enhance the attitude towards a stimulus. The danger is that a
customer can also get bored with the stimulus which results in a negative attitude towards the
stimulus, in this case the outfit (Bornstein & D’Agostino, 1992). When sales assistants have a
positive effect on customers, counter argumentation reduces and persuasion enhances, when it is
the other way around they do not have a positive effect or even a negative effect, the counter
argumentation increases and persuasion reduces (Sharma & Levy, 2003).
Hypothesis about the influence of the sales assistant on consumers’ buying behaviour If the sales assistant wears the outfit, then there will be an increase in sales figures of the items of
that particular outfit compared to when there is no extra emphasis on the items or when the
mannequin wears the outfit.

METHOD
The following experiment was conducted to find out whether the mannequin or the sales assistant
was best in promoting an outfit: one week a mannequin in the shop window wore a specific outfit
(jeans, shirt and jacket) and the number of sold items were tracked. The following week, the
mannequin wore another outfit and did no longer take part in the experiment. The previously
worn outfit by the mannequin was then worn by a sales assistant during the entire week. The
questions we wanted to answer were: will there be an increased level of purchase of those specific
items; is there more attention for the mannequin in the window because of its prime position or
does the sales assistant have an advantage because he is a real and approachable person that is
moving around in the store? The experiment to find out whether the outfit will have a bigger
impact when it is worn by the mannequin in the window display or when it is worn by a sales
assistant, was conducted in the Jack and Jones store (referred to as M2) in Maastricht,
Netherlands.
Background information about M2:
When changes instore (including shop window) are made, every Jack and Jones shop manager
gets e-mailed a ‘TO DO’. This TO DO covers a period of 10 weeks on average, this depends on sales
figures, new collection, innovation, season and stock. In the TO DO every area of the sub brands
of Jack and Jones (Core, Vintage, Originals, Premium and TECH) will be discussed. The
headquarters wants every Jack and Jones store around the world to portray the same image and
feeling. With the help of pictures of tables, walls and mannequins shop managers know where
they can place every item, these pictures are more suggested guidelines than obligated rules. Shop
managers can fill in the racks and put popular and successful items on an A location.
The Jack and Jones store has 16 full-size mannequins for all the sub brand for Originals, Core and
Vintage and two full-size mannequins for Premium. Since Jack and Jones is known for its jeans, it
has 18 pairs of legs (so only the bottom part of the mannequin) for the jeans area. There are also
6 mannequins with only a torso. The style guide is part of the TO DO, it is an overview of
mannequins styled according to the trends of today, and whether the cardigan has to be worn
open or closed, how the socks should be worn ; rolled up or long or no socks at all, whether to tie
the shoelaces or not etc. It depends on the TO DO where the mannequins are positioned, what
they wear can be determined by the staff itself as long as they respect the guide lines of the style
guide. According to Jack and Jones, a full-size mannequin will inspire a customer to purchase a
complete outfit whereas only a torso will focus the customer on one clothing item and perhaps an
accessory. The number of times the outfit of the mannequin changes depends on several factors
such as how many items are in stock, disappointing sales figures, new collection or renewal. On
average, the outfit of the mannequin in the window display will be changed every two weeks.
Instore this depends on the location; is the mannequin located next to a table and new articles will
be displayed on that table, the mannequin will have to be altered right away.
Sales assistants of M2:
There are both male and female employees at M2, since Jack and Jones is a menswear only brand,
women do not have to wear clothes of Jack and Jones.
Men however are obliged to wear clothes from the present available collection, they can choose
to wear whatever pleases them. Beginning this year, the management wanted every male
employee to wear the same sub brand at the same time, for example; every Saturday every
employee had to wear an outfit of CORE and Sunday everyone had to wear an outfit of Premium.
This in the hope brands would stand out more and lose their negative connotation, for example
CORE is associated with high school boys and not popular with an older target group. This
‘experiment’ lasted not too long, one reason is the employees did not like this protocol and the
other is that the manager did not see a difference in sales. According to the assistant manager,
there was indeed more attention to the less popular brands and plans to introduce the experiment
for a second time in the future.
The experiment There are three Jack and Jones stores in Maastricht, the sales figures of the same outfit of one other
store (referred to as M3) will be compared to the store where the experiment was conducted, only
with one other store since the third store (referred to as M1) is a very small store that does not
have the items of the outfit of the experiment. The sales figures of M3 were used for comparison
and thus act as a control group, as there was no extra emphasis on the outfit in the other store.
Because the M3 store is located on a more advantageous location in the city centre, there are more
people casually visiting the store which results in a higher conversion. On an average Saturday,
M2 will have 300 visitors of which 100 are paying customers. At M3, this is more than double.
Luckily, the headquarters is also aware of this. That is why the target M3 has to reach every day is
also almost double the target of M2.
Design of the study and selection of participants
The experiment was a natural experiment with a three-group design in a timespan of three weeks.
Consumers were not aware of the fact they were part of an experiment and were not informed
why the sales assistant and the mannequin wore the particular outfit for a specific reason.
The three groups of the group-design are:
Group 1: the control week
Group 2: the week the mannequin wore the outfit
Group 3: the week the sales assistants wore the outfit
M3 served as a control store since no extra emphasis was on any of the items of the outfit.
Data collection
The data collected for this experiment were obtained by the sales figures of the specific items of
the outfit. Every sold item of the outfit was tracked and at the end of the week added up. This
counts for both M2 and M3.
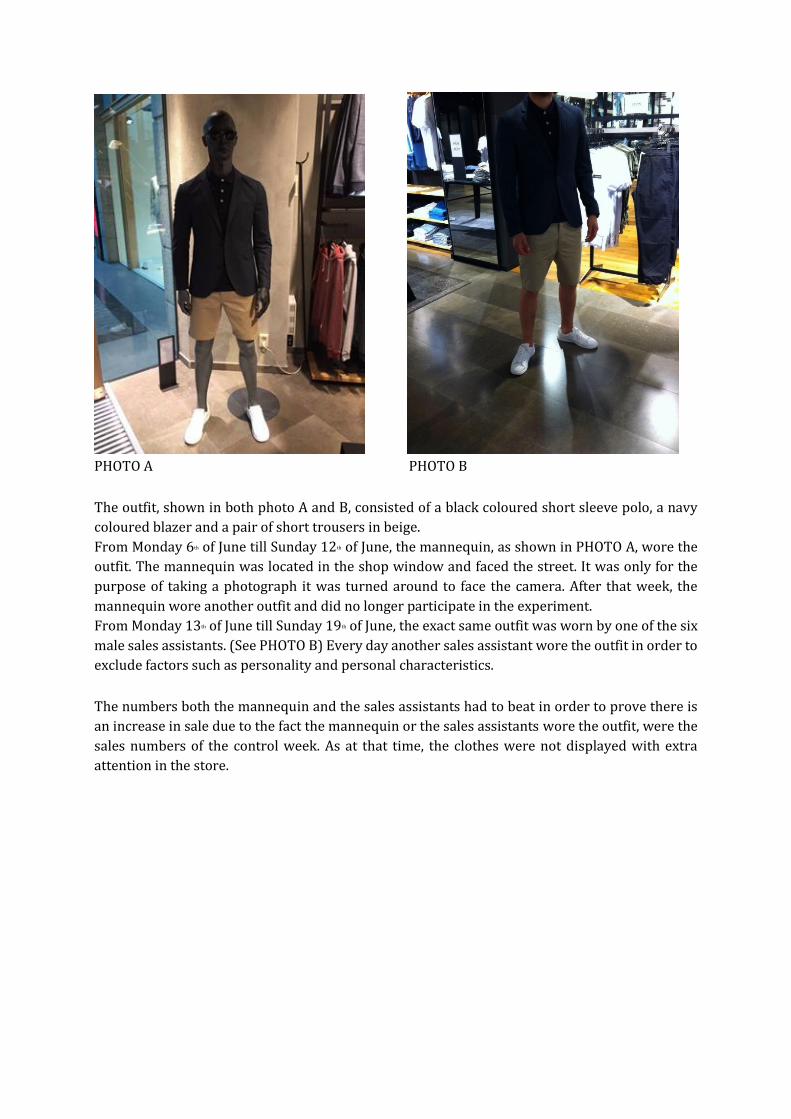
PHOTO A PHOTO B
The outfit, shown in both photo A and B, consisted of a black coloured short sleeve polo, a navy
coloured blazer and a pair of short trousers in beige. From Monday 6th of June till Sunday 12th of June, the mannequin, as shown in PHOTO A, wore the
outfit. The mannequin was located in the shop window and faced the street. It was only for the
purpose of taking a photograph it was turned around to face the camera. After that week, the
mannequin wore another outfit and did no longer participate in the experiment.
From Monday 13th of June till Sunday 19th of June, the exact same outfit was worn by one of the six
male sales assistants. (See PHOTO B) Every day another sales assistant wore the outfit in order to
exclude factors such as personality and personal characteristics.
The numbers both the mannequin and the sales assistants had to beat in order to prove there is
an increase in sale due to the fact the mannequin or the sales assistants wore the outfit, were the
sales numbers of the control week. As at that time, the clothes were not displayed with extra
attention in the store.

RESULTS
Sales figures items of the outfit per store per week
M2
Week Polo Blazer Shorts
1 23 3 4
2 mannequin 28 1 5
3 sales assistant 32 1 5
Table 1
Control store (M3)
Week Polo Blazer Shorts
1 30 2 6
2 mannequin 31 1 7
3 sales assistant 55 1 1
Table 1.1
The amount of sold polo’s increased over the three weeks in M2 and in the control store as well.
The number of sold shorts increased in M2 very little and stagnated in the third week, in the
control store the shorts increased very little during the second week, but declined in the third
week.
The market share of the blazer in both M2 and the control store were not substantial enough to
further include the blazer in the experiment.
Similar alternatives To see whether the sales figures of the polo and shorts were substantial or not, they were
compared to similar alternatives. For example, there were 44 similar items available at M2 for the
polo and 51 items at the control store (M3).
Similar alternatives for: M2 M3
Polo 44 51
Shorts 22 21
Table 2
The offer of top merchandise (clothes above the belt) of the control store is broader than the offer
of M2. The offer of shorts is approximately the same.

Number of customers per week per store Week M2 M3
1 367 443
2 383 459
3 385 461
Table 3
The amount of buying customers increased over the three weeks, this could explain the increase
in sold polo’s for both stores. The information about the amount of customers of the control store
(M3), was not available, so these numbers were based on an assumption based on the calculation
of the revenue of the month June. The revenue of the control store of that month was 133 000
euro, since the revenue is 15 per cent higher than the one of M2, it was assumed that the number
of customers were also 15 per cent higher. We can assume the basket size (the amount of money
one customer spends on average) was the same at M2 and the control store, this was around 60
to 70 euro (we take 65 euro as convenience). So if we divide the difference in revenue of M2 and
M3 by the basket size we have the amount of extra customers during one month.
20 000 euro/65= 307
Which makes 76 customers per week on average more than M2.
Market share of the product in comparison to the amount of customers
Polo In order to examine whether the market share of polo’s changed in relative to the amount of
customers, a Chi squared test was conducted.
M2
Week Yes No
1 23 344 367
2 28 355 383
3 32 353 385
Table 4
X2 = 1.159
p= 0.560
Control store (M3)
Week Yes No
1 30 413 443
2 31 428 459
3 55 406 461
Table 4.1
X2 = 10.464
p= 0.005
At M2, the market share of sold polo’s increased and the amount of customers increased as well (the
amount of customers declined by two persons in the third week). The results of the Chi squared were

not significant which means there was no relationship between the market share of the polo and the
amount of customers.
At the control store, the market share of polo’s increased while the amount of customers decreased.
The relationship between these variables were, according to the Chi squared test, significant.
Shorts In order to examine whether the market share of shorts changed in relative to the amount of
customers, a Chi squared test was conducted.
M2
Week Yes No
1 4 363 367
2 5 378 383
3 2 383 385
Table 4.2
X2= 1.318
p= 0.517
Control store (M3)
Week Yes No
1 6 437 443
2 7 452 459
3 1 460 461
Table 4.3
X2= 4.563
p= 0.102
At M2, the market share of sold shorts decreased while the number of customers increased. Even
though the store had more customers, the market share of the shorts decreased. According to the
results of the Chi squared, my conclusion was that there was no relationship between the market share
of the shorts and the amount of customers.
At the control store, the market share of sold shorts decreased while the number of customers
increased. There was no relationship between these two variables according to the Chi squared test.

Market share of the product compared to possible alternatives
Polo In the tables below the amount of sold polo’s were compared to how many similar items in total
were sold during that week (also in percentages) with the help of a Chi squared.
M2
Week Yes No
1 23 12.16% 166 189
2 28 13.72% 176 204
3 32 14.67% 186 218
Table 4.4
X2= 0.548
p= 0.760
Control store (M3)
Week Yes No
1 30 8.69% 315 345
2 31 8.56% 331 204
3 55 18.9% 235 218
Table 4.5
X2= 21.378
p= 0.00002279
At M2, the market share of polo’s increased over the three weeks and the market share of possible
alternatives increased as well. My conclusion is that there was no relationship between these two
variables since the Chi squared test was not significant.
At the control store, the market share of sold polo’s increased while the amount of customers
decreased. There was a significant relationship between these two variables.
Shorts In the tables below the amount of sold shorts were compared to how many similar items in total
were sold during that week (also in percentages) with the help of a Chi squared.
M2
Week Yes No
1 4 2% 195 189
2 5 52.38% 205 210
3 2 0.93% 212 214
Table 4.6
X2 = 1.379
p= 0.50182692
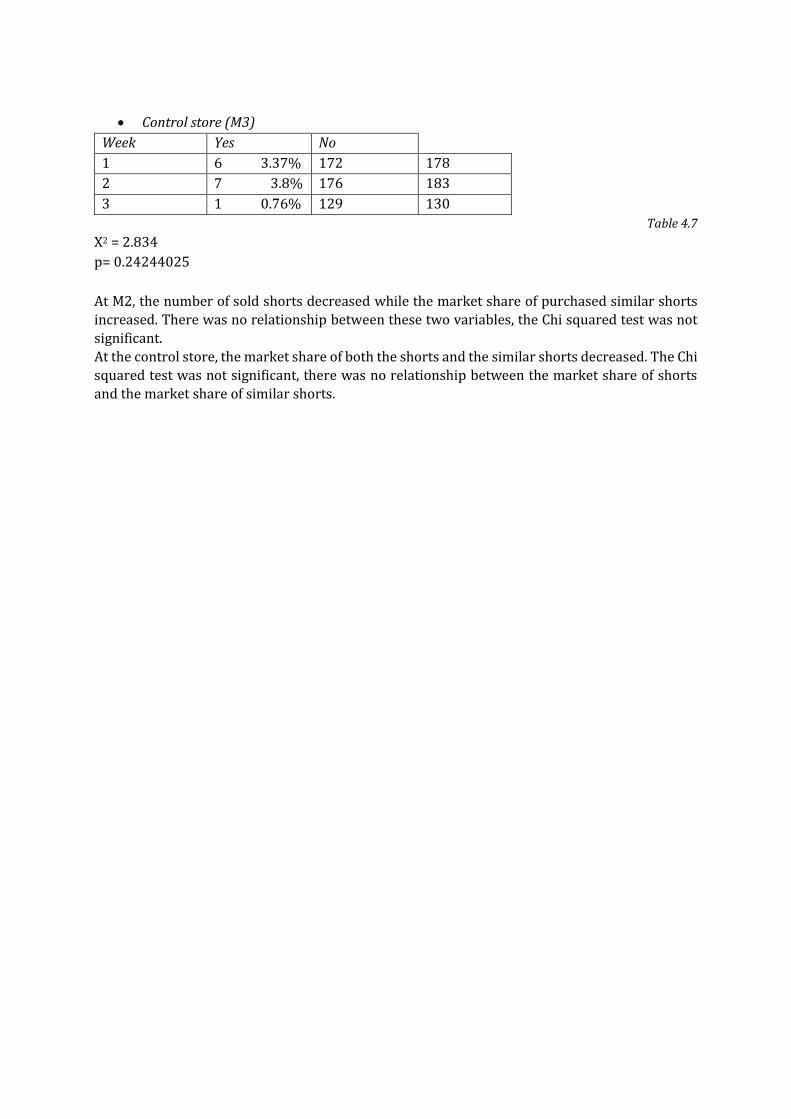
Control store (M3)
Week Yes No
1 6 3.37% 172 178
2 7 3.8% 176 183
3 1 0.76% 129 130
Table 4.7
X2 = 2.834
p= 0.24244025
At M2, the number of sold shorts decreased while the market share of purchased similar shorts
increased. There was no relationship between these two variables, the Chi squared test was not
significant.
At the control store, the market share of both the shorts and the similar shorts decreased. The Chi
squared test was not significant, there was no relationship between the market share of shorts
and the market share of similar shorts.
DISCUSSION AND CONCLUSION
The aim of this study was to analyse the many ways visual merchandise influenced the consumers
and in particular how the outfit of the mannequin and sales assistant influenced the purchase
behaviour of consumers. This paper explored, in a clothing retail context, the relationship
between the outfit of a mannequin and the purchase behaviour of consumers and the relationship
between the outfit of a sales assistant and the purchase behaviour of consumers. The literature
formed the foundation of the paper and enlightened the effect of displays, store image and
emotions etc. on consumers when deciding to enter a store and make a purchase decision. The
main research question that motivated this research was: ‘To what extent influences visual
merchandise consumer’s buying decision’. This research question was answered by the means of
a literature study and an experiment.
Conclusions:
There was no relationship between the market share of sold polo’s and the three weeks
the experiment was conducted.
There was no relationship between the market share of sold shorts and the three weeks
the experiment was conducted.
This meant that the answers to the sub questions: ‘To what extent influences the outfit of the
mannequin consumer’s buying behaviour’ and ‘To what extent influences the outfit worn by the
sales assistant consumer’s buying behaviour’ were; the outfit of the mannequin nor the outfit of
the sales assistant had an influence on the purchase decision of consumers.
This also implied that both hypothesis were rejected.
Remarkable was that at the control store (M3), the relationship between the market share of
polo’s and the amount of customers and the relationship between the polo’s and the amount of
sold similar t-shirts did have a significance relationship. This was remarkable because M3 served
as a control store only and there were no alterations whatsoever made during the time of the
experiment.
There were some limitations to this paper. First, one could say the amount of customers of M3
was just an estimation based on their revenue instead of the actual number of customers but since
we did know the market share of the items of the outfit in relationship to the total amount of sold
similar items, a pattern was revealed, thus the amount of customers should be more or less
correct. Further, the manager of M2 and the manager of the control store (M3) mentioned that the
weather could have influenced the sales, which could explain the decrease in sales of summer
items. Further research could investigate the relationship between temperature per day and the
market share of sold items over a longer period of time. It is recommended to perform this
experiment on a larger scale and over a longer period of time in order to properly generalize the
results, perhaps using the entire shop window instead of placing only one mannequin on that
location.
Aside from the results, the sales assistants were also casually questioned about their opinion
about the outfit in question. They wore the outfit during the third week and did not like the entire
outfit; the blazer was too formal and the shorts too short. According to them, the outfit did not
match the target group of customers. It could be possible that their negative emotions were

transferred onto the customers. Future research could perform a pilot study before the actual
experiment to confirm whether the target group is interested in the outfit. Future researchers
could also include more than one outfit in the experiment, in order not to make the entire research
depend on only one outfit. In this research, every day another sales assistant wore the outfit in
order to exclude personality in the results. Future research could use different sales assistants
with multiple personalities in order to find out which personality promotes the outfit best. For
example, a sales assistant with a very enthusiastic character wears an outfit for four weeks, later
on a sales assistant with a very shy and quiet personality wears the same outfit for four weeks.
When using such different personalities, researchers might find very diverse differences.
My personal experience as weekend sales assistant learned me how consumers use their
environment as an inspiration including the advice and outfit of a sales assistant. People always
want to try on the pair of trousers their neighbour in the fitting room was just trying on. Mothers
who are enthusiastically helping their children to find the perfect outfit, often ask the sales
assistants for advice because ‘hearing it from you is different than when I tell him’. According to
my personal observation, sales assistants and mannequins do have an influence on customers’
purchase decision. I also believe that clothing stores who oblige their employees to wear a
uniform, should revise their approach since their hired staff are walking visual merchandise
elements.

References
Ambday, N, Krabbenhoft, MA & Hogan, D. 2006. The 30-sec sale: using thin-slice judgments to
evaluate sales effectiveness. Journal of Consumer Psychology 16(1):4-13.
Arnold, M. J., Reynolds, K. E., Ponder, N., & Lueg, J. E. (2005). Customer delight in a retail context:
investigating delightful and terrible shopping experiences. Journal of Business Research, 58(8),
1132-1145.
Arora, R. (1982). Validation of an SOR model for situation, enduring, and response components
of involvement. Journal of Marketing Research, 505-516.
Bashir, N. Y., & Rule, N. O. (2014). Shopping under the Influence: Nonverbal Appearance‐Based
Communicator Cues Affect Consumer Judgments. Psychology & Marketing, 31(7), 539-548.
Bornstein, R. F., & D'Agostino, P. R. (1992). Stimulus recognition and the mere exposure
effect. Journal of personality and social psychology, 63(4), 545.
Buckley, P. G. (1991). An SOR Model of the Purchase of an Item in a Store.NA-Advances in
Consumer Research Volume 18.
Cialdini, R. B. (2001). Harnessing the science of persuasion. Harvard Business Review, 79(9), 72-
81.
Cornelius, B., Natter, M., & Faure, C. (2010). How storefront displays influence retail store image.
Journal of Retailing and Consumer Services, 17(2), 143-151.
Dittmar, H., Halliwell, E., & Ive, S. (2006). Does Barbie make girls want to be thin? The effect of
experimental exposure to images of dolls on the body image of 5-to 8-year-old
girls. Developmental psychology, 42(2), 283.
Ebster, C., & Garaus, M. (2011). Store Design and Visual Merchandising. Creating Store Space
That Encourages Buying. Business Expert Press. ISBN-13: 978-1-60649-094-5; DOI 10.4128
9781606490952.
Englis, B. G., & Solomon, M. R. (1996). Using consumption constellations to develop integrated
communications strategies. Journal of Business Research, 37(3), 183-191.
Fister, S. E. (2009). Consumers’ Shopping Value and their Responses to Visual Merchandise
Displays in an In-store Retail Setting. Master thesis,
Geetha Mohan Bharadhwaj Sivakumaran Piyush Sharma , (2013),"Impact of store environment
on impulse buying behavior", European Journal of Marketing, Vol. 47 Iss 10 pp. 1711 - 1732
Gudonavičienė, R., & Alijošienė, S. (2015). Visual Merchandising Impact on Impulse Buying
Behaviour. Procedia-Social and Behavioral Sciences, 213, 635-640.

Hefer, Y., & Cant, M. C. (2013). Visual Merchandising Displays' Effect On Consumers: A Valuable
Asset Or An Unnecessary Burden For Apparel Retailers. The International Business & Economics
Research Journal (Online),12(10), 1217.
Holbrook MB, Hirschman EC. (1982), ‘The experiential aspects of consumption: consumer
fantasies, feelings, and fun.’ Journal of Consumer Research, (9):132–40
Huddleston, P., Behe, B. K., Minahan, S., & Fernandez, R. T. (2015). Seeking attention: an eye
tracking study of in-store merchandise displays. International Journal of Retail & Distribution
Management, 43(6), 561-574.
Jamnani, M. A., & Daddikar, M. P. (2015). Influence of visual merchandising on customer buying
decision- a study of Inmark retail store. Asia Pacific Journal of Research Vol: I. Issue XXX.
Jones, M. A., Reynolds, K. E., & Arnold, M. J. (2006). Hedonic and utilitarian shopping value:
Investigating differential effects on retail outcomes. Journal of Business Research, 59(9), 974-981.
Jones, MA. 1999. Entertaining shopping experiences: an exploratory investigation. Journal of
Retailing and Consumer Services 6(3):129–139.
Kerfoot, S ., Davies, B., & Ward, P. (2003). Visual merchandising and the creation of discernible
retail brands. International Journal of Retail & Distribution Management, 31(3), 143-152
Kernsom, T., & Sahachaisaeree, N. (2010). Determinant of design elements and compositional
settings of window display on the corporate strategic merchandising of large scale department
store: a case of central world department store. Procedia-Social and Behavioral Sciences, 5, 1351-
1356.
Kim, H. (2008). The impact of body image self-discrepancy on body dissatisfaction, fashion
involvement, concerns with fit and size of garments, and loyalty intentions in online apparel
shopping. ProQuest.
Kuei-Feng Chang and Hao-Wei Yang, 2011. An Effective Approach to Construct Value-Based
Decision Model for Positioning Strategy. Information Technology Journal, 10: 1402-1408.
Lakin, J. L., & Chartrand, T. L. (2003). Using nonconscious behavioral mimicry to create affiliation
and rapport. Psychological science, 14(4), 334-339.
Lindström, A., Berg, H., Nordfält, J., Roggeveen, A. L., & Grewal, D. (2016). Does the presence of a
mannequin head change shopping behavior? Journal of Business Research, 69(2), 517-524.
Lucca, V. (2014). Scatter My Ashes at Bergdorf's.
Mehta, M.P., & Chugan, P.K. (2013). The Impact of Visual Merchandising on Impulse Buying
Behaviour of Consumer: A Case from Central Mall of Ahmedabad India. Universal Journal of
Management 1, 76-82; DOI: 10.13189/ujm.2013.010206

Oh, H., & Petrie, J. (2012). How do storefront window displays influence entering decisions of
clothing stores?. Journal of Retailing and Consumer Services, 19(1), 27-35.
Oregon state university, USA.
Park, H. H., Jeon, J. O., & Sullivan, P. (2015). How does visual merchandising in fashion retail
stores affect consumers’ brand attitude and purchase intention?. The International Review of
Retail, Distribution and Consumer Research, 25(1), 87-104.
Parsons, A. G. (2011). Atmosphere in fashion stores: do you need to change? .Journal of Fashion
Marketing and Management: An International Journal, 15(4), 428-445.
Rosita, N. H., & Yulianti, I. (2015). Retail Environment and Merchandising on the Evaluation of
Impulse Buying. Journal UMP Social Sciences and Technology Management Vol, 3(1).
Roy, A., & Tai, S. T. (2003). Store environment and shopping behavior: the role of imagery
elaboration and shopping orientation. Journal of International Consumer Marketing, 15(3), 71-99.
S. Madhavi and T. S. Leelavati (2013) Impact of visual merchandising on consumer behaviour
towards women apparel, International Journal of Management Research & Business Strategy, Vol.
2, No. 4, October 2013 ISSN 2319-345X
Sen, S., Block, L. G., & Chandran, S. (2002). Window displays and consumer shopping decisions.
Journal of Retailing and Consumer services, 9(5), 277-290.
Seock, Y. K., & Lee, Y. E. (2013). Understanding the Importance of Visual Merchandising on Store
Image and Shopper Behaviors in Home Furnishings Retail Setting. European Journal of Business
and Management, 5(4), 174-187.
Sharma, A. 2001. Consumer decision-making, salespeople’s adaptive selling and retail
performance. Journal of Business Research 54(2):125-129.
Sharma, A., & Levy, M. (2003). Salespeople's affect toward customers: Why should it be
important for retailers?. Journal of Business Research, 56(7), 523-528.
Sherman, E., Mathur, A., & Smith, R. B. (1997). Store environment and consumer purchase
behavior: mediating role of consumer emotions. Psychology and Marketing, 14(4), 361-378.
Shiv, B., & Huber J. (2000). The impact of anticipating satisfaction on choice. Journal of Consumer
Research, 27(2), 202-216.
Somoon, K., & Sahachaisaeree, N. (2010). Factors determining window display conveying
merchandise's Positioning and style: a case of shopping mall clothing display targeting
undergraduate students. Procedia-Social and Behavioral Sciences, 5, 1236-1240.
Somoon, K., & Sahachaisaree, N. (2012). Design Elements and Users’ Perceptual Response: A
Case of Window Display Design for Adolescent Merchandising. Procedia-Social and Behavioral
Sciences, 50, 685-690.
Then, N. K., & DeLong, M. R. (1999). Apparel shopping on the web. Journal of Family and
Consumer Sciences, 91(3), 65-68
Tlapana, T. P. (2009). Store layout and its impact on consumer purchasing behaviour at
convenience stores in Kwa Mashu (Doctoral dissertation, Durban University of Technology).
van der Merwe, D., Stoltz, M., & Jacobs, S. (2008). The influence of the clothing sales assistant on
the female consumer’s purchasing decision: an exploratory investigation. Journal of Family
Ecology and Consumer Sciences/Tyds
Vinamra Jain, Ashok Sharma & Pradeep Narwal (2012), International Journal of Research in
management, Issue 2, Vol. 5, 2012, ISSN 2249-5908