The exhalant jet of mussels Mytilus edulis - int-res.com · The exhalant jet velocity was...
18
MARINE ECOLOGY PROGRESS SERIES Mar Ecol Prog Ser Vol. 437: 147–164, 2011 doi: 10.3354/meps09268 Published September 15 INTRODUCTION Filter-feeding bivalves process large amounts of ambient water to acquire the food needed for sustain- ing life, and extensive literature deals with the amounts of water pumped through the gills of a mus- sel and the efficiency by which suspended particles are retained (Møhlenberg & Riisgård 1978, 1979, Jør- gensen 1990, Riisgård 2001a, Riisgård & Larsen 2010). Nevertheless, there is considerable variation between published values of the exhalant jet velocity of mussels (Jørgensen et al. 1986, 1988, André et al. 1993, Newell et al. 2001, Stamhuis 2006, Maire et al. 2007, Frank et al. 2008, MacDonald et al. 2009, Troost et al. 2009), and little is known about the detailed fluid mechanics of flow near a mussel that is gener- ated by the flow through the exhalant siphon appear- ing as a well structured jet (André et al. 1993, Green et al. 2003). This flow in conjunction with a possible imposed external flow from currents or other mussels © Inter-Research 2011 · www.int-res.com *Email: [email protected] The exhalant jet of mussels Mytilus edulis Hans Ulrik Riisgård 1, *, Bo Hoffmann Jørgensen 2 , Kim Lundgreen 1 , Francesca Storti 2 , Jens Honore Walther 2,3 , Knud Erik Meyer 2 , Poul S. Larsen 2 1 Marine Biological Research Centre, University of Southern Denmark, Hindsholmvej 11, 5300 Kerteminde, Denmark 2 DTU Mechanical Engineering, Fluid Mechanics, Technical University of Denmark, Building 403, 2800 Kgs. Lyngby, Denmark 3 Chair of Computational Science, ETH Zurich, 8092 Switzerland ABSTRACT: The exhalant jet flow of mussels in conjunction with currents and/or other mussels may strongly influence the mussels’ grazing impact. Literature values of mussel exhalant jet veloc- ity vary considerably and the detailed fluid mechanics of the near-mussel flow generated by the exhalant jet has hitherto been uncertain. Computational modelling of this phenomenon depends on knowledge of the velocity distribution near the exhalant siphon aperture of mussels to provide appropriate boundary conditions for numerical flow models. To be useful such information should be available for a range of mussel shell lengths. Here, we present results of a detailed study of fully open mussels Mytilus edulis in terms of filtration rate, exhalant siphon aperture area, jet velocity, gill area and body dry weight, all as a function of shell length (mean ± SD) over the range 16.0 ± 0.4 to 82.6 ± 2.9 mm, with the corresponding scaling laws also presented. The exhalant jet velocity was determined by 3 methods: (1) measured clearance rate divided by exhalant aperture area, (2) man- ual particle tracking velocimetry (PTV) using video-microscope recordings, and (3) particle image velocimetry (PIV). The latter provides detailed 2-component velocity distributions near the exha- lant siphon in 5 planes parallel to the axis of the jet and the major axis of the oval aperture, and hence estimates of momentum and kinetic energy flows in addition to mean velocity. Data obtained on particles inside the exhalant jet of filtered water was verified by the use of titanium dioxide seed- ing particles which were de-agglomerated by ultrasound to a size range of 0.7 to 2 μm prior to addi- tion, to avoid retention by the gill filter of the mussels. We found that exhalant jet velocity was essentially constant at ~8 cm s -1 , and independent of shell length. Based on geometric similarity and scaling of mussel pump-system characteristics we found that these characteristics coincide approximately for all sizes when expressed as pressure head versus volume flow divided by shell length squared. KEY WORDS: Filtration rate · Exhalant siphon area · Particle image velocimetry · Particle tracking velocimetry · Exhalant jet velocity · Velocity field · Allometric equation · Scaling law Resale or republication not permitted without written consent of the publisher
Transcript of The exhalant jet of mussels Mytilus edulis - int-res.com · The exhalant jet velocity was...

MARINE ECOLOGY PROGRESS SERIESMar Ecol Prog Ser
Vol. 437: 147–164, 2011doi: 10.3354/meps09268
Published September 15
INTRODUCTION
Filter-feeding bivalves process large amounts ofambient water to acquire the food needed for sustain-ing life, and extensive literature deals with theamounts of water pumped through the gills of a mus-sel and the efficiency by which suspended particlesare retained (Møhlenberg & Riisgård 1978, 1979, Jør-gensen 1990, Riisgård 2001a, Riisgård & Larsen2010). Nevertheless, there is considerable variation
be tween published values of the exhalant jet velocityof mussels (Jørgensen et al. 1986, 1988, André et al.1993, Newell et al. 2001, Stamhuis 2006, Maire et al.2007, Frank et al. 2008, MacDonald et al. 2009, Troostet al. 2009), and little is known about the detailedfluid mechanics of flow near a mussel that is gener-ated by the flow through the exhalant siphon appear-ing as a well structured jet (André et al. 1993, Greenet al. 2003). This flow in conjunction with a possibleimposed external flow from currents or other mussels
© Inter-Research 2011 · www.int-res.com*Email: [email protected]
The exhalant jet of mussels Mytilus edulis
Hans Ulrik Riisgård1,*, Bo Hoffmann Jørgensen2, Kim Lundgreen1, Francesca Storti2, Jens Honore Walther2,3, Knud Erik Meyer2, Poul S. Larsen2
1Marine Biological Research Centre, University of Southern Denmark, Hindsholmvej 11, 5300 Kerteminde, Denmark 2DTU Mechanical Engineering, Fluid Mechanics, Technical University of Denmark, Building 403, 2800 Kgs. Lyngby, Denmark
3Chair of Computational Science, ETH Zurich, 8092 Switzerland
ABSTRACT: The exhalant jet flow of mussels in conjunction with currents and/or other musselsmay strongly influence the mussels’ grazing impact. Literature values of mussel exhalant jet veloc-ity vary considerably and the detailed fluid mechanics of the near-mussel flow generated by theexhalant jet has hitherto been uncertain. Computational modelling of this phenomenon depends onknowledge of the velocity distribution near the exhalant siphon aperture of mussels to provideappropriate boundary conditions for numerical flow models. To be useful such information shouldbe available for a range of mussel shell lengths. Here, we present results of a detailed study of fullyopen mussels Mytilus edulis in terms of filtration rate, exhalant siphon aperture area, jet velocity,gill area and body dry weight, all as a function of shell length (mean ± SD) over the range 16.0 ± 0.4to 82.6 ± 2.9 mm, with the corresponding scaling laws also presented. The exhalant jet velocity wasdetermined by 3 methods: (1) measured clearance rate divided by exhalant aperture area, (2) man-ual particle tracking velocimetry (PTV) using video-microscope recordings, and (3) particle imagevelocimetry (PIV). The latter provides detailed 2-component velocity distributions near the exha-lant siphon in 5 planes parallel to the axis of the jet and the major axis of the oval aperture, andhence estimates of momentum and kinetic energy flows in addition to mean velocity. Data obtainedon particles inside the exhalant jet of filtered water was verified by the use of titanium dioxide seed-ing particles which were de-agglomerated by ultrasound to a size range of 0.7 to 2 µm prior to addi-tion, to avoid retention by the gill filter of the mussels. We found that exhalant jet velocity wasessentially constant at ~8 cm s−1, and independent of shell length. Based on geometric similarityand scaling of mussel pump-system characteristics we found that these characteristics coincideapproximately for all sizes when expressed as pressure head versus volume flow divided by shelllength squared.
KEY WORDS: Filtration rate · Exhalant siphon area · Particle image velocimetry · Particle trackingvelocimetry · Exhalant jet velocity · Velocity field · Allometric equation · Scaling law
Resale or republication not permitted without written consent of the publisher

Mar Ecol Prog Ser 437: 147–164, 2011
will influence the grazing impact and thus the con-centration distribution of food particles reaching theinhalant aperture; hence affecting the feeding condi-tions of the mussel. Of particular interest is the unde-sirable phenomenon of re-filtration where part of theonce filtered and exhaled water reaches the inhalantaperture of either the same or other mussels. This hasbeen studied to some extent for mussel beds where anumber of attempts have been made to model phyto-plankton concentration gradients caused by densebeds of filter-feeding bivalves in relatively strong cur-rents with a high degree of turbulence (Wildish &Kristmanson 1984, 1997, Fréchette & Bourget 1985,Fréchette et al. 1989, O’Riordan et al. 1993, Butmanet al. 1994, Mann & Lazier 1996, Herman et al. 1999,Jonsson et al. 2005, Tweddle et al. 2005, Lassen et al.2006). Moderate currents may generate enough tur-bulence in the benthic boundary layer to increase thesupply of food to the filter feeders by turbulent mix-ing. However, the additional ‘biomixing’ induced bythe filter feeders themselves (Larsen & Riisgård 1997)has not yet been included in any model. Similar con-siderations may also be important for dense popula-tions of mussels in nature (Riisgård et al. 2004, 2007)and in aquaculture systems (Newell et al. 1998,Angel et al. 2002, Petersen et al. 2008, Maar et al.2008, Plew et al. 2009, Duarte et al. 2010). Furtherprogress in understanding and optimizing such sys-tems relies on computational modelling and support-ing experiments.
It is therefore of interest to describe the exhalant jetof Mytilus edulis in terms of its oval shape at thesiphon aperture, its velocity, spreading rate, penetra-tion, and breakup. One aspect of this issue is thevelocity distribution near the exhalant aperture,which is needed to provide appropriate boundaryconditions for numerical flow models and to estimatethe actual flows of momentum and kinetic energythat are important for biomixing and mussel pumpmodelling. To be useful such results should be avail-able for a range of typical mussel sizes, for examplein terms of shell length. Several experimental tech-niques exist for measuring velocities: Particle ImageVelocimetry (PIV), Particle Tracking Velocimetry(PTV), Laser Doppler Anemometry (LDA) and hot-film anemometry or thermistor probes (for a mini-review of techniques used for analysing flow inzoobenthos see Riisgård & Larsen 2005). In the pre-sent study we have chosen 2-component PIV to inves-tigate the exhalant flow of M. edulis because of theability of the method to map a 2-dimensional field ofvelocities simultaneously, thereby providing insightinto complicated flow structures in a convenient way.
Secondly, we have used PTV based on manual track-ing of en trained particles by microscope video re -cordings to further characterize the exhalant jet. As athird approach, mean exhalant jet velocities were cal-culated from measured clearance rates divided byaperture area.
MATERIALS AND METHODS
Experimental mussels
Blue mussels Mytilus edulis were collected inKerteminde Fjord, Denmark, and acclimated in thelaboratory at the Marine Biological Research Centre,University of Southern Denmark, for 1 wk prior to theexperiments. The mussels were kept in aerated flow-through tanks supplied with seawater from the fjordinlet. During the experimental period water tempera-ture and salinity were 11.6 ± 0.2°C and 19.8 ± 1.2 psu(means ± SD), respectively.
Filtration rate
Filtration rates were measured as the volume ofwater cleared of suspended particles per unit of time.The reduction in the number of particles as a functionof time was followed by taking water samples (10 ml)at fixed time intervals from an aquarium containingmussels in well-mixed seawater, to which algal cellsRhodomonas salina were added, and measuring theparticle concentration with an electronic particlecounter (Elzone 5380). The algal cells had a diameterof ~6 µm and were therefore retained by the gills ofthe mussels with 100% efficiency (Møhlenberg &Riisgård 1978). The filtration rate (F) was determinedfrom the exponential decrease in algal concentrationas a function of time using the usual clearance for-mula (e.g. Coughlan 1969, Jørgensen 1990):
F = (V/t × n) ln(C0/Ct) = V/n × b (1)
where C0 and Ct are initial and terminal concentra-tions of particles, V = water volume in aquarium, t =time, n = number of mussels and b is the slope ofthe regression line in a semi-ln plot for the reductionin algal concentration with time in a well-mixedaquarium, hence:
F = V × b/n (2)
A control experiment without mussels showed thatsedimentation of algal cells was insignificant. In allexperiments, the algal concentration was kept below
148
Riisgård et al.: Mytilus edulis jet velocity
4000 Rhodomonas cells ml−1 (equivalent to 5 µg chl al−1, Clausen & Riisgård 1996) which is below thethreshold concentration for pseudofaeces productionand incipient saturation reduction of filtration activity(Riisgård 2001b).
Exhalant siphon area and shell opening degree
Exhalant siphon cross-sectional area (ESA) wasmeasured by 2 methods (M1, M2). M1: a ruler wasplaced in the transparent experimental plastic aquar-ium close to the mussel and, from digital photos, themaximal (2a) and minimal (2b) widths of the oval ex-halant opening (Fig. 1C) were measured manuallywith a ruler. The ESA was subsequently calculated us-ing the formula for an ellipse: ESA = πab. M2: the ex-halant cross-sectional area was cut from an en largedpaper photo and ESA was determined by multiplyingthe weight of the cut of paper with a measured conver-sion factor (i.e. weight of one area unit of paper). Mus-sel shell opening degree (SOD) was defined as the dis-tance between the shells just below the exhalantsiphon aperture (Fig. 1C), and it was measured manu-ally from a digital photo by using a ruler placed in theexperimental tank next to the mussel.
Gill area, body dry weight, and condition index
To measure the gill area, mussels were cut openand seawater was added to one of the shells to allowthe gill to unfold so that its outline could be drawnon a piece of transparent film (Arkwright). The areaof a single gill layer (i.e. 1 lamella) was measuredfrom the weight of the drawing on the transparentfilm, and this value was subsequently multiplied by 8(2 W-shaped gills, each with 2 demibranchs with 2lamellae of same size, e.g. Jørgensen 1990, his Fig. 2)to obtain the total gill area (G) of the mussel.
Dry weight of the soft body (W, mg) was measuredafter drying it in an oven at 90°C for 24 h. The condi-tion index (CI) of the mussels was calculated as:
CI = W/L3 (3)
where L is the shell length (cm).
Exhalant jet velocity from clearance rate andparticle tracking velocimetry
The mean velocity of the exhalant jet (Ve) was cal-culated as:
Ve = F/ESA (4)
In addition, paths of naturally oc -curring particles (<40 µm) near tothe exhalant siphon region of a30 mm shell length actively feed-ing mussel Mytilus edulis, fed al -gal cells Rhodomonas salina, werere corded using a video camera anda 50 half-frames-per-second videorecorder (Panasonic NV-FS200HQ) attached to a horizontal dis-secting microscope (Wild M3C)placed in front of an observationchamber holding the mussel.Video frames could be copied topaper by means of a video graphicprinter (Sony UP-860 CE), and therelative movements of particleswere traced from their position insuccessive frames, with time inter-vals of 0.1 or 0.02 s. The main pur-pose of the video recordings was totrace the path and measure thespeed of particles close to the exha-lant siphon opening as a differentmethod of obtaining exhalant jetvelocities.
149
Fig. 1. Mytilus edulis. (A) Experimental setup used for particle image velocime-try (PIV), consisting of a water filled transparent plastic aquarium with themussel positioned at the bottom, a laser sheet for illuminating the fluid in aplane aligned with the axis of the jet, and a digital camera. (B) Coordinate sys-tem at aperture of mussel: center line of the jet is x-axis, laser sheet is posi-tioned in 5 x,y-planes spaced 1.0 mm apart from z = –2 to +2 mm. (C) Photo ofmussel showing maximal (2a) and minimal (2b) widths of the oval exhalantaperture and shell opening degree (SOD); B = byssus threads; G = glue for
fixing mussel to bracket post

Mar Ecol Prog Ser 437: 147–164, 2011150
Experimental setup for particle image velocimetry
Particle Image Veloci metry (PIV) was utilized formeasuring the velocity field in the area of the exha-lant jet from a mussel in still water as shown in theschematic setup in Fig. 1A. The PIV method has beendescribed in detail by e.g. Raffel et al. (2007), andused in studies of bivalves by Stamhuis (2006), Franket al. (2008), and Troost et al. (2009). A camera takes2 consecutive images of the particles moving with thefluid in the plane illuminated by a laser sheet. Thedisplacement between the images determines thevelocity given the time interval between the frames.The double cavity YAG laser (New Wave ResearchSolo 120XT-15 Hz) emits 2 short (5 ns) pulses every250 ms. The emitted energy in each pulse is 24 to60 mJ. Frequency doubling transforms the light tothe wave length 532 nm. The laser optics generates alaser sheet with a beam waist of 2 mm, which is fur-ther reduced to 0.5 mm by a lens with a focal lengthof 237 mm. The laser was mounted on a traversingbench allowing positioning of the laser sheet relativeto the mussel which was fixed to a bracket post with2-component styrene monomer glue (Plastic Padding,‘Chemical Metal’) to avoid movement. Prior to theexperiment, metal sheets placed at the rear, back,and bottom surfaces of the tank were painted blackin order to avoid reflections of laser light. A DantecHiSense PIV/PLIF camera was mounted on a tripodresting on the floor. The camera has a focal length of62 mm and a CCD chip with resolution 1280 × 1024measuring 8.75 × 7.00 mm. The camera was con-nected to a camera controller (Dantec HiSense) andsynchronized with the laser using a timer box (Dan-tec); all connected to a computer utilizing the Dantecsoftware DynamicStudio ver. 3.00. In order to operatethe camera in daylight, it was fitted with a green fil-ter that only transmitted scattered laser light.
A small particle size is needed to resolve the exha-lant flow because 50% of the particles with diameter1.0 µm are retained by the mussels and nearly all theparticles are retained for diameters >2.0 µm (Møhlen-berg & Riisgård 1978). Titanium dioxide (TiO2) parti-cles, previously used by Frank et al. (2008), were usedas seeding in the following way. A small amount ofTiO2 powder was suspended in ethanol and dilutedwith water. To break up agglomerated particles, an ul-trasound device (Struers Metason 200 HT) was used.The suspension of particles was kept in a glass bottleand treated with ultrasound in a water bath for 60 min.A sample of the resulting contents of the bottle was ex-amined under a microscope which showed the typicalparticle size to be within the range of 0.7 to 2 µm. A
sufficient amount of suspended particles were addedto the observation aquarium to ensure a particle con-centration of 10 µg l−1. An aperture of f-number = 4.0was chosen for the camera. The TiO2 particles turnedout to be sufficiently bright, despite their small size.Further, clearance rate experiments with Rhodomonassalina and with and without TiO2 particles added to a5 l aquarium containing 5 mussels (mean ± SD shelllength = 32.20 ± 0.94 mm) were conducted to evaluateif the TiO2 particles affected the filtration rate. Neither0.1 nor 0.2 mg TiO2 l−1 (i.e. 10 and 20 times the concen-trations used in the PIV experiments) had any influ-ence on the filtration rate, which was measured to be30.4 ± 1.8 ml min−1 ind.−1. During PIV experiments,the mussels were fed R. salina algal cells. After eachnew addition of algal cells (up to 4000 cells ml−1) theconcentration in the observation aquarium, whichwas kept strongly mixed in the relatively short periodsbetween PIV measurements (performed in stagnantwater), was followed by taking samples (10 ml) at 5 to10 min intervals using an electronic particle counter(Elzone 5380). Thus clearance rates (F) could be calcu-lated and used along with estimates of ESA deter-mined from digital photos of the exhalant opening toestimate the exhalant jet velocity (Ve), which was sub-sequently compared with the PIV measurements.
Because of the high Stokesian drag due to theirsmall size and despite their high density (ρp = 4.26 gcm−3) the TiO2 particles closely follow the water flowto give correct measured velocities. However, duringperiods of no flow some settling of particles was ob-served. The terminal settling velocity is calculated as:
Vp = (gdp2/18ν) (ρp/ρ−1) (5)
where g denotes the acceleration of gravity, and νand ρ the kinematic viscosity and density of seawater,respectively. For diameters in the range dp = 0.7 to 2µm for particles assumed to be spherical, Vp = 0.9 to7.1 µm s−1. Furthermore, the ability of particles to fol-low changes in velocity is given by the characteristictime constant:
τp = (ρp/ρ) (dp2/18ν) (6)
which takes the corresponding small values of τp =
0.95 to 0.12 µs.
Measurement procedure for particle imagevelocimetry
Prior to the velocity measurements, the lengthscale of the camera image was calibrated with a rulerplaced near the mussel. For this, the green filter was

Riisgård et al.: Mytilus edulis jet velocity 151
temporarily removed from the camera and then thelaser sheet was adjusted to intersect the exhalantsiphon and aligned with the jet axis (x) and the majoraxis (y) of the oval aperture. To do this, milk dilutedwith sea water was fed through the inhalant orifice tovisualize the exhalant jet and the camera wasfocused on the laser sheet. Batches of typically 100image pairs were used for analysis. Batches weretaken at various locations across the oval aperture,with a spacing of 1 mm along the minor axis (z)(Fig. 1B). For each z-position, the filtration rate (F) ofthe mussel in question was determined by measuringthe exponential decrease in concentration of algalcells in the observation aquarium at 5 to 10 min inter-vals and using Eq.(2).
Data processing for particle image velocimetry
To obtain velocity from the displacement of particlesrecorded in image pairs, the adaptive correlation with50% overlap for an interrogation area of 32 × 32pixels, available in the Dynamic Studio software, wasused, yielding a resolution of 79 × 63 velocity vectors.The adaptive correlation is a variation of what isknown as multiple pass interrogation with hierarchicalgrid refinement (Raffel et al. 2007). Velocity vectorswere then validated by the moving average method.Care was taken to ensure that the maximum move-ment of the particles was <30% of the size of the inter-rogation area by limiting the time interval betweenthe consecutive frames. After the screening, thevector average field as well as root mean square (rms)fields were calculated from the set of typically 100 vec-tor fields. In the subsequent analysis, the data are re-ferred to by the coordinate system shown in Fig. 1B.Here, the center line of the jet from the exhalant aper-ture of the mussel is oriented along the x-axis and thelaser sheet is positioned in either of 5 x,y-planesspaced 1.0 mm apart from z = –2 to +2 mm along theminor axis of the oval aperture. Based on observedSDs in the range of 0.1 to 0.2 cm s–1, the estimated un-certainty is ~2% on mean velocity vectors and ~15%on rms-velocities.
RESULTS
Estimated velocity of the exhalant jet from filtration rate and particle tracking velocimetry
Addition of algal cells to the aquaria with initiallyunfed groups of Mytilus edulis stimulated the mussels
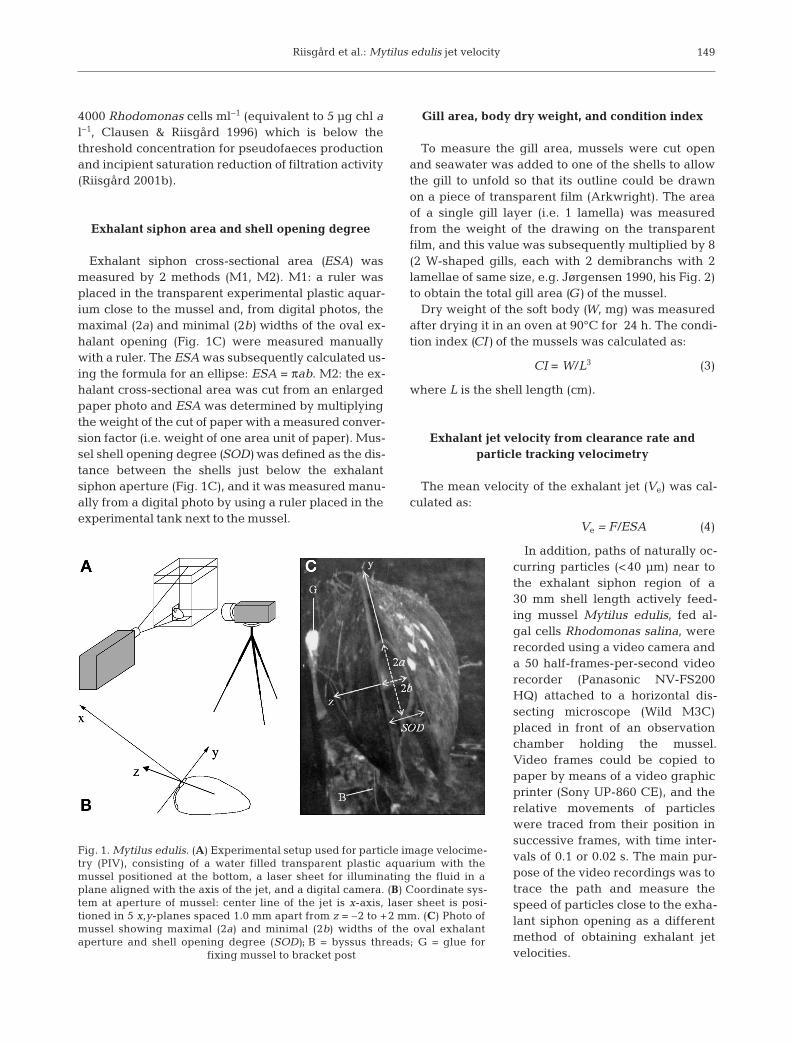
to fully open their valves within ~10 to 60 min, andthis response was also reflected in increased filtrationrates (F) (and thus steeper slopes of the linear regres-sion lines) in the clearance experiments (Fig. 2,Table 1). Thus, data for the 5 groups of fully open andmaximum filtering mussels (Table 2) could be sepa-rated from not fully open mussels with reduced filtra-tion rate (Table 3). From Table 2 it appears that the es-timated velocity (means ± SD) of the exhalant jet (Ve)in maximum filtering mussels was 8.3 ± 1.7 cm s−1
when Method 1 for estimating exhalant siphon area(ESA) was used and 6.4 ± 1.9 cm s−1 when Method 2was em ployed. It is notable that the Ve seems to be independent of mussel shell length (Fig. 3). FromTable 3 it appears that simultaneously measured Fand ESA at 60 to 80% reduced SOD result in lowerVe (4.3 ± 1.0 cm s−1) compared to that of fully open mussels (8.3 ± 1.7 cm s−1) (Table 1).
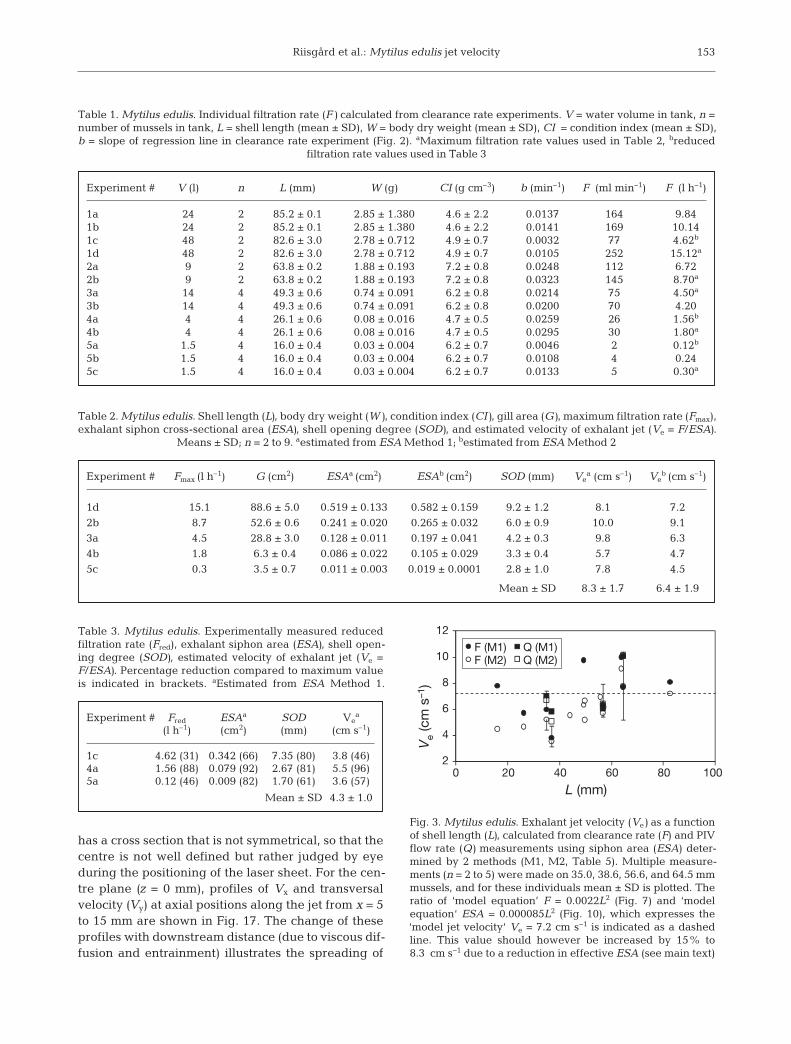
The flow patterns and speeds obtained by PTV inthe zone between inhalant and exhalant water of a35 mm shell length mussel (20°C) are shown in Fig. 4.The exhalant jet is invisible because all particles inthe inhalant water have been restrained by the gills,but particles in the ambient water close to the jetwere accelerated, indicating an Ve of about 8.7 cm s−1
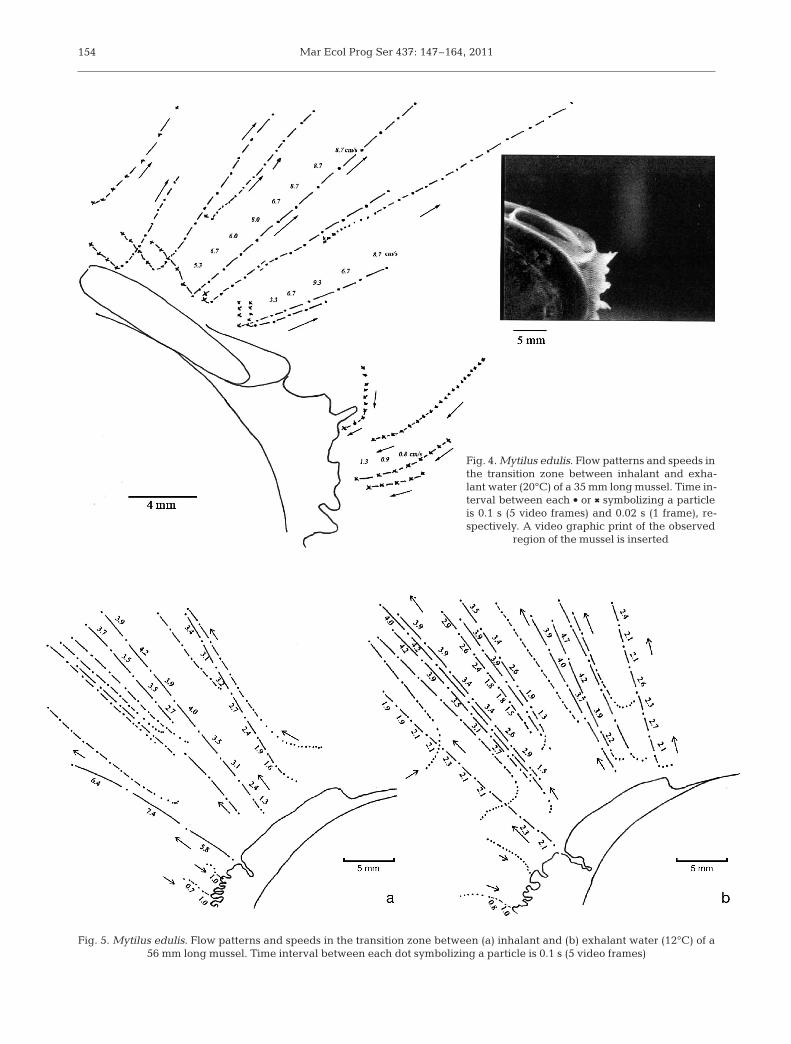
at a distance of ~15 mm above the exhalant aperture,which is in good agreement with the estimated veloc-ity (Table 2, Method 1). Similar flow patterns for en -trained particles are seen for a 56 mm shell lengthmussel (12°C) in Fig. 5 where the highest observedspeeds were somewhat lower. Fig. 6 shows the fluo-rescein- visualized exhalant jets from a mussel. Whenthe dye was sucked in through the inhalant openingas a very thin current from the dosing-pipette tip, onlya thin ray of the jet was visualized, and this indicatesthat the flow is laminar through the mussel-gill filterpump (i.e. no mixing and dispersion takes place insidethe mussel). The spreading of the jet is clearly visible(Fig. 6A) with a spreading half-angle of about 9.5°.
The filtration rate as a function of shell length (L),gill area (G) and body dry weight (W) are shown inFig. 7, Fig. 8, and Fig. 9, respectively. Further, theESA, SOD and W, all as a function of L, are shown inFig. 10, Fig. 11 and Fig. 12, respectively. Finally, F asa function of SOD and ESA are shown in Fig. 13 andFig. 14, respectively.
Velocity fields from particle image velocimetry
Data from 1 (logbook number 503) of 4 successfulPIV experiments for mussels of decreasing shelllength are shown in Table 4 along with the concen-

Mar Ecol Prog Ser 437: 147–164, 2011
tration of algal cells (C) and filtration rate (F) foundfrom clearance measurements at each position (z) ofthe laser sheet, as well as the water temperature (T).
In the example of a single recorded particle image(Fig. 15A), the seeding particles appear as brightspots and the exhalant aperture and part of the shellcan be seen to the lower right. The velocity vectorfield (Fig. 15B) shows the coordinate system and theextent of the field while the contour plot of turbulent
kinetic energy (k ≈ 0.75 [<uu> + <vv>], Fig. 15C) illus-trates the well-defined shear layers bounding thespreading exhalant jet.
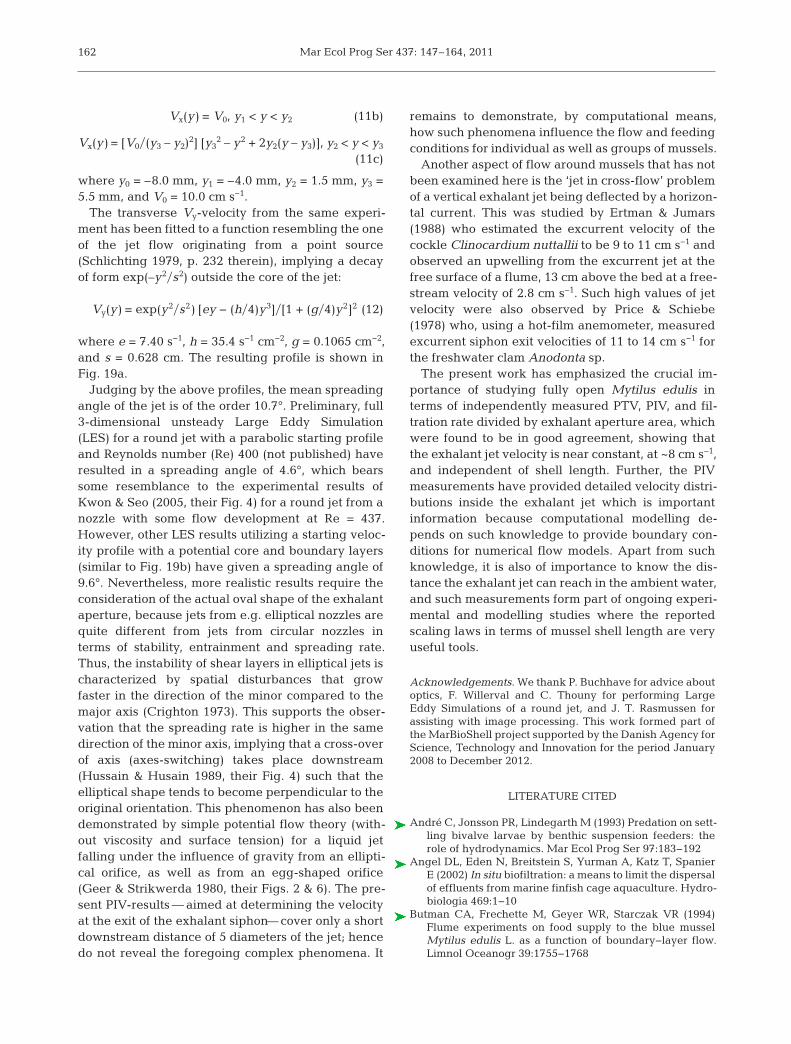
The profiles of axial velocity Vx across the jet at thedistance x = 5.0 mm from the exhalant aperture areshown for experiment #503 in Fig. 16. It can clearlybe seen that the velocity is greatest at the centreplane (z = 0 mm) and then decreases in off-centreplanes. The exhalant opening along the major axis
152
b = 0.0137
b = 0.0141
7.6
7.8
8.0
8.2
8.4
8.6
8.8
0 50 100 150
Group 1
(#1a)
(#1b)
b = 0.0032
b = 0.0105
8.0
8.1
8.2
8.3
8.4
0 10 20 30 40
Group 1
(#1c)
(#1d)
b = 0.0248
b = 0.0323
7.4
7.6
7.8
8.0
8.2
8.4
8.6
8.8
0 20 40 60 80
ln(a
lgal
con
c.)
Group 2
(#2a)
(#2b)
b = 0.0214
b = 0.02007.4
7.6
7.8
8.0
8.2
8.4
8.6
8.8
0 20 40 60 80
Group 3
(#3a)
(#3b)
b = 0.0259
b = 0.02957.4
7.6
7.8
8.0
8.2
8.4
8.6
8.8
0 20 40 60 80
Time (min)
Group 4
(#4a)
(#4b)
b = 0.0046
b = 0.0108
b = 0.0133
7.9
8.0
8.1
8.2
8.3
8.4
8.5
8.6
8.7
8.8
0 50 100 150 200
Time (min)
Group 5
(#5a)
(#5b)
(#5c)
Fig. 2. Mytilus edulis. Clearance rate experiment samples from the 5 shell sizes of mussels (Table 1). The slope b of the linear regression line for each experiment, started from 10 to 60 min after addition of algal cells to the tank, is shown
Riisgård et al.: Mytilus edulis jet velocity
has a cross section that is not symmetrical, so that thecentre is not well defined but rather judged by eyeduring the positioning of the laser sheet. For the cen-tre plane (z = 0 mm), profiles of Vx and transversalvelocity (Vy) at axial positions along the jet from x = 5to 15 mm are shown in Fig. 17. The change of theseprofiles with downstream distance (due to viscous dif-fusion and entrainment) illustrates the spreading of
153
Experiment # V (l) n L (mm) W (g) CI (g cm–3) b (min–1) F (ml min–1) F (l h–1)
1a 24 2 85.2 ± 0.1 2.85 ± 1.380 4.6 ± 2.2 0.0137 164 9.841b 24 2 85.2 ± 0.1 2.85 ± 1.380 4.6 ± 2.2 0.0141 169 10.141c 48 2 82.6 ± 3.0 2.78 ± 0.712 4.9 ± 0.7 0.0032 77 4.62b
1d 48 2 82.6 ± 3.0 2.78 ± 0.712 4.9 ± 0.7 0.0105 252 15.12a
2a 9 2 63.8 ± 0.2 1.88 ± 0.193 7.2 ± 0.8 0.0248 112 6.722b 9 2 63.8 ± 0.2 1.88 ± 0.193 7.2 ± 0.8 0.0323 145 8.70a
3a 14 4 49.3 ± 0.6 0.74 ± 0.091 6.2 ± 0.8 0.0214 75 4.50a
3b 14 4 49.3 ± 0.6 0.74 ± 0.091 6.2 ± 0.8 0.0200 70 4.204a 4 4 26.1 ± 0.6 0.08 ± 0.016 4.7 ± 0.5 0.0259 26 1.56b
4b 4 4 26.1 ± 0.6 0.08 ± 0.016 4.7 ± 0.5 0.0295 30 1.80a
5a 1.5 4 16.0 ± 0.4 0.03 ± 0.004 6.2 ± 0.7 0.0046 2 0.12b
5b 1.5 4 16.0 ± 0.4 0.03 ± 0.004 6.2 ± 0.7 0.0108 4 0.245c 1.5 4 16.0 ± 0.4 0.03 ± 0.004 6.2 ± 0.7 0.0133 5 0.30 a
Table 1. Mytilus edulis. Individual filtration rate (F) calculated from clearance rate experiments. V = water volume in tank, n =number of mussels in tank, L = shell length (mean ± SD), W = body dry weight (mean ± SD), CI = condition index (mean ± SD),b = slope of regression line in clearance rate experiment (Fig. 2). aMaximum filtration rate values used in Table 2, breduced
filtration rate values used in Table 3
Experiment # Fmax (l h–1) G (cm2) ESAa (cm2) ESAb (cm2) SOD (mm) Vea (cm s–1) Ve
b (cm s–1)
1d 15.1 88.6 ± 5.0 0.519 ± 0.133 0.582 ± 0.159 9.2 ± 1.2 8.1 7.22b 8.7 52.6 ± 0.6 0.241 ± 0.020 0.265 ± 0.032 6.0 ± 0.9 10.0 9.13a 4.5 28.8 ± 3.0 0.128 ± 0.011 0.197 ± 0.041 4.2 ± 0.3 9.8 6.34b 1.8 6.3 ± 0.4 0.086 ± 0.022 0.105 ± 0.029 3.3 ± 0.4 5.7 4.75c 0.3 3.5 ± 0.7 0.011 ± 0.003 0.019 ± 0.0001 2.8 ± 1.0 7.8 4.5
Mean ± SD 8.3 ± 1.7 6.4 ± 1.9
Table 2. Mytilus edulis. Shell length (L), body dry weight (W), condition index (CI), gill area (G), maximum filtration rate (Fmax),exhalant siphon cross-sectional area (ESA), shell opening degree (SOD), and estimated velocity of exhalant jet (Ve = F/ESA).
Means ± SD; n = 2 to 9. aestimated from ESA Method 1; bestimated from ESA Method 2
Experiment # Fred ESAa SOD Vea
(l h–1) (cm2) (mm) (cm s–1)
1c 4.62 (31) 0.342 (66) 7.35 (80) 3.8 (46)4a 1.56 (88) 0.079 (92) 2.67 (81) 5.5 (96)5a 0.12 (46) 0.009 (82) 1.70 (61) 3.6 (57)
Mean ± SD 4.3 ± 1.0
Table 3. Mytilus edulis. Experimentally measured reducedfiltration rate (Fred), exhalant siphon area (ESA), shell open-ing degree (SOD), estimated velocity of exhalant jet (Ve =F/ESA). Percentage reduction compared to maximum valueis indicated in brackets. aEstimated from ESA Method 1.
2
4
6
8
10
12
0 20 40 60 80 100
Ve
(cm
s–1
)
L (mm)
F (M1)F (M2)
Q (M1)Q (M2)
Fig. 3. Mytilus edulis. Exhalant jet velocity (Ve) as a functionof shell length (L), calculated from clearance rate (F) and PIVflow rate (Q) measurements using siphon area (ESA) deter-mined by 2 methods (M1, M2, Table 5). Multiple measure-ments (n = 2 to 5) were made on 35.0, 38.6, 56.6, and 64.5 mmmussels, and for these individuals mean ± SD is plotted. Theratio of ‘model equation’ F = 0.0022L2 (Fig. 7) and ‘modelequation‘ ESA = 0.000085L2 (Fig. 10), which expresses the‘model jet velocity‘ Ve = 7.2 cm s−1 is indicated as a dashedline. This value should however be increased by 15% to8.3 cm s−1 due to a reduction in effective ESA (see main text)
Mar Ecol Prog Ser 437: 147–164, 2011154
Fig. 4. Mytilus edulis. Flow patterns and speeds inthe transition zone between inhalant and exha-lant water (20°C) of a 35 mm long mussel. Time in-terval between each d or 6 symbolizing a particleis 0.1 s (5 video frames) and 0.02 s (1 frame), re-spectively. A video graphic print of the ob served
region of the mussel is inserted
Fig. 5. Mytilus edulis. Flow patterns and speeds in the transition zone between (a) inhalant and (b) exhalant water (12°C) of a 56 mm long mussel. Time interval between each dot symbolizing a particle is 0.1 s (5 video frames)

Riisgård et al.: Mytilus edulis jet velocity 155
Fig. 6. Mytilus edulis. Video graphic prints of visualized (fluorescein) exhalant jets from a 56 mm long mussel (12°C). (A) Thewhole exhalant jet is seen indicating the spreading of the jet. (B) Only a thin ray of the jet is seen because the dye entered the
inhalant opening as a very thin streak from the dosing-pipette tip. Right side: mm scale
0
2
4
6
8
10
12
14
16
18
0 20 40 60 80 100
F (l
h–1)
L (mm)
F = 0.001L2.262
R2 = 0.974
Fig. 7. Mytilus edulis. Maximum measured filtration rate (F)(11.6°C) as a function of mean (± SD) shell length. Formula
for dashed line (‘model equation‘): F = 0.0022L2
F = 6.412W0.720
R2 = 0.951
0
2
4
6
8
10
12
14
16
0 1 2 3 4
F (l
h–1
)
W (g)
Fig. 9. Mytilus edulis. Filtration rate (F) (11.6°C) as a function of mean (± SD) body dry weight (W)
G = 0.010L2.052
R2 = 0.988
0
10
20
30
40
50
60
70
80
90
100
G (c
m2 )
0 20 40 60 80 100L (mm)
Fig. 8. Mytilus edulis. Gill area (G) as a function of shell length. All means ± SD
ESA (1) = 5 × 10⁻⁵ L2.085
R2 = 0.918
ESA (2) = 1 × 10⁻⁴ L1.869
R2 = 0.938
0.0
0.1
0.2
0.3
0.4
0.5
0.6
0.7
0.8
ES
A (c
m2 )
Method 1
Method 2
0 20 40 60 80 100L (mm)
Fig. 10. Mytilus edulis. Exhalant siphon area (ESA) esti-mated by 2 methods as a function of shell length (L). Allmeans ± SD. Formula for dashed line (‘model equation‘):
ESA = 0.000085L2

Mar Ecol Prog Ser 437: 147–164, 2011
the jet. Nevertheless, the axial velocity measuredclosest to the aperture at x = 5.0 mm would be a goodestimate of the velocity at the aperture.
The flow rate (Q) in the jet at x = 5 mm for a givenmussel was estimated by integrating the velocityfrom the 5 measured Vx profiles over the cross sec-tional area of the jet. Each profile was taken to corre-spond to a layer of thickness 1.0 mm and the integra-
tion extended from y = –10.0 to +10.0 mm. Table 5lists this flow rate for each of the 4 shell lengths ofmussels (#502 to #505) as well as the filtration rates(F) obtained from clearance measurements. With theexception of experiment #504, the deviation betweenresults obtained by the 2 methods is <26% and maybe ascribed to the fact that integration will includesome entrainment flow. By inspection of Fig. 16 theexhalant jet velocity is seen to be above 8 cm s−1 overmost of the mid-plane.
The exhalant jet expands and slows down gradu-ally with distance due to entrainment of the surround-ing water. The rate of expansion can be estimatedfrom the angle between the x-axis and the velocityvector (Vx,Vy) in the centre plane (z = 0 mm). At x =5 mm, using values from Fig. 17 gives half angles ofapproximately arctan(2.8 cm s−1 / 10.0 cm s−1) = 15.6°in the left, and arctan(1 cm s−1 / 10.0 cm s−1) = 5.7° inthe right half-plane, hence an average of 10.7°. Forcomparison, the spreading of the jet visualized byflourescein (Fig. 6A) and that suggested by regions ofhigh turbulent kinetic energy in the shear layers(Fig. 15C) both indicate a half-angle of 9.5°.
156
SOD = 0.090L+ 0.794R2 = 0.903
0
2
4
6
8
10
12
SO
D (m
m)
0 20 40 60 80 100L (mm)
Fig. 11. Mytilus edulis. Shell opening degree (SOD) as a function of shell length (L), all means ± SD
W = 6 × 10⁻⁶ L3.009
R2 = 0.992
0
1
2
3
4
W (g
)
0 20 40 60 80 100L (mm)
Fig. 12. Mytilus edulis. body dry weight (W) as a function of shell length (L), all means ± SD
F = 2.315SOD – 5.676R2 = 0.993
0
2
4
6
8
10
12
14
16
18
0 2 4 6 8 10 12
F (l
h–1)
SOD (mm)Fig. 13. Mytilus edulis. Filtration rate (F) (11.6°C) as a function
of shell opening degree (mean ± SD)
Expt # C F z Temp. (cells ml−1) (ml min−1) (mm) (°C)
503-01 3948 151.1 0.0 16.8503-02 4151 166.4 1.0 17.3503-03 3743 141.9 2.0 17.3503-04 3093 153.3 –1.0 17.3503-05 3093 153.3 –2.0 17.3
Table 4. Mytilus edulis. Data from PIV experiment #503(= logbook number) for L = 56.6 mm shell length mussel. C =algal concentration, F = filtration rate, z = lateral position,
Temp. = water temperature.
F = 8.280ESA + 0.057R2 = 0.977
0
1
2
3
4
5
0.0 0.2 0.4 0.6 0.8
F (m
l s–1
)
ESA (cm2)
Fig. 14. Mytilus edulis. Filtration rate (F) (11.6°C) as a func-tion of exhalant siphon cross-sectional area (ESA, mean ± SD)
measured by Method 1

Riisgård et al.: Mytilus edulis jet velocity 157
Fig. 15. Mytilus edulis. (A) Particle image velocimetry imageof captured field (32 × 25.5 mm) showing seeding particlesin the jet flow, the exhalant siphon and part of the shell tothe lower right. (B) Averaged vector field of the exhalant jetof experiment #503 (only every third vector is shown for clar-ity). (C) Contour plot of turbulent kinetic energy, k ≈ 0.75(<uu> + <vv>), (excluding noisy region near aperture)
showing jet spreading by shear layers
Fig. 17. Mytilus edulis. Velocity profiles Vx(y) (a) and Vy(y)(b) at 5 x-positions from the exha lant aperture. The profilesare shown for the center plane (z = 0 mm) at the middle of
the exhalant jet. The error bars show ± 2SD
Fig. 16. Mytilus edulis. Velocity profiles Vx(y) at 5 z-positionsthrough the exhalant jet at a distance x = 5.0 mm from the
exhalant aperture
Mar Ecol Prog Ser 437: 147–164, 2011
DISCUSSION
Allometric equations and scaling
The experimentally measured filtration rate (F) andgill area (G) are both near proportional to the squareof the shell length (L), i.e. F = aL2 (cf. Fig. 7) and G =aL2 (cf. Fig. 8), and these expressions can thereforebe used in future modelling of the blue mussel Myti -lus edulis. Further, it was found that the body dryweight (W) is proportional to L3 (Fig. 12), implyingthat L is proportional to W 1/3, so that F = a(W 1/3)2 =aW 2/3 = aW 0.67 which is in good agreement with theactually determined exponent b = 0.72 (Fig. 9). Itshould, however, be remembered that the relation-ship between body weight and shell length (cf. thecondition index, Table 2) is not constant, but variesfrom population to population and during the yeardue to spawning in spring, growth during summer,and starvation during winter (Dare 1976, Riisgård2001a, Filgueira et al. 2008).
The equations for filtration rate as a function ofshell length or body dry weight are in good agree-ment with the formulae mentioned by Riisgård(2001a, their Table 1). Thus, the filtration rate ofMytilus edulis as a function of shell length was mea-
sured by means of the ‘suction’ method by Kiørboe &Møhlenberg (1981) who found F = 0.0012L2.14, whichis nearly identical to the present equation (Fig. 7).Flow rates (Q) obtained by integration of PIV-velocityprofiles are in fairly good agreement with filtrationrates measured in clearance experiments (Table 5),and the exhalant jet velocities measured by PIV(Figs. 16 & 17) are in reasonably good agreementwith the ‘model jet velocity’ of Ve = 8.3 mm s−1 (Fig. 3).Given the observed large spreading angle of the jet,a certain amount of discrepancy may be ascribed toentrainment of ambient fluid into the jet.
The effect of adding algal cells to the ambientwater of unfed mussels (cf. Fig. 2) is a well de scribedphenomenon (e.g. Riisgård & Randløv 1981, Newellet al. 2001, Riisgård et al. 2003, 2006) which in thepresent work was used to evaluate the effect ofreduced shell opening degree on exhalant jet veloc-ity (cf. ‘reduced filtration rate values’ in Tables 1 & 3).Compared with fully open mussels, the exhalantjet velocity was reduced in mussels with re ducedshell opening degree (and smaller exhalant siphoncross-sectional area). Jørgensen et al. (1988) studiedthe relationship between ‘passively controlled’ (bymeans of a binding screw) and ‘actively’ (by the mus-sel) reduced shell opening degree, area of exhalant
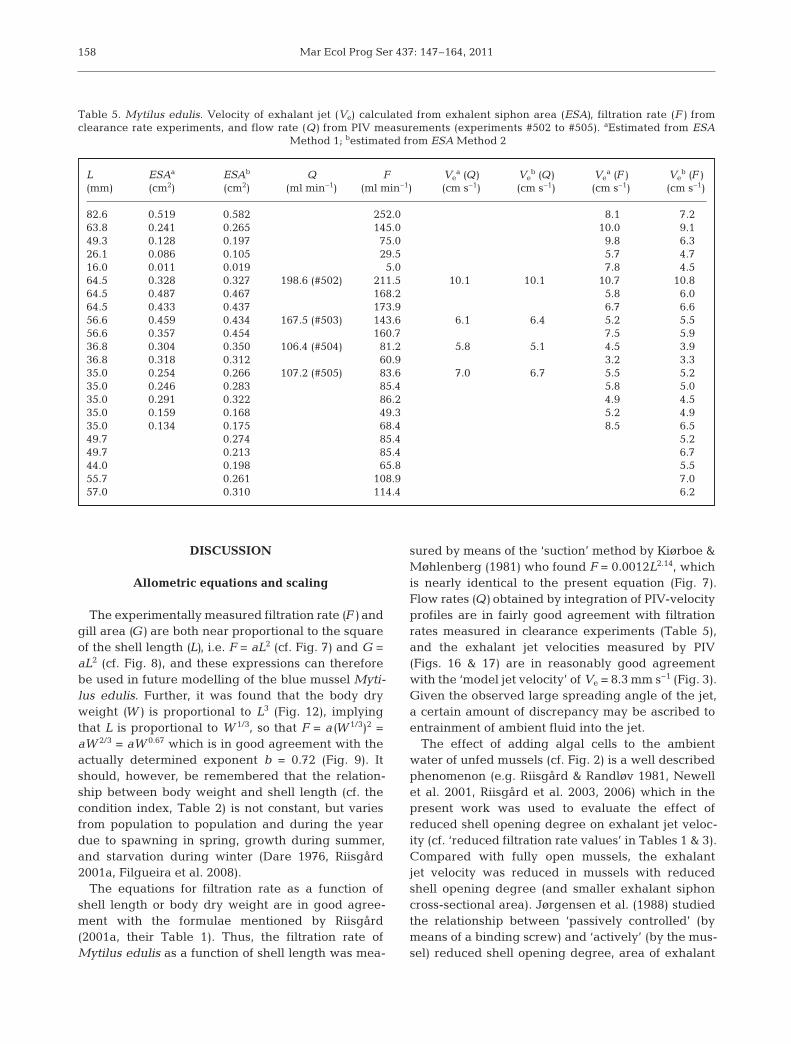
158
L ESAa ESAb Q F Vea (Q) Ve
b (Q) Vea (F) Ve
b (F)(mm) (cm2) (cm2) (ml min−1) (ml min−1) (cm s−1) (cm s−1) (cm s−1) (cm s−1)
82.6 0.519 0.582 252.0 8.1 7.263.8 0.241 0.265 145.0 10.0 9.149.3 0.128 0.197 75.0 9.8 6.326.1 0.086 0.105 29.5 5.7 4.716.0 0.011 0.019 5.0 7.8 4.564.5 0.328 0.327 198.6 (#502) 211.5 10.1 10.1 10.7 10.864.5 0.487 0.467 168.2 5.8 6.064.5 0.433 0.437 173.9 6.7 6.656.6 0.459 0.434 167.5 (#503) 143.6 6.1 6.4 5.2 5.556.6 0.357 0.454 160.7 7.5 5.936.8 0.304 0.350 106.4 (#504) 81.2 5.8 5.1 4.5 3.936.8 0.318 0.312 60.9 3.2 3.335.0 0.254 0.266 107.2 (#505) 83.6 7.0 6.7 5.5 5.235.0 0.246 0.283 85.4 5.8 5.035.0 0.291 0.322 86.2 4.9 4.535.0 0.159 0.168 49.3 5.2 4.935.0 0.134 0.175 68.4 8.5 6.549.7 0.274 85.4 5.249.7 0.213 85.4 6.744.0 0.198 65.8 5.555.7 0.261 108.9 7.057.0 0.310 114.4 6.2
Table 5. Mytilus edulis. Velocity of exhalant jet (Ve) calculated from exhalent siphon area (ESA), filtration rate (F) fromclearance rate experiments, and flow rate (Q) from PIV measurements (experiments #502 to #505). aEstimated from ESA
Method 1; bestimated from ESA Method 2
Riisgård et al.: Mytilus edulis jet velocity
siphon aperture, and filtration rate in Mytilus edulisof different sizes. It was found that the relationsbetween shell opening (or siphon area) and filtrationrates were similar for ‘passively’ and ‘actively’ con-trolled valve gape. For fully open M. edulis, Jørgen -sen et al. (1988, their Table 3) found that a filtrationrate of 41 ± 3.6 ml min−1 was correlated with a siphonarea of 12.9 ± 1.0 mm2 (means ± SD), and thus the ex -halant jet velocity was estimated at Ve = 41/12.9 =5.3 cm s−1 which is comparable to, although slightlylower than, that estimated in the present work(Table 2). Jørgen sen et al. (1988) concluded that re -duced shell opening degree is correlated with retrac-tion of the mantle edges and siphon, and that this re -sults in a reduction in width of the gill-interfilamentcanals and thus in the distance between opposingbands of water-pumping lateral cilia, and further,that this distance is the main factor in determiningthe pump pressure and filtration rate in M. edulis.
For fully open Mytilus edulis, exhalant siphon areaversus shell length scales approximately as ESA ∝ L2
(Fig. 10) and filtration rate (or pumping rate Q for100% retention) scales as F or Q ∝ ESA ∝ L2 (Fig. 14).Based on these observations the theory of geometricsimilarity may serve to show that the exhalant jetvelocity is essentially independent of mussel shelllength. To show this, consider the pump and systemcharacteristics of a mussel subject to zero backpres-sure (e.g. Riisgård & Larsen 1995, their Fig. 1a), re-plotted schematically as pressure head versus scaledvolume flow Q/L2 (Fig. 18). In M. edulis the pumpcharacteristic of the leaky viscous ciliary pump fol-lows a linear decrease of pressure head deliveredwith increasing volume flow (pumping rate) (Jør-gensen et al. 1986, their Fig. 3):
Δp = Δp0 (1 – Q/Qmax) = Δp0 [1 – (Q/L2)/(Qmax/L2)] (7)
The maximal (so-called shutoff) pressure head atzero flow (Δp0) is essentially independent of shelllength of mussel over a considerable range of largersizes since the ciliary pump is generic in terms ofbasic pump units, consisting of approximately (Joneset al. 1992) identical gill-filaments with water pump-ing lateral cilia of the same length and with a beat fre-quency independent of shell length (i.e. area-specificpumping rate of the gills is independent of musselshell length; same exponent b ≈ 2 for F and G as afunction of L, see Figs. 7 & 8). Therefore, the maximalvolume flow (Qmax, at zero pressure head) is assumedto scale by shell length according to area of gills, i.e.Qmax/L2 ≈ constant. As a consequence, pump charac-teristics for mussels of different shell length would allfall on the same line in a plot of pressure rise versusQ/L2, as shown in the schematic Fig. 18.
The system characteristic is the sum of a linear con-tribution from viscous flow resistance and a quadraticcontribution from the so-called kinetic loss due to theexhalant jet flow. The main contribution to the former(about 1/3 of the total pressure drop according to theexample of Jørgensen et al. 1986, their Table 3) stemsfrom the viscous flow through the gill-interfilamentalcanals. Treated as flow between parallel plates ofgeneric (i.e. constant) spacing λifc and length Lifc, thefrictional pressure drop is:
Δpf = 12μLifcuifc�λifc2 ∝ Q�L2 (8)
where the interfilamental water velocity is directlyproportional to the ratio of volume flow to gill area,hence the scaling uifc ∝ Q/L2. The latter contribution(about half of the total) is the kinetic energy loss inthe exhalant jet flow:
Δpkin = ½ρVe2 ∝ (Q�L2)2 (9)
where the exit velocity equals the ratio of volumeflow to exhalant opening area, hence the scaling Ve ∝Q/L2. The remaining contributions (about 1/6 of thetotal) come from minor losses of inhalant flow and vis-cous resistance in the boundary layers in the flowfrom mantel cavity out through the exhalant opening.These contributions probably scale less well with rel-evant velocities as Q/L2.
From the foregoing considerations it follows thatthe operating points of Mytilus edulis of differentshell length will coincide in the scaled plot of charac-teristics in Fig. 18, hence specifically the magnitudeof the kinetic head loss will be the same and conse-quently also the exit velocity Ve from the exhalantopening.
159
Scaled volume flow, Q/L2
Pre
ssur
e he
ad Pump
System
OP Kinetic
Viscous
Fig. 18. Schematic of Mytilus edulis pump and system char-acteristics intersecting at the normal operating point OP.System characteristic is sum of linear viscous and quadratic
kinetic resistances
Mar Ecol Prog Ser 437: 147–164, 2011
Exhalant jet velocity
The velocity of the exhalant jet has been studied by3 methods for fully open mussels. Mean values ofvelocity were obtained indirectly from measuredclearance rate divided by aperture area (Ve = 8.3 ±1.7 cm s−1, Method 1, Table 2), which are of the sameorder of magnitude as directly observed local veloci-ties by particle tracking (up to 8.7 cm s−1) and particleimage velocimetry (~ 8.6 to 11.1 cm s−1). All availabledata on Ve obtained in clearance and PIV measure-ments are placed together in Table 5 and depicted inFig. 3 along with the ‘model jet velocity’ found as theratio of ‘model equation’ for F (Fig. 7) and the ‘modelequation’ for ESA (Fig. 10): Ve = F/ESA = 7.2 cm s−1,which may be used as a shell length independentconstant in future modelling. This value should, how-ever, be increased by ~15% to 8.3 cm s−1 due to areduction in effective ESA (see below). The lowermean values ob tained by area Method 2 deserve anex planation. In Method 1, the area of the oval aper-ture is underestimated due to its more rectangularthan elliptical shape, giving a high value of velocity,which fortuitously proves to be a good estimate. InMethod 2, the area is probably quite accurate, but touse this it should be taken into consideration thatflow from the large mantel cavity into the exhalantsiphon involves the formation of thin viscous bound-ary layers along the walls such that the velocity distri-bution in the jet leaving at the aperture consists of acore of rather uniform velocity V0 surrounded byboundary layers in which the velocity drops to zero.Thus the effective area for estimating the mean jetvelocity Ve is the actual area minus the perimeter ofthe aperture multiplied by the displacement bound-ary layer thickness, δ1, which may be evaluatedapproximately as for flat plate flow from (Schlichting1979, p. 141 therein),
δ1 = 1.72 (νLs/V0)½ (10)
where ν (= 0.01 cm2 s–1) is the kinematic viscosity ofseawater and Ls (≈ 0.2 cm) the length of the siphon.Taking V0 ≈ 8 cm s–1 gives δ1 = 0.027 cm and, forexperiment 1d of Table 2, this leads to a reduction ineffective area of ~15%, so Method 2 would more cor-rectly lead to Ve = 8.28 cm s–1, which is in good agree-ment with the other results. Hence, in accord withthe derived scaling laws, it is concluded that theexhalant jet speed for fully open mussels is approxi-mately independent of shell length, in agreementwith the scaling derived.
To help the development of models for biomixing(cf. Larsen & Riisgård 1997) due to exhalant jets from
mussels, possibly aiding the supply of food particlesby turbulent mixing, it is of importance to know thekinetic energy flow delivered by such jets to theambient water. But as a consequence of the non-uni-form velocity distribution emerging from naturalapertures, as found in the present study (Figs. 16 &17) and by Troost et al. (2009), it is not possible to esti-mate the momentum and kinetic energy of the exha-lant jet given only volume flow F and aperture areaESA, hence mean velocity Vx,m (= F/ESA). For theideal case of a perfectly flat velocity profile at Vx,m,the flow of momentum and kinetic energy per unitmass are simply Vx,mF and ½Vx,m
2F, respectively. Cor-rect results, obtained by integration of measured pro-files of experiment #503 over the aperture may bewritten as C2Vx,mF and C3½Vx,m
2F, respectively,where we find the correction factor to be C2 = 1.4 andC3 = 2.2, respectively, at x = 5 mm, which illustratesthe magnitude of corrections to be expected. It is alsoof interest to note the measured levels of turbulentkinetic energy in the shear layers of the jet (Fig. 15C)of up to ~2 ×10⁻⁴ m2 s−2. Although this is no indicationof the turbulence level in the far field (not studied), itis noted that Wiles et al. (2006, their Fig. 5) measuredsimilar levels 2 to 3 cm above mussels at low waveheight that produced less turbulence.
The velocities of the exhalant jet obtained in thepresent study (Figs. 3, 16 & 17) may be compared tothose recorded in recent studies by Stamhuis (2006),Maire et al. (2007), Frank et al. (2008), MacDonald etal. (2009), and Troost et al. (2009). Using PIV, Stam -huis (2006) measured the exhalant velocity in Mytilusedulis to be only ~0.5 cm s−1. Maire et al. (2007, theirFig. 8A) measured the maximal velocity of exhalantwater in Mytilus galloprovinciales using a hot-filmprobe, and the maximal velocities were be tween 3.30and 4.60 cm s−1 when the probe was placed 2 mmfrom the aperture in the axis of the centre of the exha-lant siphon. Frank et al. (2008) re ported averagevelocities of 4.32 ± 0.39 cm s−1 (mean ± SD) and amaximum velocity of 12.31 cm s−1 in one type of ex per i ments (‘animal- generated flow velocities’),whereas the average maximum excurrent velocitieswere found to range from 1.7 to 3.8 cm s−1 in anothertype of experiments (‘mussel feeding study’). The fil-tration rate (or clearance rate) as a function of theexhalant siphon area has been measured for a 60 mmshell length M. edulis by MacDonald et al. (2009,their Fig. 3A). A suggested line for the relationship isF = 10 × ESA, and thus the velocity of the exhalant jet= slope of line = F (l h−1 g−1)/(10 × ESA (mm2)) = 0.28× F (cm3 s−1)/(0.1 ESA (cm2)) = 2.8 cm s−1. Finally, theaverage exhalant jet velocity in M. edulis was calcu-
160
Riisgård et al.: Mytilus edulis jet velocity
lated to be 18.5 cm s−1 by Troost et al. (2009) using an‘average’ exhalant siphon cross-sectional area of0.06 cm2 for a mussel ~4.0 l h−1. According to the pre-sent Fig. 7, a mussel with this filtration rate has ashell length of about 40 mm, and according to Fig. 10,the corresponding exhalant siphon cross-sectionalarea would be 0.1 cm2, or ~1.6 times larger than thevalue used by Troost et al. (2009). Overall, the exha-lant jet velocities in the present study are in fairlygood agreement with both Frank et al. (2008) andTroost et al. (2009).
Velocity fields from particle image velocimetry
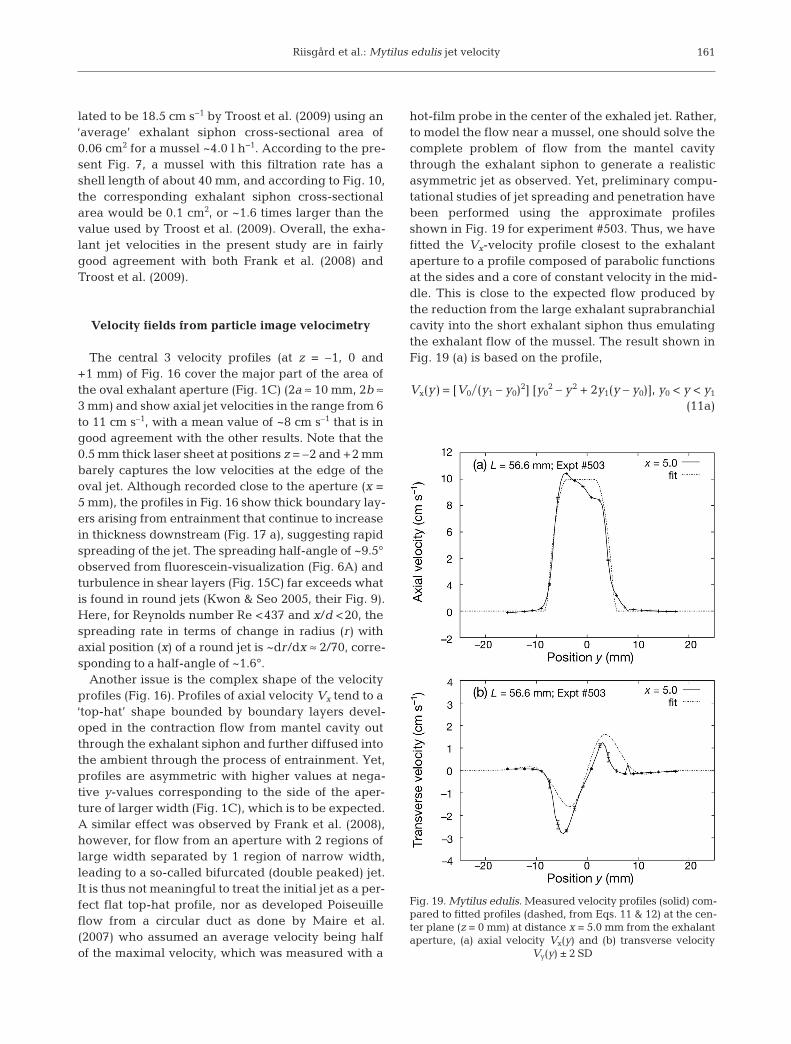
The central 3 velocity profiles (at z = –1, 0 and+1 mm) of Fig. 16 cover the major part of the area ofthe oval exhalant aperture (Fig. 1C) (2a ≈ 10 mm, 2b ≈3 mm) and show axial jet velocities in the range from 6to 11 cm s–1, with a mean value of ~8 cm s–1 that is ingood agreement with the other results. Note that the0.5 mm thick laser sheet at positions z = –2 and +2 mmbarely captures the low velocities at the edge of theoval jet. Although recorded close to the aperture (x =5 mm), the profiles in Fig. 16 show thick boundary lay-ers arising from entrainment that continue to increasein thickness downstream (Fig. 17 a), suggesting rapidspreading of the jet. The spreading half-angle of ~9.5°observed from fluorescein-visualization (Fig. 6A) andturbulence in shear layers (Fig. 15C) far exceeds whatis found in round jets (Kwon & Seo 2005, their Fig. 9).Here, for Reynolds number Re <437 and x/d <20, thespreading rate in terms of change in radius (r) with axial position (x) of a round jet is ~dr/dx ≈ 2/70, corre-sponding to a half-angle of ~1.6°.
Another issue is the complex shape of the velocityprofiles (Fig. 16). Profiles of axial velocity Vx tend to a‘top-hat’ shape bounded by boundary layers devel-oped in the contraction flow from mantel cavity outthrough the exhalant siphon and further diffused intothe ambient through the process of entrainment. Yet,profiles are asymmetric with higher values at nega-tive y-values corresponding to the side of the aper-ture of larger width (Fig. 1C), which is to be expected.A similar effect was observed by Frank et al. (2008),however, for flow from an aperture with 2 regions oflarge width separated by 1 region of narrow width,leading to a so-called bifurcated (double peaked) jet.It is thus not meaningful to treat the initial jet as a per-fect flat top-hat profile, nor as developed Poiseuilleflow from a circular duct as done by Maire et al.(2007) who assumed an average velocity being halfof the maximal velocity, which was measured with a
hot-film probe in the center of the exhaled jet. Rather,to model the flow near a mussel, one should solve thecomplete problem of flow from the mantel cavitythrough the exhalant siphon to generate a realisticasymmetric jet as observed. Yet, preliminary compu-tational studies of jet spreading and penetration havebeen performed using the approximate profilesshown in Fig. 19 for experiment #503. Thus, we havefitted the Vx-velocity profile closest to the exhalantaperture to a profile composed of parabolic functionsat the sides and a core of constant velocity in the mid-dle. This is close to the expected flow produced bythe reduction from the large exhalant suprabranchialcavity into the short exhalant siphon thus emulatingthe exhalant flow of the mussel. The result shown inFig. 19 (a) is based on the profile,
Vx(y) = [V0�(y1 – y0)2] [y02 – y2 + 2y1(y – y0)], y0 < y < y1
(11a)
161
Fig. 19. Mytilus edulis. Measured velocity profiles (solid) com-pared to fitted profiles (dashed, from Eqs. 11 & 12) at the cen-ter plane (z = 0 mm) at distance x = 5.0 mm from the exhalantaperture, (a) axial velocity Vx(y) and (b) transverse velocity
Vy(y) ± 2 SD
Mar Ecol Prog Ser 437: 147–164, 2011162
Vx(y) = V0, y1 < y < y2 (11b)
Vx(y) = [V0�(y3 – y2)2] [y32 – y2 + 2y2(y – y3)], y2 < y < y3
(11c)
where y0 = –8.0 mm, y1 = –4.0 mm, y2 = 1.5 mm, y3 =5.5 mm, and V0 = 10.0 cm s−1.
The transverse Vy-velocity from the same experi-ment has been fitted to a function resembling the oneof the jet flow originating from a point source(Schlichting 1979, p. 232 therein), implying a decayof form exp(–y2�s2) outside the core of the jet:
Vy(y) = exp(y2�s2) [ey − (h�4)y3]�[1 + (g�4)y2]2 (12)
where e = 7.40 s−1, h = 35.4 s−1 cm−2, g = 0.1065 cm−2,and s = 0.628 cm. The resulting profile is shown inFig. 19a.
Judging by the above profiles, the mean spreadingangle of the jet is of the order 10.7°. Preliminary, full3-dimensional unsteady Large Eddy Simulation(LES) for a round jet with a parabolic starting profileand Reynolds number (Re) 400 (not published) haveresulted in a spreading angle of 4.6°, which bearssome resemblance to the experimental results ofKwon & Seo (2005, their Fig. 4) for a round jet from anozzle with some flow development at Re = 437.However, other LES results utilizing a starting veloc-ity profile with a potential core and boundary layers(similar to Fig. 19b) have given a spreading angle of9.6°. Nevertheless, more realistic results require theconsideration of the actual oval shape of the exhalantaperture, because jets from e.g. elliptical nozzles arequite different from jets from circular nozzles interms of stability, entrainment and spreading rate.Thus, the instability of shear layers in elliptical jets ischaracterized by spatial disturbances that growfaster in the direction of the minor compared to themajor axis (Crighton 1973). This supports the obser-vation that the spreading rate is higher in the samedirection of the minor axis, implying that a cross-overof axis (axes-switching) takes place downstream(Hussain & Husain 1989, their Fig. 4) such that theelliptical shape tends to become perpendicular to theoriginal orientation. This phenomenon has also beendemonstrated by simple potential flow theory (with-out viscosity and surface tension) for a liquid jetfalling under the influence of gravity from an ellipti-cal orifice, as well as from an egg-shaped orifice(Geer & Strikwerda 1980, their Figs. 2 & 6). The pre-sent PIV-results — aimed at determining the velocityat the exit of the exhalant siphon— cover only a shortdownstream distance of 5 diameters of the jet; hencedo not reveal the foregoing complex phenomena. It
remains to demonstrate, by computational means,how such phenomena influence the flow and feedingconditions for individual as well as groups of mussels.
Another aspect of flow around mussels that has notbeen examined here is the ‘jet in cross-flow’ problemof a vertical exhalant jet being deflected by a horizon-tal current. This was studied by Ertman & Jumars(1988) who estimated the excurrent velocity of thecockle Clinocardium nuttallii to be 9 to 11 cm s−1 andobserved an upwelling from the excurrent jet at thefree surface of a flume, 13 cm above the bed at a free-stream velocity of 2.8 cm s−1. Such high values of jetvelocity were also observed by Price & Schiebe(1978) who, using a hot-film anemometer, measuredexcurrent siphon exit velocities of 11 to 14 cm s−1 forthe freshwater clam Anodonta sp.
The present work has emphasized the crucial im -portance of studying fully open Mytilus edulis interms of independently measured PTV, PIV, and fil-tration rate divided by exhalant aperture area, whichwere found to be in good agreement, showing thatthe exhalant jet velocity is near constant, at ~8 cm s−1,and independent of shell length. Further, the PIVmeasurements have provided detailed velocity distri-butions inside the exhalant jet which is im portantinformation because computational modelling de -pends on such knowledge to provide boundary con-ditions for numerical flow models. Apart from suchknowledge, it is also of importance to know the dis-tance the exhalant jet can reach in the ambient water,and such measurements form part of ongoing experi-mental and modelling studies where the reportedscaling laws in terms of mussel shell length are veryuseful tools.
Acknowledgements. We thank P. Buchhave for advice aboutoptics, F. Willerval and C. Thouny for performing LargeEddy Simulations of a round jet, and J. T. Rasmussen forassisting with image processing. This work formed part ofthe MarBioShell project supported by the Danish Agency forScience, Technology and Innovation for the period January2008 to December 2012.
LITERATURE CITED
André C, Jonsson PR, Lindegarth M (1993) Predation on sett -ling bivalve larvae by benthic suspension feeders: therole of hydrodynamics. Mar Ecol Prog Ser 97: 183−192
Angel DL, Eden N, Breitstein S, Yurman A, Katz T, SpanierE (2002) In situ biofiltration: a means to limit the dispersalof effluents from marine finfish cage aquaculture. Hydro-biologia 469: 1−10
Butman CA, Frechette M, Geyer WR, Starczak VR (1994)Flume experiments on food supply to the blue musselMytilus edulis L. as a function of boundary−layer flow.Limnol Oceanogr 39: 1755−1768

Riisgård et al.: Mytilus edulis jet velocity
Clausen I, Riisgård HU (1996) Growth, filtration and respira-tion in the mussel Mytilus edulis : no regulation of the filter- pump to nutritional needs. Mar Ecol Prog Ser 141:37–45
Coughlan J (1969) The estimation of filtering rate from theclearance of suspensions. Mar Biol 2: 356−358
Crighton DG (1973) Instability of an elliptic jet. J Fluid Mech59: 665−672
Dare PJ (1976) Settlement, growth and production of themussel, Mytilus edulis L., in Morecambe Bay, England.Fish Invest II 28: 1−25
Duarte P, Fernández-Reiriz MJ, Filgueira R, Labarta U(2010) Modelling mussel growth in ecosystems with lowsuspended matter loads. J Sea Res 64: 273−286
Ertman SC, Jumars PA (1988) Effects of bivalve siphonal cur-rents on the settlement of inert particles and larvae.J Mar Res 46: 797−813
Filgueira R, Labata U, Fernándes-Reiriz, MJ (2008) Effect ofcondition index on allometric relationships of clearancerate in Mytilus galloprovincialis Lamarck, 1819. Rev BiolMar Ocean 43: 391−398
Frank DM, Ward JE, Shumway SE, Holohan BA, Gray C(2008) Application of particle image velocimetry to thestudy of suspension feeding in marine invertebrates. MarFreshwat Behav Physiol 41: 1−18
Fréchette M, Bourget E (1985) Energy flow between thepelagic and benthic zones: factors controlling particulateorganic matter available to an intertidal mussel bed. CanJ Fish Aquat Sci 42: 1158−1165
Fréchette M, Butman CA, Geyer WG (1989) The importanceof boundary-layer flows in supplying phytoplankton tothe benthic suspension feeder, Mytilus edulis L. LimnolOceanogr 34: 19−36
Geer JF, Strikwerda JC (1980) Vertical slender jets. J FluidMech 101: 53−63
Green S, Visser AW, Titelman J, Kiørboe T (2003) Escaperesponses of copepod nauplii in the flow field of the bluemussel, Mytilus edulis. Mar Biol 142: 727−733
Herman PMJ, Middelburg JJ, Koppel JV, Heip CHR (1999)Ecology of estuarine macrobenthos. Adv Ecol Res 29: 195−240
Hussain F, Husain HS (1989) Elliptic jets. Part 1. Characteris-tics of unexcited and excited jets. J Fluid Mech 208: 257−320
Jones HD, Richards OG, Southern TA (1992) Gill dimen-sions, water pumping and body size in the musselMytilus edulis L. J Exp Mar Biol Ecol 155: 213−237
Jonsson PR, Petersen JK, Karlsson Ö, Loo LO, Nilsson S(2005) Particle depletion above experimental bivalvebeds: In situ measurements and numerical modeling ofbivalve filtration in the boundary layer. Limnol Oceanogr50: 1989−1998
Jørgensen CB (1990) Bivalve filter feeding: hydrodynamics,bioenergetics, physiology and ecology. Olsen & Olsen,Fredensborg, Denmark, p 140
Jørgensen CB, Famme P, Kristensen HS, Larsen PS, Møhlen-berg F, Riisgård HU (1986) The bivalve pump. Mar EcolProg Ser 34: 69−77
Jørgensen CB, Larsen PS, Møhlenberg M, Riisgård HU(1988) The bivalve pump: properties and modelling. MarEcol Prog Ser 45: 205−216
Kiørboe T, Møhlenberg F (1981) Particle selection in suspen-sion-feeding bivalves. Mar Ecol Prog Ser 5: 291−296
Kwon SJ, Seo IW (2005) Reynolds number effects on the be -havior of a non-buoyant round jet. Exp Fluids 38: 801−812
Larsen PS, Riisgård HU (1997) Biomixing generated by ben-thic filter-feeders: a diffusion model for near-bottomphytoplankton depletion. J Sea Res 37: 81−90
Lassen J, Kortegård M, Riisgård HU, Friedrichs M, Graf G,Larsen PS (2006) Down-mixing of phytoplankton abovefilter-feeding mussels—interplay between water flowand biomixing. Mar Ecol Prog Ser 314: 77−88
Maar M, Nielsen TG, Petersen JK (2008) Depletion of plank-ton in a raft culture of Mytilus galloprovincialis in Ría deVigo, NW Spain. II. Zooplankton. Aquat Biol 4: 127−141
MacDonald BA, Robinson SM, Barrington K (2009) Evaluat-ing the use of exhalant siphon area in estimating feedingactivity of blue mussels, Mytilus edulis. J Shellfish Res28: 289−297
Maire O, Amouroux JM, Duchêne JC, Grémare A (2007)Relationship between filtration activity and food avail-ability in the Mediterranean mussel Mytilus galloprovin-cialis. Mar Biol 152: 1293−1307
Mann KH, Lazier JRN (1996) Dynamics of marine ecosys-tems. Biological−physical interactions in the ocean.Blackwell Scientific Publications, Cambridge, MA
Møhlenberg F, Riisgård HU (1978) Efficiency of particleretention in 13 species of suspension-feeding bivalves.Ophelia 17: 239−246
Møhlenberg F, Riisgård HU (1979) Filtration rate, using anew indirect technique, in thirteen species of suspension-feeding bivalves. Mar Biol 54: 143−148
Newell CR, Campbell DE, Gallagher SM (1998) Develop-ment of the mussel aquaculture lease site model MUS-MOD: a field program to calibrate model formulations.J Exp Mar Biol Ecol 219: 143−169
Newell CR, Wildish DJ, MacDonald BA (2001) The effects ofvelocity and seston concentration on the exhalant siphonarea, valve gape and filtration rate of the mussel Mytilusedulis. J Exp Mar Biol Ecol 262: 91−111
O’Riordan CA, Monismith SG, Koseff JR (1993) A study ofconcentration boundary-layer formation over a bed ofmodel bivalves. Limnol Oceanogr 38: 1712−1729
Petersen JK, Nielsen TG, van Duren L, Maar M (2008)Depletion of plankton in a raft culture of Mytilus gallo-provincialis in Ría de Vigo, NW Spain. I. Phytoplankton.Aquat Biol 4: 113−125
Plew DR, Enright MP, Nokes RI, Dumas JK (2009) Effect ofmussel bio-pumping on the drag on and flow around amussel crop rope. Aquacult Eng 40: 55−61
Price RE, Schiebe FR (1978) Measurements of velocity fromexcurrent siphons of freshwater clams. Nautilus 92: 67−69
Raffel M, Willert CE, Wereley ST, Kompenhans J (2007) Par-ticle image velocimetry−a practical guide. Springer, NewYork, NY
Riisgård HU (2001a) On measurement of filtration rate inbivalves — the stony road to reliable data, review andinterpretation. Mar Ecol Prog Ser 211: 275−291
Riisgård HU (2001b) Physiological regulation versus auto -nomous filtration in filter-feeding bivalves: startingpoints for progress. Ophelia 54: 193−209
Riisgård HU, Larsen PS (1995) Filter-feeding in marinemacro invertebrates: pump characteristics, modellingand energy cost. Biol Rev Camb Philos Soc 70: 67−106
Riisgård HU, Larsen PS (2005) Water flow analysis and parti-cle capture in ciliary filter-feeding scallops (Pectinidae).Mar Ecol Prog Ser 303: 177−193
Riisgård HU, Larsen PS (2010) Particle-capture mechanismsin marine suspension-feeding invertebrates. Mar EcolProg Ser 418: 255−293
163

Mar Ecol Prog Ser 437: 147–164, 2011164
Riisgård HU, Randløv A (1981) Energy budgets, growth andfiltration rates in Mytilus edulis at different algal concen-tration. Mar Biol 61: 227−234
Riisgård HU, Kittner C, Seerup DF (2003) Regulation of open-ing state and filtration rate in filter-feeding bivalves (Car -dium edule, Mytilus edulis, Mya arenaria) in response tolow algal concentration. J Exp Mar Biol Ecol 284: 105−127
Riisgård HU, Seerup DF, Hjort MH, Glob E, Larsen PS (2004)Grazing impact of filter-feeding zoobenthos in a Danishfjord. J Exp Mar Biol Ecol 307: 261−271
Riisgård HU, Lassen J, Kittner C (2006) Valve-gape responsetimes in mussels (Mytilus edulis) — effects of laboratorypreceding-feeding conditions and in situ tidally inducedvariation in phytoplankton biomass. J Shellfish Res 25: 901−913
Riisgård HU, Lassen J, Kortegaard M, Møller LF, FriedrichsM, Jensen MH, Larsen PS (2007) Filter-feeding zooben-thos and importance of hydrodynamics in the shallowOdense Fjord (Denmark) — Earlier and recent studies,perspectives and modelling. Estuar Coast Shelf Sci 75: 281−295
Schlichting H (1979) Boundary-layer theory. McGraw-Hill,New York, NY
Stamhuis EJ (2006) Basics and principles of particle imagevelocimetry (PIV) for mapping biogenic and biologicallyrelevant flows. Aquat Ecol 40: 463−479
Troost K, Stamhuis EJ, Duren LA (2009) Feeding currentcharacteristics of three morphologically different bivalvesuspension feeders, Crassostrea gigas, Mytilus edulisand Cerastoderma edule, in relation to food competition.Mar Biol 156: 355−372
Tweddle JF, Simpson JH, Janzen CD (2005) Physical con-trols of food supply to benthic filter feeders in the MenaiStrait, UK. Mar Ecol Prog Ser 289: 79−88
Wildish D, Kristmanson D (1984) Importance to mussel of theben thic boundary layer. Can J Fish Aquat Sci 41: 1618−1625
Wildish D, Kristmanson D (1997) Benthic suspension feedersand flow. Cambridge University Press, Cambridge
Wiles PJ, van Duren LA, Häse C, Larsen J, Simpson JH(2006) Stratification and mixing in the Limfjorden in rela-tion to mussel culture. J Mar Syst 60: 129−143
Editorial responsibility: Roger Hughes, Bangor, UK
Submitted: December 23, 2010; Accepted: June 21, 2011Proofs received from author(s): August 25, 2011


![Food Sources for Ruditapes philippinarum in a Coastal ......mussels, Mytilus edulis (L. 1758), reached 11 MJ m22 yr21 (275 g C m 22 yr 1, using 0.025 g C KJ–1 based on Brey [1])](https://static.fdocuments.in/doc/165x107/60027b7d819a0f6c0757303d/food-sources-for-ruditapes-philippinarum-in-a-coastal-mussels-mytilus-edulis.jpg)