The Evolving U.S. Occupational Structureecon.la.psu.edu/classes-seminars/seminars/APSTtasks0… ·...
40
The Evolving U.S. Occupational Structure Enghin Atalay, Phai Phongthiengtham, Sebastian Sotelo, Daniel Tannenbaum * September 21, 2017 Abstract Using the text from help wanted ads, we construct a new data set of occupational task content from 1960 to 2000. We document that within-occupation task content shifts are at least as important as employment shifts across occupations in accounting for the aggregate decline of routine tasks. Motivated by these patterns, we first apply our new task measures to a reduced-form statistical decomposition. We then embed our measures in an equilibrium model of occupational choice. These two exercises indicate that shifts in the relative demand for tasks account for a 25 log point increase in 90-10 earnings inequality over our sample period. JEL Codes: J24, O33 1 Introduction Labor income inequality in the United States has increased considerably over the last several decades. Between 1960 and 2000, the ratio of earnings for the median worker, compared to the worker at the 10th percentile of the earnings distribution, has increased from 2.75 to 2.86. Over the same period, the 90-50 earnings ratio increased even more starkly, from 1.81 to 2.27. Alongside rising inequality, there have been dramatic changes in the composition of U.S. employment. For example, the employment share of occupations intensive in routine tasks has shrunk, while the share of occupations emphasizing nonroutine tasks, as well as social and cognitive skills, has grown (Autor, Levy, and Murnane, 2003; Autor, Katz, and Kearney, 2005; and Autor and Dorn, 2013). * Atalay and Phongthiengtham: Department of Economics, University of Wisconsin-Madison. Sotelo: Department of Economics, University of Michigan-Ann Arbor. Tannenbaum: Department of Economics, University of Nebraska-Lincoln. We thank Sara Heller, Andrei Levchenko, Pablo Ottonello, and Chris Taber for constructive and helpful comments, and Erin Robertson for excellent editorial assistance. We also thank seminar audiences at Geneva, Lima, Michigan, and Wisconsin. We acknowledge financial support from the Washington Center for Equitable Growth. 1
Transcript of The Evolving U.S. Occupational Structureecon.la.psu.edu/classes-seminars/seminars/APSTtasks0… ·...

The Evolving U.S. Occupational Structure
Enghin Atalay, Phai Phongthiengtham, Sebastian Sotelo, Daniel Tannenbaum∗
September 21, 2017
Abstract
Using the text from help wanted ads, we construct a new data set of occupationaltask content from 1960 to 2000. We document that within-occupation task contentshifts are at least as important as employment shifts across occupations in accountingfor the aggregate decline of routine tasks. Motivated by these patterns, we first applyour new task measures to a reduced-form statistical decomposition. We then embedour measures in an equilibrium model of occupational choice. These two exercisesindicate that shifts in the relative demand for tasks account for a 25 log point increasein 90-10 earnings inequality over our sample period. JEL Codes: J24, O33
1 Introduction
Labor income inequality in the United States has increased considerably over the last severaldecades. Between 1960 and 2000, the ratio of earnings for the median worker, compared tothe worker at the 10th percentile of the earnings distribution, has increased from 2.75 to2.86. Over the same period, the 90-50 earnings ratio increased even more starkly, from 1.81to 2.27. Alongside rising inequality, there have been dramatic changes in the composition ofU.S. employment. For example, the employment share of occupations intensive in routinetasks has shrunk, while the share of occupations emphasizing nonroutine tasks, as well associal and cognitive skills, has grown (Autor, Levy, and Murnane, 2003; Autor, Katz, andKearney, 2005; and Autor and Dorn, 2013).
∗Atalay and Phongthiengtham: Department of Economics, University of Wisconsin-Madison. Sotelo:Department of Economics, University of Michigan-Ann Arbor. Tannenbaum: Department of Economics,University of Nebraska-Lincoln. We thank Sara Heller, Andrei Levchenko, Pablo Ottonello, and Chris Taberfor constructive and helpful comments, and Erin Robertson for excellent editorial assistance. We also thankseminar audiences at Geneva, Lima, Michigan, and Wisconsin. We acknowledge financial support from theWashington Center for Equitable Growth.
1

The evidence thus far points to the decline of employment in U.S. occupations intensivein routine tasks, but is largely silent on whether the content of occupations themselves haschanged. Meanwhile, case studies of individual occupations have found considerable changes.For example, a report by the National Research Council (1999) suggests that managerialoccupations over the second half of the twentieth century increasingly have emphasized teammanagement, coaching skills and tasks, and interaction with customers. The rise in theseskills and tasks were accompanied by a decline of managerial tasks related to direct controlof subordinates.1 These findings raise the question of whether managerial occupations areunique in experiencing changes in tasks, or if comparable changes have occurred elsewhere.Moreover, to the extent that the tasks that workers perform on the job have shifted, whatare the implications for the distribution of earnings?
In this paper we show that, in fact, substantial changes in task composition did occurwithin occupations since 1960.2 Moreover, we find that these within-occupation changesin task content account for much of the observed increase in earnings inequality. We startby constructing a new data set using the text content of approximately 4.1 million job adsappearing in three major metropolitan newspapers — the New York Times, the Wall StreetJournal, and the Boston Globe. We then map the words contained in job ad text to differentclassifications of task content. Our main strategy relies on Spitz-Oener’s (2006) classifi-cation of words into routine (cognitive and manual) and nonroutine (analytic, interactive,and manual) tasks. We complement this approach using the classifications in Deming andKahn (2017), Firpo, Fortin, and Lemieux (2014), and the Occupational Information Network(O*NET). This last mapping is useful, since O*NET is at present the de facto standard inthe literature for measuring the content of occupations. To validate our new data set, wedemonstrate that the measures that result from our mapping correlate, across occupations,with O*NET’s measures of the importance of different tasks.3
1The National Research Council report chronicles the evolution of several other occupations. In Section4, we link the changes within managerial, clerical, and assembly occupations documented in the report tothe new measures we introduce in this paper.
2Acemoglu and Autor (2011), among others, emphasize that skills and tasks refer to different workconcepts: “A task is a unit of work activity that produces output (goods and services). In contrast, a skill isa worker’s endowment of capabilities for performing various tasks.” (p. 1045, emphasis in the original) Weadopt these definitions of skills and tasks throughout our paper.
3We also perform several checks on the data to argue that neither the selection of ads into newspapers northe fact that our data originate in metropolitan areas bias our results. First, we show that the distributionof ads across occupations is similar to the distribution of employment according to the decennial census(and our results largely agree with analogous comparisons made with online vacancies, e.g. Hershbein andKahn, 2016). Second, we show that the educational requirements by occupation in our data set correlatereasonably well with those observed in the census (Appendix A). Third, we show that trends in the propensityof unemployed workers to search for jobs through help wanted ads does not vary with the task content oftheir prior occupation (Appendix B). And, fourth, we show that our main results are not driven by the fact
2
We show that, in our database of newspaper ads, words related to interactive taskshave been increasing in frequency, while words related to routine tasks (especially routinemanual tasks) have declined in frequency between 1960 and 2000. For instance, we findthat the frequency of words related to routine cognitive tasks has declined by almost halffrom the early 1960s to the late 1990s, from 1.00 mentions per thousand job ad words to0.54 mentions per thousand words. The frequency of routine manual tasks has declined evenmore starkly. On the other hand, the frequency of words related to nonroutine interactivetasks has increased by more than 54 percent, from 3.19 to 5.48 mentions per thousand ofjob ad words. Importantly, we find that a large fraction of the aggregate changes in bothnonroutine and routine task related words has occurred within occupations, rather thanthrough changes in the occupations’ employment shares.
Having documented these patterns, we provide two alternative quantifications of therelation between changes in the task content of occupations and the rise of inequality in theU.S. The first one relies on decomposition methods applied to the earnings distribution; thesecond, on an equilibrium model of worker occupational choices and comparative advantage.
In our first quantification, we incorporate our occupational measures into Fortin, Lemieux,and Firpo (2011)’s methodology for decomposing changes in the wage distribution acrosspoints in time. Using these methods, we break down changes in the distribution of earningsover time into changes in the attributes of workers and their occupations (the “composi-tion” effect), as well as changes in the implicit prices of those observable characteristics (the“wage structure” effect). Next, we further break down changes in the distribution of earn-ings into the contributions of observable characteristics (e.g., the contribution of changes ineducational attainment and of changes in the returns to education).
Our results suggest that, relative to the upper tail of the income distribution, tasks whichwere valued highly in low-wage jobs (in particular manual tasks) declined in importance.These task changes, however, come more from changes within the occupations themselvesthan from shifts of employment across occupations. In the decomposition, changes in oc-cupational task content account, through composition effects, for a 32 log point increase in90-10 male earnings inequality. Wage structure effects — changes in tasks’ implict prices— account for a 6 percentage point decrease in 90-10 inequality. Among the 32 percent-age points that are due to composition effects, routine manual and nonroutine interactivetasks respectively account for a 24 and 8 log point increase in inequality. (The contributionof changes in routine cognitive, nonroutine analytic, and nonroutine manual tasks is moremodest.) If we instead ignore the evolution of occupational characteristics across time, andkeep the task measures fixed, we can only account for a total of 3 percentage points of the
that most of our ads come from a selected number of large metro areas (Appendix E.3).
3

observed increase in 90-10 inequality. Hence occupational measures of task intensity accountfor a large component of the increase in earnings inequality between 1960 and 2000, but onlyif task measures are allowed to vary across time.
In our second quantification, which we view as complementary to the earnings distributiondecomposition, we construct a general equilibrium model of occupational choice. In ourmodel, individual occupations are represented as a bundle of tasks. Workers’ skills governtheir abilities to perform each of the individual tasks in their occupation, and give rise tocomparative advantage. These skill levels are functions of workers’ observable characteristics— like gender, education, and experience — but also contain an idiosyncratic component.Based on their skill levels and the demand for tasks within each occupation, workers selectinto the occupation with the highest payoff.
We estimate the skills by which each demographic group performs different groups oftasks, combining information on demographic groups’ wages and occupation choices. Usingour estimated model, we calculate that changes in the relative demands for tasks have ledto a 25 log point increase in inequality among men, and a 22 log point increase in inequalityamong women and men. The intuition is that less educated workers both tend to be at thebottom of the wage distribution and have a comparative advantage in manual tasks, whilethe demand for the latter has declined.
Both the statistical decompositions and our model-based counterfactual exercises havetheir own advantages. In spite of their differences, however, both methods indicate that arelative decline in the demand for routine tasks has substantially increased earnings inequal-ity between 1960 and 2000. Moreover, both of these exercises require information on changesin occupations’ task content, something that our data set is suited to measure.
Our paper builds on two literatures, the first of which examines the causes and conse-quences of the evolution of occupations. Autor, Levy, and Murnane (2003) and Acemogluand Autor (2011) develop the hypothesis that technological advances have reduced the de-mand for routine tasks, which, in turn, has led to a reduction in the wages of low- andmiddle-skill workers. More recently, Firpo, Fortin, and Lemieux (2014) decompose changesin the distribution of wages into the contribution of occupational characteristics and otherfactors (including de-unionization, changes in minimum wage, and changes in worker demo-graphics). Deming (2017) documents that employment and wage growth has been confinedto occupations which are intensive in both social and cognitive skills. Michaels, Rauch, andRedding (2016) extend Autor, Levy, and Murnane (2003) to study changes in employmentshares by task content over a longer time horizon. They use a methodology that is relatedto ours, using the verbs from the Dictionary of Occupational Titles’ occupational descrip-tions and their thesaurus-based meanings. Burstein, Morales, and Vogel (2015) quantify the
4
impact of the adoption of computers on between-group wage inequality.Because commonly available data sets measuring occupational characteristics are infre-
quently and irregularly updated, in most of these papers occupational characteristics arefixed over time.4 One paper that focuses on within-occupation changes is Spitz-Oener (2006),which uses survey data from four waves of German workers to track skill changes within andbetween occupations, from the late 1970s to the late 1990s. One of our contributions is tostudy these changes in the U.S. context, extending the Spitz-Oener (2006) task classifications,and examining the implications of the observed changes in tasks for the wage distribution.Our paper contributes more generally to the measurement of time-varying task content ofoccupations by using newspaper job ads, a rich and largely untapped source of data.5 News-paper data have the advantage of appearing in the field: Firms post these ads while they areactively searching for workers, meaning that, unlike survey data, our data are not subjectto recall-bias or selective nonresponse. Our new data set contains rich information on U.S.occupations’ skill requirements, technology usage, work activities, work styles, and otherjob characteristics, between 1960 and 2000. These data are complementary to existing datasources currently used to study the evolution of the U.S. labor market.6
A second related literature uses the text from online help wanted ads to study the la-bor market: how firms and workers match with one another, how firms differ in their jobrequirements, and how skill requirements have changed since the beginning of the GreatRecession.7 Using data from CareerBuilder, Marinescu and Wolthoff (2016) document sub-stantial variation in job ads’ skill requirements and stated salaries within narrowly-definedoccupation codes. Moreover, the within-occupation variation is to a large extent explainedby the vacancy posting’s job title. Using online job ads, Hershbein and Kahn (2016) andModestino, Shoag, and Ballance (2016) argue that jobs’ skill requirements have increasedduring the post-Great Recession period; Deming and Kahn (2017) find that firms that post
4Ross (2017) applies the 2003 to 2014 vintages of the O*NET database to construct a panel of occupations’skill and task intensity measures. In Ross (2017), within-occupation differences in task intensities are appliedas an alternative source of variation, relative to previously used between-occupation trends, in identifyingdeclines in the price of workers’ routine task engagement in the last decade. In earlier work, Autor, Levy,and Murnane (2003) use the 1977 and 1991 versions of the Dictionary of Occupational Titles to comparechanges in occupations’ task content and computer adoption rates within these occupations.
5Also applying the text from newspaper ads, DeVaro and Gurtler (2017) document that before 1940 bothjob seekers and firms posted advertisements to match with one another. Only since 1940 has it been thecase that firms were the primary party posting ads.
6Our new data set can be found at http://ssc.wisc.edu/~eatalay/occupation_data .7Text analysis has been fruitfully applied in other branches of economics. Gentzkow and Shapiro (2010)
study the text from newspapers and from the Congressional Record to construct an index of newspapers’partisan slant. Hoberg and Phillips (2016) use the text from publicly-traded firms’ filings to the Securities andExchange Commission to classify industries and to draw insights about the identities of firms’ competitors.
5

ads with a high frequency of words related to social and cognitive skills have higher laborproductivity and pay higher wages. By bringing in newspaper data, we contribute to thisliterature with measurement of long-run changes in tasks and skills in the labor market.
The rest of the paper is organized as follows. Section 2 outlines the construction of ourdata set of occupations and their skill and task content. We compare this new data set toexisting data sources in Section 3. In Section 4, we document changes in the distributionsof occupational skills and tasks. Section 5 links task changes to changes in the earningsdistribution, first in a reduced-form exercise and then with the aid of a structural model.Section 6 reviews our results and suggests areas for future research.
2 A New Data Set of Occupational Characteristics
In this section, we discuss the construction of our structured database of occupational char-acteristics. The primary data sets are raw text files, purchased from ProQuest and originallypublished in the New York Times, Wall Street Journal, and Boston Globe. We complementthese text files with a data set purchased from Economic Modeling Specialists International(EMSI) for the purpose of identifying each ad’s occupation code. We extract from thenewspaper text information about the frequency of words related to occupations’ skill re-quirements and their work activities. The first step in our approach is to clean and processthe raw newspaper data. Then, we map job ad titles to Standard Occupational Classification(SOC) codes. Finally, we map job ad text into tasks, by grouping sets of words accordingto their meaning. Once we describe these procedures, we present some simple descriptivestatistics from our constructed data set.
2.1 Processing the Newspaper Text Files
The newspaper data are stored as raw text files, which ProQuest has produced using analgorithm that converts images of newspaper into text files. Figure 1 presents a snippetof the raw text from a page of display ads from the 1979 Boston Globe. This text refersto three vacancy postings, one for a “Mutual Fund Clerk” position, a second for a “Pay-ments Clerk,” and a third for a “Terminal Operator.” As Figure 1 makes clear, while thetext contains a high frequency of transcription errors (due to the imperfect performance ofProQuest’s optical character recognition technology), there is still quite a lot of informationto be extracted. Common work activities such as typing, processing applications, or main-taining client records are mentioned. In addition, one of the three advertisements includesan experience requirement. The raw text files that ProQuest has provided us allow us to
6

Figure 1: Unprocessed Text from the Boston Globe, November 4, 1979, Display Ad #133rapid growth through continued innovation and diversification If youare highly motivated person who takes pride in your work and the companyyou work for consider career with Fidelity \n MUTUAL FUNDS CLERKS \nIndividuals with 1-2 years funds transfer experience to process KeoghIRA accounts and adjustments \n PAYMENTS CLERKS \n Varied les processingnew account applications and payments \n StI nt flt ner fr nlr ct tfl \nMnirk \n and maintaining client \n strong record-keeping 50 wpm \n DataControl Department \n sorting and \n Brokerage \n environments with \nbenefits package for our Boston convenient to the Market \n gr WilnliElU5lty \n success \n -l 1?Q1.a1 ol P-1Sl1v MPloV \n Fidelit \n Group \n82 DEVONSHIRE STREET BOSTON MA 02109 \n 111 \n -l \n TERMINAL OPERATOR\n Position involves typing policy related information Into computerterminal No previous computer experience required Typing 5055 wpmExcellent benefits plus work Incentive program in addition to startingsalary of S150-165.
Notes: The figure presents text from the first three vacancy postings in a page of display ads inthe Boston Globe. An “\n” refers to a line break.
isolate the subset of text that come from advertisements, but do not directly allow us toidentify which ads are job ads (as opposed to other types of advertisements). Nor does thetext indicate when one job ad ends and another one begins. Therefore, in processing theProQuest text files, we must i) identify which advertisements comprise vacancy postings,ii) discern the boundaries between vacancy postings, and iii) identify the job title of eachvacancy posting. In addition, as much as possible, we attempt to undo the spelling mistakesinduced by ProQuest’s imperfect transcription of the newspaper text.
Distinguishing vacancy postings from other advertisements. To distinguish va-cancy postings from other types of advertisements, we apply a Latent Dirichlet Allocation(LDA) model. An LDA model classifies documents to one of a number of topics. In thesemodels, the probability that different words appear in a document depends on the hiddentopic of that document. LDA model estimation yields estimates of these conditional proba-bilities.
In our context, the LDA model is used to distinguish pages of job ads (one of the model’stopics) from other groups of ads. Estimation of the LDA model denotes estimation ofthe probability that different sets of words (e.g., “experience,” “sale,” “price”) appear indifferent pages of advertisements, conditional on the topic of the ad. Since each documentpage of advertisements contains a collection of words, the model will allow us to compute theprobability that any one page of advertisements is comprised of job ads. Roughly put, the
7

Table 1: Results of the LDA ModelTopic 1 Topic 2 Topic 3 Topic 4 Topic 5system reg car day streetexperi save price free opencomput store new new incopportun size auto one ave
year price power call massNotes: The table provides the top five word stems for each of the five topics in our estimated LDAmodel performed on the Boston Globe display ad subsample.
model identifies sets of words that frequently appear together in the same documents withina text corpus. For example, if there were only two types of ads in our newspaper data, jobads or sales ads, one set of ads would be characterized by containing the words “experience,”“years,” or “opportunity.” A second set of ads would be characterized by containing thewords “store,” “save,” or “price.”
To construct our LDA model, we take samples of pages of advertisements for each of ournewspapers, separately: display ads in the Boston Globe, spanning 1960 to 1983; display adsin the New York Times, from 1940 to 2000; classified ads in the Boston Globe, from 1960to 1983; classified ads in the New York Times, from 1940 to 2000; and classified ads in theWall Street Journal, spanning 1940 to 1998.8
As an example of the partial output from our estimated model, Table 1 lists word stemswhich have the highest conditional probability of appearing in each of the five topics in ourmodel. This model was estimated from pages of display ads appearing in the Boston Globe.9
Words in Topic 1 tend to appear frequently in job ads, while other topics contain wordsprevalent in other types of advertisements.
At this point, each page is defined by a probability distribution over the set of possibletopics. We pick the pages for which the likelihood of belonging to the topic that we a prioriidentify with vacancy postings is greater than 0.40. The choice of the cutoff balances atrade-off between throwing out too many vacancy postings (particularly job ads in sales-
8These time spans correspond to the original data provided to us by ProQuest. While the data set whichwe have posted online contains data starting in 1940, throughout this paper we restrict attention to job adswhich were published beginning in 1960. We make this restriction since the focus of our paper is on theimplications of occupations’ task content on increasing labor income inequality, which began in earnest onlyin the 1960s.
9Computing the LDA model requires us to specify the number of topics present in the text. Since there islittle a priori guidance in determining the optimal number of topics, for each source we choose the number oftopics, one at a time, until we reach the largest number of topics which result in only one topic that is relatedto job vacancy postings. In Appendix C.1, we present the tables of predictive words for each newspaper inour sample.
8

related occupations) and including too many non-job ads in our data set.10 Appendix C.1provides additional details regarding the LDA procedure, in general, and the applicationof this procedure to our particular problem. See, also, Blei, Ng, and Jordan (2003) andHoffman, Blei, and Bach (2010).11
Discerning the boundaries between vacancy postings and identifying each adver-tisement’s job title. In the ProQuest data set, the advertisements on a single page areall grouped in a single text field. Our next task is to identify when one vacancy posting endsand a second posting begins. Here, certain phrases at the beginning or end of individualhelp wanted ads allow us to identify the boundaries between ads. In particular, we use arule that relies on certain common patterns across ads and relies on the presence of (i) streetaddresses, (ii) certain phrases (e.g., “send [...] resume” or “equal opportunity employer”),and (iii) the formatting of job titles. To search for job titles, we look for lines of text thatare either i) all capitalized or ii) only one or two words appear. Within these lines, we searchfor words which appear in O*NET’s “Sample of Reported Job Titles.” If there is a match,we record the contents of the lines as the ad’s job title.
Sample of results Table 2 presents the result of our procedure applied to the unprocessedtext from Figure 1. At least in this small snippet of text, our algorithm is able to correctlyparse job titles and identify the boundaries between the three advertisements. In identifyingthe boundary between the first and second ad, line breaks before “payments clerks” werehelpful. In addition to these line breaks, an address—82 Devonshire Street, Boston MA02109—helps identify the boundary between the second and third job posting. Finally, ourspell-checker is able to fix some transcription errors. At the same time, even after processing,a few transcription errors remain. Moreover, because part of the text of the first job adappears before the job title, it is not included with the remaining text for the “mutual fundsclerks” position.
To sum up, our process allows us to transform unstructured text into a set of distinctjob ads and undo a portion of the error induced by ProQuest’s optical character recognitionsoftware. However, since our efforts to process the text are imperfect, our resulting data setwill necessarily contain some measurement error. Still, as we will demonstrate in Section3, given the massive number of vacancy postings which we have been able to process, our
10In practice, the model assigns low probabilities to intermediate likelihood values, and so the errors wemake are relatively insensitive to our choice of cutoff.
11Within economics, we are aware of one application of LDA, which classifies Federal Open Market Com-mittee statements by topic. See Fligstein, Brundage, and Schultz (2014) and Hansen, McMahon, and Prat(2014).
9

Table 2: Processed Text from the Boston Globe, November 4, 1979, Display Ad #133job title text
rapid growth through continued innovation and diversification If you arehighly motivated person who takes pride in your work and the company youwork for consider career with Fidelity
mutualfunds clerks
individuals with 1 2 years funds transfer experience to process Keogh IRAaccounts and adjustments
paymentsclerks
varied Les processing new account applications and payments stir nt fltnear fr NLRB ct t fl mnirk and maintaining client strong record keeping 50wpm data control department sorting and brokerage environments with benefitspackage for our Boston convenient to the market gr Willie lu5lty success l1 q1 a1 ol p 1sl1 vmplov fidelity group 82 devonshire street Boston ma 02109
terminaloperators
position involves typing policy related information into computer terminalno previous computer experience required typing 5055 wpm excellent benefitsplus work incentive program in addition to starting salary of 150 165
Notes: The table presents text from the first three of the 12 vacancy postings in a page of display ads in theBoston Globe.
database is still quite informative about occupations and their characteristics.
2.2 Grouping Occupations by SOC Code
Our next step is to consolidate the information in our vacancy postings to characterize occu-pations and their corresponding attributes into a small number of economically meaningfulcategories. In the newspaper data, postings for the same occupation appear via multiple dis-tinct job titles. For example, vacancy postings for registered nurses will be advertised usingjob titles which include “rn,” “registered nurse,” or “staff nurse.” These job titles should allmap to the same occupation — 291141 using the BLS Standard Occupational Classification(SOC) system.
From our list of job titles, we apply two complementary methods to group ads accordingto their SOC codes. First, for the most common 1000 job titles from our Boston Globe, NewYork Times, and Wall Street Journal job ads, we map the titles to their SOC codes usingwww.onetsocautocoder.com. These top 1000 job titles cover 2.2 of the 6.6 million ads fromthe previous subsection’s processed newspaper data.
For the remaining ads, we apply a continuous bag of words (CBOW) model, in combina-tion with an ancillary data set provided to us by EMSI, to attempt to identify the ad’s SOCcode.12 Roughly put, this CBOW model allows us to find synonyms for words or phrases
12While onetsocautocoder.com is a useful, accurate tool to retrieve commonly occurring job titles, thereare hundreds of thousands of unique titles occurring in at least two postings in our newspaper data, which
10

based on the idea that words or phrases are similar if they themselves appear (in text cor-pora) near similar words. For example, to the extent that “nurse,” “rn,” and “staff nurse” alltend to appear next to words like “patient,” “care,” or “blood” one would conclude that “rn”and “nurse” have similar meanings to one another. For additional background on CBOWmodels, and details on our implementation, see Appendix C.3.
This CBOW model is useful since we have an ancillary data set containing a large cor-respondence between job titles and SOC codes. EMSI has provided us a data set of thetext from online job ads, originally posted between April 2011 and March 2017. These adscontain a job title, a SOC code, and text describing the job characteristics and requirements.We use the online job postings from two of these months, January 2012 and January 2016,plus all of the text from our newspaper data to construct our CBOW model. We use thismodel at different points in the paper to find synonyms for words or phrases. At this stage,our CBOW model allows us to identify the closest job title in the EMSI data set for each jobtitle in our newspaper text. Since job titles in the EMSI data set have an associated SOCcode, we can obtain the SOC code for any job title in our newspaper text. We retrieve theseSOC codes on all of the job titles which appear at least twice in our newspaper text. Incombination with the first approach, we have been able to collect SOC codes for 4.1 millionjob ads.
2.3 Eliciting Skill- and Task-Related Information
Within the body of our job ads, we will map similar words to a common task or skill. For ex-ample, mathematical skills could appear in job ads using the words “mathematics,” “math,”or “quantitative.” To study occupations’ evolving skill requirements and task content, it isnecessary to categorize not only job titles, but also these occupational characteristics into amanageable number of groups. We follow four approaches, which we explain next.13
Our main classification follows that of Spitz-Oener (2006) who, in her study of the chang-ing task content of German occupations, groups survey questionnaire responses into five cat-egories: nonroutine analytic, nonroutine interactive, nonroutine manual, routine cognitive,and routine analytic.14 In our main application of these categories, we begin with the list of
makes manually retrieving them infeasible.13Throughout this paper, we interpret the words as accurate representations of the positions the firms seek
to fill. We cannot measure the extent to which firms may misrepresent or perhaps euphemize the tasks of thejob to attract workers. A similar consideration, however, is also relevant for survey-based measures of tasks,where respondents may or may not accurately answer questions about their job’s tasks (Autor, 2013). Ouranalysis is unaffected by level differences job descriptions’ accuracy, and would only be affected by trends inthe representation of jobs over time.
14The data set used in Spitz-Oener (2006) is a questionnaire given to West German workers. Building on
11

words related to each of her five tasks. For each task, we augment the list with words whosemeanings are similar to those in the original list, where similarity is determined by a CBOWmodel. This is our primary classification, and we use it in each empirical exercise that fol-lows in the paper. In addition, as a robustness check, we will consider a narrower mappingbetween categories and words, one which only relies in Spitz-Oener (2006)’s definitions asenumerated in footnote 14.
We also consider three complementary task classifications, for the purpose of (i) explor-ing the robustness of our results to our primary choice of classification; (ii) comparing ourtext-based measures with widely-used survey-based measures; and (iii) connecting our mainresults to those in the literature. First, with the aim of validating our data set, we mapour text to O*NET’s work styles, skills, knowledge requirements, and work activities (corre-sponding to O*NET Elements 1C, 2A and 2B, 2C, and 4A, respectively). For each O*NETElement, we begin by looking for words and phrases related to the O*NET Title and, referto the O*NET Element Description to judge whether these synonyms should be included,as well as if other words should be included. As a second approach, we append to our initiallists of words and phrases an additional set of words, using our continuous bag of wordsmodel. Each of the two approaches, the “judgment-based” procedure and the “continuousbag of words model-based” procedure of identifying similar words, has its strengths andweaknesses. On the one hand, the first procedure is clearly ad hoc. Moreover, the continu-ous bag of words model has the advantage of accounting for the possibility that employers’word choice may differ within the sample period.15 On the other hand, there is a dangerthat the bag of words model will identify words as synonymous even if they are not.
Second, for the purpose of mapping our new task measures to changes in wage inequal-
her mapping from survey question titles to task categories, we search for the following sets of words for eachcategory: 1) nonroutine analytic: analyze, analyzing, design, designing, devising rule, evaluate, evaluating,interpreting rule, plan, planning, research, researching, sketch, sketching; 2) nonroutine interactive: adver-tise, advertising, advise, advising, buying, coordinate, coordinating, entertain, entertaining, lobby, lobbying,managing, negotiate, negotiating, organize, organizing, presentation, presentations, presenting, purchase,sell, selling, teaching; 3) nonroutine manual: accommodate, accommodating, accommodation, renovate, ren-ovating, repair, repairing, restore, restoring, service, serving; 4) routine cognitive: bookkeeping, calculate,calculating, correcting, corrections, measurement, measuring; 5) routine manual: control, controlling, equip,equipment, equipping, operate, operating.
15For instance, even though “creative” and “innovative” largely refer to the same occupational skill, it ispossible that their relative usage among potential employers may differ within the sample period. This isindeed the case: Use of the word “innovative” has increased more quickly than “creative” over the sampleperiod. To the extent that our ad hoc classification included only one of these two words, we would bemis-characterizing trends in the O*NET skill of “Thinking Creatively.” The advantage of the continuousbag of words model is that it will identify that “creative” and “innovative” mean the same thing becausethey appear in similar contexts within job ads. Hence, even if employers start using “innovative” as opposedto “creative” part way through our sample, we will be able to consistently measure trends in “ThinkingCreatively” throughout the entire period.
12

ity, we map our text to that in Firpo, Fortin, and Lemieux (2014). Firpo, Fortin, andLemieux categorize Work Activities and Contexts into five groups: Information Content,Automation/Routine, Face-to-Face Contact, On-Site Job, and Decision-Making.16 Our lastmapping is to skills in Deming and Kahn (2017)’s study of the relationship between firms’characteristics and the skill requirements in their vacancy postings, which we explore in theAppendix to provide complementary results.
2.4 Descriptive Statistics
Using the text from the Boston Globe, New York Times, and Wall Street Journal, our algo-rithm from Section 2.1 results in a data set with 6.6 million vacancy postings.17 Among thesevacancy postings, we have been able to retrieve a SOC code for 4.1 million ads. Table 3 liststhe top occupations in our data set. The first two columns list common job titles among the6.6 million total vacancy postings, while the last four columns present the top SOC codes.Across the universe of occupations, our newspaper data represents a broad swath of Manage-ment, Business, Computer, Engineering, Life and Physical Science, Healthcare, Sales, andAdministrative Support occupations, but it under-represents Construction occupations andoccupations related to the production and transportation of goods. See Appendices A andB for an analysis of the representativeness of our newspaper data relative to the decennialcensus and CPS. (These latter data sets we access via Ruggles, Genadek, Goeken, Grover,and Sobek, 2015.)
Table 4 presents, for each task in Spitz-Oener (2006)’s classification, the most task-intensive occupations. Occupations which are intensive in nonroutine analytic tasks are con-centrated in Architectural and Engineering occupations (SOC codes beginning with “17”)and Life, Physical, and Social Science Occupations (SOC codes beginning with “19”). Man-agement (“11”) and Sales (“41”) occupations mention nonroutine interactive tasks frequently,while customer-service and maintenance related occupations (in a variety of SOC groups)have high nonroutine manual task intensities. Routine cognitive and routine manual task-related words are mentioned frequently in advertisements for clerical and production-relatedpositions.
16See Appendix Table A.2 of Firpo, Fortin, and Lemieux (2014) for the mapping between their taskgroups and O*NET Work Activities and Work Contexts. Since our constructed data set includes only workactivities, our corresponding measures of Firpo, Fortin, and Lemieux (2014)’s O*NET groups are based onlyoff of work activity variables, and since the Automation/Routine task group is defined only by to O*NETwork contexts, we will not be able to measure this variable.
17This 6.6 million figure excludes vacancy postings for which we cannot identify the job title or whichcontain a substantial portion, 35 percent or greater, of misspelled words. We also exclude ads with fewerthan 15 words.
13
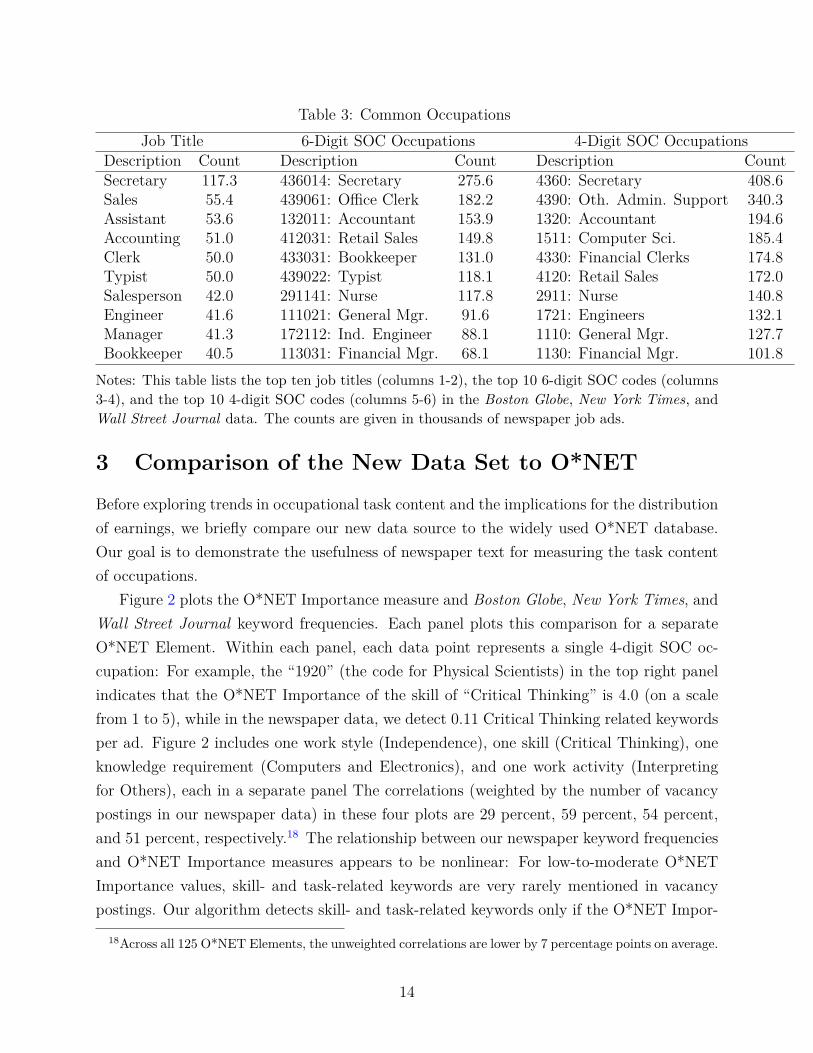
Table 3: Common OccupationsJob Title 6-Digit SOC Occupations 4-Digit SOC Occupations
Description Count Description Count Description CountSecretary 117.3 436014: Secretary 275.6 4360: Secretary 408.6Sales 55.4 439061: Office Clerk 182.2 4390: Oth. Admin. Support 340.3Assistant 53.6 132011: Accountant 153.9 1320: Accountant 194.6Accounting 51.0 412031: Retail Sales 149.8 1511: Computer Sci. 185.4Clerk 50.0 433031: Bookkeeper 131.0 4330: Financial Clerks 174.8Typist 50.0 439022: Typist 118.1 4120: Retail Sales 172.0Salesperson 42.0 291141: Nurse 117.8 2911: Nurse 140.8Engineer 41.6 111021: General Mgr. 91.6 1721: Engineers 132.1Manager 41.3 172112: Ind. Engineer 88.1 1110: General Mgr. 127.7Bookkeeper 40.5 113031: Financial Mgr. 68.1 1130: Financial Mgr. 101.8
Notes: This table lists the top ten job titles (columns 1-2), the top 10 6-digit SOC codes (columns3-4), and the top 10 4-digit SOC codes (columns 5-6) in the Boston Globe, New York Times, andWall Street Journal data. The counts are given in thousands of newspaper job ads.
3 Comparison of the New Data Set to O*NET
Before exploring trends in occupational task content and the implications for the distributionof earnings, we briefly compare our new data source to the widely used O*NET database.Our goal is to demonstrate the usefulness of newspaper text for measuring the task contentof occupations.
Figure 2 plots the O*NET Importance measure and Boston Globe, New York Times, andWall Street Journal keyword frequencies. Each panel plots this comparison for a separateO*NET Element. Within each panel, each data point represents a single 4-digit SOC oc-cupation: For example, the “1920” (the code for Physical Scientists) in the top right panelindicates that the O*NET Importance of the skill of “Critical Thinking” is 4.0 (on a scalefrom 1 to 5), while in the newspaper data, we detect 0.11 Critical Thinking related keywordsper ad. Figure 2 includes one work style (Independence), one skill (Critical Thinking), oneknowledge requirement (Computers and Electronics), and one work activity (Interpretingfor Others), each in a separate panel The correlations (weighted by the number of vacancypostings in our newspaper data) in these four plots are 29 percent, 59 percent, 54 percent,and 51 percent, respectively.18 The relationship between our newspaper keyword frequenciesand O*NET Importance measures appears to be nonlinear: For low-to-moderate O*NETImportance values, skill- and task-related keywords are very rarely mentioned in vacancypostings. Our algorithm detects skill- and task-related keywords only if the O*NET Impor-
18Across all 125 O*NET Elements, the unweighted correlations are lower by 7 percentage points on average.
14

Table 4: Top Occupations by Spitz-Oener (2006) Task CategoryNonroutine Analytic Nonroutine Interactive
1720: Engineers 69.3 0.89 1120: Sales Managers 70.1 1.111721: Engineers 132.1 0.89 4140: Sales Rep., Whole./Man. 64.1 0.801930: Social Scientists 5.2 0.70 4130: Sales Rep., Services 100.4 0.641910: Life Scientists 9.0 0.69 1110: Top Executives 127.7 0.611311: Business Operations 71.3 0.69 4120: Retail Sales 172.0 0.60
Nonroutine Manual Routine Cognitive4930: Vehicle Mechanics 28.0 0.38 4330: Financial Clerks 174.8 0.224910: Maintenance Supervisors 14.1 0.29 4390: Other Admin. Support 340.3 0.104990: Other Maintenance 31.5 0.29 4320: Commun. Equip. Operators 11.0 0.094920: Electrical Mechanics 6.7 0.26 4310: Administrative Support 42.1 0.094340: Record Clerks 32.3 0.20 3730: Grounds Maintenance 1.4 0.08
Routine Manual5140: Metal and Plastic 32.0 0.144990: Other Maintenance 31.5 0.075141: Metal and Plastic 13.0 0.064722: Construction Trades 2.6 0.055120: Assemblers & Fabricators 9.8 0.05
Notes: This table lists the top five 4-digit occupations according to the frequency with whichdifferent activity-related words are mentioned. Within each panel, the first column gives the SOCcode and title; the second column gives the number of job ads in our data set (in thousands); andthe final column gives the frequency (mentions per vacancy posting) of task-related words. Onlyoccupations with at least 200 advertisements, representing 104 4-digit SOC codes, are included.
tance measures are sufficiently high, above 3 or 3.5.The four relationships depicted in Figure 2 are broadly representative of the concordance
between O*NET Importance measures and our vacancy postings’ keyword frequencies: Thecorrelation between our measures and existing O*NET measures of occupational work styles,skill, knowledge requirement, and activity measures are, for the most part, in the 0.40 to0.70 range, and are somewhat higher for knowledge requirements, skills, and activities (wherethe mean correlations are 0.58, 0.54, and 0.50, respectively) than for work styles (where themean correlation is 0.33).19
19While we view O*NET as a useful and reliable benchmark, it too has its issues, which extend beyond itsinability to track within-occupation changes in job characteristics over long time horizons. In their reviewof the design of the O*NET data collection program, the National Research Council (2010) identify severalaspects of O*NET which may limit its usefulness as a research tool. Summarizing these issues, Autor (2013)writes that both the Dictionary of Occupational Titles and O*NET “job content measures are often vague,repetitive, and constructed using ambiguous and value-laden scales that are likely to confuse respondents”(p. 191). We should neither expect nor hope that our measures exactly align with O*NET measures, but weinterpret the correlations as reassuring evidence that the newspaper text is a valuable source of task data.
15

Figure 2: O*NET Importance Measures and Newspaper Keyword Frequencies
1110
1120
1130
1131
1190
1191
1310
1311
1320
1511
1520
1710
1720
1721
1730
19101920
1930
1940
2110
2120
2310
23202510
2511252025302540
2590
2710
2720
2730
27402910
2911
2920
2990
31103120
31903310
3320
3330
3390
3510
352035303590
37103720
3730
3910
3920
3930
39503960
3970
3990
41104120
4130
4140
41904310
4320
4330
43404341
4350
4360
4390
4391
45104520
4530
471047204721
4722
4730
47404750
49104920
4930
4990
5110
5120
5130
5140 5141
51515160
5170
518051905191
5310
53205330
5340
5350
53605370
53710.0
05
.01
.015
.02
.025
New
spaper
Fre
quency
1 2 3 4 5O*NET Importance
Style, Independence: 1.C.6
11101120
1130
1131
11901191
1310
1311
1320
15111520
1710
17201721
1730
1910
1920
19301940
21102120
23102320
25102511
2520253025402590
2710 27202730
2740 2910
29112920
2990
31103120
3190
3310
3320
3330
3390
3510
35203530
3590
3710
37203730 3910
3920 3930 39503960
39703990
41104120
41304140
4190
4310
43204330
4340
43414350
4360
43904391
45104520
45304710472047214722473047404750
49104920
49304990
51105120
51305140
5141515151605170 518051905191
5310
53205330
5340
5350
5360537053710
.05
.1N
ew
spaper
Fre
quency
1 2 3 4 5O*NET Importance
Skill, Critical Thinking: 2.A.2.a
111011201130
1131
119011911310
1311
1320
1511
1520
1710
1720
1721
1730
1910
1920
1930
1940
211021202310
2320
2510
2511
25202530 25402590
2710
2720
27302740
29102911
2920
2990
3110 3120 319033103320 3330
3390 35103520
35303590
37103720
3730 39103920
3930
3950 39603970
3990 41104120 4130
4140 41904310
43204330
4340
4341
4350
43604390 4391451045204530
4710
4720
47214722
4730
4740
4750
4910
4920
4930
4990
5110
5120
5130
5140
5141515151605170
518051905191
531053205330
5340
5350
5360
5370
5371
0.5
11.5
New
spaper
Fre
quency
1 2 3 4 5O*NET Importance
Knowledge, Computers & Electronics: 2.C.3.a
11101120
1130
1131
1190
1191
1310
1311
1320
1511
1520
1710
1720
1721
1730
1910
1920
19301940
21102120 23102320
2510
2511
2520
2530
2540
2590
2710
2720
2730
2740 29102911
2920
2990
31103120 3190
3310
3320
3330
339035103520
35303590
3710
37203730
39103920
3930
39503960
3970
399041104120
4130
4140
4190
4310
43204330
4340
4341435043604390
4391
4510
4520
4530471047204721
47224730
4740
4750
4910
4920
49304990
5110
5120
5130 5140
514151515160 5170
5180
5190
5191
53105320
53305340
5350
53605370
5371
0.0
5.1
.15
New
spaper
Fre
quency
1 2 3 4 5O*NET Importance
Activity, Interpreting for Others: 4.A.4.a.1
Notes: Each panel corresponds to one O*NET element. In each panel, each point represents a SOCcode. The value of the x-axis represents the O*NET Importance measure (from version 20.1 ofthe O*NET database). The y-axis measures the number of keyword appearances per job ad, usingdata from the Boston Globe, New York Times, and Wall Street Journal.
4 Trends in Tasks
In this section, we document trends in occupational tasks from 1960 to 2000. The mainresults from these exercises are that i) between the 1960s and 1990s words related to non-routine interactive and analytic tasks have increased in frequency, while words related toroutine manual and cognitive tasks have decreased in frequency, and ii) a large fraction ofthese changes are due to changes within occupations, rather than changes in employmentshares across occupations. Lastly, we compare trends for three particular groups of occupa-tions and show that our results resonate with previous findings in the literature.
4.1 Overall Trends
Table 5 present changes in task-related keywords, grouped according to the definitions intro-duced in Spitz-Oener (2006). The first column lists the task groups, while columns 2 through
16

Table 5: Trends in Keyword FrequenciesFrequency Within
60-64 65-69 70-74 75-79 80-84 85-89 90-94 95-00 ShareNonroutine 3.19 3.50 3.33 3.63 3.93 3.86 4.63 5.48 0.89Analytic [3.16] [3.47] [3.27] [3.49] [3.71] [3.50] [4.32] [5.22] (0.04)
Nonroutine 4.94 4.56 4.57 5.18 5.84 5.97 6.56 7.03 0.94Interactive [4.94] [4.52] [4.44] [5.07] [5.85] [5.71] [6.29] [6.89] (0.05)
Nonroutine 2.50 2.36 2.08 2.54 2.59 2.63 2.59 2.73 1.49Manual [2.52] [2.40] [2.04] [2.56] [2.65] [2.67] [2.54] [2.86] (0.68)
Routine 1.00 0.91 0.69 0.65 0.74 0.71 0.59 0.54 0.98Cognitive [0.99] [0.90] [0.67] [0.61] [0.73] [0.76] [0.61] [0.54] (0.04)
Routine 0.70 0.58 0.45 0.42 0.27 0.15 0.10 0.07 0.97Manual [0.71] [0.60] [0.51] [0.50] [0.31] [0.18] [0.11] [0.10] (0.04)
Notes: Occupations are defined using the 4-digit SOC classification. For each column, we computeaverage keyword frequencies (across occupations) for each five-year period. In these averages,occupations are weighted according to the number of workers in the decennial census, interpolatingwithin-decade observations using counts from the 1960, 1970, 1980, 1990, and 2000 censuses. Thenumbers without square brackets represent the average keyword frequency in each five-year period.The numbers in square brackets represent the keyword frequencies which would prevail, holdingfixed the number of workers in each occupation according to their values in 1960. The final “WithinShare” column gives the ratio of the 1960-64 to 1995-2000 change according to the within-occupationcomponent relative to the 1960-64 to 1995-2000 overall change. In this final column, the term withinparentheses gives the bootstrapped (re-sampling ads from our newspaper text) standard errors ofthe “Within Share.”
9 compute two measures of task content, broken down in five year periods. The measureat the top of each row, which we interpret as the aggregate task content in the economy,presents average mentions in each occupation using census employment shares as weights.According to this measure, mentions of nonroutine tasks increased between the early 1960sand late 1990s by 54 percent for analytic tasks (3.19 versus 5.48 mentions per thousand adwords), 35 percent for nonroutine analytic tasks, and 9 percent for nonroutine manual tasks.Conversely, the largest decline in keyword frequency occurred for words related to routinemanual tasks, decreasing from 0.70 to 0.07 mentions per thousand ad words. The decline ofroutine cognitive tasks is also considerable, going from 1.00 to 0.54 mentions per thousandwords.
These changes reflect both between-occupation and within-occupation changes in task-related keywords. To assess the relative importance of between- versus within-occupationforces in shaping these trends, we decompose changes in the aggregate content of each task
17

according to the following equation:
T t − T 1960 =∑j
ϑj,1960(T̃jt − T̃j,1960
)+∑j
(ϑj,t − ϑj,1960) T̃jt. (1)
In this equation, T̃jt is a measure of task-related word frequency in postings for occupationj in year t. The ϑjt terms measure the share of workers in occupation j at time t, while T tdenotes the share-weighted average frequency of the task-related word at time t. On the right-hand side of Equation 1, the first sum represents the change in overall keyword frequenciesdue to within-occupation changes in task-related word mentions. The second sum representsthe contribution of changes in the share of workers in different occupations on overall keywordfrequencies. We use a 4-digit SOC classification to perform this decomposition separatelyfor each of the five tasks introduced in Spitz-Oener (2006). The final column of Table 5 liststhe proportion of the overall changes in keyword frequencies, comparing the 60-64 columnto the 95-00 column, which are due to the within-occupation component. For every task,within-occupation changes account for a predominant share of the overall changes.
Sensitivity Analysis
In Appendix D we consider the sensitivity of the results given in Table 5 to the mapping ofwords to tasks, as well as to the level of detail of the occupation codes used.
First, we recompute Table 5 with Spitz-Oener (2006)’s original mapping between tasksand words (i.e., excluding the words which we have appended from our continuous bag ofwords model). Second, we consider two alternate measures of occupational characteristics,one introduced by Firpo, Fortin, and Lemieux (2014) and the other by Deming and Kahn(2017). Using each of these three alternate measures of occupational characteristics, thepredominant share of the overall changes in occupational characteristics occurs within ratherthan between 4-digit SOC codes.
The extent to which between-occupation changes are responsible for overall changes inkeyword frequencies may potentially be sensitive to the coarseness of occupation defini-tions. If occupations are coarsely defined, one will tend to estimate that between-occupationchanges are relatively unimportant. In a second robustness check, we re-estimate Equation1 first using a 6-digit SOC codes to classify occupations and alternatively using individualjob titles to classify occupations. Instead of a median within share of 0.97, which we obtainfrom averaging over the final columns of Table 5, one would arrive at a median within shareof 0.99 with a 6-digit classification and 0.68 with a job-title-based classification. For all threeclassifications, within-occupation changes are the primary source of the overall shift in taskcontent.
18

Figure 3: Task Measures: Managers and All Occupations
NonroutineInteractive
Working w/ Public+ Coaching+ Estab. Relationships+
Building Teams0
510
15
20
Fre
quency o
f ta
sk−
word
s (
per
1000 a
d w
ord
s)
1960 1970 1980 1990 2000Year
Notes: The figure above plots the average number of task-related word mentions for two differenttypes of tasks, both for managerial occupations (dashed lines) and for all occupations (solid lines).We apply a local polynomial smoother. Managerial occupations are defined as those with a SOCcode between 1100 and 1199.
4.2 Narratives of Occupational Change
In this section, we present three vignettes that demonstrate how individual occupation groupshave evolved over our sample period. Our goal is to provide concrete, illustrative examplesof occupational change, through the lens of our task and skill measures. We emphasize thatthese examples represent a portrait of long-run occupational change that was previouslyunobserved by researchers.
In Figure 3, we present two separate task measures for managerial occupations (in thick,dashed lines) and all occupations (in thin, solid lines). Between 1960 and 2000, the frequencyof words related to nonroutine interactive tasks in managerial occupations increased by ap-proximately one-third, from 7.5 to 10.0 mentions per 1000 ad words.20 This measured trendaligns with the National Research Council (1999)’s characterization of the changing natureof managerial work. Summarizing the contemporaneous literature, the National ResearchCouncil (1999) write that trends in managerial work involve “the growing importance ofskills in dealing with organizations and people external to the firm, .... the requirement that[managers] ‘coach’... and facilitate relations between workers.” (pp. 137-138) Motivated bythis characterization, we also plot trends in the mentions of four O*NET work activities:
20While it is true that some of these changes reflect trends in the relative sizes of different managerialoccupations, in Appendix D.3 we plot changes in task intensities within 4-digit SOC occupations. The resultslook quite similar.
19

Figure 4: Task Measures: Office Clerks and All Occupations
NonroutineInteractive
RoutineCognitive
02
46
8F
requency o
f ta
sk−
word
s (
per
1000 a
d w
ord
s)
1960 1970 1980 1990 2000Year
Notes: Office clerical occupations are those which have a SOC code between 4330 and 4341. Weapply a local polynomial smoother. Averages across all occupations are depicted as the solid lines,and those across office clerical occupations are plotted as dashed lines.
Working with the Public (O*NET Element 4.A.4.a.3), Establishing and Maintaining Re-lationships (4.A.4.a.4), Building Teams (4.A.4.b.2), and Coaching (4.A.4.b.5). Mentions ofthese four activities increased by more than 50 percent in managerial occupations, increasingmore quickly than for the workforce as a whole. In sum, while interactive tasks have alwaysbeen a requirement for managerial occupations, the importance of such tasks has widenedsince 1960.
Second, Figure 4 contrasts trends in tasks measures for office clerks compared to all oc-cupations. While mentions of routine cognitive tasks has decreased for both office clerks andmore generally for all occupations, the drop off has been more pronounced in clerical posi-tions. Concurrently, the frequency of nonroutine interactive task-related words has increasedin clerical ads roughly at the same pace as in other occupations. Both trends are consistentwith Autor (2015)’s account of changes experienced by bank tellers (one particular officeclerk occupation). He writes: “Increasingly, banks recognized the value of tellers enabled byinformation technology, not primarily as checkout clerks, but as salespersons, forging rela-tionships with customers and introducing them to additional bank services like credit cards,loans, and investment products.” (p. 7) (Unplotted, the frequency of nonroutine analytic-related keywords increased in office clerical occupations, partially closing the gap betweenthese occupations and others.) Hence, much of the overall decline in routine cognitive tasksoccurred in occupations like clerical occupations that were previously specialized in thesetasks. The remaining jobs in these occupations increasingly contain nonroutine analytic and
20

Figure 5: Task Measures: Non-Supervisory Production Workers and All Occupations
NonroutineAnalytic
RoutineManual
01
23
45
Fre
quency o
f ta
sk−
word
s (
per
1000 a
d w
ord
s)
1960 1970 1980 1990 2000Year
Notes: Non-supervisory production occupations have an SOC code between 5120 and 5199. Weapply a local polynomial smoother. Averages across all occupations are depicted as solid lines, andthose across non-supervisory production occupations are plotted as dashed lines.
interactive tasks.Finally, compared to the beginning of the sample period, the frequency of routine man-
ual tasks has declined considerably, particularly in non-supervisory production occupations.Figure 5 presents these trends along with changes in the frequency of nonroutine analytictask related words. Nonroutine analytic task keywords have been increasingly mentioned injob ads for production workers. The trends in keyword frequencies in this figure are con-sistent with case studies of manufacturers’ adoption of new information technologies (e.g.,Bartel, Ichniowski, and Shaw, 2007). These new technologies substitute for workers whowere previously performing routine manual tasks. The surviving production workers arethose who have high levels of technical and problem-solving skills.
5 Implications for the Earnings Distribution
In this section, we use our new time-varying task measures to explore the implicationsof changes in occupations’ task content for the earnings distribution. First, we bring ourmeasures of occupations’ task content to the decomposition methods of Fortin, Lemieux, andFirpo (2011). The goal of this exercise is to determine which occupational characteristicsaccount for changes in the distribution of earnings between 1960 and 2000. Next, in Section5.2, we develop a framework for interpreting occupations as a bundle of tasks. We embedthis framework into a quantitative general equilibrium model of occupational sorting based
21

on comparative advantage (akin to Heckman and Sedlacek, 1985, Heckman and Scheinkman,1987, or more recently Burstein, Morales, and Vogel, 2015). We estimate this model andthen use it to quantify the impact of changes in the demand for tasks on earnings inequality.
We view the two approaches as complementary methods for understanding the sourcesof increasing inequality, each approach with its own advantages and disadvantages. Thestatistical decompositions developed by Firpo, Fortin, and Lemieux (2014) are a flexibleaccounting device, helpful in determining whether observable characteristics of workers andoccupations can account for changes in the earnings distribution. But it has some limitations.One is that the residual in the wage equation contains the contribution to wages of workers’sorting optimally across occupations. A second limitation resides in the interpretation of thedecomposition in the face of general equilibrium adjustments. As noted by Firpo, Fortin,and Lemieux (2014), in response to a shock to the task demands, worker mobility acrossoccupations will tend to limit changes in occupation prices, and this approach will attributewage variation to changes in the returns to skills. Our Section 5.2 model is designed tograpple both with occupational sorting and general equilibrium effects. On the other hand,the model imposes parametric assumptions on workers’ idiosyncratic ability to work in eachpotential occupation. Despite their differences, both approaches demonstrate that changes inoccupations’ task content generate a large fraction of the increase in 90-10 earnings inequalityobserved between 1960 and 2000.
5.1 Decompositions Using RIF Regressions
In this section, we perform a statistical decomposition due to Fortin, Lemieux, and Firpo(2011) to assess the role of occupations’ task content on earnings inequality. Fortin, Lemieux,and Firpo introduce a method with which to decompose changes in the distribution ofearnings across points in time on the basis of worker and occupational attributes. Thismethod, which can be thought of as an extension of a Oaxaca-Blinder decomposition, breaksdown changes over time in any quantile of the earnings distribution into the contributionof observable changes in worker and occupational characteristics (the “composition” effect)and the contribution of implicit changes in the rewards to those characteristics (the “wagestructure” effect). One can further break down the composition and wage structure effectsinto the parts belonging to each of these characteristics (e.g. worker’s educational attainment,occupational task content, etc.).
The basis of the decomposition is the following specification of workers’ earnings as afunction of their observed characteristics and the tasks of the occupations in which theywork:
22

logWijt = log π0t +H∑h=1
Thjt log πht +K∑k=1
αkS̃kg + log εijt. (2)
In this equation, i is an individual,Wijt is the individual’s wage, and S̃gk is an observable skillcharacteristic k for an individual who is in group g. And, log πht is a regression coefficientthat represents the (log) price of task h in period t.
To perform our decompositions, we compute recentered-influence-function (RIF) regres-sions that describe, for workers in each quantile, the relationship between real log earningsand different occupational and worker characteristics. In these RIF regressions, the coeffi-cient estimates will vary by quantile; coefficient estimates for the 10th and 90th percentiles aregiven in Appendix E.1. The worker characteristics include a race indicator and an indicatorfor marital status, along with education and potential experience categorical variables.21
Our occupational characteristics are the measures based on Spitz-Oener (2006) and Firpo,Fortin, and Lemieux (2014) that we have discussed in Section 4. Since the different taskmeasures (e.g., routine cognitive versus nonroutine interactive) are scaled differently — notonly because employers tend to systematically mention some types of words more frequentlythan others, but also because our algorithm may be better at detecting certain types ofwords than others — it is necessary to standardize our task measures. We normalize Thjt ≡(T̃hjt − µh
)/σh; here µh is the mean and σh is the standard deviation of keyword frequencies
for task group h across years and occupations. Standardizing variables this way eliminatespermanent cross task variation in mentions but retains the ability to do comparisons bothacross occupations at a point in time and within occupations across time.
Decompositions Using Spitz-Oener’s (2006) Classification
We begin by grouping tasks into nonroutine analytic, nonroutine interactive, nonroutinemanual, routine cognitive, and routine manual categories. We highlight the importance of ourtime-varying occupational measures by employing two sets of decompositions. In the first,Thjt is fixed to its sample mean for each occupation-task combination (thus eliminating time
21The education categories are Some High School; High School; Some College (which is the omitted group);College; and Post-graduate. The potential experience categories are defined by ten-year intervals (withindividuals with 20 to 29 years of potential experience belonging to the omitted group.) These educationand potential experience categories are more coarsely defined than in Firpo, Fortin, and Lemieux (2014).We adopt this classification to be consistent with our analysis in Section 5.2.The sample includes only males with age between 16 and 65. We restrict the sample to male workers
since the RIF regression decompositions are ill-equipped to handle the large increase in female labor forceparticipation observed in the first half of our sample period. Appendix E.2 presents our decompositions forsamples that include female workers. When females are included in the sample, the (unexplained) “wagestructure” effects of our task measures are considerably larger in the 1960s, but similar in other decades.The composition effects are also similar to what we report here.
23

Figure 6: Decomposition of Real Log Earnings
−.1
0.1
.2.3
Log W
age D
iffe
rential
0 .2 .4 .6 .8 1Quantile
1960−1970
−.1
0.1
.2.3
Log W
age D
iffe
rential
0 .2 .4 .6 .8 1Quantile
Newspaper, Fixed Newspaper, Variable
Total
1970−1980
−.1
0.1
.2.3
Log W
age D
iffe
rential
0 .2 .4 .6 .8 1Quantile
1980−1990
−.1
0.1
.2.3
Log W
age D
iffe
rential
0 .2 .4 .6 .8 1Quantile
1990−2000
Notes: The thick solid line presents changes in log wage income of workers at different quantiles ofthe income distribution. The thin solid line and the dashed line give the contribution of occupations(combining the composition effects and wage structure effects) using two different measures ofoccupational characteristics.
variation), and in the second, Thjt is allowed to freely vary across time within occupations.Figure 6 presents our decompositions, together with the total change at each percentile
of the distribution, for each decade between 1960 and 2000. The thick solid line shows to-tal observed changes for each percentile. According to the top-left panel, average earningsincreased between 1960 and 1970, with little change in earnings inequality. In the follow-ing decades, from 1970 to 2000, inequality increased more sharply, while average earningsincreased less. To what extent can occupational characteristics account for these changes?
We plot the contribution of occupational task content, combining both the compositionand wage structure effects, in the dashed and thin solid lines in Figure 6. The thin solidline — computed using task measures that are fixed throughout the sample — accountsfor a small part of the changes in the earnings distribution. According to this measure,occupational characteristics account for a 2 percentage point increase in 90-10 inequalitybetween 1960 and 1970 and no change in the 1970s, 1980s, or 1990s.
24
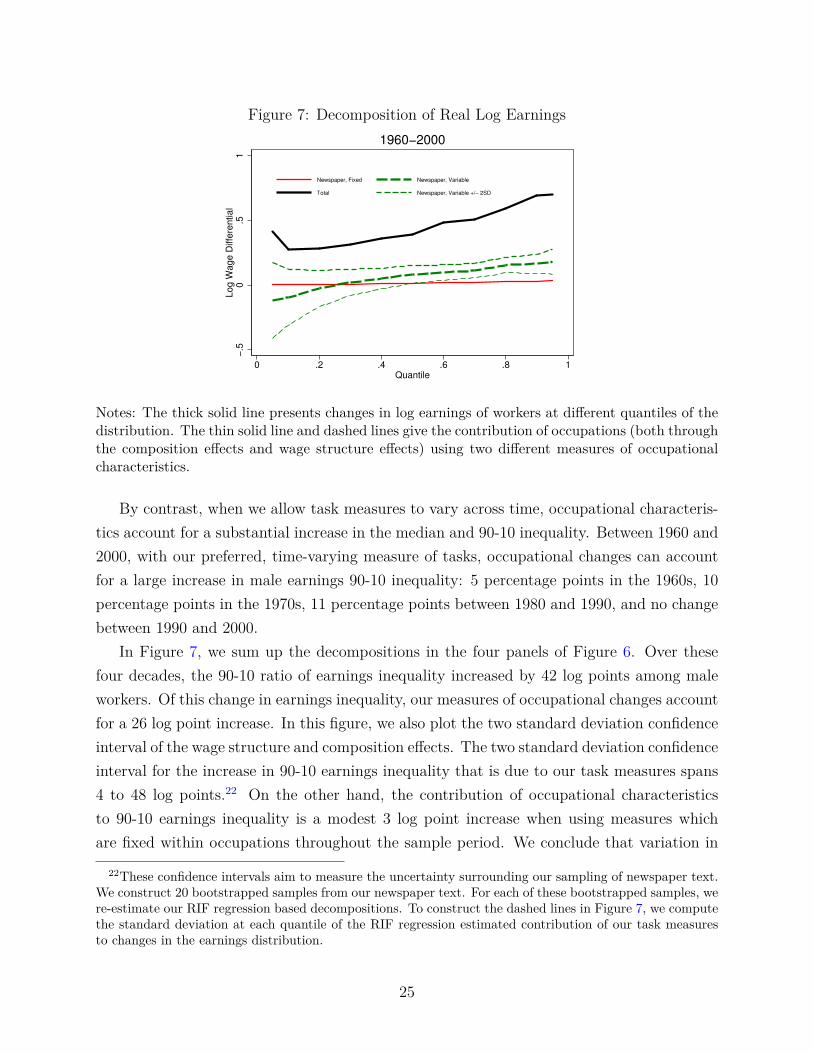
Figure 7: Decomposition of Real Log Earnings
−.5
0.5
1Log W
age D
iffe
rential
0 .2 .4 .6 .8 1Quantile
Newspaper, Fixed Newspaper, Variable
Total Newspaper, Variable +/− 2SD
1960−2000
Notes: The thick solid line presents changes in log earnings of workers at different quantiles of thedistribution. The thin solid line and dashed lines give the contribution of occupations (both throughthe composition effects and wage structure effects) using two different measures of occupationalcharacteristics.
By contrast, when we allow task measures to vary across time, occupational characteris-tics account for a substantial increase in the median and 90-10 inequality. Between 1960 and2000, with our preferred, time-varying measure of tasks, occupational changes can accountfor a large increase in male earnings 90-10 inequality: 5 percentage points in the 1960s, 10percentage points in the 1970s, 11 percentage points between 1980 and 1990, and no changebetween 1990 and 2000.
In Figure 7, we sum up the decompositions in the four panels of Figure 6. Over thesefour decades, the 90-10 ratio of earnings inequality increased by 42 log points among maleworkers. Of this change in earnings inequality, our measures of occupational changes accountfor a 26 log point increase. In this figure, we also plot the two standard deviation confidenceinterval of the wage structure and composition effects. The two standard deviation confidenceinterval for the increase in 90-10 earnings inequality that is due to our task measures spans4 to 48 log points.22 On the other hand, the contribution of occupational characteristicsto 90-10 earnings inequality is a modest 3 log point increase when using measures whichare fixed within occupations throughout the sample period. We conclude that variation in
22These confidence intervals aim to measure the uncertainty surrounding our sampling of newspaper text.We construct 20 bootstrapped samples from our newspaper text. For each of these bootstrapped samples, were-estimate our RIF regression based decompositions. To construct the dashed lines in Figure 7, we computethe standard deviation at each quantile of the RIF regression estimated contribution of our task measuresto changes in the earnings distribution.
25

task content that includes changes within occupations across time can account for a largefraction of the rise in inequality. The contribution of occupational changes coming only fromdifferences in task content between occupations is comparatively smaller.
To better understand the role of occupational changes in accounting for increased inequal-ity, we plot the composition and wage structure effects separately for each newspaper-basedmeasure (Figure 8). Occupational measures in which task measures are fixed yield modestcomposition and wage structure effects. Changes in the composition of tasks, as measuredvia fixed-over-time measures, account for a 6 percentage point increase in 90-10 inequality.On the other hand, the composition effect is substantially larger using our measure in whichoccupations’ task measures vary as time progresses. In fact, for workers above the 90thpercentile of the earnings distribution, these composition effects account for at least a 15percentage point increase in earnings; for workers below the 10th percentile, the same com-position effects account for at least a 17 percentage point decline. In sum, given the largechanges in workers’ activities within occupations that we uncovered in the previous sections,decompositions which rely only on between-occupation changes in task or skill-intensity un-derstate the contribution of composition effects on changes in the earnings distribution.23
In Figure 9, we present the composition and wage structure effects, broken down bytask. The key result from this exercise is that, among the estimated compositional effects,changes in routine manual tasks generate the largest changes in labor income inequality.Nonroutine interactive tasks also contribute to the increase in inequality, although to alesser extent. These composition effects are due to a combination of i) a large decline ineconomy-wide routine manual and cognitive task content and a corresponding increase innonroutine interactive and analytic task content; ii) a stronger association between workers’earnings and their occupations’ tasks (a larger estimated log π) for routine manual tasksat the bottom of the distribution than in the top; and iii) a stronger association betweenearnings and nonroutine interactive task content at the top of the distribution than in thebottom. Finally, changes in the “price” of tasks, as measured by the wage structure effects,account for a 6 percentage point decline in 90-10 inequality.
The U.S. economy experienced several consequential changes since 1960, including dra-matic technological progress and an increasing openness to trade. These developments haveinduced a shift in the composition of tasks which workers perform, and has re-shaped returnsto these tasks. Our results suggest that changes in the task content of occupations translated
23There are analogous wage structure and composition effects for the demographic, experience, and edu-cation variables. We do not plot these here. Throughout the entire distribution, but especially across theright tail of the distribution, the composition effect for education is positive, indicating that increases inmale workers’ educational status is associated with higher earnings and earnings income inequality. Theseresults are consistent with those of Firpo, Fortin, and Lemieux (2014).
26

Figure 8: Decomposition of Real Log Earnings: Composition and Wage Structure−
.4−
.20
.2.4
Log W
age D
iffe
rential
0 .2 .4 .6 .8 1Quantile
Composition
−.4
−.2
0.2
.4Log W
age D
iffe
rential
0 .2 .4 .6 .8 1Quantile
Newspaper, Fixed Newspaper, Variable
Newspaper, Variable +/− 2SD
Wage Structure
Notes: The left panel describes the contribution of occupational characteristics through composi-tional changes. The right panel describes the contribution of occupational characteristics throughwage structure effects.
Figure 9: Detailed Decompositions of Real Log Earnings
−.3
−.2
−.1
0.1
Log W
age D
iffe
rential
0 .2 .4 .6 .8 1Quantile
Composition
−.3
−.2
−.1
0.1
Log W
age D
iffe
rential
0 .2 .4 .6 .8 1Quantile
Nonroutine−Analytic Nonroutine−Interactive
Routine Cognitive Routine Manual
Nonroutine Manual
Wage Structure
Notes: The panels describe the contribution of individual occupational characteristics, throughcompositional changes (left panel) and wage structure effects (right panel) to changes in the earningsdistribution. In this panel, we use the newspaper-based task measures which are allowed to varywithin occupations across time.
27

shocks to trade and technology into widening inequality. Changes in the task returns playeda more modest role. The implication is that, relative to the top of the distribution, the taskswhich declined in importance over the sample period (routine manual tasks) were highlypriced at the bottom of the wage distribution. Concurrently, tasks priced relatively highlyfor high-wage jobs (nonroutine analytic and interactive tasks) increased in importance be-tween 1960 and 2000. A second implication follows from a comparison of the decompositionsbased on fixed and time-varying task content measures. With fixed task content, shifts in thetasks performed by workers can only arise via changes in the prevalence of occupations at dif-ferent points of the distribution. Our decompositions indicate that such between-occupationshifts were of secondary importance in accounting for widening inequality, relative to thelarge within-occupation changes in task content that we have documented.
Decompositions Using Firpo, Fortin, and Lemieux (2014)’s Classification
We now perform a similar set of decompositions using Firpo, Fortin, and Lemieux (2014)’stask classification. Figure 10, analogous to Figure 8, plots the composition and wage struc-ture effects of our technology and offshoring measures on the earnings distribution between1960 and 2000. Here, composition effects account for a 4 log point increase in 90-10 inequal-ity. Wage structure effects account for a more substantial increase in inequality of 31 logpoints. In combination, Firpo, Fortin, and Lemieux (2014)’s task measures account for a 35log point increase in 90-10 inequality.
Using fixed-over-time occupational measures yields much smaller results. Note that be-cause there is a direct mapping between Firpo, Fortin, and Lemieux (2014)’s classificationsand O*NET work activity measures, we can include measures based on O*NET. Resultsfrom decompositions based on our fixed-over-time newspaper task measures mirror thosebased on O*NET’s measures, confirming that our newspaper-based measures track similartask content as those based on O*NET.
Sensitivity Analysis
In the appendices, we consider three sets of exercises to examine the sensitivity of our results.First, in Appendix E.2, we examine the robustness of our benchmark results to changes in theway we construct mappings — from newspaper text to Spitz-Oener’s task groupings, to ourtransformation of the frequency of task-related words to Thjt, and, finally, to the inclusionof women in the sample. Second, given the current discordance between the regions of theUnited States from which we are characterizing occupational characteristics (New York andBoston) and the regions we use to measure workers’ income and demographic variables are
28

Figure 10: Decomposition of Real Log Earnings: Composition and Wage Structure−
1−
.50
.5Log W
age D
iffe
rential
0 .2 .4 .6 .8 1Quantile
Composition
−1
−.5
0.5
Log W
age D
iffe
rential
0 .2 .4 .6 .8 1Quantile
O*NET Newspaper, Fixed
Newspaper, Variable Newspaper, Variable +/− 2SD
Wage Structure
Notes: The left panel describes the contribution of occupational characteristics through composi-tional changes using Firpo, Fortin, and Lemieux (2014)’s task definitions. The right panel describesthe contribution of occupational characteristics through wage structure effects.
measured (the entire U.S.), we re-compute Figures 7 through 10 using only census data fromthe New York and Boston MSAs (see Appendix E.3). Third, in Appendix E.4, we applyhourly wage data from the CPS Merged Outgoing Rotation Group, instead of annual laborincome data from the decennial census, to analyze changes in income inequality.24 Thesethree different samples present a consistent depiction on the relationships between our jobcharacteristics and trends in labor income inequality.
5.2 Decompositions in an Estimated Equilibrium Model
In this section we take an alternative approach to calculating changes in the earnings dis-tribution. We begin with a quantitative model in which workers sort based on comparativeadvantage, along the lines of Burstein, Morales, and Vogel (2015). We consider the effect ofchanges in the parameters of occupations’ production functions, and interpret these changesas reflecting exogenous shifts in the demand for worker-produced tasks.
We consider a closed economy with many time periods t = 1, 2, ... and a continuum ofworkers. Each individual worker i belongs to one of a finite number of groups, indexed byg = 1, . . . , G. The mass of workers in group g is Lgt. Workers of type g are endowed with
24We acknowledge a trade-off here: While we would prefer to use hourly wages as the basis for ourmeasurement of income inequality, we wish to take advantage of the longer sample which the decennialcensus offers.
29

a set of skills Sgh, h ∈ 1...H, where h indexes different tasks which workers perform in theiroccupations. Worker i produces task h by combining skills and time: qiht = Sghliht. Here,liht equals the amount of time the worker allocates to task h. Each worker has a total of oneunit of time, which she supplies inelastically in one of j ∈ 1, ...., J occupations.
Worker i, if she works in occupation j, produces
Vijt = εijtH∏h=1
(qihtThjt
)Thjt(3)
units of output. In Equation 3, εijt is an occupation-worker unobserved efficiency, and Thjtgives the importance of task h in occupation j. We fix ∑h Thjt = 1 for each occupationand time period. Variation in Thjt across occupations captures, for example, that someoccupations are more intensive in routine analytic tasks than others. To match our time-varying measures of task content, we allow the parameters Thjt to evolve exogenously throughtime. Such changes could reflect, again as an example, declines in the demand for worker-performed routine manual or routine cognitive tasks caused by a decline in the price ofcomputers, or increases in nonroutine interactive tasks related to the increased importanceof team management.
We assume that worker i’s wages, Wijt, equal the value of the output she produces,PjtVijt, which represents the product of the output produced and the price of the occupationj specific output. Taking Pjt as given, each worker chooses the amount of time spent on eachof the H tasks to maximize the value of her output. The solution to this problem impliesthat lijt = Thjt ·
(∑Hh′=1 Th′jt
)−1= Thjt.25
Plugging the optimal time allocation back into Equation 3 yields worker i’s log wages
logWijt = logPjt +H∑h=1
Thjt logSgh + log εijt. (4)
We assume that workers are freely able to choose their occupations to maximize theirwages. Workers take as given each occupation-specific output price, and the task activitiesassociated with each occupation. The idiosyncratic component of worker i’s returns fromworking in occupation j, ε, is a Frechet-distributed random variable, drawn independentlyacross occupations and workers, with shape parameter θ, i.e., Pr [εijt < z] = exp
(−z−θ
).
The parameter θ is an inverse measure of the dispersion of εijt within group-occupationpairs.26
25Due to the assumption that the production function of occupation-j specific output is Cobb-Douglas,individual abilities do not shape the time spent in each task, although they will affect occupational choice.
26In Appendix F, we outline the extra assumptions necessary to derive from Equation 2, the basis of our
30

The Frechet formulation conveniently generates expressions for the fraction of group g
workers which work in occupation j and the average wage of group g workers. The probabilitythat a worker of type g sorts into occupation j is
λgjt =
(Pjt
∏Hh=1 (Sgh)Thjt
)θ∑j′
(Pj′t
∏Hh=1 (Sgh)Thj′t
)θ . (5)
Moreover, the average wages of group g workers equals
W gt = Γ(
1− 1θ
)·
∑j
(Pjt
H∏h=1
(Sgh)Thjt)θ1/θ
, (6)
where Γ (·) is the Gamma function.To close the model, we assume that there is a representative consumer who has CES
preferences over the output produced by the different occupations:
Vt = J∑j=1
(σj)1ρ · (Vjt)
ρ−1ρ
ρ−1ρ
,
with Vjt representing the sum of the output of individual workers, i, who produce occupationj output. Here, σj parameterizes the consumer’s preferences for occupation j output, andρ gives the preference elasticity of substitution across occupations’ output. Given thesepreferences, we can write the market-clearing condition for occupation j output, equatingexpenditures on the occupation’s output to the wage bill of workers who are employed inoccupation j:
σj · (Pjt)1−ρ∑j′ σj′ (Pj′t)1−ρ︸ ︷︷ ︸
∑g
W gtLgt︸ ︷︷ ︸ =G∑g=1
Γ(
1− 1θ
)∑j′
(Pj′t
H∏h=1
(Sgh)Thj′t)θ1/θ
︸ ︷︷ ︸λgjtLgt︸ ︷︷ ︸ . (7)
(A) (B) (C) (D)
The left-hand side of Equation 7 contains two terms: the share of total expenditures onoccupation j output (term A), multiplied by total expenditures (term B). On the right-handside, the total wage bill of workers in occupation j is computed as the sum of the wage billof group g workers in occupation j; which in turn equals the product of the average wage ofgroup g workers (term C) and the number of group workers (term D).
statistical decompositions, from Equation 4, in the previous section.
31

An equilibrium of our economy is the solution to {λij} and {Pj} , as determined byEquations 5 and 7.
With this model, we evaluate the impact of change in the demand for tasks on theequilibrium wage distribution. To do so, we first use data from a single period (1960) incombination with Equations 5 and 6 to estimate demographic groups’ skills in producingtasks. Then, with our measures of changes in occupations’ task content, we compute thecounterfactual change in the distribution of wages, between 1960 and 2000, that is due onlyto changes in the demand for tasks. Appendix F details the equilibrium of the model, anddelineates our algorithm to recompute the equilibrium to in response to changes in the T s.Throughout the remainder of the section, we fix θ = ρ = 1.78, following Burstein, Morales,and Vogel (2015).
In estimating our model, we need to map task-related keyword frequencies, as observed inthe newspaper data (T̃hjt), to our production function parameters (Thjt). To ensure that ourproduction function parameters sum to one for each occupation-year, we apply the followingtransformation: Thjt = T̃hjt/
(∑h′ T̃h′jt
)−1.
Estimation of task-related skills
For each task h, we parameterize the relationship between skills and educational and demo-graphic observables as follows:
logSgh = ah,genderDgender,g + ah,edu ·Dedu,g + ah,exp ·Dexp,g. (8)
Here, Dgender,g, Dedu,g, and Dexp,g are dummies for gender, education and experience, whichdefine the categories g. We estimate these a parameters via a method of moments proce-dure.27
Our estimation recovers ah,gender, ah,edu, and ah,exp to minimize
∑g
∑j
ωλgj(log λgj,1960 − log λdata
gj,1960
)2+∑g
ωWg(logW g,1960 − logW data
g1960
)2. (9)
In Equation 9, λdatagj,1960 and logW data
g1960 refer to the observed occupational shares and averagewages.28 The ωλgj and ωWg are weights, characterizing the relative importance of each moment
27As in the previous subsection, we have two gender, five educational, and four experience groups, with“male” as the omitted gender category, “Some College” as the omitted educational category, and 20-29 yearsas the omitted experience category.
28Our estimation relies on data from 3240 (=40 · 81) moments—representing information from 40 groups(2 genders, 5 educational categories, and 4 experience categories) and 81 occupations—to identify 121 pa-rameters: 81 occupation-fixed effects plus 40 a coefficients.
32
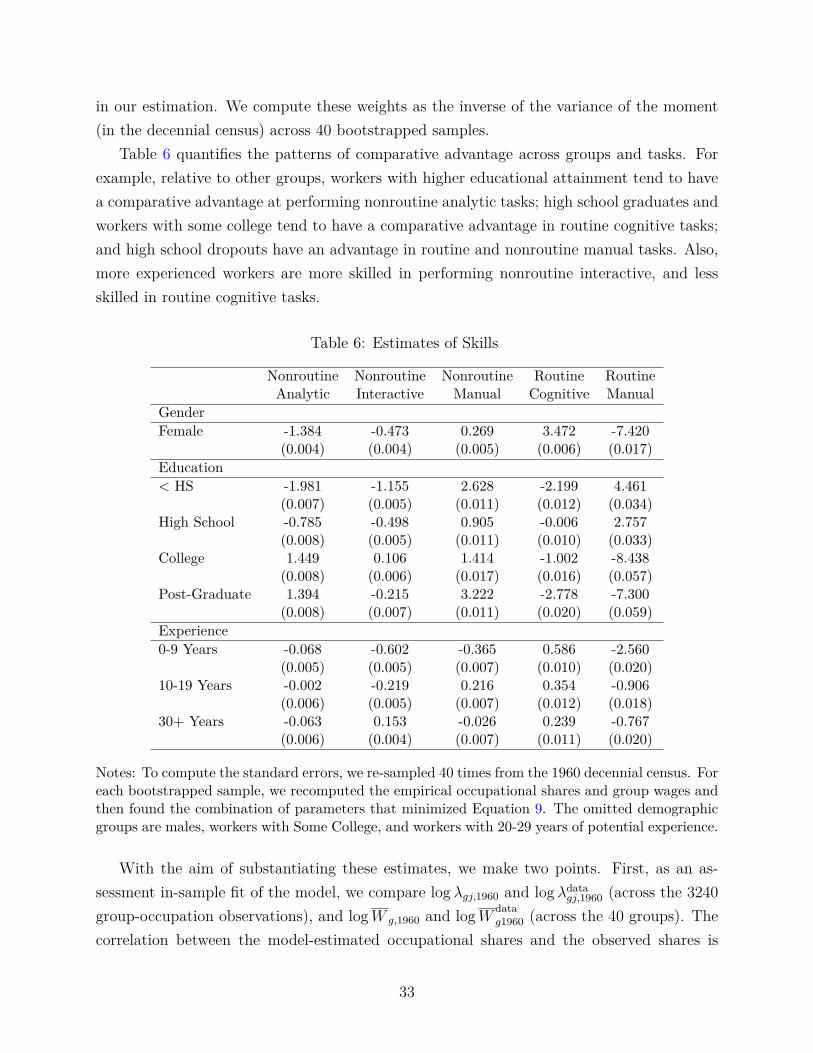
in our estimation. We compute these weights as the inverse of the variance of the moment(in the decennial census) across 40 bootstrapped samples.
Table 6 quantifies the patterns of comparative advantage across groups and tasks. Forexample, relative to other groups, workers with higher educational attainment tend to havea comparative advantage at performing nonroutine analytic tasks; high school graduates andworkers with some college tend to have a comparative advantage in routine cognitive tasks;and high school dropouts have an advantage in routine and nonroutine manual tasks. Also,more experienced workers are more skilled in performing nonroutine interactive, and lessskilled in routine cognitive tasks.
Table 6: Estimates of Skills
Nonroutine Nonroutine Nonroutine Routine RoutineAnalytic Interactive Manual Cognitive Manual
GenderFemale -1.384 -0.473 0.269 3.472 -7.420
(0.004) (0.004) (0.005) (0.006) (0.017)Education< HS -1.981 -1.155 2.628 -2.199 4.461
(0.007) (0.005) (0.011) (0.012) (0.034)High School -0.785 -0.498 0.905 -0.006 2.757
(0.008) (0.005) (0.011) (0.010) (0.033)College 1.449 0.106 1.414 -1.002 -8.438
(0.008) (0.006) (0.017) (0.016) (0.057)Post-Graduate 1.394 -0.215 3.222 -2.778 -7.300
(0.008) (0.007) (0.011) (0.020) (0.059)Experience0-9 Years -0.068 -0.602 -0.365 0.586 -2.560
(0.005) (0.005) (0.007) (0.010) (0.020)10-19 Years -0.002 -0.219 0.216 0.354 -0.906
(0.006) (0.005) (0.007) (0.012) (0.018)30+ Years -0.063 0.153 -0.026 0.239 -0.767
(0.006) (0.004) (0.007) (0.011) (0.020)
Notes: To compute the standard errors, we re-sampled 40 times from the 1960 decennial census. Foreach bootstrapped sample, we recomputed the empirical occupational shares and group wages andthen found the combination of parameters that minimized Equation 9. The omitted demographicgroups are males, workers with Some College, and workers with 20-29 years of potential experience.
With the aim of substantiating these estimates, we make two points. First, as an as-sessment in-sample fit of the model, we compare log λgj,1960 and log λdata
gj,1960 (across the 3240group-occupation observations), and logW g,1960 and logW data
g1960 (across the 40 groups). Thecorrelation between the model-estimated occupational shares and the observed shares is
33
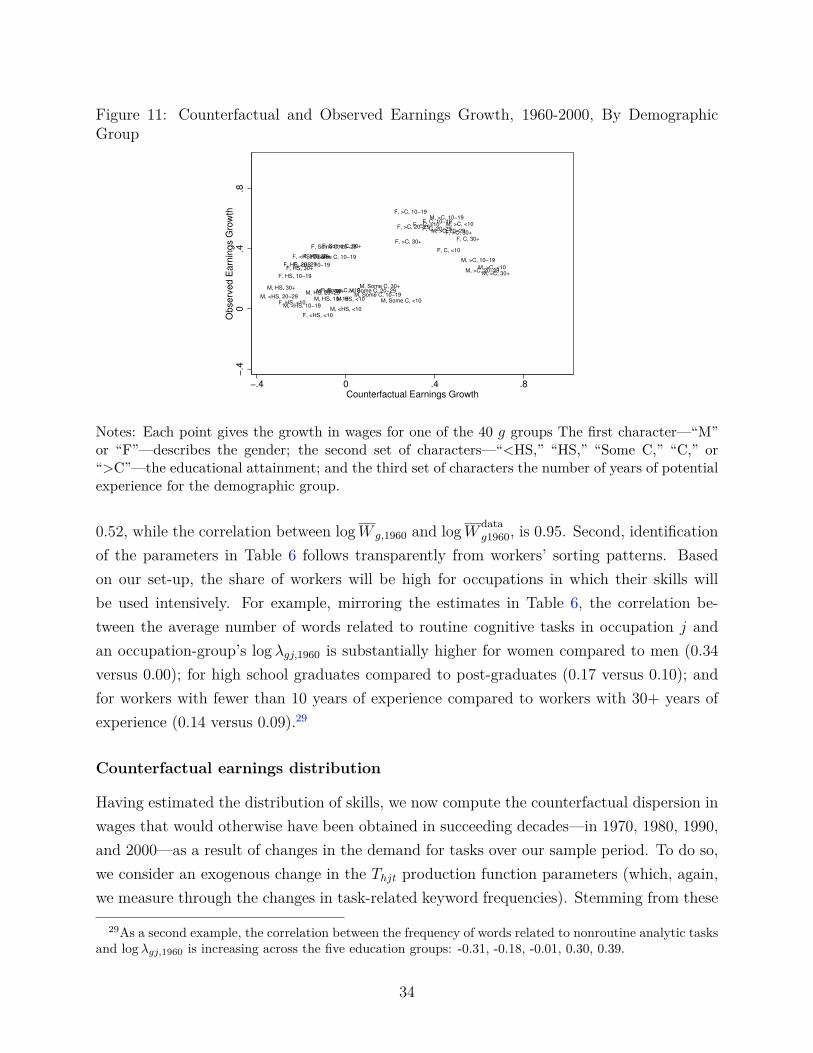
Figure 11: Counterfactual and Observed Earnings Growth, 1960-2000, By DemographicGroup
M, <HS, <10M, <HS, 10−19
M, <HS, 20−29
M, HS, 30+
M, HS, <10M, HS, 10−19M, HS, 20−29M, HS, 30+
M, Some C, <10M, Some C, 10−19
M, Some C, 20−29M, Some C, 30+
M, >C, <10
M, >C, 10−19
M, >C, 20−29M, >C, 30+
M, >C, <10M, >C, 10−19
M, >C, 20−29F, >C, 30+
F, <HS, <10
F, <HS, 10−19
F, <HS, 20−29F, HS, 30+
F, HS, <10
F, HS, 10−19
F, HS, 20−29F, HS, 30+
F, Some C, <10
F, Some C, 10−19
F, Some C, 20−29F, Some C, 30+F, C, <10
F, C, 10−19
F, C, 20−29
F, C, 30+
F, >C, <10
F, >C, 10−19
F, >C, 20−29
F, >C, 30+−
.40
.4.8
Observ
ed E
arn
ings G
row
th
−.4 0 .4 .8Counterfactual Earnings Growth
Notes: Each point gives the growth in wages for one of the 40 g groups The first character—“M”or “F”—describes the gender; the second set of characters—“<HS,” “HS,” “Some C,” “C,” or“>C”—the educational attainment; and the third set of characters the number of years of potentialexperience for the demographic group.
0.52, while the correlation between logW g,1960 and logW datag1960, is 0.95. Second, identification
of the parameters in Table 6 follows transparently from workers’ sorting patterns. Basedon our set-up, the share of workers will be high for occupations in which their skills willbe used intensively. For example, mirroring the estimates in Table 6, the correlation be-tween the average number of words related to routine cognitive tasks in occupation j andan occupation-group’s log λgj,1960 is substantially higher for women compared to men (0.34versus 0.00); for high school graduates compared to post-graduates (0.17 versus 0.10); andfor workers with fewer than 10 years of experience compared to workers with 30+ years ofexperience (0.14 versus 0.09).29
Counterfactual earnings distribution
Having estimated the distribution of skills, we now compute the counterfactual dispersion inwages that would otherwise have been obtained in succeeding decades—in 1970, 1980, 1990,and 2000—as a result of changes in the demand for tasks over our sample period. To do so,we consider an exogenous change in the Thjt production function parameters (which, again,we measure through the changes in task-related keyword frequencies). Stemming from these
29As a second example, the correlation between the frequency of words related to nonroutine analytic tasksand log λgj,1960 is increasing across the five education groups: -0.31, -0.18, -0.01, 0.30, 0.39.
34

changes in the demand for tasks, we compute the counterfactual equilibrium that would haveobtained, fixing logSgh to the values we estimated in the previous subsection, but allowingThjt to change over time.30
Figure 11 plots the growth in W gt between 1960 and 2000, both as observed in thedata and according to our counterfactual exercise. Wages increase most quickly for workerswith college degrees or with post-graduate education. According to our estimated model,wage growth is fastest for high-education demographic groups because these groups have anadvantage in nonroutine analytic and interactive tasks as of 1960, and the relative demandfor these tasks has increased over the subsequent 40 years.
Increases in between-group inequality signify larger overall inequality. Figure 12 plotschanges in 90-10 inequality, both the observed growth rate and the counterfactual growthrates that are due only to changes in Thjt. Between 1960 and 2000, 90-10 inequality increasedby 26 log points for the entire population, 38 log points for male workers, and 15 log pointsfor female workers. According to our counterfactual exercises, within occupation changes intask demand account for much of the observed increase in 90-10 inequality: 22 log points forthe entire sample, 13 log points for female workers, and 25 log points for male workers.
Discussion Occupational choice and wage data from the beginning of our sample suggestthat workers with certain demographic characteristics (e.g., workers with a college degree)have an advantage in the tasks which have happened to grow over the subsequent forty years.Since these demographic groups were already highly remunerated in 1960, changes in thedemand for tasks have increased earnings inequality.
Where do these shifts in the demand for tasks come from? Our model omits capital asan input in the production of tasks. Likely, some of the differential growth rates of Thjtacross task groups epitomize, at a more fundamental level, changes in capital prices. To theextent that the elasticity of substitution between workers and capital is relatively high in theproduction of routine tasks, a decline in the price of capital will be equivalent to a reduction inthe demand for worker-performed routine tasks. Moreover, insofar as employers’ innovationand technology adoption decisions are a function of the supply of workers of different skilltypes, changes in the Thjt not only embody exogenous changes in the demand for tasks(which has been our interpretation here), but also reflect changes in the skill compositionof labor supply. An interesting topic for future work would be to build on our model ofoccupations as a bundle of tasks, endogenizing changes in the Thjt while acknowledging that
30In the exercises in this section, we also fix the sizes of the 40 different demographic groups to their 1960values. An alternate procedure would allow these labor supplies to vary throughout the sample according toobserved demographic changes. This alternate procedure yields similarly large increases in 90-10 inequalityin the counterfactual equilibrium, compared to those reported in Figure 12.
35
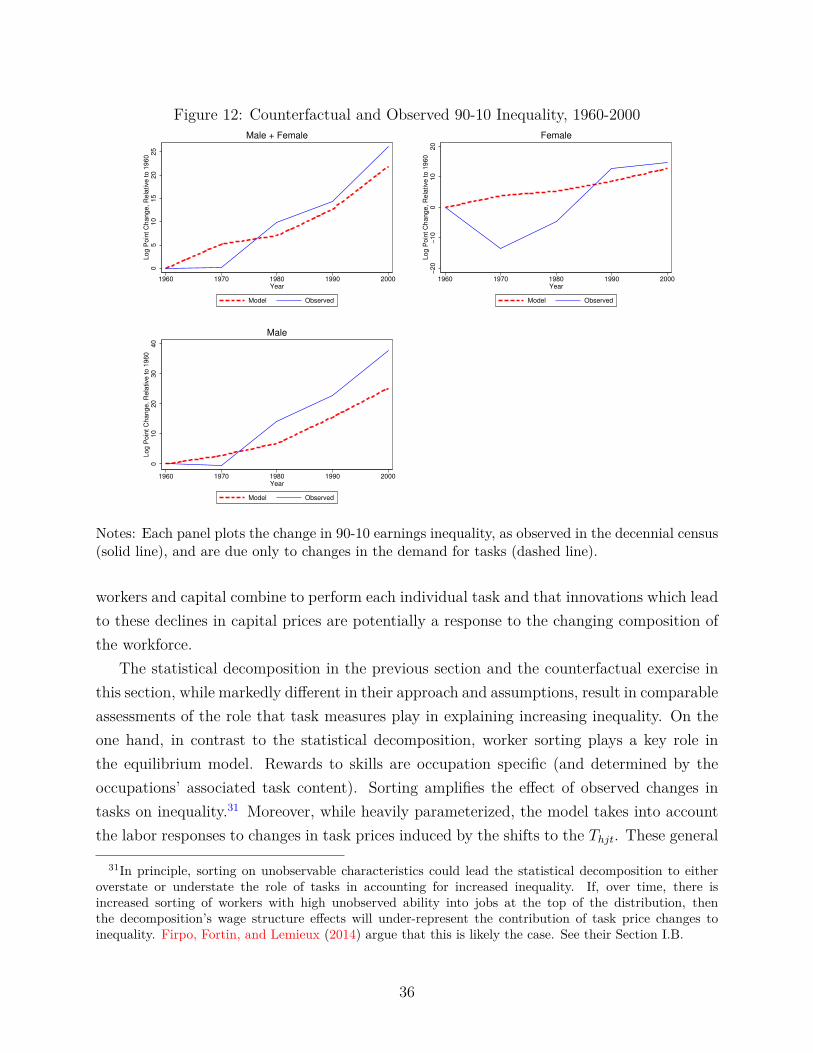
Figure 12: Counterfactual and Observed 90-10 Inequality, 1960-2000
05
10
15
20
25
Log P
oin
t C
hange, R
ela
tive to 1
960
1960 1970 1980 1990 2000Year
Model Observed
Male + Female
−20
−10
010
20
Log P
oin
t C
hange, R
ela
tive to 1
960
1960 1970 1980 1990 2000Year
Model Observed
Female
010
20
30
40
Log P
oin
t C
hange, R
ela
tive to 1
960
1960 1970 1980 1990 2000Year
Model Observed
Male
Notes: Each panel plots the change in 90-10 earnings inequality, as observed in the decennial census(solid line), and are due only to changes in the demand for tasks (dashed line).
workers and capital combine to perform each individual task and that innovations which leadto these declines in capital prices are potentially a response to the changing composition ofthe workforce.
The statistical decomposition in the previous section and the counterfactual exercise inthis section, while markedly different in their approach and assumptions, result in comparableassessments of the role that task measures play in explaining increasing inequality. On theone hand, in contrast to the statistical decomposition, worker sorting plays a key role inthe equilibrium model. Rewards to skills are occupation specific (and determined by theoccupations’ associated task content). Sorting amplifies the effect of observed changes intasks on inequality.31 Moreover, while heavily parameterized, the model takes into accountthe labor responses to changes in task prices induced by the shifts to the Thjt. These general
31In principle, sorting on unobservable characteristics could lead the statistical decomposition to eitheroverstate or understate the role of tasks in accounting for increased inequality. If, over time, there isincreased sorting of workers with high unobserved ability into jobs at the top of the distribution, thenthe decomposition’s wage structure effects will under-represent the contribution of task price changes toinequality. Firpo, Fortin, and Lemieux (2014) argue that this is likely the case. See their Section I.B.
36

equilibrium effects also tend to generate more inequality explained by the model relative tothe statistical decomposition.
On the other hand, in the model, we only evaluate the effect of within-occupation changesin task demands, while other shocks to fundamentals could also shape the income distribu-tion. These other shocks include changes in the demand for occupations (measured by σj inthe model), and potentially represent a source of widening income inequality that is encap-sulated by the statistical decompositions and not the counterfactual exercises. Moreover, tothe extent that the price of individual tasks vary within occupations, the RIF regressionswill capture a source of inequality that the model cannot.
6 Conclusion
In this paper, we chronicle the changes in the U.S. occupational structure between 1960 and2000. We document that a predominant share of changes in the skill and task compositionof the workforce has occurred within rather than between occupations. Not only is it thecase that occupations intensive in routine tasks have declined as a share of the workforce —a central pattern of the existing task literature — but also individual occupations’ routinetask content has declined as well.
We then demonstrate that within-occupation task changes are fundamentally importantin an examination of the evolution of income inequality. We first perform a statistical decom-position on the earnings distribution and find that compositional changes associated withoccupational characteristics can explain a 26 log point increase in labor income inequality (asmeasured by the 90-10 ratio) between 1960 and 2000. We then construct and estimate a Roymodel in which changes in the demand for tasks determine workers’ comparative advantage.Our estimated model accords with the results from our statistical accounting exercise.
Beyond this project, our newspaper data have the potential to address other economicquestions related to the labor market. For example, in ongoing work we use the text tomeasure the adoption of new computer technologies, to study how these technologies interactwith the task content of jobs. More generally, we view our newspaper-based job vacancytext as offering an opportunity to study questions that have been examined using onlinejob vacancy text over a longer time horizon than previously possible (Hershbein and Kahn,2016; Modestino, Shoag, and Ballance, 2016).
37
ReferencesAcemoglu, D., and D. Autor (2011): “Skills, Tasks and Technologies: Implications forEmployment and Earnings,” Hanbook of Labor Economics, 4, 1043–1171.
Autor, D. H. (2013): “The "Task Approach" to Labor Markets: An Overview,” Journalof Labor Market Research, 46(3), 185 – 199.
(2015): “Why Are There Still So Many Jobs? The History and Future of WorkplaceAutomation,” Journal of Economic Perspectives, 29(3), 3–30.
Autor, D. H., and D. Dorn (2013): “The Growth of Low-Skill Service Jobs and thePolarization of the US Labor Market,” American Economic Review, 103(5), 1553–97.
Autor, D. H., L. Katz, and M. Kearney (2005): “The Polarization of the U.S. LaborMarket,” American Economic Review, 96(2), 189–194.
Autor, D. H., F. Levy, and R. J. Murnane (2003): “The Skill Content of Recent Tech-nological Change: An Empirical Exploration,” Quarterly Journal of Economics, 118(4),1279–1333.
Bartel, A., C. Ichniowski, and K. Shaw (2007): “How Does Information TechnologyAffect Productivity? Plant-Level Comparisons of Product Innovation, Process Improve-ment, and Worker Skills,” Quarterly Journal of Economics, 122(4), 1721–1758.
Bengio, Y., R. Ducharme, P. Vincent, and C. Jauvin (2003): “A Neural ProbabilisticLanguage Model,” Journal of Machine Learning Research, 3, 1137–1155.
Blei, D. M., A. Y. Ng, and M. I. Jordan (2003): “Latent Dirichlet Allocation,” Journalof Machine Learning Research, 3, 993–1022.
Burstein, A., E. Morales, and J. Vogel (2015): “Accounting for Changes in Between-Group Inequality,” Working Paper 20855, National Bureau of Economic Research.
Deming, D., and L. B. Kahn (2017): “Skill Requirements across Firms and Labor Mar-kets: Evidence from Job Postings for Professionals,” Journal of Labor Economics, (forth-coming).
Deming, D. J. (2017): “The Growing Importance of Social Skills in the Labor Market,”Quarterly Journal of Economics, (forthcoming).
DeVaro, J., and O. Gurtler (2017): “Advertising and Labor Market Matching: A TourThrough the Times,” Journal of Labor Economics, (forthcoming).
Firpo, S., N. M. Fortin, and T. Lemieux (2014): “Occupational Tasks and Changes inthe Wage Structure,” IZA Discussion Papers 5542, Institute for the Study of Labor (IZA).
38

Fligstein, N., J. S. Brundage, and M. Schultz (2014): “Why the Federal ReserveFailed to See the Financial Crisis of 2008: The Role of Macroeconomics as a Sense makingand Cultural Frame,” Institute for research on labor and employment, working paperseries, Institute of Industrial Relations, UC Berkeley.
Fortin, N., T. Lemieux, and S. Firpo (2011): “Decomposition Methods in Economics,”Handbook of Labor Economics, 4, 1–102.
Gentzkow, M., and J. M. Shapiro (2010): “What Drives Media Slant? Evidence FromU.S. Daily Newspapers,” Econometrica, 78(1), 35–71.
Hansen, S., M. McMahon, and A. Prat (2014): “Transparency and Deliberationwithin the FOMC: a Computational Linguistics Approach,” CEPR Discussion Papers9994, C.E.P.R. Discussion Papers.
Heckman, J. J., and J. Scheinkman (1987): “The Importance of Bundling in a Gorman-Lancaster Model of Earnings,” Review of Economic Studies, 54(2), 243–255.
Heckman, J. J., and G. Sedlacek (1985): “Heterogeneity, Aggregation, and MarketWage Functions: An Empirical Model of Self-Selection in the Labor Market,” Journal ofPolitical Economy, 93(6), 1077–1125.
Hershbein, B. J., and L. B. Kahn (2016): “Do Recessions Accelerate Routine-BiasedTechnological Change? Evidence from Vacancy Postings,” Upjohn Working Papers andJournal Articles 16-254, W.E. Upjohn Institute for Employment Research.
Hoberg, G., and G. Phillips (2016): “Text-Based Network Industries and EndogenousProduct Differentiation,” Journal of Political Economy, 124(5), 1423–1465.
Hoffman, M. D., D. M. Blei, and F. R. Bach (2010): “Online Learning for LatentDirichlet Allocation,” in Advances in Neural Information Processing Systems 23: 24th An-nual Conference on Neural Information Processing Systems 2010. Proceedings of a meetingheld 6-9 December 2010, Vancouver, British Columbia, Canada., pp. 856–864.
Marinescu, I., and R. Wolthoff (2016): “Opening the Black Box of the Matching Func-tion: the Power of Words,” NBER Working Papers 22508, National Bureau of EconomicResearch, Inc.
Michaels, G., F. Rauch, and S. J. Redding (2016): “Tasks and Technology in theUnited States 1880-2000,” Discussion paper, National Bureau of Economic Research.
Mikolov, T., K. Chen, G. Corrado, and J. Dean (2013a): “Efficient Estimation ofWord Representations in Vector Space,” Unpublished working paper.
Mikolov, T., I. Sutskever, K. Chen, G. S. Corrado, and J. Dean (2013b): “Dis-tributed Representations of Words and Phrases and Their Compositionality,” in Advancesin neural information processing systems, pp. 3111–3119.
39
Modestino, A. S., D. Shoag, and J. Ballance (2016): “Upskilling: Do EmployersDemand Greater Skill When Skilled Workers are Plentiful?,” Unpublished working paper.
National Research Council (1999): The Changing Nature of Work: Implications forOccupational Analysis. National Academy Press.
(2010): A Database for a Changing Economy: Review of the Occupational Infor-mation Network (O*NET). National Academy Press.
Rehurek, R., and P. Sojka (2010): “Software Framework for Topic Modelling withLarge Corpora,” in Proceedings of the LREC 2010 Workshop on New Challenges for NLPFrameworks, pp. 45–50, Valletta, Malta. ELRA.
Ross, M. (2017): “Routine-Biased Technical Change: Panel Evidence of Task Orientationand Wage Effects,” Labour Economics, 48, 198–214.
Ruggles, S., K. Genadek, R. Goeken, J. Grover, and M. Sobek (2015): “Inte-grated Public Use Microdata Series: Version 6.0,” Minneapolis, MN: Historical CensusProjects, University of Minnesota.
Spitz-Oener, A. (2006): “Technical Change, Job Tasks, and Rising Educational Demands:Looking Outside the Wage Structure,” Journal of Labor Economics, 24(2), 235–270.
Yamaguchi, S. (2012): “Tasks and Heterogeneous Human Capital,” Journal of Labor Eco-nomics, 30(1), 1–53.
40