The Evolution of the R Software Ecosystem -...
10
The Evolution of the R Software Ecosystem Daniel M German Dept. of Computer Science University of Victoria [email protected] Bram Adams G´ enie Informatique et G´ enie Logiciel ´ Ecole Polytechnique de Montr´ eal [email protected] Ahmed E. Hassan School of Computing Queen’s University [email protected] Abstract—Software ecosystems form the heart of modern companies’ collaboration strategies with end users, open source developers and other companies. An ecosystem consists of a core platform and a halo of user contributions that provide value to a company or project. In order to sustain the level and number of high-quality contributions, it is crucial for companies and contributors to understand how ecosystems tend to evolve and can be maintained successfully over time. As a first step, this paper explores the evolution characteristics of the statistical computing project GNU R, which is a successful, end-user programming ecosystem. We find that the ecosystem of user-contributed R packages has been growing steadily since R’s conception, at a significantly faster rate than core packages, yet each individual package remains stable in size. We also identified differences in the way user-contributed and core packages are able to attract an active community of users. I. I NTRODUCTION Open source development has become a staple of modern software projects, with open source contributors forming an integral part of the software development workforce. Typically, a company remains in charge of the overall direction of a product, but tries to attract a community of open source contributors to build significant parts of its software portfolio. These contributors are not just low-cost labourers, they are typically well-motivated, talented and creative, extending the functionality of a software product in unforeseen ways. A popular example are the explosive growth and profits of user- developed iPhone and Android micro-apps. To foster collaboration with open source contributors, soft- ware projects are typically conceived as so-called “ecosys- tems” [3], [4], [12], [17], i.e., they consist of a (relatively) closed core that provides the basic functionality, surrounded by an open halo of user contributions. For example, the Eclipse project consists of a basic workbench that can be customized into any kind of IDE or editor by means of thousands of plugins (grouped into subprojects). Linux distributions like Debian provide a Linux operating system kernel that can be turned into any kind of server or workstation by means of thousands of contributed libraries and user applications (distributed as packages). Given the crucial role of ecosystems, it is important for companies and projects to sustain high-quality user contri- butions [4]. Keeping customers and contributors happy and productive does not only depend on effective project man- agement, but also (and especially) on agile evolution and maintenance of an ecosystem according to the customers’ and contributors’ needs. Although there has been some initial research on understanding how ecosystems are able to evolve effectively [6], [9], [10], [34], most of this research considers the core or the user contributions in isolation, or does not distinguish at all between both. This is not sufficient, since ecosystems need to reconcile different stakeholders, agendas and development philosophies, while safeguarding product quality and profits. This paper studies and contrasts the evolution of the core and user contributions (packages) of the R ecosystem [27]. We chose R as subject ecosystem because it is an immensely popular, vibrant end-user programming ecosystem of statistical analyses, visualizations and datasets based on a dialect of the S statistical programming language [18]. “End-user pro- gramming” means that the majority of contributors and core members are not software engineers by trade, but statisticians and scientists. This makes the success and scale of the R ecosystem even more impressive. For these reasons, we believe R to be an ideal subject system for exploring four research questions related to the size, long-time evolution, structure and community of user-contributed packages compared to core packages: Q1) What are the Code Characteristics of Core and User- Contributed Packages? We find that user-contributed packages typically are smaller, and contain less documentation than core ones. Q2) How do Core and User-Contributed Packages Evolve over Time? On average, the size of a package remains stable over time, whether it is core or user-contributed. Q3) What is the Dependency Structure among Core and User-Contributed Packages? On average, packages have few dependencies. User- contributed packages build more on core packages than on other user-contributed packages. Q4) How is the Community surrounding Core and User- Contributed Packages? User-contributed packages are discussed less and by less people than core packages. Building a community around core packages takes months compared to a year for user-contributed packages. This paper is organized as follows. Section II presents the GNU R ecosystem, followed by a discussion of our case study
-
Upload
truongkhue -
Category
Documents
-
view
217 -
download
1
Transcript of The Evolution of the R Software Ecosystem -...

The Evolution of the R Software EcosystemDaniel M German
Dept. of Computer ScienceUniversity of Victoria
Bram AdamsGenie Informatique et Genie Logiciel
Ecole Polytechnique de [email protected]
Ahmed E. HassanSchool of Computing
Queen’s [email protected]
Abstract—Software ecosystems form the heart of moderncompanies’ collaboration strategies with end users, open sourcedevelopers and other companies. An ecosystem consists of a coreplatform and a halo of user contributions that provide value toa company or project. In order to sustain the level and numberof high-quality contributions, it is crucial for companies andcontributors to understand how ecosystems tend to evolve andcan be maintained successfully over time.
As a first step, this paper explores the evolution characteristicsof the statistical computing project GNU R, which is a successful,end-user programming ecosystem. We find that the ecosystem ofuser-contributed R packages has been growing steadily since R’sconception, at a significantly faster rate than core packages, yeteach individual package remains stable in size. We also identifieddifferences in the way user-contributed and core packages areable to attract an active community of users.
I. INTRODUCTION
Open source development has become a staple of modernsoftware projects, with open source contributors forming anintegral part of the software development workforce. Typically,a company remains in charge of the overall direction of aproduct, but tries to attract a community of open sourcecontributors to build significant parts of its software portfolio.These contributors are not just low-cost labourers, they aretypically well-motivated, talented and creative, extending thefunctionality of a software product in unforeseen ways. Apopular example are the explosive growth and profits of user-developed iPhone and Android micro-apps.
To foster collaboration with open source contributors, soft-ware projects are typically conceived as so-called “ecosys-tems” [3], [4], [12], [17], i.e., they consist of a (relatively)closed core that provides the basic functionality, surroundedby an open halo of user contributions. For example, the Eclipseproject consists of a basic workbench that can be customizedinto any kind of IDE or editor by means of thousands ofplugins (grouped into subprojects). Linux distributions likeDebian provide a Linux operating system kernel that canbe turned into any kind of server or workstation by meansof thousands of contributed libraries and user applications(distributed as packages).
Given the crucial role of ecosystems, it is important forcompanies and projects to sustain high-quality user contri-butions [4]. Keeping customers and contributors happy andproductive does not only depend on effective project man-agement, but also (and especially) on agile evolution andmaintenance of an ecosystem according to the customers’
and contributors’ needs. Although there has been some initialresearch on understanding how ecosystems are able to evolveeffectively [6], [9], [10], [34], most of this research considersthe core or the user contributions in isolation, or does notdistinguish at all between both. This is not sufficient, sinceecosystems need to reconcile different stakeholders, agendasand development philosophies, while safeguarding productquality and profits.
This paper studies and contrasts the evolution of the coreand user contributions (packages) of the R ecosystem [27].We chose R as subject ecosystem because it is an immenselypopular, vibrant end-user programming ecosystem of statisticalanalyses, visualizations and datasets based on a dialect ofthe S statistical programming language [18]. “End-user pro-gramming” means that the majority of contributors and coremembers are not software engineers by trade, but statisticiansand scientists. This makes the success and scale of the Recosystem even more impressive. For these reasons, we believeR to be an ideal subject system for exploring four researchquestions related to the size, long-time evolution, structureand community of user-contributed packages compared to corepackages:
Q1) What are the Code Characteristics of Core and User-Contributed Packages?We find that user-contributed packages typically aresmaller, and contain less documentation than core ones.
Q2) How do Core and User-Contributed Packages Evolveover Time?On average, the size of a package remains stable overtime, whether it is core or user-contributed.
Q3) What is the Dependency Structure among Core andUser-Contributed Packages?On average, packages have few dependencies. User-contributed packages build more on core packages thanon other user-contributed packages.
Q4) How is the Community surrounding Core and User-Contributed Packages?User-contributed packages are discussed less and byless people than core packages. Building a communityaround core packages takes months compared to a yearfor user-contributed packages.
This paper is organized as follows. Section II presents theGNU R ecosystem, followed by a discussion of our case study

setup (Section III). The case study results are presented inSection IV and discussed in Section V. We conclude thispaper with a discussion of related work in Section VII andour conclusion in Section VIII.
II. THE GNU R ECOSYSTEM
There are many definitions of ecosystems [3], [4], [12], [17],but here we adopt the one from Jansen et al. [12], whichdefines a software ecosystem as (numbers added by us):
a set of (1) businesses functioning as a unit andinteracting with a shared market for (2) software andservices, together with (3) the relationships among[the businesses].
For example, the micro-app ecosystems of Apple andGoogle have (1) as stakeholders Apple/Google, thousandsof 3rd party developers and millions of users worldwide.These stakeholders leverage (2) the iOS and Android mobileoperating systems, SDKs and APIs, and thousands of 3rd partymobile applications. Users and 3rd party developers dependon (3) the massive App Store and Google Market distributionplatforms to buy and sell their micro-apps, for a nominal feeor a small share of the profits.
Although ecosystems have been around for more than adecade, little research has been performed on them [3], [12].Most of the existing research focuses on formally modelingecosystems [5], [20], migrating a project into an ecosystem [3],[4], [11], and managing the huge volumes of knowledgespread across the stakeholders of an ecosystem [7], [29]. Themajority of this work considers levels (1) and (3), and targetsecosystems on web and mobile platforms.
Existing work on desktop ecosystems has primarily focusedon operating system-centric ecosystems like the Linux ker-nel [9] and Debian ecosystem [10], and developer-centricecosystems like the Eclipse ecosystem [6], [15], [16], [28],[34]. Desktop ecosystems for end-user programming have seenalmost no research. These ecosystems, featuring the likes ofMicrosoft Excel and high-level database report generators,are based around a (typically domain-specific) language thatenables non-software engineering users with a good domainunderstanding to quickly build their own custom applications.As such, these ecosystems are hugely popular and are believedto be “the holy grail of software platforms” [3].
In order to understand how end-user programming ecosys-tems evolve, this paper studies the evolution of the libre GNUR desktop ecosystem [27], at the software level (2). Studyingthis ecosystem at levels (1) and (3) is future work. R’s businessis statistics and data analytics, with as major stakeholderscompanies, researchers and governments. The ecosystem isbuilt around the R statistical programming language [18](which is based on the S language) and nine repositorieshosting 4,338 (March 2011 [19]) user-contributed packagesthat enhance the basic R with advanced statistical analyses,visualization toolkits and comprehensive data sets. In additionto the standard, libre GNU R, the R ecosystem comprisesvarious commercial offerings (e.g., [24], [26]) that provideadvanced graphical user interfaces or enhanced scalability.
base
recommended
popular
contributed
Fig. 1. Breakdown of the different kinds of R packages. The grey packagesare the core packages of R, i.e., they are shipped with the basic installation.
We chose the R ecosystem for our case study since it isone of the most successful end-user programming ecosystemsfor statistical analysis [19], [25], developed primarily by non-software engineers. In March 2011, R was the 27th mostpopular programming language in the world [31] and it wasestimated to be used by 43% of all data miners worldwide [25].Furthermore, R has a flourishing community of developersand users, which communicate through hundreds of mailinglists, fora, web blogs and books. The R mailing list trafficalmost doubles the corresponding traffic of its commercialcompetitors [19]. To facilitate development, the R ecosystemuses the R-Forge development infrastructure, which providesversion control, defect management, and other features similarto those of SourceForge [30].
III. SETUP OF THE CASE STUDY
This paper performs an empirical study on the R ecosystemto explore how a successful ecosystem is able to evolve accord-ing to the conflicting requirements of different stakeholders,while maintaining its quality. Our study considers the sourcecode, churn, dependency and community dimensions of R inorder to understand the scale of user-contributed packages(Q1), the long-term evolution of such packages (Q2), how theuser-contributed packages fit into the core system (Q3) andhow a community is formed around user-contributed packages(Q4). This section explains the R data that we are using as wellas how we extracted this data.
A. R Package data
R consists of a small kernel, complemented by so-called“packages” that extend the basic functionality of R. There arefour different sets of packages. These are described in Table I,and their relationship is illustrated in Figure 1. Similar subsetsof packages exist in other ecosystems, like LATEX and Perl.
We mirrored the src subdirectory of the CRAN R reposi-tory (http://cran.r-project.org/, which is the largest R package
TABLE ISETS OF R PACKAGES USED IN THIS STUDY.
Dev. by Set Size DescriptionR team Base 13 Core pkg. Installed by default.Users Recommended 15 Core pkg. Installed by default.
Popular 179 Found to be commonly installedby a sample of users. Does notinclude Recommended, nor Base.
Contributed 2,733 Rest of user-developed pkgs.

repository, amounting to 16 GB of data or roughly two thirdsof all currently existing R packages [19]. The src subdirectoryof the R repository is divided into three parts: the source codeof the releases of the R system kernel (base subdirectory),the user-contributed packages (contrib subdirectory), and apre-release of R (base-prerelease subdirectory, not usedin our study). The base directory contains every release of R,from version 0.49 (April 23, 1997) to the latest version, i.e.,2.12.2 (Feb. 25, 2011), for a total of 80 versions.
Core packages can be divided into two types: Base pack-ages, maintained by the R team, and Recommended packages,which are preselected user-contributed packages of whichhand-picked versions are included in the library/ subdi-rectory of a particular R release. The source code of theRecommended packages is shipped as .tar.gz files that needto be further decompressed and built. The latest release of Rcontains 13 Base packages, and 15 Recommended packages.To access the source code of earlier versions of Base packages,we downloaded all historical R releases.
The contrib subdirectory of the CRAN R repositorycontains the latest release of all user-contributed pack-ages distributed via CRAN (including all versions of Rec-ommended packages), as well as all older releases (incontrib/Archive). The 2,927 different user-contributedpackages on CRAN occupy 15 GB of data and include19,593 archived releases. We used these archived releasesfor our historical analysis of non-Base packages. The firstuser-contributed package is dated Oct. 8, 1997 (ratetables,version 1.0-2), and the last one March 27, 2011 (spi, v1.0).
1
510
50100
5001000
Number of Packages Installed
Num
ber
of d
iffer
ent p
acka
ges
per
user
All Inst. by at least 20% users
Fig. 2. Bean plots showing the distribution of the number of Contributedpackages installed per user (52 users). The left side contains all installedContributed packages (1,879 different ones), whereas the right side containsonly the Popular packages, i.e., those packages installed by at least 20% of the52 users (194 different packages). The horizontal lines represent the quantiles.
It is very likely that not all 2,927 user-contributed packagesare frequently downloaded and installed. To account for this,we also considered a subset of user-contributed packages thatare Popular packages, i.e., packages that are installed by asignificant number of users. To determine the set of Popularpackages, we use statistics of the packages installed by 52users, data that was compiled for an official competitionto predict what packages a user would likely install [35].Gonzalez et al. [10] used a similar approach to define Popular
packages in Debian, while for LATEX various lists of Popularpackages can be found online.
The distribution of the number of user-contributed packagesinstalled by each of the 52 users is presented in Figure 2. ThisFigure contains two beanplots [13]. A beanplot is a boxplotthat also plots the density of a distribution instead of just abox, making the plot more informative. As can be observedon the left bean plot, the median number of installed packageswas 94.5, with a minimum of 10, and maximum of 1,879installed by one user. To avoid such outliers, we decidedto only keep those user-contributed packages that had beeninstalled by at least 20% of the 52 users (10). The resultingset contains 194 different packages. After removing the 15Recommended packages, we name the remaining 179 packagesPopular packages. All other user-contributed packages arecalled Contributed packages. Figure 1 and Table I show howthese two sets of packages relate to the core packages.
B. Mailing List Data
To analyze the user and developer community in the Recosystem, we studied the main mailing lists of the R project,i.e., the R-help (users) and R-devel (developers) lists. We didnot include the low-volume R-announce and R-packages lists,nor the 21 “Special Interest Groups”, such as R-sig-DB andR-sig-teaching. The latter focus on specific scientific fields,which would bias our data.
We downloaded the mailing list archives of R-help [22] andR-devel [21] for the period 1997–2010, and converted them tothe standard mbox format using a Perl script. We then used theMailboxMiner tool [2] to extract individual emails from thembox files, group emails into threads, resolve email aliases andstore the resulting data into a relational database. Attachmentswere ignored.
We used R and Perl scripts to analyze the extracted data. Inparticular, we linked emails to packages using a lightweight,case-sensitive regular expression search [1] for the packages’names in the email bodies:
(?<![a-zA-Z0-9])${PACKAGE}(?![a-zA-Z0-9])
This expression requires the package name to be free-standing, i.e., not preceded or followed by a letter or digit.Furthermore, some package names, such as “its” and “graph”,clash with regular English words, but since their effect isconstant across time, we did not exclude them from our data.
For each package, we only searched through those emailsthat were sent after the first release of the package. We didnot exclude emails sent after the demise of dead packages,since people can still discuss those afterwards. We did notremove quoted email text, since we are not interested in theraw number of occurrences of a package name in an email,but rather whether or not an email (semantically) talks abouta particular package.

IV. EMPIRICAL CASE STUDY
Q1. What are the Code Characteristics of Core and User-Contributed Packages?
Motivation — Since different stakeholders are involved withthe development of different types of packages, it is importantto compare the packages across the four sets in terms ofcharacteristics like size and documentation to understand thevolume and size of contributions that one might expect in anecosystem.
Approach — With respect to the number and size of packagesand documentation, we present two metrics: the number offiles per package, and the file length (in SLOCs for sourcecode, and raw number of lines for documentation files). Weconcentrate on documentation files (extension .rd – displayedwhen a user requests help within R), R source code (.r), andaggregated C/C++ files (.c,.cpp, .h, and .hpp – we call them Cfor brevity). All metrics for Base packages are calculated interms of the latest version of R (version 2.12.2), and for theother packages in terms of their latest version.
Results — Packages are composed of many different typesof files. Figure 3 shows that the distribution of file types acrossthe four sets of packages is fairly similar: documentation filesdominate (.rd), followed by R, C, and .rda (R data files).
0.0
0.1
0.2
0.3
0.4
0.5
Proportion of files for a given extension
Pro
port
ion
of fi
les ●
●
● ●
●● ●
● ● ● ● ● ● ● ● ● ● ● ● ● ● ● ● ● ● ● ●
●
BaseRecommendedPopularContributed
rd rtx
thp
prd
a c hde
scrip
tion
cpp
nam
espa
cef
rdat
apn
g gif
java
rnw
save
htm
lxm
lte
x s qci
tatio
n
Fig. 3. Proportion of files per file extension across the four sets of packages.The extensions shown correspond to 95% of all files. Packages are dominatedby documentation files (.rd), followed by R source code (.r). After that, themost common language is C/C++, followed by Fortran. R data files (.rda) arealso very dominant. Base and Recommended packages have a slightly largerproportion of documentation files.
Packages are extensively documented, with user-contributed packages having less than core packages. Inall sets of packages, the proportion of .rd files is the largest(the median of the ratio of rd files to source ones is 1.5, 1.25,0.89 and 1). As depicted in figure 4, these files account fora median of 5.3k, 3.6k, 1.7k, and 0.6k lines (for the sake ofbrevity, when reporting four values, they will correspond toBase, Recommended, Popular and Contributed respectively).The high percentage of documentation files to any other typesuggests that packages are extensively documented.
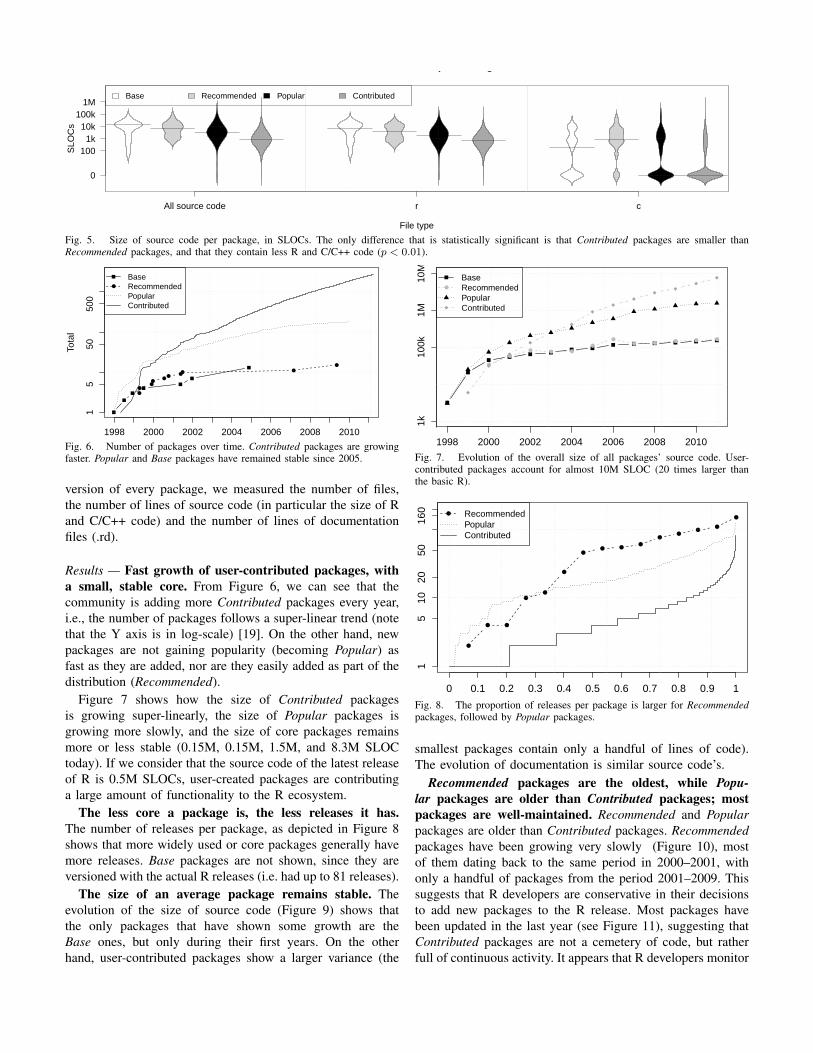
User-contributed packages have significantly less sourcecode than core packages. As can be observed in Figure 5, thecore packages have more code than user-contributed packages.Their median sizes are 13.1k, 6.2k, 3.2k, and 0.9k SLOC.
Packages are implemented primarily in R, distantlyfollowed by C. As shown in Figure 5, R code dominates,with median sizes of 7.3k, 3.5k, 1.8k, and 0.7k SLOC. C hasa bimodal distribution, with core packages using C more thanuser-contributed (median sizes of 184, 850, 0, and 0 SLOC).Given R’s target audience, the R language itself is the preferredway of extending functionality.
base recommended popular contributed
Size of Documentation per Package
Documentation Files (.rd)
Line
s
0
100
1k
10k
100k
Fig. 4. Size of documentation files per package. The number of lines ofdocumentation decreases from Popular to Contributed packages (statisticallysignificant with p < 0.01). The differences in size between the other threesets of packages are not statistically significant (p > 0.01).
For each analyzed metric (length of documentation, andSLOC of all/C/R source code), Base packages are largerthan Recommended packages, which are larger than Popularpackages, which are larger than Contributed packages, i.e.,user-contributed packages are smaller than core packages. Allpackages contain a large proportion of documentation files.
Q2. How do Core and User-Contributed Packages Evolve overTime?
Motivation — If we consider one release of the R ecosystem,question one has shown that there are clear differences be-tween core and user-contributed packages in terms of code anddocumentation characteristics. Question two considers howcore and user-contributed packages have evolved over timeto analyze whether those packages are one-off releases orwhether they are actively maintained over time. For example,how does the design of the ecosystem and packages evolve?Do the same files or packages keep on growing or arenew files or packages continuously added? How well is thedocumentation maintained, and how does the change rate ofdocumentation compare to the change rate of source code?
Approach — For Base packages, we analyzed all versionsincluded in the official R releases, for the other packages (in-cluding Recommended packages) we used the releases foundin the Archive section of the CRAN repository. For each
Size of Source Code per Package
File type
SLO
Cs
0
1001k
10k100k
1M
All source code r c
Base Recommended Popular Contributed
Fig. 5. Size of source code per package, in SLOCs. The only difference that is statistically significant is that Contributed packages are smaller thanRecommended packages, and that they contain less R and C/C++ code (p < 0.01).
15
5050
0
Number of Packages over Time
Tota
l
●●
●●
●● ●●●
●
1998 2000 2002 2004 2006 2008 2010
●
BaseRecommendedPopularContributed
Fig. 6. Number of packages over time. Contributed packages are growingfaster. Popular and Base packages have remained stable since 2005.
version of every package, we measured the number of files,the number of lines of source code (in particular the size of Rand C/C++ code) and the number of lines of documentationfiles (.rd).
Results — Fast growth of user-contributed packages, witha small, stable core. From Figure 6, we can see that thecommunity is adding more Contributed packages every year,i.e., the number of packages follows a super-linear trend (notethat the Y axis is in log-scale) [19]. On the other hand, newpackages are not gaining popularity (becoming Popular) asfast as they are added, nor are they easily added as part of thedistribution (Recommended).
Figure 7 shows how the size of Contributed packagesis growing super-linearly, the size of Popular packages isgrowing more slowly, and the size of core packages remainsmore or less stable (0.15M, 0.15M, 1.5M, and 8.3M SLOCtoday). If we consider that the source code of the latest releaseof R is 0.5M SLOCs, user-created packages are contributinga large amount of functionality to the R ecosystem.
The less core a package is, the less releases it has.The number of releases per package, as depicted in Figure 8shows that more widely used or core packages generally havemore releases. Base packages are not shown, since they areversioned with the actual R releases (i.e. had up to 81 releases).
The size of an average package remains stable. Theevolution of the size of source code (Figure 9) shows thatthe only packages that have shown some growth are theBase ones, but only during their first years. On the otherhand, user-contributed packages show a larger variance (the
1998 2000 2002 2004 2006 2008 2010
Total Source Code over Time
SLO
Cs
●
●● ● ●
●
●● ● ● ● ●
1k10
0k1M
10M
●
BaseRecommendedPopularContributed
Fig. 7. Evolution of the overall size of all packages’ source code. User-contributed packages account for almost 10M SLOC (20 times larger thanthe basic R). Number of Releases Per Package
●
● ●
●●
●
●● ●
●
●●
●●
●
0 0.1 0.2 0.3 0.4 0.5 0.6 0.7 0.8 0.9 1
15
1020
5016
0 ● RecommendedPopularContributed
Fig. 8. The proportion of releases per package is larger for Recommendedpackages, followed by Popular packages.
smallest packages contain only a handful of lines of code).The evolution of documentation is similar source code’s.
Recommended packages are the oldest, while Popu-lar packages are older than Contributed packages; mostpackages are well-maintained. Recommended and Popularpackages are older than Contributed packages. Recommendedpackages have been growing very slowly (Figure 10), mostof them dating back to the same period in 2000–2001, withonly a handful of packages from the period 2001–2009. Thissuggests that R developers are conservative in their decisionsto add new packages to the R release. Most packages havebeen updated in the last year (see Figure 11), suggesting thatContributed packages are not a cemetery of code, but ratherfull of continuous activity. It appears that R developers monitor

Evolution of the Size of Source Code per Package
1998 2001 2004 2007 2010 1999 2002 2005 2008 2011 1999 2002 2005 2008 2011 1999 2002 2005 2008 2011
010
010
k1M
Base Recommended Popular Contributed
Fig. 9. Evolution of the size of source code of packages. Median package size has remained stable over time. User-contributed packages have a largervariance. Date of first release
● ●
● ●
●●
● ●
●
●
● RecommendedPopularContributed
1998
2000
2002
2004
2006
2008
2010
0 0.1 0.2 0.3 0.4 0.5 0.6 0.7 0.8 0.9 1
Fig. 10. Date in which a package was created. Core packages are older.Date of Latest Release per Package
●
●
● ●● ● ● ● ● ● ● ● ● ● ●
0 0.1 0.2 0.3 0.4 0.5 0.6 0.7 0.8 0.9
2003
2004
2005
2006
2007
2008
2009
2010
2011
● RecommendedPopularContributed
Fig. 11. Last date of a package’s release. More than 95% of packages havebeen updated in the last 2 years. Recommended packages are slightly morerecent than the other packages.
the packages frequently. If the packages break (either duringcompilation or testing) and their maintainer does not fix theproblem, the package is removed (55 packages to date).
Packages are typically well-maintained. Over time, most pack-ages have remained fairly stable in size, while the number ofpackages increases.
Q3. What is the Dependency Structure among Core and User-Contributed Packages?
Motivation — As suggested by Figure 1, Contributed andPopular packages are built on the core R system, requiringthe functionality provided by the Base and Recommendedpackages. Previous studies on other ecosystems [4], [10] haveshown that the dependency structure of an ecosystem, inparticular between the core and Contributed packages, can be
very complicated. Similar to API evolution [36], changes toa core package can cause defects that propagate to possiblydozens of dependent Contributed packages. Furthermore, themore dependencies a package has, the more complicated itsdeployment becomes and the more advanced package man-agement systems need to be. In this question, we analyze thedependency structure of the R project to understand how theproject is able to reduce change and defect propagation.
Approach — In R, each package is expected to contain a filecalled DESCRIPTION similar to the control and spec filesused to describe packages in Debian and RedHat Linux distri-bution respectively. The Requires entry in the DESCRIPTIONfile lists all packages that are needed before the package canbe installed. By extracting the Requires entries of all the Rpackages, we built a complete inter-dependency graph of thepackages, similar to that of Linux distributions [8]. This graphpermits to understand how packages build on the featuresof others. Unfortunately, Base packages are not listed in theRequires field, hence we did not analyze how these packagesare built upon.
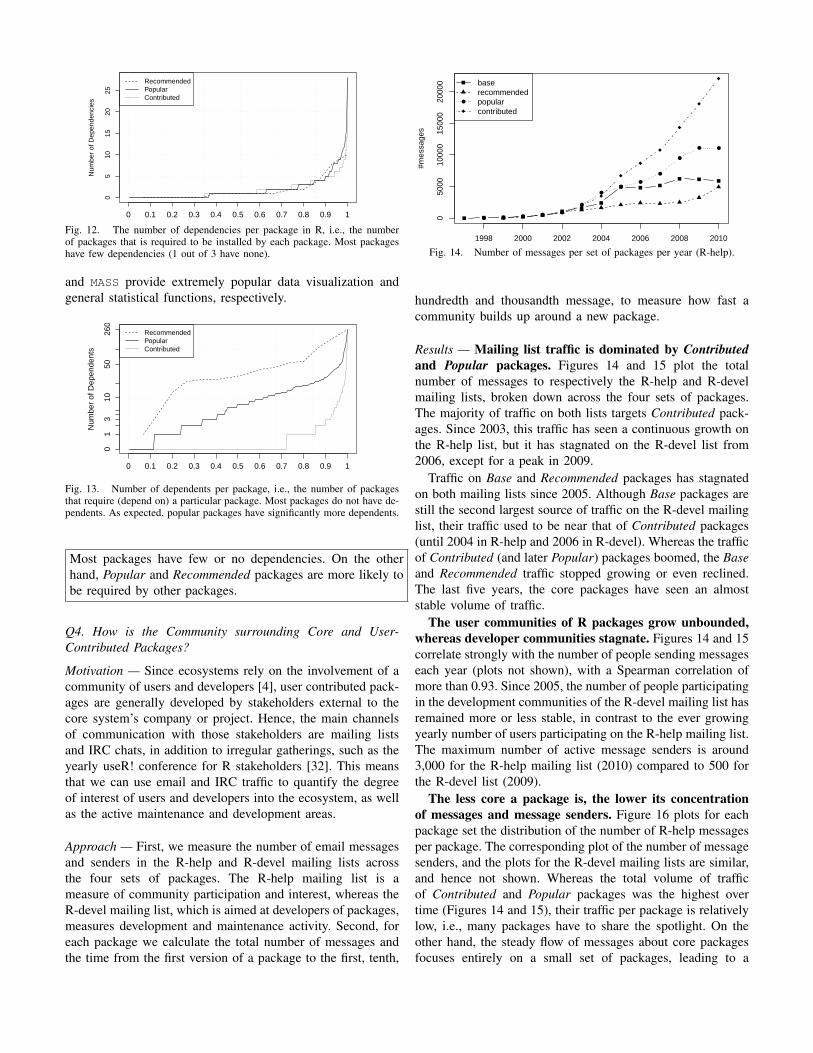
Results — The number of dependencies per package isconsistently low across all package sets. Figure 12 showsthe number of dependencies per package, that is, the numberof packages required by a given package to be installed. As canbe observed, almost 1/3 of all packages have no dependencies,and 73% have less than 2 (for reference, Debian 4.0 had amedian of 3 dependencies per package [10]). A Wilcoxon ranksum test shows that the three distributions in the Figure arenot statistically different (i.e., the number of dependencies isindependent of the package’s set).
The less core a package is, the less packages dependon it. Figure 13 shows the number of dependents per package(i.e., the number of packages that require the package). As canbe observed, 72% of the Contributed packages are not requiredby any other package (similar to Debian 4.0 packages [10]).On the other hand, Popular packages (median of 6 depen-dents) and Recommended packages in particular (median of30 dependents) are significantly likely to be required by otherpackages. As expected, packages closer to the core tend toperform lower-level functionality needed by user-contributedpackages. For example, Recommended packages like lattice
05
1015
2025
Number of Dependencies Per Package
Proportion of Packages
Num
ber
of D
epen
denc
ies
0 0.1 0.2 0.3 0.4 0.5 0.6 0.7 0.8 0.9 1
RecommendedPopularContributed
Fig. 12. The number of dependencies per package in R, i.e., the numberof packages that is required to be installed by each package. Most packageshave few dependencies (1 out of 3 have none).
and MASS provide extremely popular data visualization andgeneral statistical functions, respectively.
Number of Dependents Per Package
Proportion of Packages
Num
ber
of D
epen
dent
s
0 0.1 0.2 0.3 0.4 0.5 0.6 0.7 0.8 0.9 1
01
310
5026
0
RecommendedPopularContributed
Fig. 13. Number of dependents per package, i.e., the number of packagesthat require (depend on) a particular package. Most packages do not have de-pendents. As expected, popular packages have significantly more dependents.
Most packages have few or no dependencies. On the otherhand, Popular and Recommended packages are more likely tobe required by other packages.
Q4. How is the Community surrounding Core and User-Contributed Packages?
Motivation — Since ecosystems rely on the involvement of acommunity of users and developers [4], user contributed pack-ages are generally developed by stakeholders external to thecore system’s company or project. Hence, the main channelsof communication with those stakeholders are mailing listsand IRC chats, in addition to irregular gatherings, such as theyearly useR! conference for R stakeholders [32]. This meansthat we can use email and IRC traffic to quantify the degreeof interest of users and developers into the ecosystem, as wellas the active maintenance and development areas.
Approach — First, we measure the number of email messagesand senders in the R-help and R-devel mailing lists acrossthe four sets of packages. The R-help mailing list is ameasure of community participation and interest, whereas theR-devel mailing list, which is aimed at developers of packages,measures development and maintenance activity. Second, foreach package we calculate the total number of messages andthe time from the first version of a package to the first, tenth,
1998 2000 2002 2004 2006 2008 2010
050
0010
000
1500
020
000
#mes
sage
s
● ● ● ● ●
●
●
●●
●
●
● ●
●
baserecommendedpopularcontributed
Fig. 14. Number of messages per set of packages per year (R-help).
hundredth and thousandth message, to measure how fast acommunity builds up around a new package.
Results — Mailing list traffic is dominated by Contributedand Popular packages. Figures 14 and 15 plot the totalnumber of messages to respectively the R-help and R-develmailing lists, broken down across the four sets of packages.The majority of traffic on both lists targets Contributed pack-ages. Since 2003, this traffic has seen a continuous growth onthe R-help list, but it has stagnated on the R-devel list from2006, except for a peak in 2009.
Traffic on Base and Recommended packages has stagnatedon both mailing lists since 2005. Although Base packages arestill the second largest source of traffic on the R-devel mailinglist, their traffic used to be near that of Contributed packages(until 2004 in R-help and 2006 in R-devel). Whereas the trafficof Contributed (and later Popular) packages boomed, the Baseand Recommended traffic stopped growing or even reclined.The last five years, the core packages have seen an almoststable volume of traffic.
The user communities of R packages grow unbounded,whereas developer communities stagnate. Figures 14 and 15correlate strongly with the number of people sending messageseach year (plots not shown), with a Spearman correlation ofmore than 0.93. Since 2005, the number of people participatingin the development communities of the R-devel mailing list hasremained more or less stable, in contrast to the ever growingyearly number of users participating on the R-help mailing list.The maximum number of active message senders is around3,000 for the R-help mailing list (2010) compared to 500 forthe R-devel list (2009).
The less core a package is, the lower its concentrationof messages and message senders. Figure 16 plots for eachpackage set the distribution of the number of R-help messagesper package. The corresponding plot of the number of messagesenders, and the plots for the R-devel mailing lists are similar,and hence not shown. Whereas the total volume of trafficof Contributed and Popular packages was the highest overtime (Figures 14 and 15), their traffic per package is relativelylow, i.e., many packages have to share the spotlight. On theother hand, the steady flow of messages about core packagesfocuses entirely on a small set of packages, leading to a

1998 2000 2002 2004 2006 2008 2010
050
010
0015
0020
0025
00
#mes
sage
s
● ●● ●
●
●
●
●
● ● ●
●
●
●
baserecommendedpopularcontributed
Fig. 15. Number of messages per set of packages per year (R-devel).
110
010
000
Tota
l #m
essa
ges
base recommended popular contributed
Fig. 16. Distribution of the number of messages per package and set (R-help).
high concentration of messages per package. Similarly, thecore packages are discussed by more message senders thanContributed packages.
It appears to take one year (median) to start up a communityfor Popular and Contributed packages, whereas core packagesonly take a couple of months. Figure 17 plots for each setof packages the distribution of the time to the first, tenth,hundredth and thousandth message of each package (R-help;the beanplots for R-devel are similar). Core packages havethe lowest start-up time. The median time to the first andtenth message of a Base package is only 1 week and 82 daysrespectively, compared to 31 days and 369.5 days for Popularpackages. As found earlier for Q2, new Contributed packagesneed to face fierce competition to receive more popularity.
It is also interesting to compare Popular packages to Con-tributed packages, since the former were successful at gainingmomentum, whereas the latter failed to do so. Figure 17suggests that Popular packages in general took less time tobuild up a community than the other contributed packages.The latter take two months longer to their first message, and 5months longer to their tenth message. In other words, popularcontributed packages seem to be picked up sooner.
Note that not all packages are discussed one thousand, onehundred or even ten times. Table II shows that the probabilityof reaching 1, 10, 100 or 1,000 messages on a mailing listdecreases the less core a package is. For example, only 0.52%of the Contributed packages (9 packages) on R-help and 0.1%(1 package) on R-devel reach 1,000 messages, compared to69.2% (9 packages) and 23.1% (3 packages) of the Base
Tim
e
instantday
week
month
year
5 year10 year
1st msg. 10th msg. 100th msg. 1000th msg.
baserecommendedpopularcontributed
Fig. 17. Distribution of the time to the 1st/10th/100th/1000th message of apackage per set in the R-help mailing list (R-devel is similar).
TABLE IIPERCENTAGE OF Base, Recommended, Popular AND Contributed PACKAGES
REACHING 1, 10, 100 OR 1,000 MESSAGES ON THE MAILING LISTS.
R-help R-devel1 10 100 1,000 1 10 100 1,000
base 100 100 100 69.2 100 100 92.3 23.1recomm. 100 100 86.7 33.3 100 93.3 53.3 0
pop. 100 97.7 44.9 2.3 100 58.5 4.0 0.6contrib. 100 31.2 6.5 0.52 100 11.1 1.3 0.1
packages. These numbers confirm the findings of Figure 16.
User-contributed packages are discussed by less people thancore packages. Communities are build around core packagesin months compared to a year for user-contributed packages.
V. DISCUSSION
The results of our case study are summarized in Table III.Many of these results are obvious (e.g., core packages aremore documented, are older and have more dependents thanuser-contributed). Others are not: the size of packages issimilar among all, most all well maintained and most have fewdependencies. We believe that this is due to the infrastructurecreated by R to provide an efficient and automatic dependencymanagement system that frees the end-user from the complex-ities of dependencies between packages (all the user has todo is install.package("name")). The R ecosystem alsostrongly relies on conventions and best practices, for exampleregarding documentation, release continuity and mailing listtraffic. Packages are tested nightly. If their tests fail (packagesmust have tests) their are quarantined, and eventually removedif not fixed. The policies, documentation and infrastructureprovided by the R ecosystem appears to increase both thenumber of contributors and user productivity, and improve itssuccess. However, these are hypotheses that should be testedwith further research.
Regarding the R community, we found that user contribu-tions need to fight for attention. It is not clear, however, howusers deal with this. What are their motivations to create andcontribute packages? What is the typical evolution and main-tenance process of a user-contributed package? How mucheffort is invested in creating and maintaining an R package?
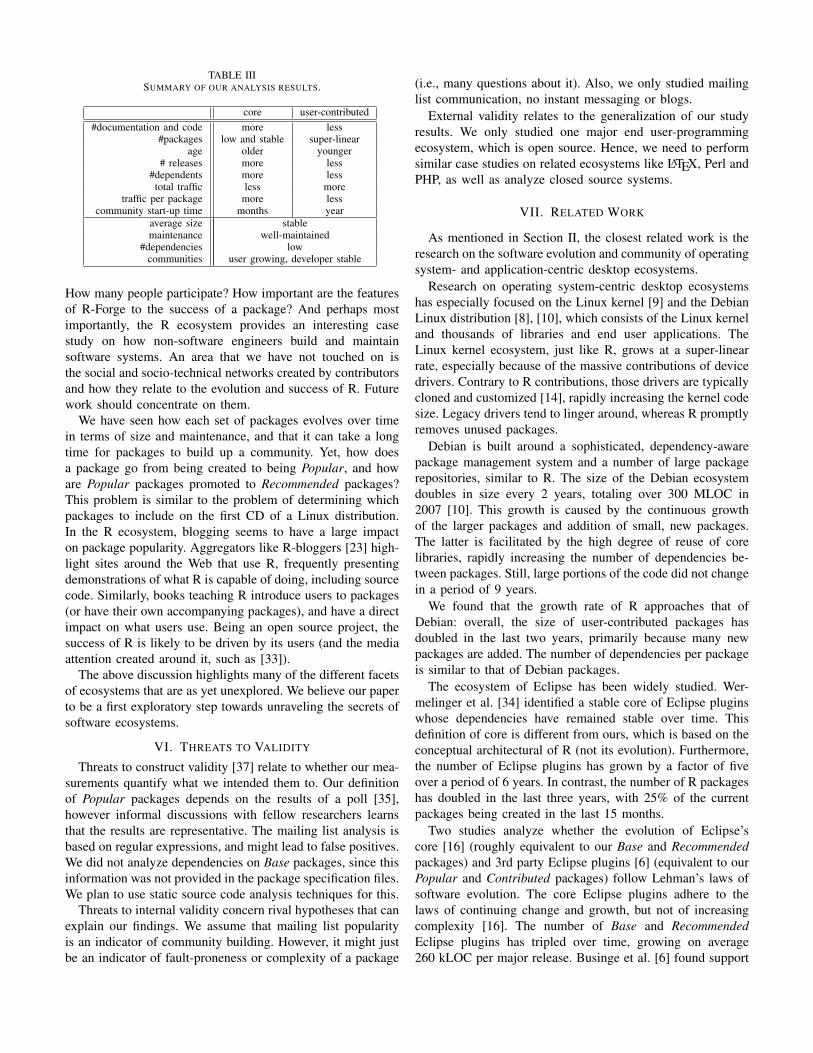
TABLE IIISUMMARY OF OUR ANALYSIS RESULTS.
core user-contributed#documentation and code more less
#packages low and stable super-linearage older younger
# releases more less#dependents more less
total traffic less moretraffic per package more less
community start-up time months yearaverage size stablemaintenance well-maintained
#dependencies lowcommunities user growing, developer stable
How many people participate? How important are the featuresof R-Forge to the success of a package? And perhaps mostimportantly, the R ecosystem provides an interesting casestudy on how non-software engineers build and maintainsoftware systems. An area that we have not touched on isthe social and socio-technical networks created by contributorsand how they relate to the evolution and success of R. Futurework should concentrate on them.
We have seen how each set of packages evolves over timein terms of size and maintenance, and that it can take a longtime for packages to build up a community. Yet, how doesa package go from being created to being Popular, and howare Popular packages promoted to Recommended packages?This problem is similar to the problem of determining whichpackages to include on the first CD of a Linux distribution.In the R ecosystem, blogging seems to have a large impacton package popularity. Aggregators like R-bloggers [23] high-light sites around the Web that use R, frequently presentingdemonstrations of what R is capable of doing, including sourcecode. Similarly, books teaching R introduce users to packages(or have their own accompanying packages), and have a directimpact on what users use. Being an open source project, thesuccess of R is likely to be driven by its users (and the mediaattention created around it, such as [33]).
The above discussion highlights many of the different facetsof ecosystems that are as yet unexplored. We believe our paperto be a first exploratory step towards unraveling the secrets ofsoftware ecosystems.
VI. THREATS TO VALIDITY
Threats to construct validity [37] relate to whether our mea-surements quantify what we intended them to. Our definitionof Popular packages depends on the results of a poll [35],however informal discussions with fellow researchers learnsthat the results are representative. The mailing list analysis isbased on regular expressions, and might lead to false positives.We did not analyze dependencies on Base packages, since thisinformation was not provided in the package specification files.We plan to use static source code analysis techniques for this.
Threats to internal validity concern rival hypotheses that canexplain our findings. We assume that mailing list popularityis an indicator of community building. However, it might justbe an indicator of fault-proneness or complexity of a package
(i.e., many questions about it). Also, we only studied mailinglist communication, no instant messaging or blogs.
External validity relates to the generalization of our studyresults. We only studied one major end user-programmingecosystem, which is open source. Hence, we need to performsimilar case studies on related ecosystems like LATEX, Perl andPHP, as well as analyze closed source systems.
VII. RELATED WORK
As mentioned in Section II, the closest related work is theresearch on the software evolution and community of operatingsystem- and application-centric desktop ecosystems.
Research on operating system-centric desktop ecosystemshas especially focused on the Linux kernel [9] and the DebianLinux distribution [8], [10], which consists of the Linux kerneland thousands of libraries and end user applications. TheLinux kernel ecosystem, just like R, grows at a super-linearrate, especially because of the massive contributions of devicedrivers. Contrary to R contributions, those drivers are typicallycloned and customized [14], rapidly increasing the kernel codesize. Legacy drivers tend to linger around, whereas R promptlyremoves unused packages.
Debian is built around a sophisticated, dependency-awarepackage management system and a number of large packagerepositories, similar to R. The size of the Debian ecosystemdoubles in size every 2 years, totaling over 300 MLOC in2007 [10]. This growth is caused by the continuous growthof the larger packages and addition of small, new packages.The latter is facilitated by the high degree of reuse of corelibraries, rapidly increasing the number of dependencies be-tween packages. Still, large portions of the code did not changein a period of 9 years.
We found that the growth rate of R approaches that ofDebian: overall, the size of user-contributed packages hasdoubled in the last two years, primarily because many newpackages are added. The number of dependencies per packageis similar to that of Debian packages.
The ecosystem of Eclipse has been widely studied. Wer-melinger et al. [34] identified a stable core of Eclipse pluginswhose dependencies have remained stable over time. Thisdefinition of core is different from ours, which is based on theconceptual architectural of R (not its evolution). Furthermore,the number of Eclipse plugins has grown by a factor of fiveover a period of 6 years. In contrast, the number of R packageshas doubled in the last three years, with 25% of the currentpackages being created in the last 15 months.
Two studies analyze whether the evolution of Eclipse’score [16] (roughly equivalent to our Base and Recommendedpackages) and 3rd party Eclipse plugins [6] (equivalent to ourPopular and Contributed packages) follow Lehman’s laws ofsoftware evolution. The core Eclipse plugins adhere to thelaws of continuing change and growth, but not of increasingcomplexity [16]. The number of Base and RecommendedEclipse plugins has tripled over time, growing on average260 kLOC per major release. Businge et al. [6] found support

for Lehman’s laws of continuing change, self-regulation andcontinuing growth for the evolution of 21 3rd-party plugins.
The studies mentioned thus far do not consider the com-munity aspect of ecosystems, like documentation, bug reportsor mailing list traffic. Schackmann et al. [28] performed anempirical study of the change request process of the Base andRecommended Eclipse plugins. They found that the qualityof change requests and the time to triage a request varysignificantly across plugins. Kidane et al. [15] analyzed thedevelopment mailing lists and bug repositories of 33 Eclipsesubprojects (collections of plugins). They found that addingnew features slows down the bug fix process and that moredistributed social networks foster the development of newfeatures. Finally, Yu studied the mailing lists of the Linuxkernel to analyze different ecosystem collaboration patternsbetween companies [38]. We analyzed the R-help and R-develmailing lists to measure the size, growth and dynamics of theR ecosystem community.
VIII. CONCLUSION
In this exploratory empirical study, we have shown that Ris a flourishing ecosystem of user-contributed packages that isgrowing super-linearly, with a strong set of core packages.
In these ecosystems, it becomes impossible to separatethe evolution of the underlying system from the evolutionof its community of users and contributions. After all, thepower of R is in the features that user-contributed packagesimplement. Hence, ensuring a healthy community aroundcontributions of high quality (size and documentation) andwell-maintained (new releases and collaboration) packages isessential according to our findings. In future work, we plan tocontinue studying the factors that facilitate healthy evolution inother ecosystems, both end-user as other kinds of ecosystems.
REFERENCES
[1] A. Bacchelli, M. Lanza, and R. Robbes. Linking e-mails and sourcecode artifacts. In Proc. of the 32nd ACM/IEEE Intl. Conf. on SoftwareEngineering (ICSE) – Volume 1, pages 375–384, 2010.
[2] N. Bettenburg, E. Shihab, and A. E. Hassan. An empirical study on therisks of using off-the-shelf techniques for processing mailing list data.In Proc. of the 25th IEEE Intl. Conf. on Software Maintenance (ICSM),pages 539–542, 2009.
[3] J. Bosch. From software product lines to software ecosystems. In Proc.of the 13th Intl. Software Product Line Conference (SPLC), pages 111–119, San Francisco, California, 2009.
[4] J. Bosch and P. Bosch-Sijtsema. From integration to composition: On theimpact of software product lines, global development and ecosystems.J. Syst. Softw., 83:67–76, January 2010.
[5] V. Boucharas, S. Jansen, and S. Brinkkemper. Formalizing softwareecosystem modeling. In Proc. of the 1st Intl. Wrksh. on Open ComponentEcosystems (IWOCE), pages 41–50, 2009.
[6] J. Businge, A. Serebrenik, and M. van den Brand. An empirical study ofthe evolution of eclipse 3rd-party plug-ins. In Proc. of the Joint ERCIMWrksh. on Software Evolution and Intl. Wrksh. on Principles of SoftwareEvolution (IWPSE-EVOL), pages 63–72, 2010.
[7] M. Cataldo and J. D. Herbsleb. Architecting in software ecosystems:interface translucence as an enabler for scalable collaboration. In Proc.of the 4th European Conf. on Software Architecture (ECSA): CompanionVolume, pages 65–72, 2010.
[8] D. M. German, J. M. Gonzalez-Barahona, and G. Robles. A model tounderstand the building and running inter-dependencies of software. InProc. of the 14th Working Conf. on Reverse Engineering (WCRE), pages130–139, 2007.
[9] M. W. Godfrey and Q. Tu. Evolution in open source software: A casestudy. In Proc. of the Intl. Conf. on Software Maintenance (ICSM),pages 131–142, 2000.
[10] J. M. Gonzalez-Barahona, G. Robles, M. Michlmayr, J. J. Amor, andD. M. German. Macro-level software evolution: a case study of a largesoftware compilation. Empirical Softw. Engg., 14:262–285, June 2009.
[11] S. Jansen, S. Brinkkemper, and A. Finkelstein. Business networkmanagement as a survival strategy: A tale of two software ecosystems.In Proc. of the 1st Intl. Workshop on Software Ecosystems (IWSECO),September 2009.
[12] S. Jansen, A. Finkelstein, and S. Brinkkemper. A sense of community: Aresearch agenda for software ecosystems. In 31st Intl. Conf. on SoftwareEngineering (ICSE): Companion Volume, pages 187–190, May 2009.
[13] P. Kampstra. Beanplot: A boxplot alternative for visual comparison ofdistributions. Journal of Statistical Software, Code Snippets, 28(1):1–9,10 2008.
[14] C. J. Kapser and M. W. Godfrey. ”cloning considered harmful”considered harmful: patterns of cloning in software. Empirical Softw.Engg., 13:645–692, December 2008.
[15] Y. H. Kidane and P. A. Gloor. Correlating temporal communicationpatterns of the eclipse open source community with performance andcreativity. Comput. Math. Organ. Theory, 13:17–27, March 2007.
[16] T. Mens, J. Fernandez-Ramil, and S. Degrandsart. The evolution ofeclipse. In Proc. of the 24th IEEE Intl. Conf. on Software Maintenance(ICSM), pages 386–395, September 2008.
[17] D. G. Messerschmitt and C. Szyperski. Software Ecosystem: Un-derstanding an Indispensable Technology and Industry. MIT Press,Cambridge, MA, USA, 2003.
[18] F. Morandat, B. Hill, L. Osvald, and J. Vitek. Evaluating the designof the r language: objects and functions for data analysis. In Proc. ofthe 26th European Conf. on Object-Oriented Programming (ECOOP),pages 104–131, 2012.
[19] R. A. Muenchen. The popularity of data analysis software.http://bit.ly/eJJOif. April 2011.
[20] O. Pettersson, M. Svensson, D. Gil, J. Andersson, and M. Milrad. Onthe role of software process modeling in software ecosystem design. InProc. of the 4th European Conf. on Software Architecture: CompanionVol., pages 103–110, 2010.
[21] R-devel list. https://stat.ethz.ch/pipermail/r-devel/. March 31, 2011.[22] R-help list. https://stat.ethz.ch/pipermail/r-help/. March 31, 2011.[23] R-bloggers. http://bit.ly/7ydKyD. April 2011.[24] http://bit.ly/bmpDeK. April 2011.[25] Rexer analytics 4th annual data miner survey 2010. http://bit.ly/fryQGr.
April 2011.[26] R+. http://bit.ly/xbiSOv. April 2011.[27] GNU R. http://bit.ly/FQZd. April 2011.[28] H. Schackmann, H. Schaefer, and H. Lichter. Evaluating process quality
based on change request data — an empirical study of the eclipse project.In Proc. of the Intl. Conf. on Software Process and Product Measurement(IWSM/MENSURA), pages 227–241, 2009.
[29] D. Seichter, D. Dhungana, A. Pleuss, and B. Hauptmann. Knowledgemanagement in software ecosystems: software artefacts as first-classcitizens. In Proc. of the 4th European Conf. on Software Architecture(ECSA): Companion Vol., pages 119–126, 2010.
[30] S. Theul and A. Zeileis. Collaborative software development using r-forge. The R Journal, 1(1):9–14, 2009.
[31] Tiobe index. http://bit.ly/rItE. April 2011.[32] useR! 2011. http://bit.ly/fQGPc2. April 2011.[33] S. Vance. Data Analysts Captivated by R’s Power. Business Computing,
The New York Times. Jan. 6, 2009.[34] M. Wermelinger and Y. Yu. Analyzing the evolution of eclipse plugins.
In Proc. of the 2008 intl. working conf. on Mining Software Repositories(MSR), pages 133–136, Leipzig, Germany, 2008.
[35] J. M. White and D. Conway. Using Data Tools to Find Data Tools, theYo Dawg of Data Hacking. http://bit.ly/aHl5TQ, Oct 2010.
[36] Z. Xing and E. Stroulia. API-Evolution Support with Diff-CatchUp.IEEE Trans. Softw. Eng., 33:818–836, December 2007.
[37] R. K. Yin. Case Study Research: Design and Methods - Third Edition.SAGE Publications, London, 2002.
[38] L. Yu, S. Ramaswamy, and J. Bush. Software evolvability: An ecosystempoint of view. In Proc. of the IEEE Intl. Wrksh. on Software Evolvability,pages 75–80, 2007.