THE EUROPEANS’DECISION OF SAVING FOR RETIREMENT… ANNUAL MEETINGS... · 1 THE...
32
1 THE EUROPEANS’DECISION OF SAVING FOR RETIREMENT: A GENDER ANALYSIS * Sara Fernandez, Luis Otero, Milagros Vivel and Pablo Duran University of Santiago de Compostela, Faculty of Economics and Business, 15.782-Santiago de Compostela (Spain) (e-mail: [email protected]) ABSTRACT: the purpose of this paper is to investigate what factors are driving the saving behaviour of European individuals for their retirement and whether they differ by gender and country. . Our evidence is based on a sample of 6,036 individuals from 8 European countries. The results show that although the percentage of savers for retirement varies widely across countries, the driving forces of this saving behavior are quite similar regardless the gender. Thus, this decision is positively related to the individuals´ age, financial literacy, income, employment status and saving habit. In addition, the results suggest that country-level institutional factors also play a crucial role on the individual’s retirement attitudes. Finally, we find that women are more likely to save for retirement than men but the driving factors of this saving behaviour are practically the same for both genders. KEYWORDS: retirement savings, Europe, gender, determinants 1. INTRODUCTION In light of current trends in ageing¸ employment and fertility rates, European policymakers are shifting the responsibility for retirement funding to individuals. According to OECD (1998), during the next decades increasing life expectancy and the passage of the baby-boom generation from work to retirement will reduce the amount of time that western societies devote to employment. Under these circumstances, the old model of sharing societies’ resources between working people and retirees by pay-as- you-go (PAYG) transfers is becoming unsustainable. As a consequence, in several countries the onus is inevitably shifting on individual savings to supplement the * We are grateful to the European Commission DG Internal Market and Services for permission to use the data gathered for the study The EU Market For Consumer Long Term Retail Savings Vehicles. Comparative Analysis Of Products, Market Structure, Costs, Distribution Systems and Consumer Saving Patterns (http://ec.europa.eu/internal_market/finances/docs/cross-sector/study_en.pdf .
Transcript of THE EUROPEANS’DECISION OF SAVING FOR RETIREMENT… ANNUAL MEETINGS... · 1 THE...
1
THE EUROPEANS’DECISION OF SAVING FOR RETIREMENT: A
GENDER ANALYSIS*
Sara Fernandez, Luis Otero, Milagros Vivel and Pablo Duran
University of Santiago de Compostela, Faculty of Economics and Business, 15.782-Santiago de Compostela (Spain)
(e-mail: [email protected])
ABSTRACT: the purpose of this paper is to investigate what factors are driving the
saving behaviour of European individuals for their retirement and whether they differ by
gender and country. . Our evidence is based on a sample of 6,036 individuals from 8
European countries. The results show that although the percentage of savers for
retirement varies widely across countries, the driving forces of this saving behavior are
quite similar regardless the gender. Thus, this decision is positively related to the
individuals´ age, financial literacy, income, employment status and saving habit. In
addition, the results suggest that country-level institutional factors also play a crucial
role on the individual’s retirement attitudes. Finally, we find that women are more likely
to save for retirement than men but the driving factors of this saving behaviour are
practically the same for both genders.
KEYWORDS: retirement savings, Europe, gender, determinants
1. INTRODUCTION
In light of current trends in ageing¸ employment and fertility rates, European
policymakers are shifting the responsibility for retirement funding to individuals.
According to OECD (1998), during the next decades increasing life expectancy and the
passage of the baby-boom generation from work to retirement will reduce the amount of
time that western societies devote to employment. Under these circumstances, the old
model of sharing societies’ resources between working people and retirees by pay-as-
you-go (PAYG) transfers is becoming unsustainable. As a consequence, in several
countries the onus is inevitably shifting on individual savings to supplement the
* We are grateful to the European Commission DG Internal Market and Services for permission to use the data gathered for the study The EU Market For Consumer Long Term Retail Savings Vehicles. Comparative Analysis Of Products, Market Structure, Costs, Distribution Systems and Consumer Saving Patterns (http://ec.europa.eu/internal_market/finances/docs/cross-sector/study_en.pdf.
2
necessary minimum provided by public pension schemes (European Commission,
2007).
In addition to public pension schemes, employer pensions also play an important role as
a source of retirement income. According to Gustman and Steinmeier (1992), an
important structural change in employer-sponsored plans is the shift from employer-
sponsored defined-benefit (DB) plans (where, in broad terms, the benefits are linked to
a final salary) to defined-contribution (DC) retirement plans, (where the benefits will
depend on a number of factors, such as market value of the assets held in individual
accounts). This trend places a large share of the asset allocation responsibility and
investment risk directly on workers rather than employers.
The ongoing financial and economic crisis is also having a deep impact on retirement
incomes. Both private pension funds and public pension schemes have been badly
affected. The investments of the private pension funds lost 23% of their value on
aggregate (or some USD 5.4 trillion) in 2008. Likewise, some public pension reserve
funds have suffered important losses on their investments. In addition, the contribution
revenue of pay-as-you-go pension systems will be reduce as a consequence of
unemployment and lower earnings, making it more difficult for public pension schemes
to deliver pension benefits (OECD, 2009).
This state of affairs makes it essential to properly understand to what extent individuals
are interested in saving in order to enable them to prepare adequately for retirement.
Retirement preparation is a complex task because the information required for making
decisions is extensive, and the rules concerning Social Security and pensions are rather
elaborated (Lusardi, 2001). As a consequence, some experts suggest that planning for
retirement is least pursued by those who need it the most, namely women, single heads
of households, and the economically disadvantaged (Hayes and Parker, 1993).
Women have been particularly vulnerable in this respect since:
1) They will need to support a longer retirement period than men. In 2006, on
average, women aged 65 could expect to live an additional 20.1 years, whereas
men of the same age could expect to live 16.7 more years (OECD, 2009).
2) Women earn less than men. According to OECD (2008b), women are 20%
less likely than men to have a paid job in OECD countries and they earn on
average 17% less than men.
3
3) They have shorter working lives and subpar benefits packages (Bajtelsmit,
2006).
4) Moreover, if women are more risky averse than men (Diaz-Serrano and
O’Neill, 2004; Dohmen et al., 2005; Dwyer et al., 2002; Hinz et al., 1996;
VanDerhei and Olsen, 2000), the shift from employer-sponsored defined-benefit
plans to more self-directed pension plans, which require participants to make
their own allocation decisions, can increase the disparities in retirement income
between men and women.
The aim of this paper is to investigate what factors are driving the saving behaviour of
European individuals for their retirement and whether they differ by gender and
country. Firstly, we analyze what individuals’ socio-demographic characteristics are
important determinants of the decision of saving for retirement, paying especial
attention to gender. Secondly, we ask whether, all things equal, men and women have
both the same probability and driving forces of saving for retirement. Thirdly, we
analyze whether differences in the decision of saving for retirement can be explained by
country-specific differences in saving attitudes by considering eight European countries:
France, Germany, Italy, Poland, the Netherlands, Spain, Sweden and the United
Kingdom.
This analysis offers interesting opportunities for a better understanding of the retirement
attitudes of European investors which is important for four main reasons. Firstly, the
impact of current trends of ageing and employment on women’ income in retirement
has received minor attention. Secondly, the European public pension reforms and the
increasing trend toward DC retirement plans are likely to increase reliance on individual
saving efforts and investors’ decisions. In this context, ill-advised individual choices in
allocating retirement wealth, especially during periods of financial crises, can create
major financial distress at a point in the life-cycle where the potential for offsetting
adjustments is quite limited (Christelis et al., 2006). Thirdly, as a consequence of the
current financial and economic crisis many people have lost both a substantial amount
of their retirement savings and their jobs. This problem is especially acute for older
workers, who not only face greater problems to find a new job but also have little time
to wait for their pension savings to recover (OECD, 2009). Therefore, it is essential to
know to what extent individuals are adequately prepared for retirement. Finally, most of
the existing studies of observed financial behaviour rely on U.S. data (Badunenko et al.,
4
2009). This paper complements the studies focused on a European context, which
present important institutional differences to the ones focused on the U.S. In this regard,
most of the continental European countries have been characterized by a short tradition
of individual retirement accounts and a greater reliance on public pension schemes. As a
consequence, in some of them pension markets are still not sufficiently developed.
This paper is organized as follows. Section 2 describes the theoretical background of the
models and the hypotheses related to savings for retirement. Section 3 discusses the
influence of gender on saving decisions. In section 4 the methodology is explained. In
section 5 the empirical results are presented. In section 6, we conclude by summarizing
the most important findings, discussing several implications for policy-makers,
introducing the potential limitations of the research and discussing areas for further
research.
2. EARLIER LITERATURE AND THEORETICAL BACKGROUND
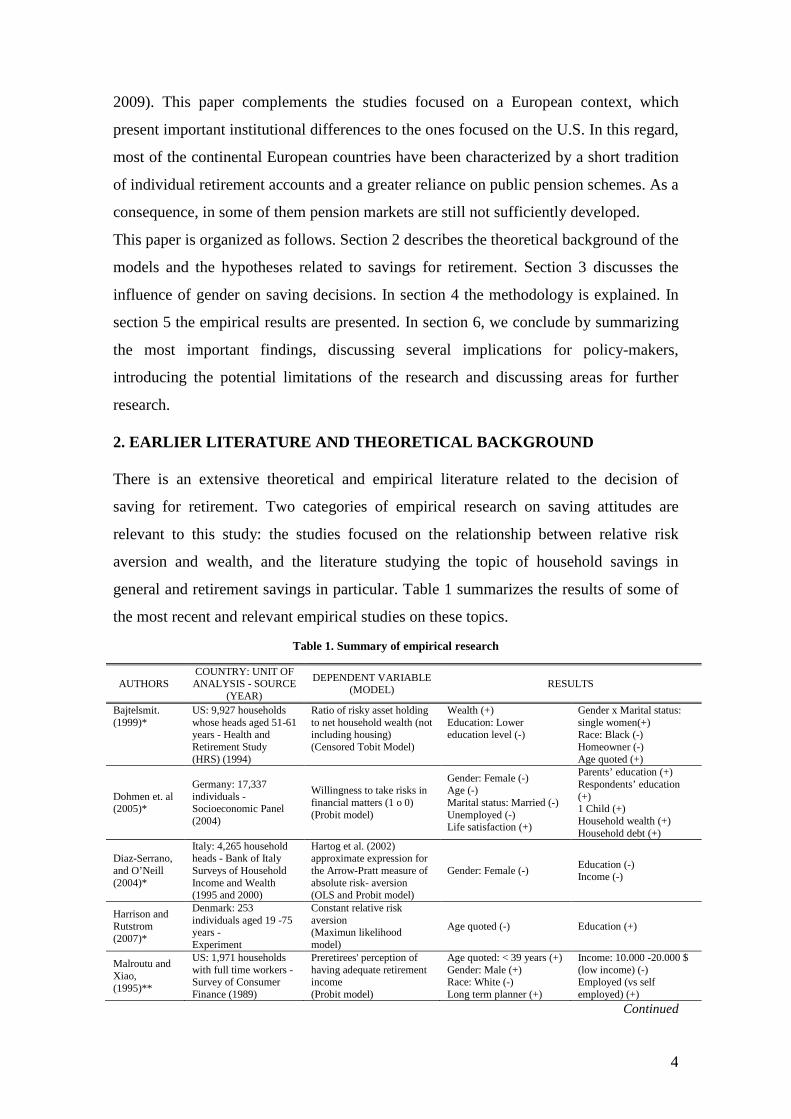
There is an extensive theoretical and empirical literature related to the decision of
saving for retirement. Two categories of empirical research on saving attitudes are
relevant to this study: the studies focused on the relationship between relative risk
aversion and wealth, and the literature studying the topic of household savings in
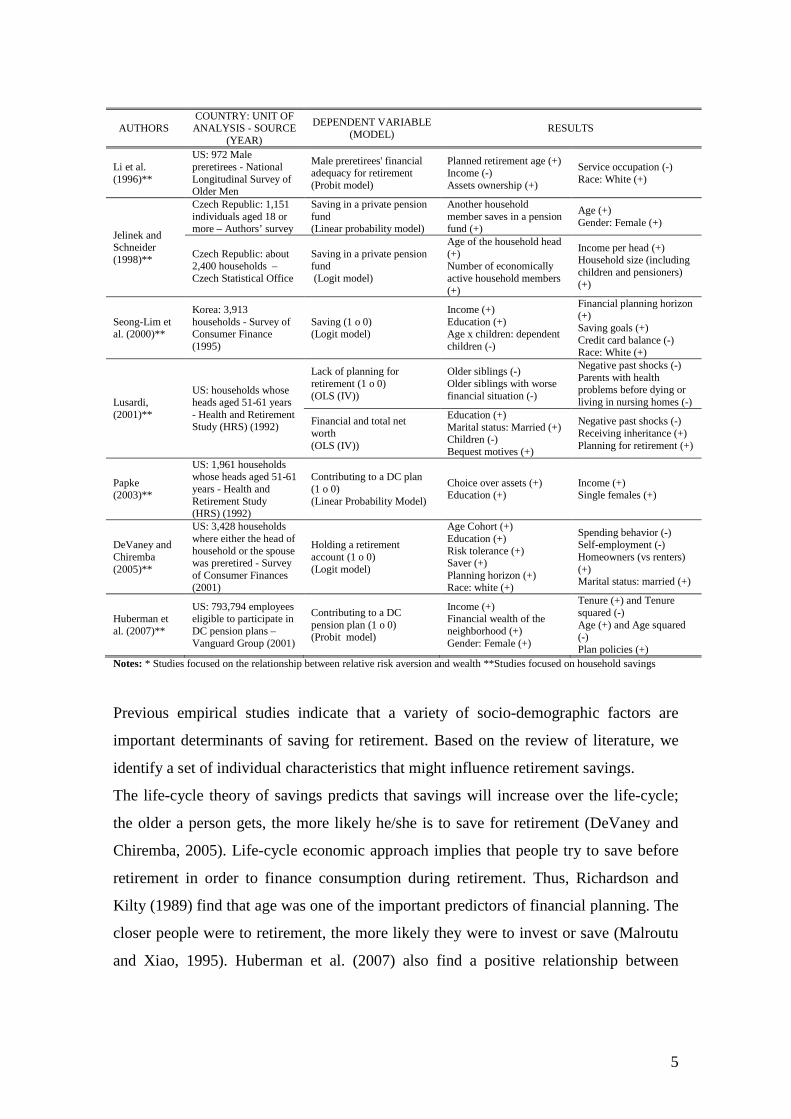
general and retirement savings in particular. Table 1 summarizes the results of some of
the most recent and relevant empirical studies on these topics.
Table 1. Summary of empirical research
AUTHORS COUNTRY: UNIT OF ANALYSIS - SOURCE
(YEAR)
DEPENDENT VARIABLE (MODEL) RESULTS
Bajtelsmit. (1999)*
US: 9,927 households whose heads aged 51-61 years - Health and Retirement Study (HRS) (1994)
Ratio of risky asset holding to net household wealth (not including housing) (Censored Tobit Model)
Wealth (+) Education: Lower education level (-)
Gender x Marital status: single women(+) Race: Black (-) Homeowner (-) Age quoted (+)
Dohmen et. al (2005)*
Germany: 17,337 individuals - Socioeconomic Panel (2004)
Willingness to take risks in financial matters (1 o 0) (Probit model)
Gender: Female (-) Age (-) Marital status: Married (-) Unemployed (-) Life satisfaction (+)
Parents’ education (+) Respondents’ education (+) 1 Child (+) Household wealth (+) Household debt (+)
Diaz-Serrano, and O’Neill (2004)*
Italy: 4,265 household heads - Bank of Italy Surveys of Household Income and Wealth (1995 and 2000)
Hartog et al. (2002) approximate expression for the Arrow-Pratt measure of absolute risk- aversion (OLS and Probit model)
Gender: Female (-) Education (-) Income (-)
Harrison and Rutstrom (2007)*
Denmark: 253 individuals aged 19 -75 years - Experiment
Constant relative risk aversion (Maximun likelihood model)
Age quoted (-) Education (+)
Malroutu and Xiao, (1995)**
US: 1,971 households with full time workers - Survey of Consumer Finance (1989)
Preretirees' perception of having adequate retirement income (Probit model)
Age quoted: < 39 years (+) Gender: Male (+) Race: White (-) Long term planner (+)
Income: 10.000 -20.000 $ (low income) (-) Employed (vs self employed) (+)
Continued
5
AUTHORS COUNTRY: UNIT OF ANALYSIS - SOURCE
(YEAR)
DEPENDENT VARIABLE (MODEL) RESULTS
Li et al. (1996)**
US: 972 Male preretirees - National Longitudinal Survey of Older Men
Male preretirees' financial adequacy for retirement (Probit model)
Planned retirement age (+) Income (-) Assets ownership (+)
Service occupation (-) Race: White (+)
Jelinek and Schneider (1998)**
Czech Republic: 1,151 individuals aged 18 or more – Authors’ survey
Saving in a private pension fund (Linear probability model)
Another household member saves in a pension fund (+)
Age (+) Gender: Female (+)
Czech Republic: about 2,400 households – Czech Statistical Office
Saving in a private pension fund (Logit model)
Age of the household head (+) Number of economically active household members (+)
Income per head (+) Household size (including children and pensioners) (+)
Seong-Lim et al. (2000)**
Korea: 3,913 households - Survey of Consumer Finance (1995)
Saving (1 o 0) (Logit model)
Income (+) Education (+) Age x children: dependent children (-)
Financial planning horizon (+) Saving goals (+) Credit card balance (-) Race: White (+)
Lusardi, (2001)**
US: households whose heads aged 51-61 years - Health and Retirement Study (HRS) (1992)
Lack of planning for retirement (1 o 0) (OLS (IV))
Older siblings (-) Older siblings with worse financial situation (-)
Negative past shocks (-) Parents with health problems before dying or living in nursing homes (-)
Financial and total net worth (OLS (IV))
Education (+) Marital status: Married (+) Children (-) Bequest motives (+)
Negative past shocks (-) Receiving inheritance (+) Planning for retirement (+)
Papke (2003)**
US: 1,961 households whose heads aged 51-61 years - Health and Retirement Study (HRS) (1992)
Contributing to a DC plan (1 o 0) (Linear Probability Model)
Choice over assets (+) Education (+)
Income (+) Single females (+)
DeVaney and Chiremba (2005)**
US: 3,428 households where either the head of household or the spouse was preretired - Survey of Consumer Finances (2001)
Holding a retirement account (1 o 0) (Logit model)
Age Cohort (+) Education (+) Risk tolerance (+) Saver (+) Planning horizon (+) Race: white (+)
Spending behavior (-) Self-employment (-) Homeowners (vs renters) (+) Marital status: married (+)
Huberman et al. (2007)**
US: 793,794 employees eligible to participate in DC pension plans – Vanguard Group (2001)
Contributing to a DC pension plan (1 o 0) (Probit model)
Income (+) Financial wealth of the neighborhood (+) Gender: Female (+)
Tenure (+) and Tenure squared (-) Age (+) and Age squared (-) Plan policies (+)
Notes: * Studies focused on the relationship between relative risk aversion and wealth **Studies focused on household savings
Previous empirical studies indicate that a variety of socio-demographic factors are
important determinants of saving for retirement. Based on the review of literature, we
identify a set of individual characteristics that might influence retirement savings.
The life-cycle theory of savings predicts that savings will increase over the life-cycle;
the older a person gets, the more likely he/she is to save for retirement (DeVaney and
Chiremba, 2005). Life-cycle economic approach implies that people try to save before
retirement in order to finance consumption during retirement. Thus, Richardson and
Kilty (1989) find that age was one of the important predictors of financial planning. The
closer people were to retirement, the more likely they were to invest or save (Malroutu
and Xiao, 1995). Huberman et al. (2007) also find a positive relationship between
6
individuals’ age and their contributions to a DC pension plan, but the probability of
contributing to a DC pension plan is decreasing with age.
Formal education is likely to be positively related to planning skills (Berheim and
Scholtz, 1992; Seong-Lim et al., 2000), and thus is expected to increase the probability
of having adequate financial resources for retirement (Li et al., 1996). People with a low
level of education have to make much effort to obtain and understand information about
complex investment assets (Lusardi, 2001). Thus, individuals facing high search costs
will be less likely to save for retirement purposes.
Based on the theory of risk aversion, a number of studies have also examined the effects
of formal education on savings. However the results are mixed, partially because
education, income and wealth tend to be highly correlated (Bajtelsmit, 1999; Berheim
and Scholtz, 1992). Thus, Jianakoplos and Bernasek (1998) don’t find evidence that
more years of schooling increase household risk taking. Moreover, Moreno-Badía
(2006) shows that the Irish households with higher levels of education save less. These
mixed results suggest that in the context of financial decisions, a more important effect
to measure may be the access to financial knowledge rather than formal education
(Bajtelsmit, 1999). Researchers are beginning to study the reasons and consequences of
financial illiteracy in order to understand why retirement planning is lacking and why so
many households arrive close to retirement with little or no wealth (Lusardi and
Mitchell, 2007b). Thus, Lusardi and Mitchell (2007a) find that the more financially
literate individuals are much more likely to have thought about retirement. Moreover,
the aforementioned shift from DB plans to DC retirement plans implies that it is
becoming more important for households to acquire and manage financial knowledge.
The family life-cycle stage has also been recognized as a key variable related to saving
(Seong-Lim et al., 2000). According to family life-cycle theory of saving, the greatest
possibility to save was enjoyed by those households having achieved the stage of
“empty nest 1”; after children are raised and home mortgages are paid, resources are
finally freed up for retirement saving (Malroutu and Xiao, 1995). Seong-Lim et al.
(2000) also find that households with dependent children are less likely to save.
Another common finding in the empirical literature is that single and married people
differ in their saving behaviour. According to Li et al. (1996), married individuals are
more likely to be concerned about the financial stability of the family, and thus are
expected to be more likely to save for retirement. Lusardi (2001) also finds that
individuals who have not thought about retirement are also less likely to be married.
7
Higher levels of income mean higher resources available for saving and investment.
Thus, individuals with greater incomes are more able to accumulate wealth for their
retirement. Richardson and Kilty (1989) find that income was one of the important
predictors of financial planning. Other empirical results that support this hypothesis are
Browning and Lusardi (1996), for the United States, and Moreno-Badía (2006), for
Ireland. Additionally, Huberman et al. (2007) suggest that low-income employees
expect higher salary replacement rates from public pension systems upon retirement
than high-income employees. This expectation may lower the low-income workers’
desire to save for retirement.
Income level and employment status tend to be highly and positively correlated.
Therefore, the employment status indirectly affects the ability to save for retirement.
But, the employment status also has a direct influence on the retirement attitudes. First,
individuals with a higher employment status are more likely to have included in their
job conditions several benefits such as health and disability insurance or life insurance
coverage. This means higher resources available for saving.
Second, individuals with a higher employment status are more likely to participate in
DB and DC retirement plans. As they are used to thinking about retirement in their jobs,
they will have improve their financial planning skills, and thus are expected to increase
their retirement saving rates. In particular, professional, 'skilled white-collar' or full-time
workers are more likely to have a DC plan than 'unskilled blue-collar' or part-time
workers (Sundén and Surette, 1998). DC plans place more of the asset allocation
responsibility on workers. This trend toward self-directed investment of plan assets may
act as a driving force of the individuals’ retirement savings. Thus, Papke (2003) finds
that participant control over assets increases the likelihood of DC plan participation.
3. DOES GENDER MATTER?
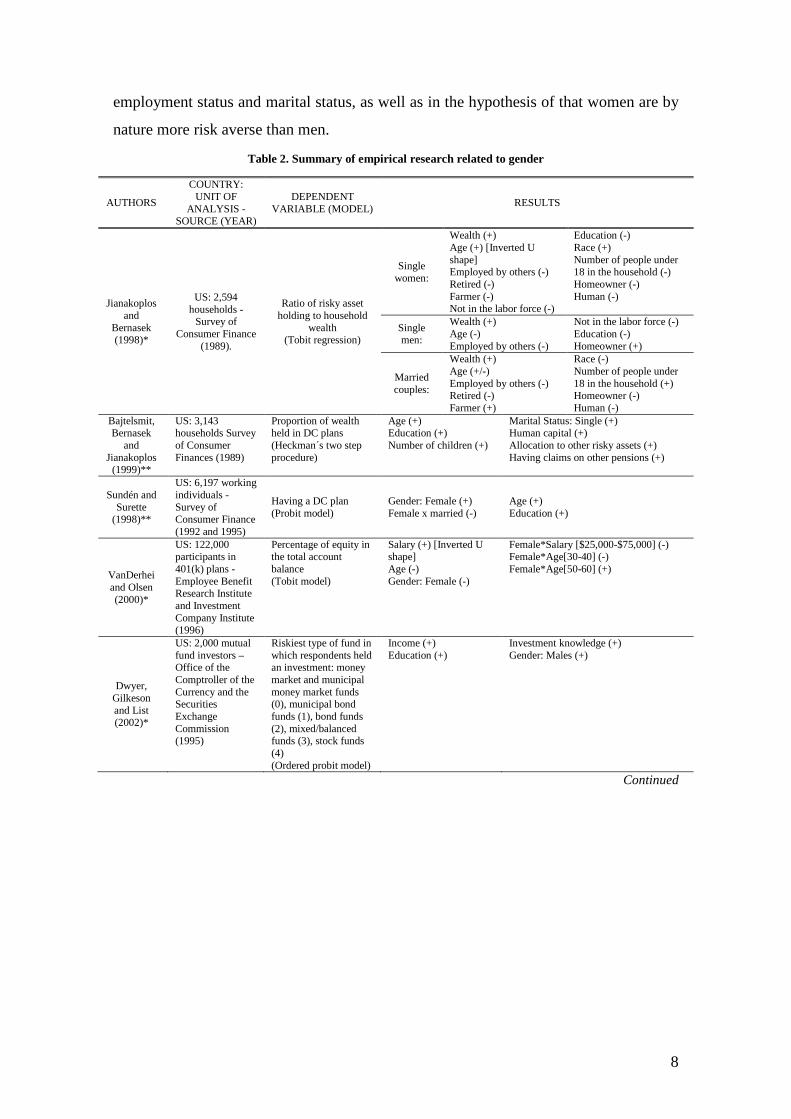
Table 2 summarizes some of the studies which have analyzed gender differences by
focusing on the allocation of either pension assets or total household wealth. Although a
large literature has examined gender differences in investment and risk taking decisions
(Gerrans and Clark_Murphy, 2004; Johannisson, 2008), there is still no consensus
regarding the determinants of gender differences in financial behaviour. This lack of
common empirical results could be partially explained by gender differences in some of
the previous individual characteristics, namely in age, financial literacy, income levels,
8
employment status and marital status, as well as in the hypothesis of that women are by
nature more risk averse than men.
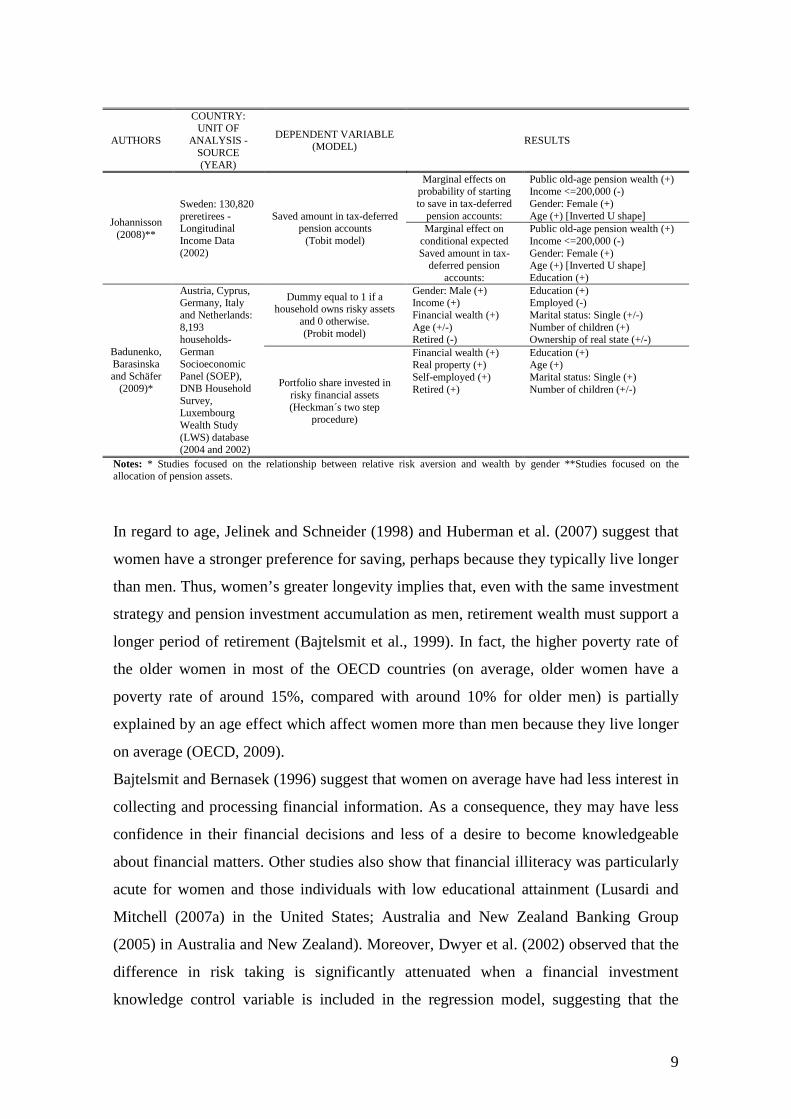
Table 2. Summary of empirical research related to gender
AUTHORS
COUNTRY: UNIT OF
ANALYSIS - SOURCE (YEAR)
DEPENDENT VARIABLE (MODEL) RESULTS
Jianakoplos and
Bernasek (1998)*
US: 2,594 households -
Survey of Consumer Finance
(1989).
Ratio of risky asset holding to household
wealth (Tobit regression)
Single women:
Wealth (+) Age (+) [Inverted U shape] Employed by others (-) Retired (-) Farmer (-) Not in the labor force (-)
Education (-) Race (+) Number of people under 18 in the household (-) Homeowner (-) Human (-)
Single men:
Wealth (+) Age (-) Employed by others (-)
Not in the labor force (-) Education (-) Homeowner (+)
Married couples:
Wealth (+) Age (+/-) Employed by others (-) Retired (-) Farmer (+)
Race (-) Number of people under 18 in the household (+) Homeowner (-) Human (-)
Bajtelsmit, Bernasek
and Jianakoplos
(1999)**
US: 3,143 households Survey of Consumer Finances (1989)
Proportion of wealth held in DC plans (Heckman´s two step procedure)
Age (+) Education (+) Number of children (+)
Marital Status: Single (+) Human capital (+) Allocation to other risky assets (+) Having claims on other pensions (+)
Sundén and Surette
(1998)**
US: 6,197 working individuals - Survey of Consumer Finance (1992 and 1995)
Having a DC plan (Probit model)
Gender: Female (+) Female x married (-)
Age (+) Education (+)
VanDerhei and Olsen (2000)*
US: 122,000 participants in 401(k) plans - Employee Benefit Research Institute and Investment Company Institute (1996)
Percentage of equity in the total account balance (Tobit model)
Salary (+) [Inverted U shape] Age (-) Gender: Female (-)
Female*Salary [$25,000-$75,000] (-) Female*Age[30-40] (-) Female*Age[50-60] (+)
Dwyer, Gilkeson and List (2002)*
US: 2,000 mutual fund investors – Office of the Comptroller of the Currency and the Securities Exchange Commission (1995)
Riskiest type of fund in which respondents held an investment: money market and municipal money market funds (0), municipal bond funds (1), bond funds (2), mixed/balanced funds (3), stock funds (4) (Ordered probit model)
Income (+) Education (+)
Investment knowledge (+) Gender: Males (+)
Continued
9
AUTHORS
COUNTRY: UNIT OF
ANALYSIS - SOURCE (YEAR)
DEPENDENT VARIABLE (MODEL) RESULTS
Johannisson (2008)**
Sweden: 130,820 preretirees - Longitudinal Income Data (2002)
Saved amount in tax-deferred pension accounts
(Tobit model)
Marginal effects on probability of starting to save in tax-deferred
pension accounts:
Public old-age pension wealth (+) Income <=200,000 (-) Gender: Female (+) Age (+) [Inverted U shape]
Marginal effect on conditional expected Saved amount in tax-
deferred pension accounts:
Public old-age pension wealth (+) Income <=200,000 (-) Gender: Female (+) Age (+) [Inverted U shape] Education (+)
Badunenko, Barasinska and Schäfer
(2009)*
Austria, Cyprus, Germany, Italy and Netherlands: 8,193 households- German Socioeconomic Panel (SOEP), DNB Household Survey, Luxembourg Wealth Study (LWS) database (2004 and 2002)
Dummy equal to 1 if a household owns risky assets
and 0 otherwise. (Probit model)
Gender: Male (+) Income (+) Financial wealth (+) Age (+/-) Retired (-)
Education (+) Employed (-) Marital status: Single (+/-) Number of children (+) Ownership of real state (+/-)
Portfolio share invested in risky financial assets (Heckman´s two step
procedure)
Financial wealth (+) Real property (+) Self-employed (+) Retired (+)
Education (+) Age (+) Marital status: Single (+) Number of children (+/-)
Notes: * Studies focused on the relationship between relative risk aversion and wealth by gender **Studies focused on the allocation of pension assets.
In regard to age, Jelinek and Schneider (1998) and Huberman et al. (2007) suggest that
women have a stronger preference for saving, perhaps because they typically live longer
than men. Thus, women’s greater longevity implies that, even with the same investment
strategy and pension investment accumulation as men, retirement wealth must support a
longer period of retirement (Bajtelsmit et al., 1999). In fact, the higher poverty rate of
the older women in most of the OECD countries (on average, older women have a
poverty rate of around 15%, compared with around 10% for older men) is partially
explained by an age effect which affect women more than men because they live longer
on average (OECD, 2009).
Bajtelsmit and Bernasek (1996) suggest that women on average have had less interest in
collecting and processing financial information. As a consequence, they may have less
confidence in their financial decisions and less of a desire to become knowledgeable
about financial matters. Other studies also show that financial illiteracy was particularly
acute for women and those individuals with low educational attainment (Lusardi and
Mitchell (2007a) in the United States; Australia and New Zealand Banking Group
(2005) in Australia and New Zealand). Moreover, Dwyer et al. (2002) observed that the
difference in risk taking is significantly attenuated when a financial investment
knowledge control variable is included in the regression model, suggesting that the
10
gender effect found in previous studies that employ less specific knowledge controls
may be biased upward.
In addition, there is substantial evidence that women have lower life-time income and
earn less than men (Dwyer et al., 2002). Recent decades have seen a dramatic increase
in female labour force participation rates, and a considerable narrowing of the gender
gap. Despite these advances, the gender gap in wages is still substantial, even if one
looks at men and women with the same amount of experience and education. According
to OECD (2008b), women are 20% less likely than men to have a paid job in OECD
countries and they earn on average 17% less than men. Therefore, we can expect that
women have lower resources available to save for retirement. In a similar way,
VanDerhei and Olsen (2000) found that women with wages between $25,000 and
$50,000 have a significantly greater probability of investing a small percentage of their
401(k) plans in equities than their male counterpart, but those ones with salaries over
$75,000 have a smaller probability.
Besides, women are still much more likely to have part time and temporary jobs. In
these kinds of jobs, individuals who desire health insurance, disability insurance or life
insurance coverage must pay for it reducing resources available for saving and
investment (Bajtelsmit and Bernasek, 1996). Thus, Shaw and Hill (2002) find that the
most common reasons for lower participation rates in employer pension plans among
women are short job tenure and part-time employment.
On the contrary, the lower labour incomes and part time and temporary jobs may act as
a driving force of female saving behaviour. As the public pension systems and the
occupational pension plans are based on the earnings in the paid labour forces, women
are conscious that they will have lower income as retired compared to men. In order to
compensate for the lost pension income, women may save privately for retirement more
than men (Johannisson, 2008).
Another common finding in the empirical literature is that investment decisions,
especially for retirement purposes, are driven more by a combination of gender and marital
status than gender in itself (Gerrans and Clark-Murphy, 2004; Jianakopolos and Bernasek,
1998; Johannisson, 2008; Sundén and Surette, 1998). Thus, Bajtelsmit (1999) and Papke
(2003) find that single females are more likely to hold a higher ratio of risky assets to
net household wealth and to contribute to a DC plan, respectively. On the contrary,
Jianakoplos and Bernasek (1998), Bajtelsmit et al. (1999) and Sundén and Surette
(1998) show that wealth holdings of single women are relatively less risky than those of
11
single men and married couples. Furthermore, Bajtelsmit et al. (1999) also present
evidence of that an increase in number of children is estimated to increase allocations to
DC plans for both men and women, but by a small proportion for women.
Finally, the stereotype that women are more risk-averse than men in their financial
investment decisions is very widespread. However, the existing evidence is insufficient
to confirm this hypothesis. Some studies predict that, ceteris paribus, there are no
differences between women and men in their willingness to invest in risky assets
(Badunenko et al., 2009; Papke, 2003; Schubert et al., 1999). Moreover, Huberman et
al. (2007) find that women are more aggressive users of 401(k) plans. However, the
above mentioned literature is significantly outnumbered by studies claiming that women
are less inclined to risk-taking than men (Diaz-Serrano and O’Neill 2004; Dohmen et al.
2005; Dwyer et al., 2002; Hinz, McCarthy and Turner 1996; VanDerhei and Olsen
2000). This lower risk propensity of women may have opposite effects on retirement
savings. On the one hand, women will tend to save for retirement as far as possible. On
the other hand, if women are expected to be more conservative investors than men, the
current trend to self-directed retirement plans may have serious damaging implications
for their retirement income adequacy, since females will probably allocate retirement
savings to investments with lower risks and therefore lower expected returns (Wang
1994). Thus, it is likely that women will retire with significantly lower pension wealth
than their male counterparts (Bajtelsmit et al., 1999).
To sum up, there is still no consensus regarding the role of gender for retirement saving
behaviour. Whereas the higher longevity will prompt women to save for retirement, the
seemingly higher financial illiteracy of females might have the opposite effect. In
addition, the gender differences with regard to income levels, employment status and
financial risk-taking will have a positive effect on the women’ decision of saving for
retirement, but a negative one on their retirement wealth. Finally, the existing evidence
about the influence of marital status and gender is contradictory.
4. METHODOLOGY
4.1. THE DATA AND SAMPLE
The data used for the analysis are from the study The EU Market For Consumer Long
Term Retail Savings Vehicles. Comparative Analysis Of Products, Market Structure,
Costs, Distribution Systems and Consumer Saving Patterns, sponsored by the European
Commission, and conducted by the BME Consulting. Data collection was carried out in
12
2007 using computer-assisted personal interviewing (CATI) and a structured
questionnaire. The survey was performed in eight EU countries: France, Germany, Italy,
the Netherlands, Poland, Spain, Sweden and the United Kingdom. These eight
economies nearly account for 90% of the total household financial assets in the EU.
While the United Kingdom, Germany and Italy are the three largest member states of
the EU, the Netherlands, Sweden and Poland were been chosen to be representative of
particular groups of countries with a high degree of cultural, political and/or
institutional homogeneity, viz. the Benelux countries, Scandinavia and the transition
economies of Central- Eastern Europe (European Commission, 2007).
The EU Market For Consumer Long Term Retail Savings Vehicles. Comparative
Analysis Of Products, Market Structure, Costs, Distribution Systems and Consumer
Saving Patterns gathers information on the range of financial products that retail clients
invest in when they save for the long term, their attitudes towards financial
intermediaries and their reasons for saving, as well as socio-demographic information.
The universe of the present research was made of general individuals aged 18-65 years.
A sample of 8,044 individuals was selected to be representative of all investors in the
eight countries. 2,088 observations were dropped from the analysis due to missing
information on monthly net household income, resulting in a sample size of 6,036
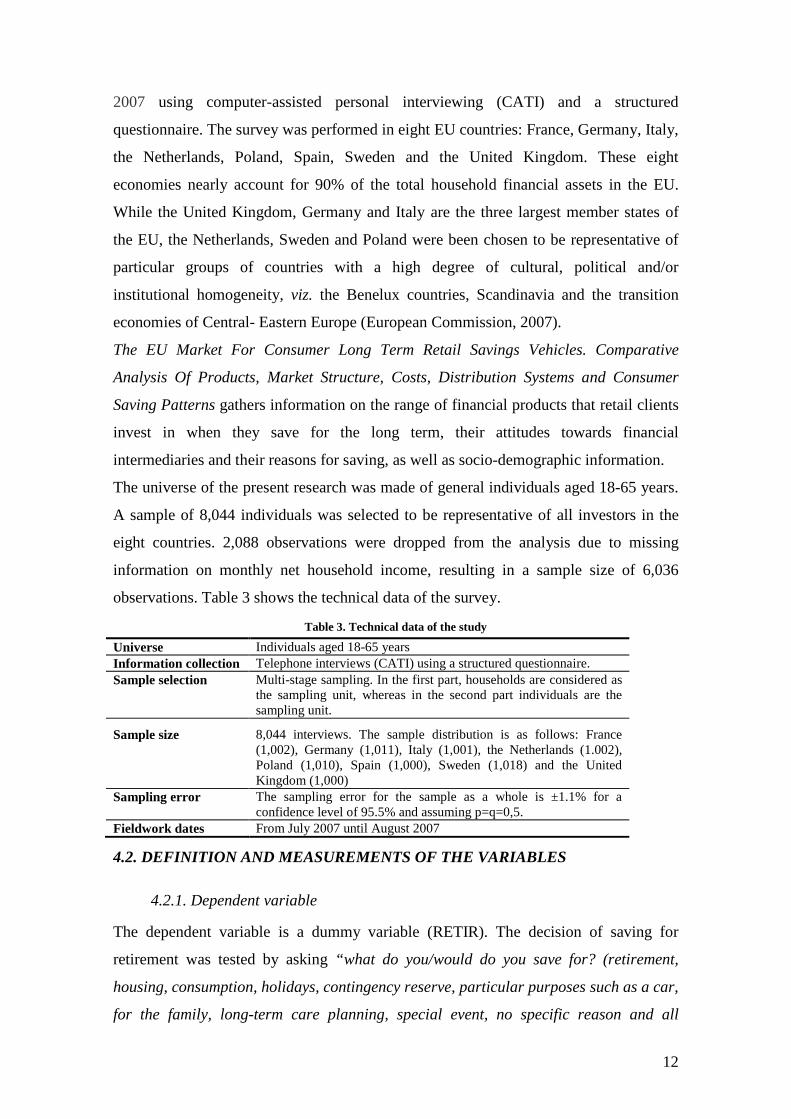
observations. Table 3 shows the technical data of the survey.
Table 3. Technical data of the study
Universe Individuals aged 18-65 years Information collection Telephone interviews (CATI) using a structured questionnaire. Sample selection Multi-stage sampling. In the first part, households are considered as
the sampling unit, whereas in the second part individuals are the sampling unit.
Sample size 8,044 interviews. The sample distribution is as follows: France (1,002), Germany (1,011), Italy (1,001), the Netherlands (1.002), Poland (1,010), Spain (1,000), Sweden (1,018) and the United Kingdom (1,000)
Sampling error The sampling error for the sample as a whole is ±1.1% for a confidence level of 95.5% and assuming p=q=0,5.
Fieldwork dates From July 2007 until August 2007
4.2. DEFINITION AND MEASUREMENTS OF THE VARIABLES
4.2.1. Dependent variable
The dependent variable is a dummy variable (RETIR). The decision of saving for
retirement was tested by asking “what do you/would do you save for? (retirement,
housing, consumption, holidays, contingency reserve, particular purposes such as a car,
for the family, long-term care planning, special event, no specific reason and all
13
above)”. Respondents who answer they do/would save for retirement as a first option,
as well as those ones who had pension funds were coded 1, otherwise 0.
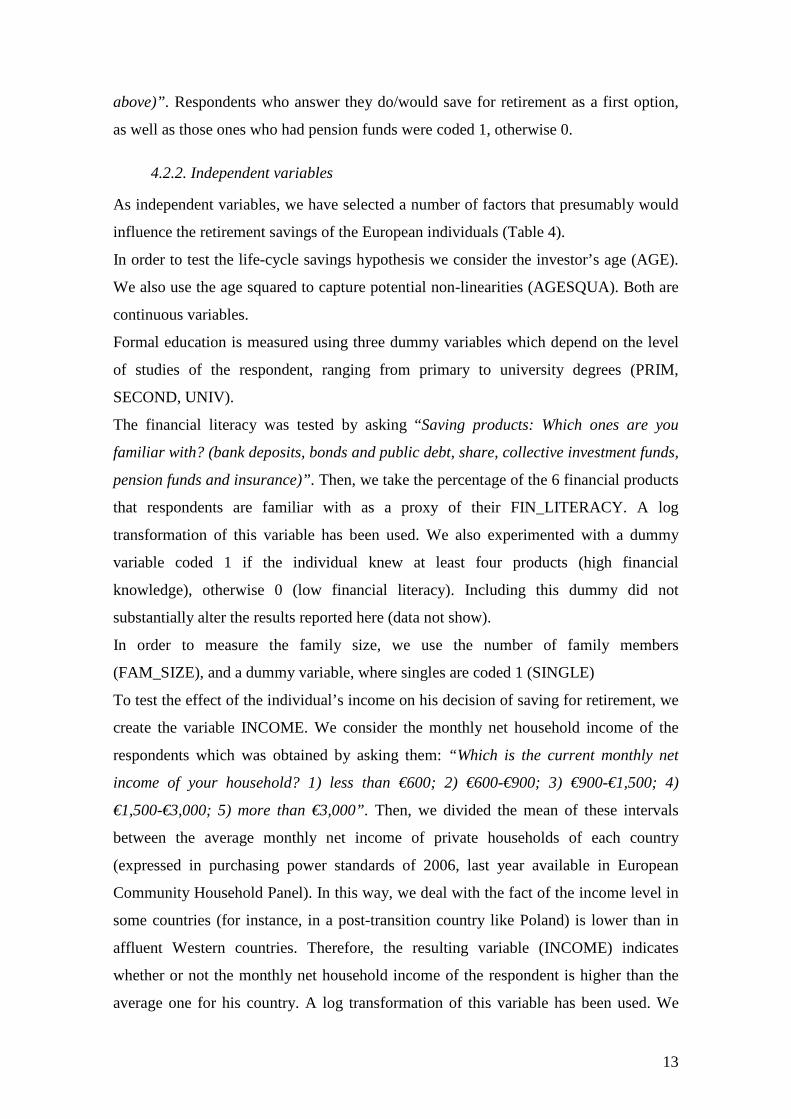
4.2.2. Independent variables
As independent variables, we have selected a number of factors that presumably would
influence the retirement savings of the European individuals (Table 4).
In order to test the life-cycle savings hypothesis we consider the investor’s age (AGE).
Formal education is measured using
We also use the age squared to capture potential non-linearities (AGESQUA). Both are
continuous variables.
three dummy variables which depend on the level
of studies of the respondent
The financial literacy was tested by asking “Saving products: Which ones are you
familiar with? (bank deposits, bonds and public debt, share, collective investment funds,
pension funds and insurance)”.
, ranging from primary to university degrees (PRIM,
SECOND, UNIV).
Then, we take the percentage of the 6 financial products
that respondents are familiar with as a proxy of their FIN_LITERACY. A log
transformation of this variable has been used. We also experimented with a dummy
variable coded 1 if the individual knew at least four products (high financial
knowledge), otherwise 0 (low financial literacy). Including this dummy did not
substantially alter the results reported here (data not show).
In order to measure the family size, we use the number of family members
(FAM_SIZE), and a dummy variable, where singles are coded 1 (SINGLE)
To test the effect of the individual’s income on his decision of saving for retirement, we
create the variable INCOME. We consider the monthly net household income of the
respondents which was obtained by asking them: “Which is the current monthly net
income of your household? 1) less than €600; 2) €600-€900; 3) €900-€1,500; 4)
€1,500-€3,000; 5) more than €3,000”. Then, we divided the mean of these intervals
between the average monthly net income of private households of each country
(expressed in purchasing power standards of 2006, last year available in European
Community Household Panel). In this way, we deal with the fact of the income level in
some countries (for instance, in a post-transition country like Poland) is lower than in
affluent Western countries. Therefore, the resulting variable (INCOME) indicates
whether or not the monthly net household income of the respondent is higher than the
average one for his country. A log transformation of this variable has been used. We
14
also experimented with several ways to represent the individual’s income, namely we
consider three dummy variables (LOWINC, MEDINC, HIGHINC) which depend on
the monthly net household income of the respondent, ranging from less than €1,500 to
more than €3,000 Since the specific form did not substantially alter the results, we only
present one form, which is INCOME variable.
HWHITECOLL, WHITECOLL, and BLUECOLL are dummy variables indicating
three
SAVING is a dummy variable used as a proxy of the respondent’s saving habits. The
saving habit was tested by asking “Do you save?” The variable was coded 1 if the
respondent was currently saving, otherwise 0.
categories of labor force status of the individual.
FEMALE is dummy variable where women are coded 1.
Finally eight country dummy variables are considered (FRANCE, GERMANY,
ITALY, NETHERLANDS, POLAND, SPAIN, SWEDEN and UK). The FRANCE
dummy variable, for example, is a variable taking value 1 for that country and 0 for all
others.
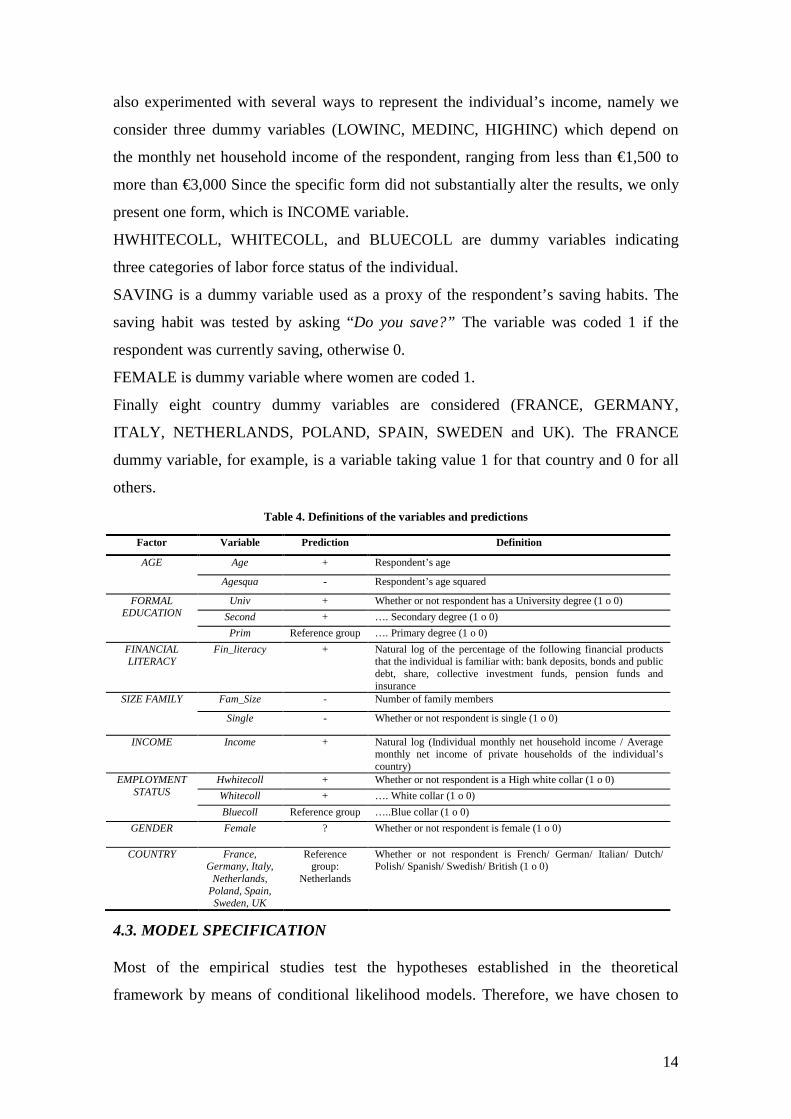
Table 4. Definitions of the variables and predictions
Factor Variable Prediction Definition
AGE Age + Respondent’s age
Agesqua - Respondent’s age squared
FORMAL EDUCATION
Univ + Whether or not respondent has a University degree (1 o 0) Second + …. Secondary degree (1 o 0) Prim Reference group …. Primary degree (1 o 0)
FINANCIAL LITERACY
Fin_literacy + Natural log of the percentage of the following financial products that the individual is familiar with: bank deposits, bonds and public debt, share, collective investment funds, pension funds and insurance
SIZE FAMILY Fam_Size - Number of family members
Single - Whether or not respondent is single (1 o 0)
INCOME Income + Natural log (Individual monthly net household income / Average monthly net income of private households of the individual’s country)
EMPLOYMENT STATUS
Hwhitecoll + Whether or not respondent is a High white collar (1 o 0) Whitecoll + …. White collar (1 o 0) Bluecoll Reference group …..Blue collar (1 o 0)
GENDER Female ? Whether or not respondent is female (1 o 0)
COUNTRY France, Germany, Italy,
Netherlands, Poland, Spain, Sweden, UK
Reference group:
Netherlands
Whether or not respondent is French/ German/ Italian/ Dutch/ Polish/ Spanish/ Swedish/ British (1 o 0)
4.3. MODEL SPECIFICATION
Most of the empirical studies test the hypotheses established in the theoretical
framework by means of conditional likelihood models. Therefore, we have chosen to
15
apply a probit model in order to analyze the decision of saving for retirement. This
model establishes a nonlinear relation between a dummy dependent variable and a set of
independent variables. The following relation was proposed:
CountrySingleFemaleFemaleSaving
rWhitecollaarHwhitecollIncome+Single+Famsize+literacyFinSec+Univ+Agesqua+Age+(=1)=Yy(Probabilit
ij
jii
iiiiii
ii3i2i10i
∑=
+×+++
++20
14131211
1098765
4
_
ββββ
βββββββββββφ
The dependent variable (Yi) quantifies the individual’s probability of saving for
retirement, i is the index of individuals and φ denotes the standard normal distribution function.
The equation includes seven country dummy variables, whose index is j, in order to
capture idiosyncratic cultural or institutional factors for each country (France, Germany,
Italy, Poland, Spain, Sweden and the United Kingdom). These ones are aspects shared
by the individuals in one country that affect decisions of saving for retirement. In short,
these dummy variables reflect the support for retirement saving in each country once the
individual factors, such as education, gender, age, employment status or financial
literacy have been discounted. NETHERLANDS dummy variable was omitted to avoid
perfect multicollinearity, so that the institutional country effects must be interpreted in
relation to the Netherlands.
5. RESULTS OF THE EMPIRICAL ANALYSIS
5.1. THE GENDER EFFECT: EUROPE
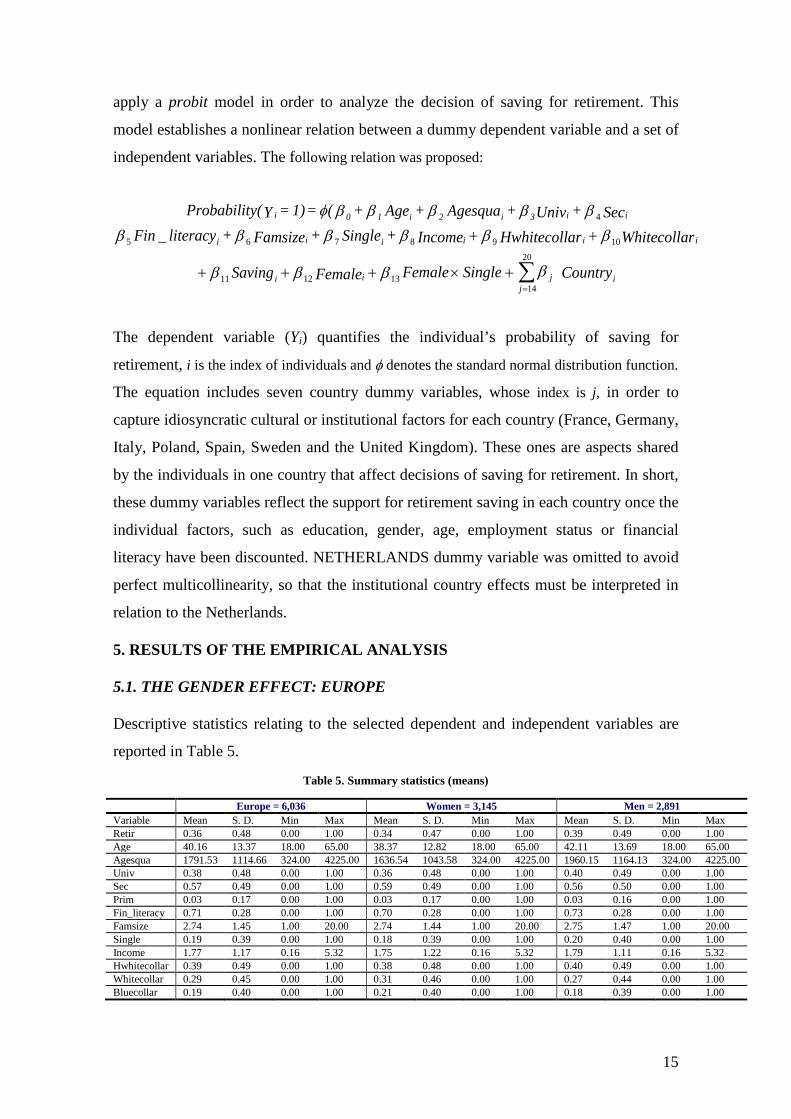
Table 5. Summary statistics (means)
Descriptive statistics relating to the selected dependent and independent variables are
reported in Table 5.
Europe = 6,036 Women = 3,145 Men = 2,891 Variable Mean S. D. Min Max Mean S. D. Min Max Mean S. D. Min Max Retir 0.36 0.48 0.00 1.00 0.34 0.47 0.00 1.00 0.39 0.49 0.00 1.00 Age 40.16 13.37 18.00 65.00 38.37 12.82 18.00 65.00 42.11 13.69 18.00 65.00 Agesqua 1791.53 1114.66 324.00 4225.00 1636.54 1043.58 324.00 4225.00 1960.15 1164.13 324.00 4225.00 Univ 0.38 0.48 0.00 1.00 0.36 0.48 0.00 1.00 0.40 0.49 0.00 1.00 Sec 0.57 0.49 0.00 1.00 0.59 0.49 0.00 1.00 0.56 0.50 0.00 1.00 Prim 0.03 0.17 0.00 1.00 0.03 0.17 0.00 1.00 0.03 0.16 0.00 1.00 Fin_literacy 0.71 0.28 0.00 1.00 0.70 0.28 0.00 1.00 0.73 0.28 0.00 1.00 Famsize 2.74 1.45 1.00 20.00 2.74 1.44 1.00 20.00 2.75 1.47 1.00 20.00 Single 0.19 0.39 0.00 1.00 0.18 0.39 0.00 1.00 0.20 0.40 0.00 1.00 Income 1.77 1.17 0.16 5.32 1.75 1.22 0.16 5.32 1.79 1.11 0.16 5.32 Hwhitecollar 0.39 0.49 0.00 1.00 0.38 0.48 0.00 1.00 0.40 0.49 0.00 1.00 Whitecollar 0.29 0.45 0.00 1.00 0.31 0.46 0.00 1.00 0.27 0.44 0.00 1.00 Bluecollar 0.19 0.40 0.00 1.00 0.21 0.40 0.00 1.00 0.18 0.39 0.00 1.00
16
Notes:
Table 5 shows the descriptive statistics for the variables included in the empirical analysis. Fin_literacy and Income variables are not in logs.
The final sample comprised 6,036 individuals, mostly women (52.1%), with a mean age
of 40.16 and whose monthly net household income was higher than the average for their
country (1.77)
A look into the descriptive statistics by gender in Table 5 reveals that there are no big
differences between men and women. In this way, men have higher mean values in age,
level of education, financial literacy and employment status variables.
. The individuals are familiar with 71% of the list of 6 financial products
for saving. With regard to educational level, 3% had completed primary education as the
highest level of education attained, 57% had completed up to high school and 38% had a
university degree. 19% of the individuals were living on his/her own at the time of the
survey and the mean family size was 2.74. With respect to employment status, most of
the individuals (39%) were high white-collar workers.
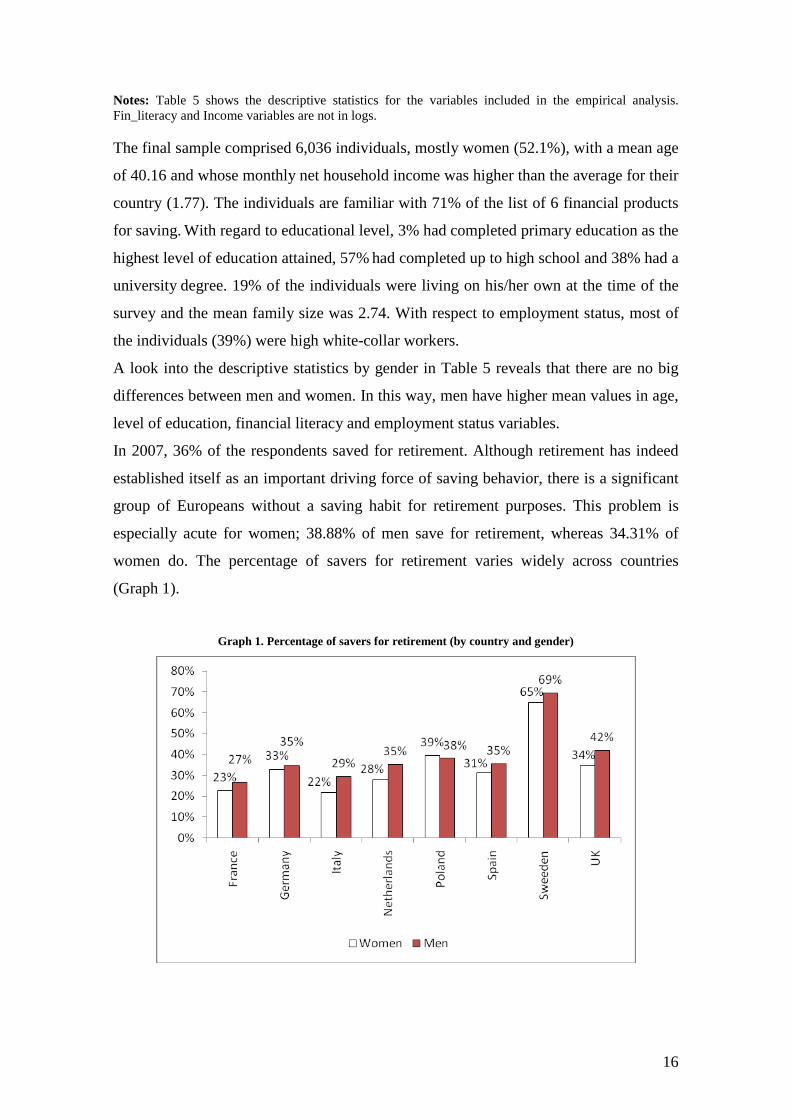
In 2007, 36% of the respondents saved for retirement. Although retirement has indeed
established itself as an important driving force of saving behavior, there is a significant
group of Europeans without a saving habit for retirement purposes. This problem is
especially acute for women; 38.88% of men save for retirement, whereas 34.31% of
women do. The percentage of savers for retirement varies widely across countries
(Graph 1).
Graph 1. Percentage of savers for retirement (by country and gender)
17
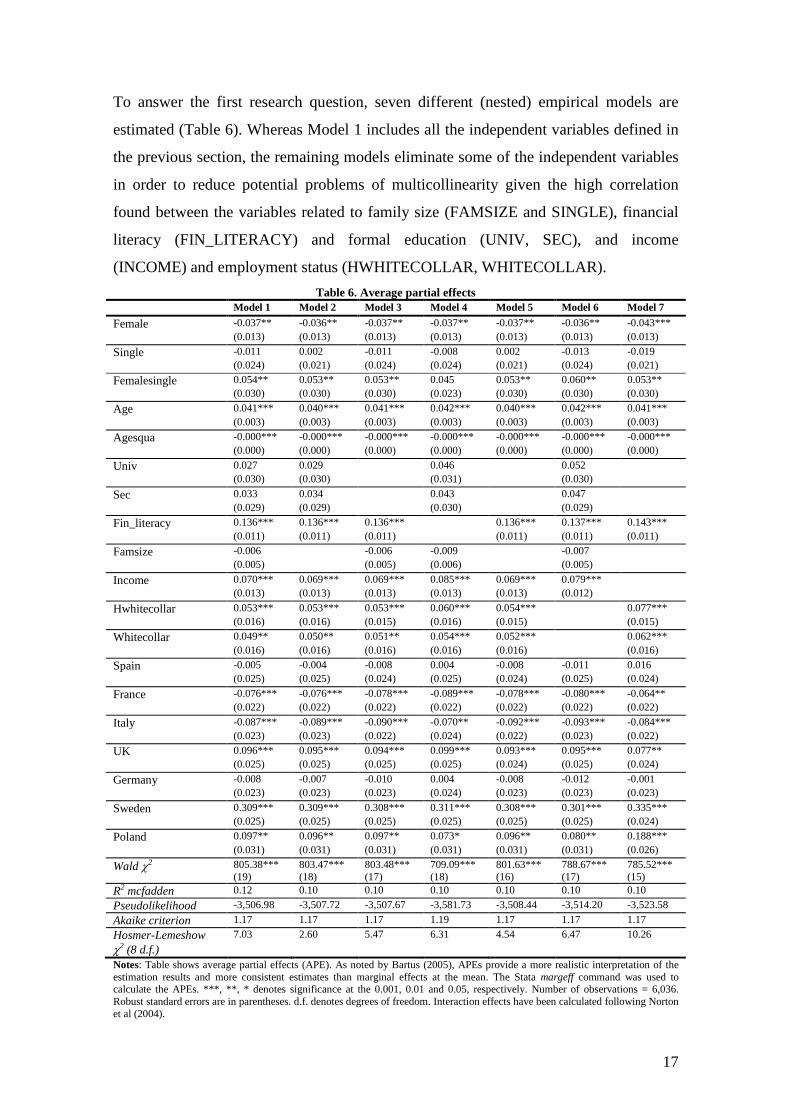
To answer the first research question, seven different (nested) empirical models are
estimated (Table 6). Whereas Model 1 includes all the independent variables defined in
the previous section, the remaining models eliminate some of the independent variables
in order to reduce potential problems of multicollinearity given the high correlation
found between the variables related to family size (FAMSIZE and SINGLE), financial
literacy (FIN_LITERACY) and formal education (UNIV, SEC), and income
(INCOME) and employment status (HWHITECOLLAR, WHITECOLLAR). Table 6. Average partial effects
Model 1 Model 2 Model 3 Model 4 Model 5 Model 6 Model 7 Female -0.037** -0.036** -0.037** -0.037** -0.037** -0.036** -0.043*** (0.013) (0.013) (0.013) (0.013) (0.013) (0.013) (0.013) Single -0.011 0.002 -0.011 -0.008 0.002 -0.013 -0.019 (0.024) (0.021) (0.024) (0.024) (0.021) (0.024) (0.021) Femalesingle 0.054** 0.053** 0.053** 0.045 0.053** 0.060** 0.053** (0.030) (0.030) (0.030) (0.023) (0.030) (0.030) (0.030) Age 0.041*** 0.040*** 0.041*** 0.042*** 0.040*** 0.042*** 0.041*** (0.003) (0.003) (0.003) (0.003) (0.003) (0.003) (0.003) Agesqua -0.000*** -0.000*** -0.000*** -0.000*** -0.000*** -0.000*** -0.000*** (0.000) (0.000) (0.000) (0.000) (0.000) (0.000) (0.000) Univ 0.027 0.029 0.046 0.052 (0.030) (0.030) (0.031) (0.030) Sec 0.033 0.034 0.043 0.047 (0.029) (0.029) (0.030) (0.029) Fin_literacy 0.136*** 0.136*** 0.136*** 0.136*** 0.137*** 0.143*** (0.011) (0.011) (0.011) (0.011) (0.011) (0.011) Famsize -0.006 -0.006 -0.009 -0.007 (0.005) (0.005) (0.006) (0.005) Income 0.070*** 0.069*** 0.069*** 0.085*** 0.069*** 0.079*** (0.013) (0.013) (0.013) (0.013) (0.013) (0.012) Hwhitecollar 0.053*** 0.053*** 0.053*** 0.060*** 0.054*** 0.077*** (0.016) (0.016) (0.015) (0.016) (0.015) (0.015) Whitecollar 0.049** 0.050** 0.051** 0.054*** 0.052*** 0.062*** (0.016) (0.016) (0.016) (0.016) (0.016) (0.016) Spain -0.005 -0.004 -0.008 0.004 -0.008 -0.011 0.016 (0.025) (0.025) (0.024) (0.025) (0.024) (0.025) (0.024) France -0.076*** -0.076*** -0.078*** -0.089*** -0.078*** -0.080*** -0.064** (0.022) (0.022) (0.022) (0.022) (0.022) (0.022) (0.022) Italy -0.087*** -0.089*** -0.090*** -0.070** -0.092*** -0.093*** -0.084*** (0.023) (0.023) (0.022) (0.024) (0.022) (0.023) (0.022) UK 0.096*** 0.095*** 0.094*** 0.099*** 0.093*** 0.095*** 0.077** (0.025) (0.025) (0.025) (0.025) (0.024) (0.025) (0.024) Germany -0.008 -0.007 -0.010 0.004 -0.008 -0.012 -0.001 (0.023) (0.023) (0.023) (0.024) (0.023) (0.023) (0.023) Sweden 0.309*** 0.309*** 0.308*** 0.311*** 0.308*** 0.301*** 0.335*** (0.025) (0.025) (0.025) (0.025) (0.025) (0.025) (0.024) Poland 0.097** 0.096** 0.097** 0.073* 0.096** 0.080** 0.188*** (0.031) (0.031) (0.031) (0.031) (0.031) (0.031) (0.026)
805.38*** Wald χ2 (19)
803.47*** (18)
803.48*** (17)
709.09*** (18)
801.63*** (16)
788.67*** (17)
785.52*** (15)
0.12 R2 mcfadden 0.10 0.10 0.10 0.10 0.10 0.10 -3,506.98 Pseudolikelihood -3,507.72 -3,507.67 -3,581.73 -3,508.44 -3,514.20 -3,523.58 1.17 Akaike criterion 1.17 1.17 1.19 1.17 1.17 1.17 7.03 Hosmer-Lemeshow
χ2 (8 d.f.) 2.60 5.47 6.31 4.54 6.47 10.26
Notes: Table shows average partial effects (APE). As noted by Bartus (2005), APEs provide a more realistic interpretation of the estimation results and more consistent estimates than marginal effects at the mean. The Stata margeff command was used to calculate the APEs. ***, **, * denotes significance at the 0.001, 0.01 and 0.05, respectively. Number of observations = 6,036. Robust standard errors are in parentheses. d.f. denotes degrees of freedom. Interaction effects have been calculated following Norton et al (2004).
18
As Table 6 shows, there are a group of variables that are significant in all the estimated
models. On the contrary, formal education (UNIV and SEC variables) and family size
(FAMSIZE and SINGLE) did not show to be significant for none of the models tested.
To compare the previous competing models, we used some common measures of fit
which provided support for the Model 5. Thus, the decision to save for retirement is
positively related to age, financial literacy, household income and employment status
and negatively related to age squared and female gender.
Therefore, the results suggest that women are less likely to save for retirement than
men; a woman has 3.7% lower probability of saving for retirement. Our results are
consistent with the findings of Badunenko et al. (2009), Diaz-Serrano and O’Neill
(2004) and Dohmen et al. (2005) for Europe, and the findings of Dwyer et al. (2002),
Malroutu and Xiao (1995) and VanDerhei and Olsen (2000) for the U.S.. These authors
find a negative relationship between female gender and saving for retirement. On the
contrary, our results differ from Huberman et al. (2007) and Sundén and Surette (1998).
However, these papers used a sample of working individuals who have a priori higher
resources available for saving
The previous outcome indicates that gender matters in decisions of saving for
retirement. However, FEMALE variable is too a crude way to capture gender
differences. In order to investigate whether gender differences influence the driving
forces of the Europeans’ retirement savings (second research question), we apply the
Model 5 by dividing the data into the two subsamples (Table 7). Henceforth, the results
for both the full sample and the gender groups are discussed below.
.
19
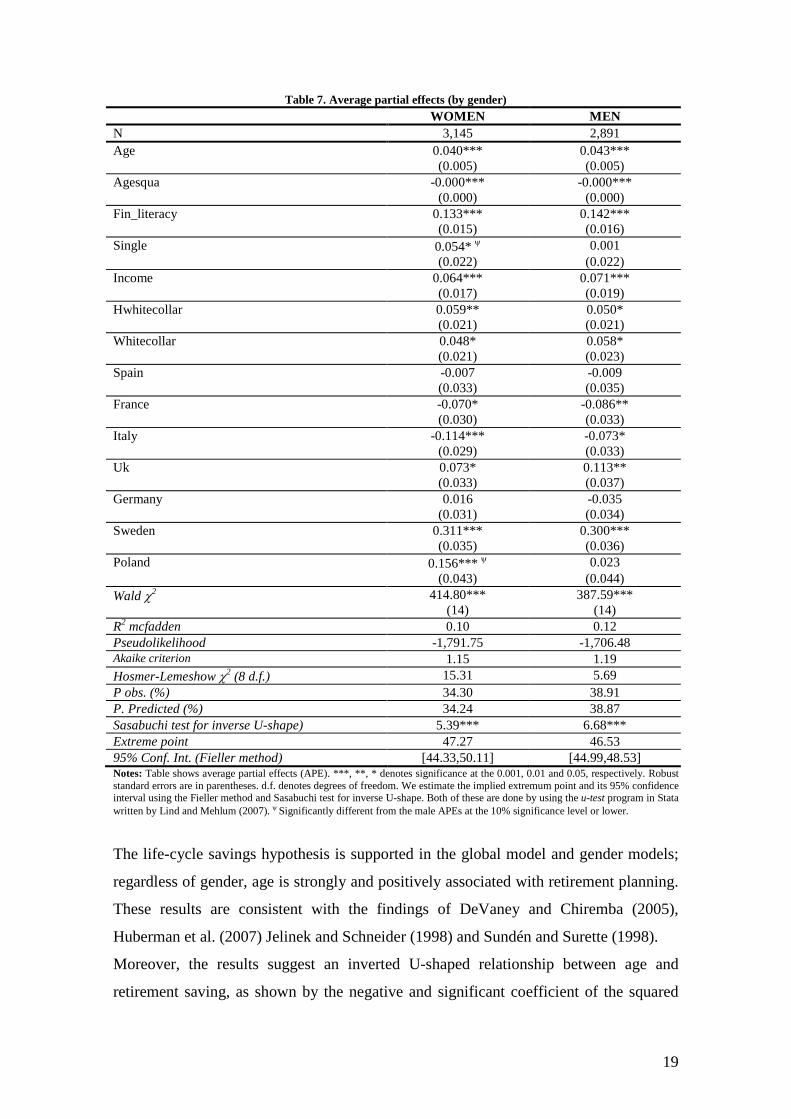
Table 7. Average partial effects (by gender) WOMEN MEN N 3,145 2,891 Age 0.040*** 0.043*** (0.005) (0.005) Agesqua -0.000*** -0.000*** (0.000) (0.000) Fin_literacy 0.133*** 0.142*** (0.015) (0.016) Single 0.054* ψ 0.001 (0.022) (0.022) Income 0.064*** 0.071*** (0.017) (0.019) Hwhitecollar 0.059** 0.050* (0.021) (0.021) Whitecollar 0.048* 0.058* (0.021) (0.023) Spain -0.007 -0.009 (0.033) (0.035) France -0.070* -0.086** (0.030) (0.033) Italy -0.114*** -0.073* (0.029) (0.033) Uk 0.073* 0.113** (0.033) (0.037) Germany 0.016 -0.035 (0.031) (0.034) Sweden 0.311*** 0.300*** (0.035) (0.036) Poland 0.156*** ψ 0.023 (0.043) (0.044)
414.80*** Wald χ2 (14)
387.59*** (14)
0.10 R2 mcfadden 0.12 -1,791.75 Pseudolikelihood -1,706.48
1.15 Akaike criterion 1.19 15.31 Hosmer-Lemeshow χ2 (8 d.f.) 5.69
P obs. (%) 34.30 38.91 P. Predicted (%) 34.24 38.87 Sasabuchi test for inverse U-shape) 5.39*** 6.68*** Extreme point 47.27 46.53 95% Conf. Int. (Fieller method) [44.33,50.11] [44.99,48.53] Notes: Table shows average partial effects (APE). ***, **, * denotes significance at the 0.001, 0.01 and 0.05, respectively. Robust standard errors are in parentheses. d.f. denotes degrees of freedom. We estimate the implied extremum point and its 95% confidence interval using the Fieller method and Sasabuchi test for inverse U-shape. Both of these are done by using the u-test program in Stata written by Lind and Mehlum (2007).
ψ Significantly different from the male APEs at the 10% significance level or lower.
The life-cycle savings hypothesis is supported in the global model and gender models;
regardless of gender, age is strongly and positively associated with retirement planning.
These results are consistent with the findings of
Moreover, the results suggest an inverted U-shaped relationship between age and
retirement saving, as shown by the negative and significant coefficient of the squared
DeVaney and Chiremba (2005),
Huberman et al. (2007) Jelinek and Schneider (1998) and Sundén and Surette (1998).
20
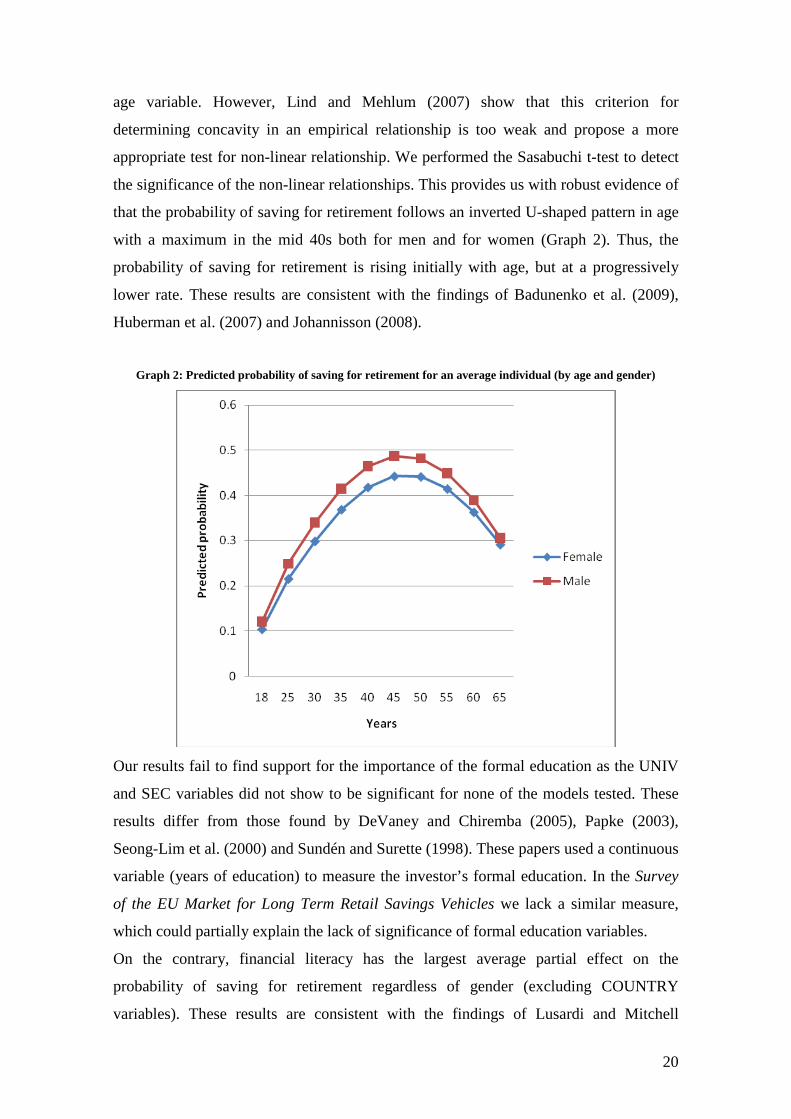
age variable. However, Lind and Mehlum (2007) show that this criterion for
determining concavity in an empirical relationship is too weak and propose a more
appropriate test for non-linear relationship. We performed the Sasabuchi t-test to detect
the significance of the non-linear relationships. This provides us with robust evidence of
that the probability of saving for retirement follows an inverted U-shaped pattern in age
with a maximum in the mid 40s both for men and for women (Graph 2). Thus, the
probability of saving for retirement is rising initially with age, but at a progressively
lower rate. These results are consistent with the findings of Badunenko et al. (2009),
Huberman et al. (2007)
and Johannisson (2008).
Graph 2: Predicted probability of saving for retirement for an average individual (by age and gender)
Our results fail to find support for the importance of the formal education as the UNIV
and SEC variables did not show to be significant for none of the models tested. These
results differ from those found by DeVaney and Chiremba (2005), Papke (2003),
Seong-Lim et al. (2000) and Sundén and Surette (1998). These papers used a continuous
variable (years of education) to measure the investor’s formal education. In the Survey
of the EU Market for Long Term Retail Savings Vehicles
On the contrary, financial literacy has the largest average partial effect on the
probability of saving for retirement regardless of gender (excluding COUNTRY
variables).
we lack a similar measure,
which could partially explain the lack of significance of formal education variables.
These results are consistent with the findings of Lusardi and Mitchell
21
(2007a). As there is no necessary link between education level and financial literacy,
this result additionally confirms the proposal of Bajtelsmit (1999) and Dwyer et al.
(2002) indicating that in the context of financial decisions, it is worth analyzing the
effect of financial knowledge
We did not find evidence of an effect of the family size (FAMSIZE) on the decision of
saving for retirement. O
, rather than exploring the influence of formal education.
ur results differ from those by Seong-Lim et al. (2000) who find
a strong negative relationship between the number of dependent children and savings.
They also differ from those by Jelinek and Schneider (1998) who obtain a positive
relationship between the size of family and the probability of participating in a private
pension fund for the Czechs. The lack of significance in this variable could be
associated to the data collected by the Survey of the EU Market for Long Term Retail
Savings Vehicles which does not distinguish the dependent children within the members
of family.
The SINGLE variable is found not to be significant for none of the global models
tested. However, according to Gerrans and Clark-Murphy (2004), Jianakopolos and
Bernasek (1998), Johannisson (2008) and Sundén and Surette (1998), exploring
separately gender and marital status may be missing some valuable. To overcome this
problem, we test for the interaction among FEMALE and SINGLE variables in the
global models. Though we cannot find a significant main effect of being single on
saving for retirement, when combined with gender a significant interaction effect
occurs. The interaction effect shows that women who live alone are more likely to save
for retirement. In fact, the SINGLE variable has a positive effect in the female model;
the APE implies that the single women’ probability of saving for retirement is 0.054
greater than non-single women. This finding is consistent with the results of Bajtelsmit.
(1999), Papke (2003) and Sundén and Surette (1998) for the U.S.. In our opinion, this
result could be explained by the fact that single women are more aware of the retirement
security challenges that they will face, whereas non-single women are more confident in
family incomes. In any case, our results also confirm that it is worth exploring possible
interactions of marital status with gender, rather than analyzing marital status alone
The monthly net household income of the respondents shows to be significant for the
global and gender models. Thus, the APE indicates that a 1% increase in the INCOME
variable would increase the probability of saving for retirement by 7%.
(Johannisson 2008; Papke 2003; Sundén and Surette 1998).
These results are
consistent with the findings of Huberman et al. (2007), Jelinek and Schneider (1998),
22
Johannisson (2008), Malroutu and Xiao (1995), Papke (2003) and Seong-Lim et al.
(2000).
There is also evidence that the employment status of the respondents is related to the
decision of saving for retirement in both the global and gender models. For example, the
APE in the Model 5 indicates that the probability of saving for retirement for a high
white-collar or just a white-collar worker is 5% higher than those who are blue-collar
worker.
To sum up, driving factors of the decision of saving for retirement are practically the
same for both women and men, with the exception of SINGLE variable. Being a single
woman has a positive effect on saving for retirement (vs. non-single woman).
Additionally, country also matters in decision of saving for retirement. Moreover, it has
a significantly different effect on women and men. For instance, the APE of the female
model implies that the Polish women’ probability of saving for retirement is 0.15
greater than the Dutch women, but this gender effect is not found for men. Therefore, in
next section we attempt to answer the third research question by analyzing whether
country-specific differences have an effect on the decision of saving for retirement.
5.2. THE GENDER EFFECT BY COUNTRY
As mentioned above, the previous outcome indicates that country matters in decisions
of saving for retirement. Most of the previous empirical studies on retirement savings
analyze the behavior of households and individuals belonging to the same country, with
the exception of Badudenko et al. (2009) study. Nonetheless, the scope of our work is
broader as it takes into account individuals residing in 8 European countries. Hence, to
the aforementioned socio-demographic characteristics we have to factor in a number of
explanatory elements determined by the specific institutional and cultural features of
each country.
Retirement income has been traditionally seen as a "three-legged stool" consisting of
Social Security (publicly managed pension schemes with DB and PAYG finance),
employer pensions, and private savings (DeVaney and Chiremba, 2005: OECD, 1998).
The national public policies to a large extent shape these “three pillars” of retirement
income which, in turn, have an impact on individual saving decisions. Particularly, what
the individual thinks she/he will receive from the public old-age pension system and the
employer pensions affect the private pension savings (Johannisson, 2008).
23
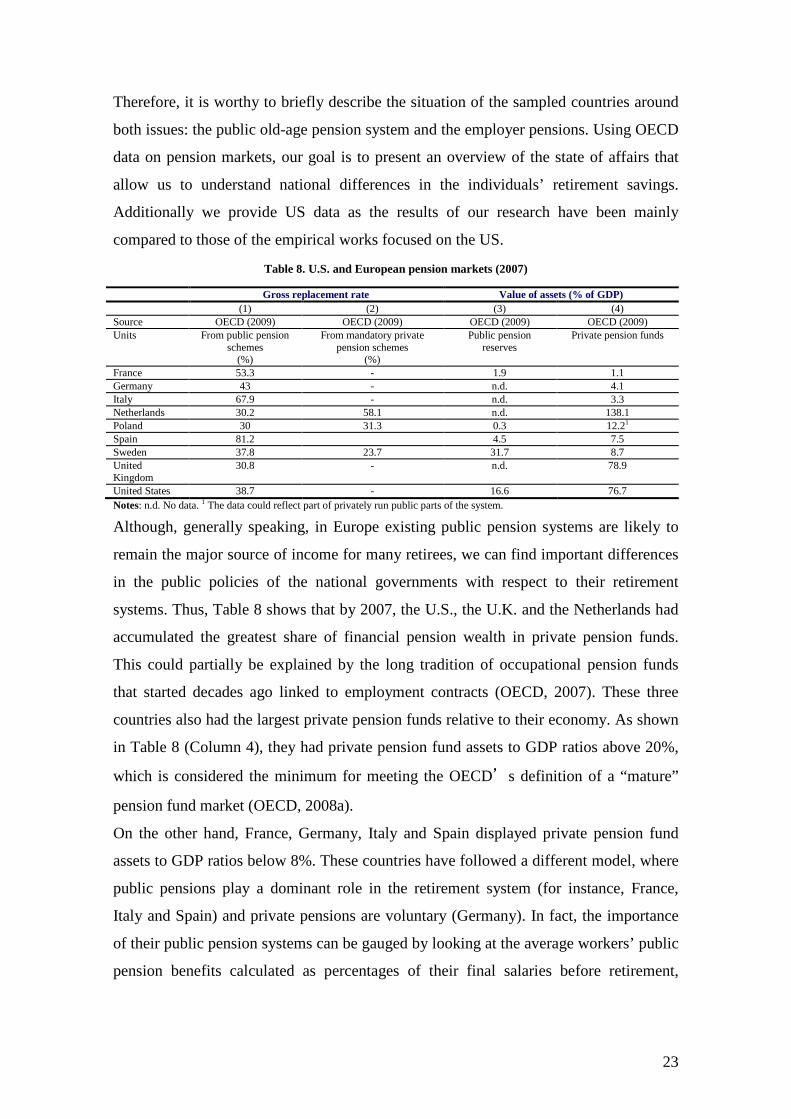
Therefore, it is worthy to briefly describe the situation of the sampled countries around
both issues: the public old-age pension system and the employer pensions. Using OECD
data on pension markets, our goal is to present an overview of the state of affairs that
allow us to understand national differences in the individuals’ retirement savings.
Additionally we provide US data as the results of our research have been mainly
compared to those of the empirical works focused on the US.
Table 8. U.S. and European pension markets (2007)
Gross replacement rate Value of assets (% of GDP) (1) (2) (3) (4) Source OECD (2009) OECD (2009) OECD (2009) OECD (2009) Units From public pension
schemes (%)
From mandatory private pension schemes
(%)
Public pension reserves
Private pension funds
France 53.3 - 1.9 1.1 Germany 43 - n.d. 4.1 Italy 67.9 - n.d. 3.3 Netherlands 30.2 58.1 n.d. 138.1 Poland 30 31.3 0.3 12.21 Spain 81.2 4.5 7.5 Sweden 37.8 23.7 31.7 8.7 United Kingdom
30.8 - n.d. 78.9
United States 38.7 - 16.6 76.7 Notes: n.d. No data. 1 The data could reflect part of privately run public parts of the system.
Although, generally speaking, in Europe existing public pension systems are likely to
remain the major source of income for many retirees, we can find important differences
in the public policies of the national governments with respect to their retirement
systems. Thus, Table 8 shows that by 2007, the U.S., the U.K. and the Netherlands had
accumulated the greatest share of financial pension wealth in private pension funds.
This could partially be explained by the long tradition of occupational pension funds
that started decades ago linked to employment contracts (OECD, 2007). These three
countries also had the largest private pension funds relative to their economy. As shown
in Table 8 (Column 4), they had private pension fund assets to GDP ratios above 20%,
which is considered the minimum for meeting the OECD’s definition of a “mature”
pension fund market (OECD, 2008a).
On the other hand, France, Germany, Italy and Spain displayed private pension fund
assets to GDP ratios below 8%. These countries have followed a different model, where
public pensions play a dominant role in the retirement system (for instance, France,
Italy and Spain) and private pensions are voluntary (Germany). In fact, the importance
of their public pension systems can be gauged by looking at the average workers’ public
pension benefits calculated as percentages of their final salaries before retirement,
24
assuming a full career (gross replacement rates). In 2007, France, Germany, Italy and
Spain had gross salary replacement rates above 43% (Column 1).
In addition to the two groups of countries referred to above, Sweden and Poland have
reformed their pension system over the past decade, introducing mandatory private
personal pension plans and working along DC regime. In these countries, a part of the
public system is privately managed and uses financial markets. However privately
managed public pensions do not allow for individual decisions, so could not be
comparable with additional voluntary retirement savings.
In sum, the characteristics referred to above, reflects some important differences in the
design and development of national pension systems that may influence the individuals’
decisions of saving for retirement.
Thus, Table 6 and Table 7 show the results for the seven country dummy variables
introduced in the models. The APEs of the country dummies in Model 5 imply that,
relative to Dutch (omitted group), the British, the Polish and the Swedish are between
about 9% and 30% more likely to save for retirement. This could be partially explained
by the fact that private pension plans are either long-time established (the U.K.) or
mandatory (Poland and Sweden).
On the contrary, living in France or Italy has a negative effect on saving for retirement.
Thus the APEs in Model 5 imply that, relative to Dutch (omitted group), the French and
the Italians are about 9% less likely to save for retirement. In these countries public
pension systems play a major role in the old-age retirement system, therefore their
citizens may rely heavily on the public pension system for retirement income support
and allocate a small proportion of long-term retail savings in pension funds.
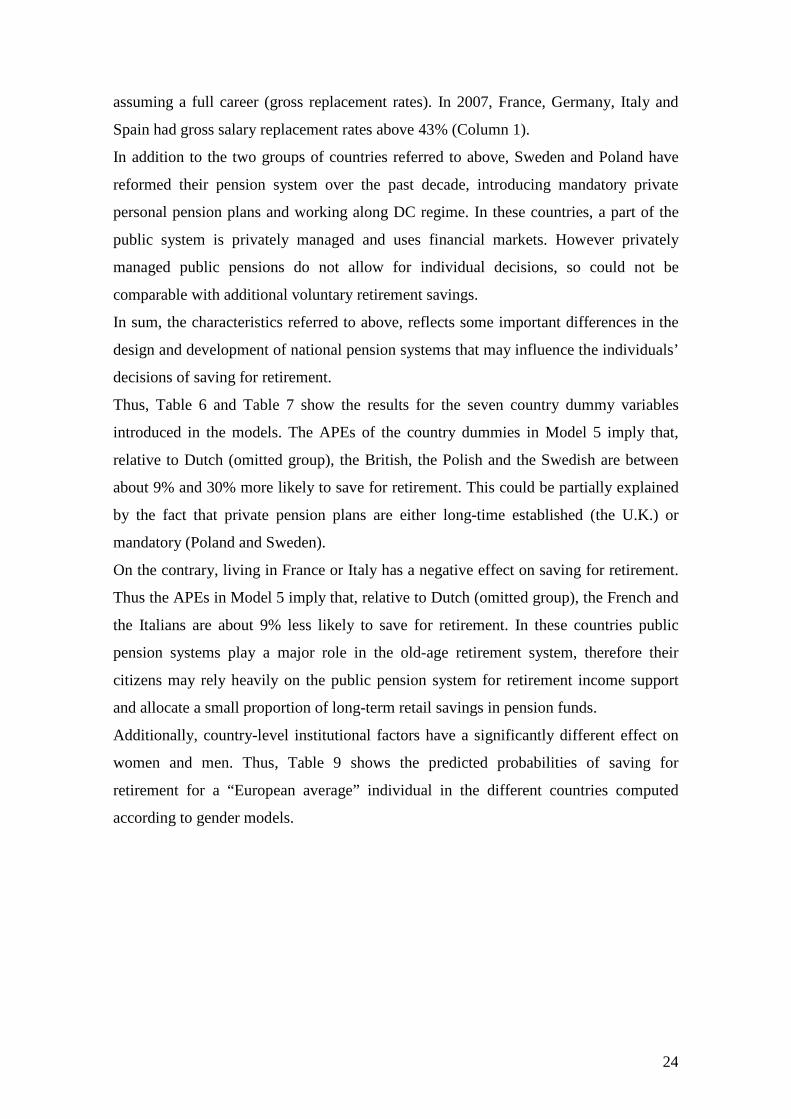
Additionally, country-level institutional factors have a significantly different effect on
women and men. Thus, Table 9 shows the predicted probabilities of saving for
retirement for a “European average” individual in the different countries computed
according to gender models.
25
Table 9. Predicted probability of saving for retirement for a “European average” individual (by country and
gender)
WOMEN MEN Predicted prob. 95% Conf. Interval Predicted prob. 95% Conf. Interval Spain 0.27 [0.22,0.32] 0.34 [0.29,0.39] France 0.21 [0.17,0.25] 0.26 [0.21,0.30] Italy 0.17 [0.13,0.21] 0.27 [0.22,0.32] UK 0.36 [0.31,0.41] 0.48 [0.42,0.53] Germany 0.30 [0.25,0.34] 0.31 [0.26,0.36] Sweden 0.62 [0.56,0.67] 0.67 [0.62,0.72] Poland 0.45 [0.38,0.52] 0.35 [0.29,0.40] Netherlands 0.28 [0.23,0.33] 0.37 [0.30,0.44]
In order to analyze in depth this effect, we divide the data into the sixteen subsamples
whose Table 10: Summary statistics by country and gender
descriptive statistics are reported in Table 10.
Spain France Italy UK Germany Sweden Poland Netherlands
W M W M W M W M W M W M W M W M
342 N
356 393 408 369 385 406 356 410 402 357 383 467 320 401 281 Retir 0.31 0.35 0.23 0.27 0.22 0.29 0.34 0.42 0.33 0.35 0.65 0.69 0.39 0.38 0.28 0.35
0.46 0.48 0.42 0.44 0.41 0.46 0.48 0.49 0.47 0.48 0.48 0.46 0.49 0.49 0.45 0.48
Age 34.31 35.78 41.17 47.62 41.34 45.95 38.35 37.47 43.00 47.56 43.80 44.73 27.58 33.33 39.37 41.31
9.27 11.11 13.19 13.60 12.13 13.53 11.39 12.26 12.94 12.50 12.50 12.69 9.65 12.54 12.14 12.65
Univ 0.50 0.49 0.42 0.50 0.56 0.56 0.33 0.32 0.27 0.32 0.30 0.39 0.38 0.40 0.12 0.15
0.50 0.50 0.49 0.50 0.50 0.50 0.47 0.47 0.44 0.47 0.46 0.49 0.49 0.49 0.32 0.35
Sec 0.42 0.42 0.51 0.46 0.34 0.39 0.63 0.62 0.68 0.63 0.66 0.58 0.60 0.59 0.86 0.82
0.49 0.49 0.50 0.50 0.47 0.49 0.48 0.49 0.47 0.48 0.48 0.49 0.49 0.49 0.35 0.39
Prim 0.06 0.07 0.05 0.03 0.04 0.03 0.00 0.01 0.04 0.03 0.02 0.01 0.02 0.01 0.01 0.02
0.23 0.25 0.23 0.17 0.20 0.16 0.05 0.09 0.19 0.18 0.14 0.11 0.14 0.10 0.11 0.14
Fin_literacy 0.79 0.76 0.62 0.66 0.81 0.78 0.67 0.67 0.71 0.79 0.70 0.73 0.67 0.70 0.67 0.72
0.25 0.29 0.23 0.24 0.25 0.28 0.23 0.25 0.26 0.24 0.28 0.27 0.31 0.33 0.32 0.33
Famsize 2.76 3.00 2.69 2.56 2.96 3.10 2.97 2.85 2.34 2.24 2.40 2.53 3.21 3.11 2.47 2.68
1.17 1.37 1.55 1.26 1.23 1.49 1.61 1.42 1.25 1.30 1.39 1.75 1.57 1.45 1.37 1.43
Single 0.11 0.12 0.17 0.18 0.12 0.12 0.17 0.19 0.24 0.29 0.28 0.30 0.12 0.11 0.26 0.25
0.31 0.32 0.38 0.38 0.32 0.33 0.37 0.39 0.43 0.45 0.45 0.46 0.32 0.32 0.44 0.43
Income 1.75 1.79 1.41 1.57 1.39 1.47 0.98 1.07 1.30 1.37 1.64 1.80 4.08 4.27 1.06 1.25
0.56 0.56 0.50 0.48 0.56 0.55 0.49 0.49 0.48 0.46 0.61 0.54 1.30 1.28 0.44 0.41
Hwhitecollar 0.54 0.52 0.47 0.53 0.44 0.43 0.33 0.33 0.35 0.39 0.24 0.26 0.39 0.44 0.25 0.31
0.50 0.50 0.50 0.50 0.50 0.50 0.47 0.47 0.48 0.49 0.43 0.44 0.49 0.50 0.43 0.46
Whitecollar 0.19 0.19 0.25 0.15 0.22 0.22 0.37 0.33 0.33 0.26 0.43 0.40 0.22 0.20 0.45 0.40
0.40 0.40 0.43 0.36 0.42 0.42 0.48 0.47 0.47 0.44 0.50 0.49 0.41 0.40 0.50 0.49
Bluecollar 0.21 0.20 0.21 0.17 0.19 0.15 0.21 0.22 0.20 0.14 0.17 0.18 0.30 0.27 0.12 0.12
0.41 0.40 0.41 0.38 0.39 0.36 0.41 0.42 0.40 0.35 0.38 0.39 0.46 0.44 0.33 0.33
Notes:
Table 10 shows the descriptive statistics (means and standard deviation) for the variables included in the empirical analysis by country and gender. Fin_literacy and Income variables are not in logs. Agesqua has been excluded.
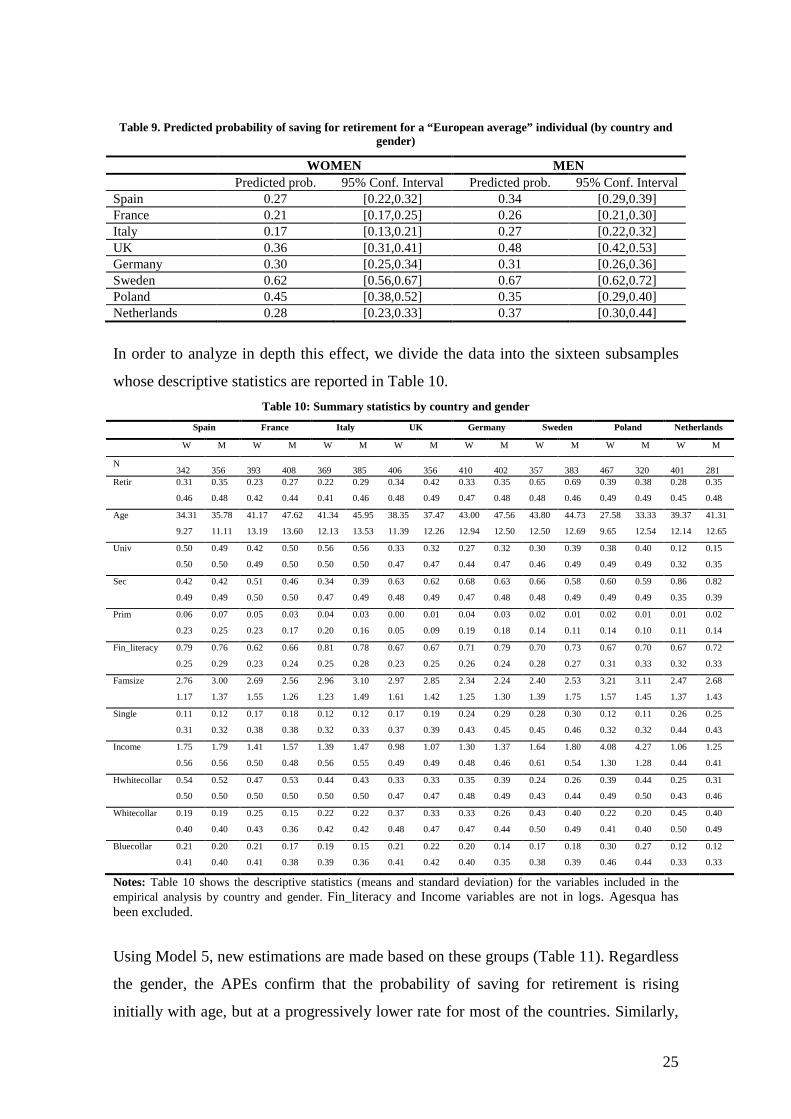
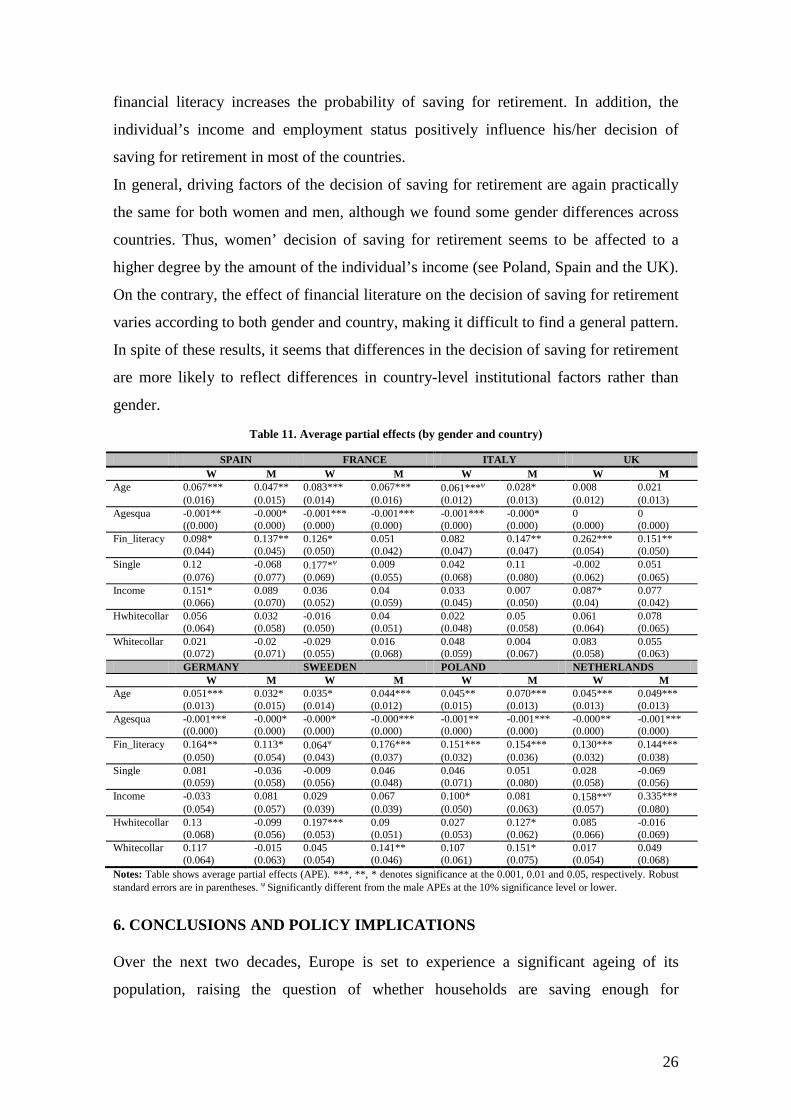
Using Model 5, new estimations are made based on these groups (Table 11). Regardless
the gender, the APEs confirm that the probability of saving for retirement is rising
initially with age, but at a progressively lower rate for most of the countries. Similarly,
26
financial literacy increases the probability of saving for retirement. In addition, the
individual’s income and employment status positively influence his/her decision of
saving for retirement in most of the countries.
In general, driving factors of the decision of saving for retirement are again practically
the same for both women and men, although we found some gender differences across
countries. Thus, women’ decision of saving for retirement seems to be affected to a
higher degree by the amount of the individual’s income (see Poland, Spain and the UK).
On the contrary, the effect of financial literature on the decision of saving for retirement
varies according to both gender and country, making it difficult to find a general pattern.
In spite of these results, it seems that differences in the decision of saving for retirement
are more likely to reflect differences in country-level institutional factors rather than
gender.
Table 11. Average partial effects (by gender and country)
SPAIN FRANCE ITALY UK W M W M W M W M
Age 0.067*** 0.047** 0.083*** 0.067*** 0.061***ψ 0.028* 0.008 0.021 (0.016) (0.015) (0.014) (0.016) (0.012) (0.013) (0.012) (0.013) Agesqua -0.001** -0.000* -0.001*** -0.001*** -0.001*** -0.000* 0 0 ((0.000) (0.000) (0.000) (0.000) (0.000) (0.000) (0.000) (0.000) Fin_literacy 0.098* 0.137** 0.126* 0.051 0.082 0.147** 0.262*** 0.151** (0.044) (0.045) (0.050) (0.042) (0.047) (0.047) (0.054) (0.050) Single 0.12 -0.068 0.177*ψ 0.009 0.042 0.11 -0.002 0.051 (0.076) (0.077) (0.069) (0.055) (0.068) (0.080) (0.062) (0.065) Income 0.151* 0.089 0.036 0.04 0.033 0.007 0.087* 0.077 (0.066) (0.070) (0.052) (0.059) (0.045) (0.050) (0.04) (0.042) Hwhitecollar 0.056 0.032 -0.016 0.04 0.022 0.05 0.061 0.078 (0.064) (0.058) (0.050) (0.051) (0.048) (0.058) (0.064) (0.065) Whitecollar 0.021 -0.02 -0.029 0.016 0.048 0.004 0.083 0.055 (0.072) (0.071) (0.055) (0.068) (0.059) (0.067) (0.058) (0.063) GERMANY SWEEDEN POLAND NETHERLANDS
W M W M W M W M Age 0.051*** 0.032* 0.035* 0.044*** 0.045** 0.070*** 0.045*** 0.049*** (0.013) (0.015) (0.014) (0.012) (0.015) (0.013) (0.013) (0.013) Agesqua -0.001*** -0.000* -0.000* -0.000*** -0.001** -0.001*** -0.000** -0.001*** ((0.000) (0.000) (0.000) (0.000) (0.000) (0.000) (0.000) (0.000) Fin_literacy 0.164** 0.113* 0.064ψ 0.176*** 0.151*** 0.154*** 0.130*** 0.144*** (0.050) (0.054) (0.043) (0.037) (0.032) (0.036) (0.032) (0.038) Single 0.081 -0.036 -0.009 0.046 0.046 0.051 0.028 -0.069 (0.059) (0.058) (0.056) (0.048) (0.071) (0.080) (0.058) (0.056) Income -0.033 0.081 0.029 0.067 0.100* 0.081 0.158**ψ 0.335*** (0.054) (0.057) (0.039) (0.039) (0.050) (0.063) (0.057) (0.080) Hwhitecollar 0.13 -0.099 0.197*** 0.09 0.027 0.127* 0.085 -0.016 (0.068) (0.056) (0.053) (0.051) (0.053) (0.062) (0.066) (0.069) Whitecollar 0.117 -0.015 0.045 0.141** 0.107 0.151* 0.017 0.049 (0.064) (0.063) (0.054) (0.046) (0.061) (0.075) (0.054) (0.068) Notes:
Table shows average partial effects (APE). ***, **, * denotes significance at the 0.001, 0.01 and 0.05, respectively. Robust standard errors are in parentheses. ψ Significantly different from the male APEs at the 10% significance level or lower.
6. CONCLUSIONS AND POLICY IMPLICATIONS
Over the next two decades, Europe is set to experience a significant ageing of its
population, raising the question of whether households are saving enough for
27
retirement. The evidence presented in this paper suggests that there is a significant
group of Europeans with little savings for retirement purposes. This problem is
especially acute for women. Thus, the results show that European women are less likely
to save for retirement than men.
A second finding of our study provides evidence that the driving factors of this saving
behaviour are practically the same for both genders. Thus, age positively influences
retirement savings, supporting the life-cycle savings hypothesis. Furthermore, the
results find robust evidence for an inverted U-shaped pattern in age with a maximum in
the mid 40s both for men and for women.
Similarly, individuals with a higher level of financial knowledge have a greater
tendency to save for retirement. This result firstly highlights the critical importance of
financial literacy in retirement planning. Secondly, it also suggests that in empirical
studies on financial decisions, the access to financial knowledge may be a more
important effect to explore, rather than the level of education.
Additionally, the individual’s income and employment status positively influence his
decision of saving for retirement; the higher his level of incomes and employment
status, the higher his probability of saving for retirement. This outcome is consistent
with the opinion of Hayes and Parker (1993) indicating that retirement planning is least
pursued by those who need it the most, particularly the economically disadvantaged.
Nevertheless, our results also show some gender differences. Thus, being a single
woman has a positive effect on saving for retirement (vs. non-single woman). This
result could be explained by the fact that single women are more aware of the future
risks to their retirement income, whereas non-single women are more confident in
family income.
Our third finding relates to the impact of the country-level institutional factors on the
individual-level retirement savings. The results suggest that country’s factors play a
crucial role on the individual’s retirement attitudes. Moreover, it seems that differences
in retirement preparation are more likely to reflect differences in country-level
institutional factors rather than gender. Thus, living in a country with mandatory or long
tradition of private pension plans (such as Poland, Sweden and the United Kingdom)
has a positive effect on saving for retirement. On the other hand, living in France or
Italy, where public pension systems still play a major role in the individual’s pension
benefits has a negative influence on saving for retirement (relative to the Netherlands).
28
This study contributes to the literature in two ways. First, it provides a description of the
Europeans’ decision making process when saving for retirement as well as of the
existence of marked differences across EU countries rather than between genders. Thus,
this study affords a better understanding of the decisions made by European individuals
regarding their retirement savings. Other works had previously covered some of the
issues analyzed here mainly focusing on the U.S. case. However, our reported results
are particularly important because of the size and characteristics of the sample used,
including individuals of eight different EU countries.
Second, our findings provide quantitative evidence on the determinants of the
individuals’ retirement attitudes. With our results in mind, the policy-makers
responsible for designing pension schemes will be able to make better decisions in order
to develop policy responses that would encourage sufficient additional saving. This
objective is particularly important in the present economic context where both trends in
ageing and employment and the ongoing financial crisis will put intense pressure on the
already overstretched public pension systems.
However, this paper also presents some limitations that could open the way for further
research.
The previous findings have important implications. First, an important percentage of the
Europeans are still not saving enough for retirement and completely rely on the
provision of state pension. However, the financial and economic crisis exacerbates the
more long-term structural problems faced by many countries’ public pension systems
due to population ageing (OECD, 2009) making them unsustainable. In this context,
voluntary retirement savings are needed to maintain current living standards in old age.
But this is a relatively new phenomenon in countries such as France, Italy, Spain and
Germany
In particular, our results are based on a cross section of data that show
different people at the same moment. Although it is tempting to draw conclusions about
how the decision of saving for retirement varies over the life-cycle based on these
results, which would be incorrect. Moreover, it is possible that the age effects that we
describe could be partially due to cohort effects. For instance, those households for
which the high-saving period in their life was in the high-inflation 70s could have eaten
away a lot of their savings. Therefore, future research on this topic might benefit by
collecting data with a longitudinal nature and improving the representativeness.
Second, the results show the importance of accounting for heterogeneity in retirement
savings. Therefore, any strategy targeted to enable individuals to prepare adequately for
29
retirement should take into account that different population groups present marked
differences in retirement saving behavior.
Third, our study provides evidence that financial literacy increases the probability of
saving for retirement. Signing up for a pension plan can be a long and complex process
while information about and understanding of saving options can be missing (OECD,
2009). Educational and financial planning programs, can help people, especially the
economically disadvantaged, better plan their retirement and make informed decisions
about voluntary private pension savings. Moreover, it may play an important role in
offsetting gender differences in financial decisions. In some countries, (for instance, in
the U.S.) retirement seminars are often provided by firms that offer DC retirement plans
or by some employers in the workplace. But European governments’ involvement in
financial education programs has also become important in light of many state pension
reforms. In any case, government should coordinate with the private sector in promoting
such financial education. In addition, retirement seminars will be most effective if they
are targeted to particular population subgroups, in order to address differences in saving
needs and in preferences.
Fourth, a common policy to encourage voluntary retirement savings is to give
preferential tax treatment to contributions and returns from investments in pension
plans. Nevertheless, our findings show that the higher the individual’s level of incomes
or employment status, the higher his probability of saving for retirement. Therefore, any
tax scheme to promote private retirement savings should consider targeting the less
economically prepared for retirement. Thus, in general many women still earn lower
wages than men in many occupations. Simply making contributions to private pension
plans deductible from personal income tax liabilities implies that higher earners get the
greatest benefit. In contrast low earners have lesser fiscal incentives to save for
retirement (OECD, 2009).
Finally, the probability of saving for retirement is also affected by institutional-level
country factors. Thus, an important percentage of individuals in general and women in
particular are still not saving enough for retirement and completely rely on the provision
of state pension, especially in France and Italy. However, the financial and economic
crisis exacerbates the more long-term structural problems faced by many countries’
public pension systems due to population ageing (OECD 2009) making them
unsustainable. In this context, voluntary retirement savings are needed to maintain
30
current living standards in old age and the aforesaid policies should be implemented
without delay especially in those countries.
7. BIBLIOGRAPHY
Australia and New Zealand Banking Group (2005) ANZ Survey of Adult Financial Literacy in Australia. Badunenko, O., Barasinska, N. and Schäfer, D. (2009) Risk Attitudes and Investment Decisions across European Countries – Are Women More Conservative Investors than Men?. Working Paper, Nº 928, DIW Berlin. Bajtelsmit, V. (1999) Evidence of risk aversion in the health and retirement study. Department of Finance and Real Estate, Colorado State University. Bajtelsmit, V. (2006) Gender, the family, and economy. In Orszag, M (ed): The Handbook of Pensions and Retirement Income. Oxford Universtity Press, 121-140. Bajtelsmit, V. and Bernasek. A. (1996) Why Do Women Invest Differently Than Men? Association for Financial Counseling and Planning Education. Bartus, T. (2005). Estimation of marginal effects using margeff. The Stata Journal, 53: 309-329. Browning, M. and Lusardi, A. (1996) Household saving: Micro theories and micro facts. Journal of Economic Literatures, 34: 1797-1855. Christelis, D., Jappelli, T., Padula, M., Don Melillo, V., Angelo, V. and Giobbe, S. (2006) Cognitive abilities and portfolio choice. C.E.P.R. Discussion Papers. DeVaney, S. and Chiremba, S. (2005) Comparing the retirement savings of the baby boomers and other cohorts. US Department of Labor, Bureau of Labor Statistics. Diaz-Serrano, L. and O'Neill, D. (2004) The Relationship between Unemployment and Risk-Aversion. IZA Discussion Paper, no. 1214. Dohmen, T., Falk, A., Huffman, D., Schupp, J., Sunde, U. and Wagner, G. (2005) Individual risk attitudes: new evidence from a large, representative, experimentally-validated survey. Discussion Paper, no. 511. European Commission (2007) The EU Market For Consumer Long Term Retail Savings Vehicles. Comparative Analysis Of Products, Market Structure, Costs, Distribution Systems and Consumer Saving Patterns. European Commission. Gerrans, P. and Clark-Murphy, M. (2004) Gender differences in retirement savings decisions. Journal of Pension Economics and Finance, 3(2):145-164. Gustman, A.L. and Steinmeier, T. (1992) The stampede toward defined contribution plans: Fact or ficition? Indus Relations, 31 (2): 361-369. Hair, J., Anderson, R., Tatham, R. and Black, W. (1998) Multivariate analysis. Prentice Hall International, Englewood. Harrison, G., Lau, M., Rutström, E. and Porcelaenshaven, B. (2007) Estimating risk attitudes in Denmark: A field experiment. Scandinavian Journal of Economics, 109(2):341-368. Hartog, J., Ferrer-i Carbonell, A. and Jonker, N. (2002) Linking measured risk aversion to individual characteristics, Kyklos 55(1): 3–26. Hayes, C. and Parker, M. (1993) Overview of the literature on pre-retirement planning for women. Journal of Women and Aging, 4(4):1-18.
31
Hinz, R.P., McCarthy, D. and Turner, J. A. (1996) Are women conservative investors? Gender diVerences in participant-directed pension investments in Positioning Pensions for the Twenty-First Century. Philadelphia: Pension Research Council and University of Pennsylvania Press. Huberman, G., Iyengar, S. and Jiang, W. (2007) Defined Contribution Pension Plans: Determinants of Participation and Contributions Rates. Journal of Financial Services Research, 31(1):1-32. Jelinek, T. and Schneider, O. (1998) Influence of Pension Funds on Private Savings in a Transition Country. Charles University CERGE-EI, Prague, June. Jianakoplos, N. and Bernasek, A. (1998) Are women more risk averse? Economic Inquiry, 36(4):620-630. Johannisson, I. (2008) Private pension savings: gender, marital status and wealth - evidence from Sweden in (2002). Licentiate thesis, University of Gothenburg. School of Business, Economics and Law. Johnson, J. E. V. and Powell, P. L. (1994) Decision Making, Risk and Gender: Are Managers Different? British Journal of Management, 5(2): 123-38. Li, J., Montalto, C. and Geistfeld, L. (1996) Determinants of financial adequacy for retirement. Financial Counseling and Planning, (7):39-48. Lind, J. and Mehlum, H. (2007) With or Without U?-The appropriate test for a U shaped relationship. MPRA Paper, University Library of Munich, no. 4823. Lusardi, A. and Mitchell, O. (2007a) Baby Boomer retirement security: The roles of planning, financial literacy, and housing wealth. Journal of Monetary Economics, 54(1):205-224. Lusardi, A. and Mitchell, O. (2007b) Financial literacy and retirement preparedness: Evidence and implications for financial education. Business Economics, 42(1):35-44. Lusardi, A. (2001) Explaining why so many households do not save. Center for Retirement Research Working Paper (2001)-05, vol. September. Malroutu, Y. and Xiao, J. (1995) Perceived adequacy of retirement income. Financial Counseling and Planning, 6:17-23. Moreno-Badia, M. (2006) Who Saves in Ireland?: The Micro Evidence. IMF Working Paper, no. 06/131, May (2006). Norton, E., Wang, H. and Ai, C. (2004). Computing interaction effects and standard errors in logit and probit models. The Stata Journal, 4(2):154-167. OECD (1998) Maintaining Prosperity in an Ageing Society. OECD, Paris. OECD (2008) OECD Employment Outlook (2008). OECD, Paris. OECD (2009) Pensions at a Glance 2009: Retirement-Income Systems in OECD Countries. OECD, Paris. Papke, L. (2003) Individual financial decisions in retirement saving plans: the role of participant-direction. Journal of Public Economics, 88(1-2):39-61. Richardson, V., Kilty, K. (1989) Retirement financial planning among black professionals. The Gerontologist, 29(1):32-37. Seong-Lim, L., Myung-Hee, P. and Montalto, P. (2000) The Effect of Family Life Cycle and Financial Management Practices on Household Saving Patterns. International Journal of Human Ecology, 1(1):79-93.

32
Shaw, L. and Hill, C. (2002) The gender gap in pension coverage: What does the future hold. Washington, DC: Institute for Women’s Policy Research. Retrieved April, vol. 24. Sundén, A. and Surette, B. (1998) Gender Differences in the Allocation of Assets in Retirement Savings Plans. American Economic Review, 88(2): 207-211. Wang, P. (1994) Brokers Still Treat Men Better Than Women Money, 25(6): 108-10.