The European Emissions Trading System and the German and ...
76
CLIMATE CHANGE German Environment Agency The European Emissions Trading System and the German and Polish Electricity Market Influence of market structures and market regulation on the carbon market Case Study Report 48/2020
Transcript of The European Emissions Trading System and the German and ...

CLIMATE CHANGE
German Environment Agency
The European Emissions Trading System and the German and Polish Electricity Market Influence of market structures and market regulation on the carbon market
Case Study Report
48/2020


CLIMATE CHANGE 48/2020
Ressortforschungsplan of the Federal Ministry for the
Enviroment, Nature Conservation and Nuclear Safety
Project No. (FKZ) 3718 42 002 0
Report No. FB000418/ZW,1,ENG
The European Emissions Trading System and the German and Polish Electricity Market Influence of market structures and market regulation on
the carbon market
Case study report
by
Jan Abrell, Regina Betz, Mirjam Kosch
Zurich University of Applied Sciences (ZHAW), Winterthur
On behalf of the German Environment Agency

Imprint
Publisher Umweltbundesamt Wörlitzer Platz 1 06844 Dessau-Roßlau Tel: +49 340-2103-0 Fax: +49 340-2103-2285 [email protected] Internet: www.umweltbundesamt.de
/umweltbundesamt.de /umweltbundesamt
Report performed by: Zurich University of Applied Sciences (ZHAW) Bahnhofplatz 12 8400 Winterthur Switzerland
Report completed in: August 2020
Edited by: Section V 3.3 Economic Aspects of Emissions Trading, Monitoring, Evaluation Claudia Gibis
Publication as pdf: http://www.umweltbundesamt.de/publikationen
ISSN 1862-4804
Dessau-Roßlau, December 2020
The responsibility for the content of this publication lies with the author(s).

CLIMATE CHANGE - The European Emissions Trading System and the German and Polish Electricity Market
5
Abstract
This report analyses the interaction of the European Emissions Trading System (EU ETS) and
the German and Polish electricity markets along two main questions: How do EU ETS design
features affect the environmental effectiveness of the system and the quality of the carbon price
signal? How do electricity market design features in Poland and Germany affect the carbon price
induced abatement in the power sector? Based on publicly available data and expert interviews,
we derive three main findings on the impact of the electricity market structure on the quality of
the EUA price.
First, the diversity and age of the capacity portfolio determine the response of the electricity
system to the EUA price. In systems with relatively young gas-fired plants, observing a fuel-
switching is likely before major investment taking place. Second, complementary policies such
as renewable or combined heat and power support and retail price policies (as the price cap for
power in Poland) reduce the role of the carbon price. The former for dispatching and investment
decisions and the latter for demand reduction and energy efficiency investments. Third,
complementary policies also reduce the predictability of the carbon price as they affect
investments and demand for emission allowances. The market stability reserve (MSR) - an
automatic adjustment mechanism within the EU ETS – can reduce the impact of these effects on
the allowance price to some extent, but does not remove all uncertainties.
This case study is part of the project “Influence of market structures and market regulation on the
carbon market” that aims to identify the impact of market structures and regulations on carbon
markets and to investigate the interdependencies between carbon and energy markets in
Europe, California, China, South Korea, and Mexico.
Kurzbeschreibung
Dieser Bericht analysiert die Interaktion des Europäischen Emissionshandelssystems (EU EHS)
und des deutschen und polnischen Strommarktes entlang zweier Hauptfragen: Wie wirken sich
die Gestaltungsmerkmale des EU EHS auf die ökologische Wirksamkeit des Systems und die
Qualität des CO2-Preissignals aus? Wie wirken sich die Gestaltungsmerkmale des Strommarktes
in Polen und Deutschland auf die durch das CO2-Preissignal induzierte Emissionsreduktion im
Stromsektor aus? Basierend auf öffentlich verfügbaren Daten und Experteninterviews, ziehen
wir drei wichtige Schlussfolgerungen zu den Auswirkungen der Strommarktstruktur auf die
Qualität des EUA-Preises.
Erstens bestimmen die Vielfalt und das Alter des Kapazitätsportfolios die Reaktion des
Elektrizitätssystems auf den EUA-Preis. In Systemen mit relativ jungen (Gas-)Kraftwerken
werden wir eher einen Wechsel von Kohle zu Gas beobachten bevor größere Investitionen
getätigt werden. Zweitens reduzieren flankierende Politiken wie die Förderung erneuerbarer
Energien oder der Kraft-Wärme-Kopplung sowie Preispolitiken (wie beispielsweise die
Preisobergrenze für Strom in Polen) die Rolle des CO2-Preises. Erstere für Dispatch- und
Investitionsentscheidungen und letztere für Nachfragereduktion und
Energieeffizienzinvestitionen. Drittens reduzieren begleitende Maßnahmen auch die
Vorhersagbarkeit des CO2-Preises, da sie die Investitionen und die Nachfrage nach
Emissionszertifikaten beeinflussen. Die Marktstabilitätsreserve (MSR) - ein automatischer
Anpassungsmechanismus innerhalb des EU EHS - kann die Auswirkungen dieser Effekte auf den
Zertifikatspreis bis zu einem gewissen Grad verringern, beseitigt aber nicht alle Unsicherheiten.
Diese Fallstudie ist Teil des Projekts “Influence of market structures and market regulation on the
carbon market”, welches zum Ziel hat, die Auswirkungen der Marktstrukturen und
Regulierungen auf CO2-Märkte zu identifizieren und die Abhängigkeiten von CO2- und
Energiemärkten in Europa, Kalifornien, China, Südkorea und Mexiko zu untersuchen.

CLIMATE CHANGE - The European Emissions Trading System and the German and Polish Electricity Market
6
Table of content
List of figures ........................................................................................................................................... 8
List of tables ............................................................................................................................................ 8
List of abbreviations ................................................................................................................................ 9
Summary and conclusions ..................................................................................................................... 10
Zusammenfassung und Schlussfolgerungen ......................................................................................... 13
1 Introduction ................................................................................................................................... 17
2 Design and regulation of the EU ETS ............................................................................................. 19
2.1 Allowance supply .................................................................................................................. 21
2.1.1 Allowance cap and long-term targets ............................................................................... 21
2.1.2 Initial allocation of allowances ......................................................................................... 21
2.1.3 Banking and borrowing ..................................................................................................... 24
2.1.4 Provisions for additional allowances supply ..................................................................... 24
2.1.5 Market stability mechanisms ............................................................................................ 24
2.1.6 Voluntary cancellation of allowances ............................................................................... 25
2.2 Demand ................................................................................................................................. 25
2.2.1 Coverage ........................................................................................................................... 25
2.2.2 Market participation ......................................................................................................... 26
2.3 Transaction and market oversight rules ............................................................................... 27
2.3.1 Legal nature of allowances ............................................................................................... 27
2.3.2 Fiscal nature of allowances ............................................................................................... 27
2.3.3 Market places.................................................................................................................... 27
2.3.4 Transparency regulation ................................................................................................... 28
3 Assessing the EU ETS design and the quality of the allowance price ............................................ 29
3.1 Volatility ................................................................................................................................ 30
3.2 Reflection of MAC ................................................................................................................. 30
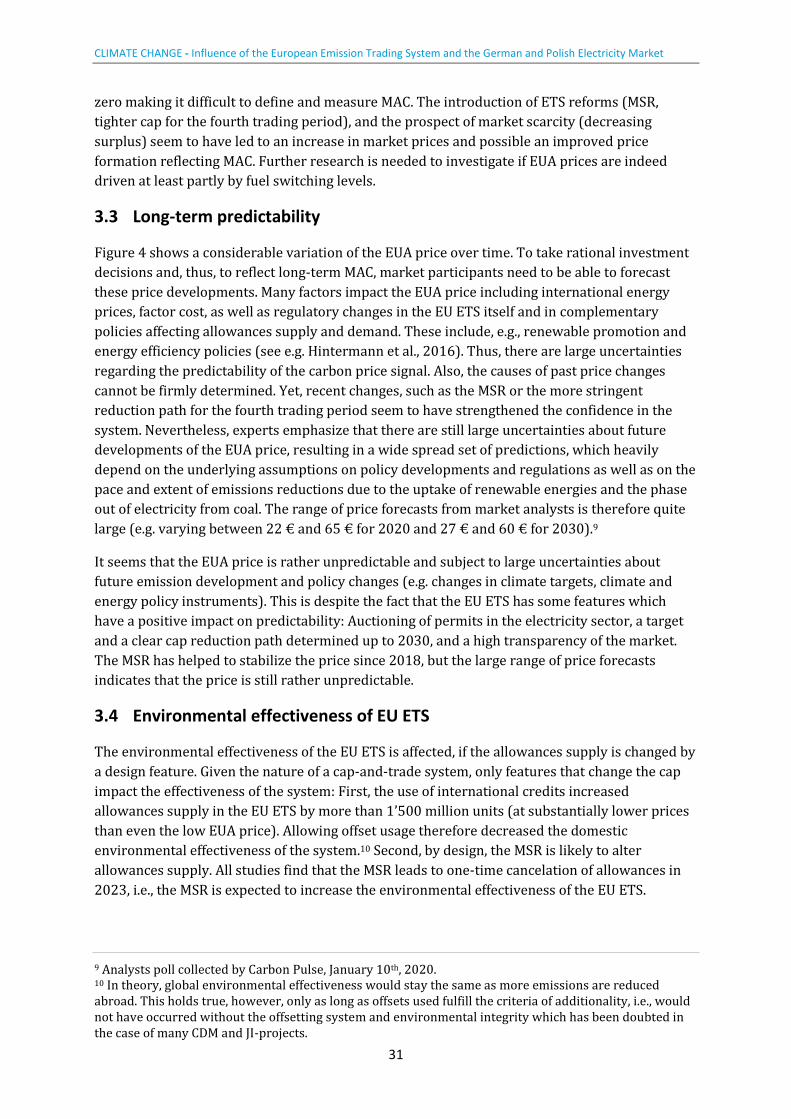
3.3 Long-term predictability ....................................................................................................... 31
3.4 Environmental effectiveness of EU ETS ................................................................................ 31
4 Introduction to German and Polish electricity markets ................................................................ 32
4.1 Market design and structure ................................................................................................ 32
4.1.1 Market Design ................................................................................................................... 32
4.1.2 Market Structure and Dynamics ....................................................................................... 33
4.2 Wholesale markets and dispatch .......................................................................................... 43
4.3 (Dis)investment and interacting policies .............................................................................. 45
4.3.1 Regulation of generation investments and disinvestments (closures)............................. 45

CLIMATE CHANGE - The European Emissions Trading System and the German and Polish Electricity Market
7
4.3.2 Capacity markets............................................................................................................... 47
4.3.3 Promotion policies ............................................................................................................ 48
4.4 Retail market and consumer price regulation ...................................................................... 50
5 Assessing electricity markets and the EU ETS’ impact on abatement .......................................... 52
5.1 Pass-through of carbon cost to wholesale electricity market prices .................................... 52
5.1.1 Observations ..................................................................................................................... 52
5.1.2 Impact of market structure and design ............................................................................ 53
5.2 Fuel switch: Impact of carbon price on dispatch .................................................................. 53
5.2.1 Observations ..................................................................................................................... 53
5.2.2 Impact of market structure and design ............................................................................ 55
5.3 Low carbon investment/disinvestment ................................................................................ 56
5.3.1 Observations ..................................................................................................................... 57
5.3.2 Impact of market structure and design ............................................................................ 57
5.4 Demand reduction and pass-through of carbon cost to end consumer prices .................... 59
5.4.1 Observations ..................................................................................................................... 59
5.4.2 Impact of market structure and design ............................................................................ 61
References ............................................................................................................................................. 62
A. Overview Market Stability Reserve (MSR) .................................................................................... 67
B. Electricity market design ............................................................................................................... 69
C. Fuel switch potential ..................................................................................................................... 74

CLIMATE CHANGE - The European Emissions Trading System and the German and Polish Electricity Market
8
List of figures
Figure 1: Allocation of Allowances in the EU ETS .................................................... 22
Figure 2: Compliance demand in the combustion sector (emissions not covered by
free allocation) ......................................................................... 23
Figure 3: Verified Emissions under the EU ETS ....................................................... 26
Figure 4: Development of EUA prices ..................................................................... 29
Figure 5: Installed capacities in Germany ............................................................... 34
Figure 6: Installed capacities in Poland ................................................................... 35
Figure 7: Planned power plant investments (as of 2019) ....................................... 36
Figure 8: German Market Shares in Conventional Generation Capacity (2018) ..... 37
Figure 9: Polish Market Shares in Conventional Generation Capacity (2018) ........ 39
Figure 10: German generation mix ......................................................................... 40
Figure 11: Polish generation mix ............................................................................. 41
Figure 12: Annual net-export of electricity ............................................................. 42
Figure 13: Timeline German electricity market ....................................................... 43
Figure 14: Timeline Polish electricity market .......................................................... 44
Figure 15: Wholesale electricity and EUA prices ..................................................... 52
Figure 16: Generation cost and EUA price .............................................................. 54
Figure 17: Retail prices for households and industries - Germany ......................... 60
Figure 18: Retail prices for households and industries - Poland ............................. 60
Figure 19: Allowance cap, long-term targets and market stability reserve
(installations) ............................................................................ 67
Figure 20: Timeline German electricity market ....................................................... 69
Figure 21: Timeline Polish electricity market .......................................................... 71
List of tables
Table 1: Interview partners ..................................................................................... 18
Table 2: Overview supply and demand side design features in the EU ETS............ 20
Table 3: Overview transaction and market oversight rules .................................... 27
Table 4: Comparison German and Polish electricity market ................................... 32
Table 5: Ownership structure of Germany electricity producers ............................ 38
Table 6: Ownership structure of Polish electricity producers ................................. 39
Table 7: Total number of allowances in circulation in 2018 ................................... 68
Table 8: German electricity market design ............................................................. 69
Table 9: Polish electricity market design ................................................................. 72
Table 10: Fuel switching potential in Germany (2017) ........................................... 75
Table 11: Fuel switching potential in Poland (2017) ............................................... 76

CLIMATE CHANGE - The European Emissions Trading System and the German and Polish Electricity Market
9
List of abbreviations
BNetzA Bundesnetzagentur
CDM Clean Development Mechanism
CER Certified Emission Reduction units
CHP Combined Heat and Power
DAM Day-ahead Market
DEHSt Deutsche Emissionshandelsstelle
DIW Deutsches Institut für Wirtschaftsforschung
EEX European Energy Exchange
ENTSOE European Network of Transmission System Operators for Electricity
EnWG Energiewirtschaftsgesetz
EPEX European Power Exchange
ERU Emission Reduction Units
ETS Emission Trading System
EU ETS European Union Emissions Trading System
EUA European Union Emission Allowances
EUTL European Union Transaction Log
ICE InterContinental Exchange
ICIS Independent Commodity Intelligence Services
IDM Intra-Day Market
JI Joint Implementation
Kobize Krajowy Ośrodek Bilansowania i Zarządzania Emisjami (Polish national center for emissions management)
LRF Linear Reduction Factor
MAC Marginal Abatement Cost
MSR Market Stability Reserve
OHA Open Holding Account
OPSD Open Power System Data
OTC Over the Counter
PIK Potsdam Institut für Klimafolgenforschung
RTM Real Time Market
TGE Towarowa Giełda Energii (Polish electricity market operator)
TSE Polskie Sieci Elektroenergetyczne (Polish transmission system operator)
TSO Transmission System Operator
VAT Value Added Tax

CLIMATE CHANGE - The European Emissions Trading System and the German and Polish Electricity Market
10
Summary and conclusions
This report analyses the influence of the EU ETS and the German and Polish electricity markets
along two main questions:
► How do EU ETS design features affect the environmental effectiveness of the system and the
quality of the carbon price signal?
► How do electricity market design features in Poland and Germany affect the carbon price
induced abatement in the power sector?
In the following, we first summarize our most important findings and then draw some interim
conclusion on the interaction of the two markets.
Impacts of carbon market design on the quality of the carbon price signal
The environmental effectiveness and the quality of the allowance price signal are most affected
by the emission target, the possibility of using offsets, and the market stability reserve:
► Volatility: Volatile carbon prices are an indicator that a market is able to react to newly
revealed information. Yet, excessive volatility makes it difficult for market participants to
make abatement and trading decisions. Short-term volatility of the EUA price remains rather
moderate and constant over time. The EU ETS has some features that according to theory
(Acworth et al., 2019) have a decreasing impact on volatility: a rather high transparency, an
open designed system, auctioning of permits for the largest group of emitters (electricity
generation) and the design as an open system in the sense of allowing participation of non-
regulated actors. The relatively low price volatility of the EU ETS can be seen as a weak
indicator, that these features also empirically show a decreasing impact on volatility.
► Reflection of MAC: Comparing the MAC and the EUA price enables to examine whether the
price signal is distorted. Due to the bidding behavior of fossil producers, the short-run MAC
of the electricity sector seem to be reflected in the EUA price, at least since 2018. However,
this is not necessarily the case for the long-run MAC or the MAC of other sectors. Also, the
large market surplus accumulated between 2009 and 2013 plays a role. Without scarcity,
there is no need for abatement making it difficult to define and measure MAC.
► Predictability: Because investors have a planning horizon of several years, the long-term
predictability of the price signal is essential to foster low carbon investments. The large
sustained market surplus seems to have led to very low prices and doubts about the
effectiveness of the system. Multi-annual discussions on ETS reforms (first backloading, then
about the MSR) heavily impacted the predictability of the carbon price and thus reduced its
impact on investments. The large inflow of international credits (offsets) contributed to
uncertainty about EUA price development as the international market development (large
supply of very low-priced credits from the Kyoto-mechanisms) was not anticipated by
regulators. In theory, a major driver of predictability is the existence of a reliable long-run
target which allows to better predict long-term prices, in reality the market tends to be
myopic, though. The introduced Market Stability Reserve introduces bounds on allowances
supply in the market, thereby increasing the flexibility of supply to react to changes in
demand and thus helps to stabilize the EUA price. But uncertainties on the future balance of
supply and demand remain with uncertain future emissions development (e.g. driven by

CLIMATE CHANGE - The European Emissions Trading System and the German and Polish Electricity Market
11
overall economic development, technological changes, overlapping policies etc.) and the
need for frequent ambition raising required by the Paris Agreement.
► Environmental effectiveness: The environmental effectiveness equals the amount of
emissions abated. It is thus mainly affected by design elements that change the emissions
cap: The effectiveness increases with a more stringent cap or the cancellation of allowances,
whereas it decreases when offsets with low environmental integrity or additionality are
imported. Moreover, the introduction of the MSR is expected to at least partly cancel the
additional supply in the year 2023 and beyond.
Impact of electricity market structure and regulation on the abatement induced by carbon
prices
The electricity sector abatement induced by the carbon price depends on market structure and
regulations:
► Capacity mix: The existing capacity mix, impacts the role of carbon prices for the
dispatching of power plants as well as for investment decisions. With a more diverse
capacity mix including natural gas like in Germany, carbon prices play a larger role in short-
term abatement (fuel switch) than in a coal-focused system like Poland where less fuel
switching is possible.
► Age of fleet: The age of the fleet also impacts the role of carbon prices for dispatching as
well as investments. A larger age like in Poland implies less efficient plants, and thus a higher
impact of carbon prices. Moreover, older plants need to be replaced in the near future. Thus,
carbon prices are more likely to trigger (dis)investments.
► Complementary policies: Additional policies play a key role determining the importance of
carbon prices for dispatching and investment decisions. Renewable and CHP support
incentivize the generation of certain technologies and therefore also investment into
corresponding capacities. As the renewable and CHP subsidies become an additional factor
influencing these decisions, the role of carbon prices is reduced. Therefore, support schemes
are often at least partly harmonized with the goal of carbon abatement. In both countries,
the CHP support is only granted for plants with a certain efficiency ensuring investment and
operation of less-carbon intense generation assets.
The impact of reliability and adequacy policies on the role of carbon prices depends on the
details of the individual design of the regulation. Granting income to power plants outside
the energy market like done by the German reserve scheme minimizes the interaction of
these payments with the carbon price. The Polish capacity market grants additional income
to incumbent power plants and, thus, is likely to reduce the role of carbon price driven
investments. As capacity payments do not affect short-run marginal cost determining the
power plant dispatch, the capacity market is however unlikely to affect the role of carbon
prices for dispatch.
► Pass-through of carbon cost to retail electricity prices: It seems that the pass-through of
carbon cost to retail electricity consumers is rather limited. Neither in Poland nor in
Germany final consumers seem to receive a proper signal at least not within the same year.
Both countries provide a compensation for indirect carbon cost to large electricity
consumers exposed to leakage risk, i.e., they are compensated for the carbon price

CLIMATE CHANGE - The European Emissions Trading System and the German and Polish Electricity Market
12
component of the electricity price. As these consumers do not receive the carbon price
signal, the role of carbon prices for energy efficiency investments is reduced. In Poland, the
retail price cap is likely to hinder the reflection of the EUA price in the electricity prices of
households and, thus, will reduce the role of carbon prices for households’ energy efficiency
improvements. In Germany, generation cost (including the carbon price) is only a small
share retail prices paid by households and small customers due to high taxes and levies.
Impact of electricity market structure on the quality of the carbon price signal
Provided our observations on the EU ETS and the electricity market structure in Poland and
Germany, we can derive the following conclusions regarding the impact of the electricity market
structure on the quality of the EUA price:
First, the diversity and age of the capacity portfolio is unlikely to influence the quality of the
price signal. These factors however do determine the response of the electricity system to the
EUA price. In systems with relatively young gas-fired plants, we are more likely to observe fuel-
switching before major investment takes place.
Second, there are two major factors affecting the role of the EUA price in the electricity sector:
Complementary policies such as renewable or CHP support in both countries and retail price
policies such as the price cap in Poland. Both mechanisms reduce the role of the carbon price.
The former for dispatching and investment decisions and the latter for demand reduction and
energy efficiency investments. Thus, both policies distort the MAC in the electricity sector. If the
electricity sector is the price setting sector in the carbon market, such policies reduce the
reflection of MAC through the carbon price.
Finally, complementary policies also affect the predictability of the carbon price. On the one
hand, they impact investments. Thus, in forecasting carbon prices one needs to forecast the
impact of additional policies. On the other hand, policies granting subsidies based on generation
impact the demand for emission allowances. Thus, carbon price predictability decreases as
demand uncertainty increases. The MSR - an automatic adjustment mechanism within the EU
ETS – can reduce the impact of these effects on the allowance price to some extent, but does not
remove all uncertainties. To what extent voluntary cancellation according to Article 12(4) will
help to stabilize the demand-supply balance on the European carbon market, and thus improve
predictability of EUA prices, remains to be seen.

CLIMATE CHANGE - The European Emissions Trading System and the German and Polish Electricity Market
13
Zusammenfassung und Schlussfolgerungen
Dieser Bericht analysiert die Interaktion des Europäischen Emissionshandelssystems (EU EHS)
und des deutschen und polnischen Strommarktes entlang zweier Hauptfragen:
► Wie wirken sich die Gestaltungsmerkmale des EU EHS auf die ökologische Wirksamkeit des
Systems und die Qualität des CO2-Preissignals aus?
► Wie wirken sich die Gestaltungsmerkmale des Strommarktes in Polen und Deutschland auf
die durch das CO2-Preissignal induzierte Emissionsreduktion im Stromsektor aus?
Im Folgenden fassen wir unsere wichtigsten Ergebnisse zusammen.
Auswirkungen der Ausgestaltung des Emissionshandels auf die Qualität des CO2-
Preissignals
Die Umweltwirksamkeit und die Qualität des Preissignals für Zertifikate werden am stärksten
durch das Emissionsziel, die Möglichkeit der Nutzung von Offsets und die
Marktstabilitätsreserve beeinflusst:
► Volatilität: Volatile CO2-Preise sind ein Indikator dafür, dass ein Markt in der Lage ist, auf
neue Informationen zu reagieren. Eine übermäßige Volatilität erschwert es den
Marktteilnehmern jedoch, Vermeidungs- und Handelsentscheidungen zu treffen. Die
kurzfristige Volatilität des EUA-Preises war moderat und konstant. Das EU EHS weist einige
Merkmale auf, die der Theorie zufolge (Acworth et al., 2019) die Volatilität reduzieren: eine
recht hohe Transparenz, die Versteigerung von Zertifikaten für die größte Gruppe von
Emittenten (Stromerzeugung) und die Gestaltung als offenes System im Sinne einer
Beteiligung nicht regulierter Akteure. Die relativ geringe Preisvolatilität des EU EHS kann als
schwacher Indikator dafür gesehen werden, dass diese Merkmale auch aus empirischer Sicht
die Volatilität reduzieren.
► Widerspiegelung der Grenzvermeidungskosten: Ein Vergleich der
Grenzvermeidungskosten und des EUA-Preises ermöglicht es zu untersuchen, ob das
Preissignal verzerrt ist. Aufgrund des Bieterverhaltens der fossilen Produzenten scheinen
sich die kurzfristigen Grenzvermeidungskosten des Stromsektors zumindest seit 2018 im
EUA-Preis widerzuspiegeln. Dies ist jedoch nicht unbedingt der Fall für die langfristigen
Grenzvermeidungskosten bzw. die Grenzvermeidungskosten anderer Sektoren. Auch der
große Angebotsüberschuss, der sich zwischen 2009 und 2013 angesammelt hat, spielt eine
Rolle. Ohne Knappheit gibt es keine Notwendigkeit für Emissionsminderungen, was die
Definition und Messung der Grenzvermeidungskosten erschwert.
► Vorhersagbarkeit: Da Investoren einen Planungshorizont von mehreren Jahren haben, ist
die langfristige Vorhersagbarkeit des Preissignals für die Förderung emissionsarmer
Investitionen von entscheidender Bedeutung. Der große anhaltende Angebotsüberschuss
scheint zu sehr niedrigen Preisen und Zweifeln an der Wirksamkeit des Systems geführt zu
haben. Mehrjährige Diskussionen über EHS-Reformen (zuerst Backloading, dann über die
Marktstabilitätsreserve) haben die Vorhersagbarkeit des Kohlenstoffpreises stark
beeinträchtigt und damit seine Auswirkungen auf Investitionen verringert. Die
Verfügbarkeit von internationalen Gutschriften (Offsets) trug zur Unsicherheit über die

CLIMATE CHANGE - The European Emissions Trading System and the German and Polish Electricity Market
14
Entwicklung des EUA-Preises bei, da die internationale Marktentwicklung (großes Angebot
an kostengünstigen Gutschriften aus den Kyoto-Mechanismen) von den Marktteilnehmern
nur schwer vorhersehbar war. Die Existenz eines zuverlässigen langfristigen Ziels ist in der
Theorie ein wichtiger Faktor für die Vorhersagbarkeit der langfristigen Preise. In Realität
scheinen die Markteilnehmer jedoch eher kurzsichtig zu agieren. Die eingeführte
Marktstabilitätsreserve führt eine Begrenzung des Angebots an Zertifikaten auf dem Markt
ein, wodurch die Flexibilität des Angebots erhöht wird, um auf Veränderungen der
Nachfrage zu reagieren. Somit trägt die Reserve zur Stabilisierung des EUA-Preises bei.
Unsicherheiten über das künftige Gleichgewicht von Angebot und Nachfrage bleiben jedoch
bestehen, da die künftige Emissionsentwicklung ungewiss ist (z.B. bedingt durch die
allgemeine wirtschaftliche Entwicklung, technologische Veränderungen, komplementäre
Politiken usw.) und die im Pariser Abkommen geforderte Verschärfung der Ziele umgesetzt
werden muss.
► Umweltwirksamkeit: Die Umweltwirksamkeit entspricht der Menge an Emissionen, die
vermieden werden. Sie wird also hauptsächlich durch Designelemente beeinflusst, die die
Emissionsobergrenze verändern: Die Wirksamkeit steigt mit einer strengeren Obergrenze
oder der Löschung von Zertifikaten während sie abnimmt, wenn ausländische Gutschriften
mit geringerer Umweltwirkung oder fehlender Additionalität zugelassen werden. Darüber
hinaus wird erwartet, dass durch die Marktstabilitätsreserve ein Teil des Überschusses ab
dem Jahr 2023 gelöscht wird.
Auswirkungen der Struktur des Elektrizitätsmarktes und der Regulierung auf die durch die
CO2-Preise induzierte Emissionsreduktion
Die durch den Kohlenstoffpreis induzierte Vermeidung im Elektrizitätssektor hängt von der
Marktstruktur und der Regulierung des Strommarkts ab:
► Kapazitätsmix: Der bestehende Kapazitätsmix beeinflusst die Rolle der Kohlenstoffpreise
sowohl für den Dispatch von Kraftwerken als auch für Investitionsentscheidungen. Bei
einem diversifizierten Kapazitätsmix (inkl. Erdgas) wie in Deutschland spielen CO2-Preise
bei der kurzfristigen Vermeidung (Wechsel von Kohle zu Gas) eine größere Rolle als in
einem kohlefokussierten System wie Polen, wo dies weniger möglich ist.
► Alter der Produktionsflotte: Auch das Alter der Flotte wirkt sich auf die Rolle der CO2-
Preise sowohl für den Dispatch als auch für Investitionen aus. Ein höheres Alter wie in Polen
bedeutet weniger effiziente Anlagen und damit einen höheren Einfluss der CO2-Preise.
Außerdem müssen ältere Anlagen in naher Zukunft ersetzt werden. Daher ist es
wahrscheinlicher, dass CO2-Preise (Des-)Investitionen auslösen.
► Begleitende Politikmaßnahmen: Zusätzliche Politiken spielen eine Schlüsselrolle für die
Bedeutung des CO2-Preises bei Dispatch- und Investitionsentscheidungen. Die Förderung
erneuerbarer Energien und der Kraft-Wärme-Kopplung (KWK) gibt Anreize für die
Erzeugung bestimmter Technologien und damit auch für Investitionen in entsprechende
Kapazitäten. Da Subventionen für erneuerbare Energien und Kraft-Wärme-Kopplung zu
einem zusätzlichen Faktor der Investitionsentscheidung werden, verringert sich die
Bedeutung des CO2-Preises. Daher werden die Förderprogramme oft zumindest teilweise

CLIMATE CHANGE - The European Emissions Trading System and the German and Polish Electricity Market
15
mit dem CO2-Minderungsziel harmonisiert. In beiden Ländern wird die KWK-Förderung nur
für Anlagen mit einem bestimmten Wirkungsgrad gewährt, der die Investition und den
Betrieb von emissionsarmen Erzeugungsanlagen gewährleistet.
► Der Einfluss von zusätzlichen Politiken auf die Rolle der CO2-Preise hängt von der
individuellen Ausgestaltung der Regelung ab. Die Gewährung von Einkünften an Kraftwerke
außerhalb des Energiemarktes, wie dies durch das deutsche Reservesystem geschieht,
minimiert die Interaktion dieser Zahlungen mit dem EUA-Preis. Der polnische
Kapazitätsmarkt gewährt den etablierten Kraftwerken zusätzliche Einnahmen und wird
daher wahrscheinlich den Einfluss des CO2-Preises auf die Investitionen reduzieren. Da
Kapazitätszahlungen keinen Einfluss haben auf die kurzfristigen Grenzkosten, die den
Kraftwerkseinsatz bestimmen, ist es jedoch unwahrscheinlich, dass der Kapazitätsmarkt die
Rolle der Kohlenstoffpreise für den Dispatch beeinflusst.
► Überwälzung der CO2-Kosten auf die Endkundenstrompreise: Es scheint, dass die
Weitergabe der CO2-Kosten an die Stromeinzelhandelskunden eher begrenzt ist. Weder in
Polen noch in Deutschland scheinen die Endverbraucher ein angemessenes Signal zu
erhalten, zumindest nicht innerhalb desselben Jahres. Beide Länder bieten großen
Stromverbrauchern, die einem Risiko für „Carbon Leakage“ ausgesetzt sind, einen Ausgleich
für die indirekten CO2-Kosten, d.h. sie werden für die CO2-Preiskomponente des
Strompreises entschädigt. Da diese Verbraucher das Preissignal nicht erhalten, verringert
sich die Rolle der CO2-Preise für Investitionen in die Energieeffizienz. In Polen dürfte die
Obergrenze für den Endkundenpreis die Weitergabe des EUA-Preises in den Strompreisen
für Haushalte behindern. Somit verringert sich auch die Rolle der CO2-Preise für
Verbesserungen der Energieeffizienz der Haushalte. In Deutschland machen die
Erzeugungskosten (einschließlich des CO2-Preises) aufgrund hoher Steuern und Abgaben
außerdem nur einen kleinen Teil der von Haushalten und Kleinkunden gezahlten
Strompreise aus.
Auswirkungen der Struktur des Strommarktes auf die Qualität des CO2-Preissignals
Auf Grundlage unserer Beobachtungen zum EU EHS und der Strommarktstruktur in Polen und
Deutschland ziehen wir folgende Schlussfolgerungen zu den Auswirkungen der
Strommarktstruktur auf die Qualität des EUA-Preises:
Erstens ist es unwahrscheinlich, dass die Vielfalt und das Alter des Kapazitätsportfolios die
Qualität des Preissignals beeinflussen. Diese Faktoren bestimmen jedoch die Reaktion des
Elektrizitätssystems auf den EUA-Preis. In Systemen mit relativ jungen (Gas-)Kraftwerken
werden wir eher einen Wechsel von Kohle zu Gas beobachten bevor größere Investitionen
getätigt werden.
Zweitens gibt es zwei wichtige Faktoren, die die Rolle des EUA-Preises im Stromsektor
beeinflussen: Begleitende Politikmaßnahmen wie die Förderung erneuerbarer Energien oder
der Kraft-Wärme-Kopplung sowie Preispolitiken wie beispielsweise die Preisobergrenze in
Polen. Beide Mechanismen reduzieren die Rolle des CO2-Preises. Ersterer für Dispatch- und
Investitionsentscheidungen und letzterer für Nachfragereduktion und
Energieeffizienzinvestitionen. Somit verzerren beide Politiken die Grenzvermeidungskosten im
Elektrizitätssektor. Wenn der Elektrizitätssektor der preisbestimmende Sektor auf dem CO2-

CLIMATE CHANGE - The European Emissions Trading System and the German and Polish Electricity Market
16
Markt ist, verringern solche Politiken die Reflektion der Grenzvermeidungskosten durch den
CO2-Preis.
Schließlich beeinflussen begleitende Politikmaßnahmen auch die Vorhersehbarkeit des
Kohlenstoffpreises. Einerseits wirken sie sich auf Investitionen aus. Daher muss man bei der
Vorhersage von CO2-Preisen die Auswirkungen zusätzlicher Maßnahmen abschätzen. Auf der
anderen Seite beeinflussen Produktionssubventionen die Nachfrage nach Emissionszertifikaten.
Daher nimmt die Vorhersagbarkeit des CO2-Preises mit zunehmender Unsicherheit der
Nachfrage ab. Die Marktstabilitätsreserve - ein automatischer Anpassungsmechanismus
innerhalb des EU EHS - kann die Auswirkungen dieser Effekte auf den Zertifikatspreis bis zu
einem gewissen Grad verringern, beseitigt aber nicht alle Unsicherheiten. Inwieweit die
freiwillige Löschung nach Artikel 12 Absatz 4 dazu beitragen wird, das Nachfrage-Angebots-
Gleichgewicht auf dem europäischen Kohlenstoffmarkt zu stabilisieren und damit die
Vorhersagbarkeit der EUA-Preise zu verbessern, bleibt abzuwarten.

CLIMATE CHANGE - The European Emissions Trading System and the German and Polish Electricity Market
17
1 Introduction The project “Influence of market structures and market regulation on the carbon market” aims
to identify the impact of market structures and regulations on carbon markets and to investigate
the interdependencies between carbon and energy markets. In a first step, Acworth et al. (2019)
identified major interaction channels based on a literature study. In a second step, case studies
are used to analyse the mechanisms and interaction channels based on the previously developed
framework. In this report, we present the case study for the European Emission Trading System
(EU ETS) and the German and Polish electricity market. The aim of the case study is to analyse
the design of the different markets and regulations and how these affect the carbon price as well
as market interactions in terms of emission reduction. An assessment of the emissions and
power markets in terms of their functioning or quality of the price signal is beyond the scope of
this project. Nevertheless, this report addresses the following two questions:
1. How do EU ETS design features affect the environmental effectiveness of the system and
the quality of the carbon price signal?
2. How do electricity market design features in Poland and Germany affect the carbon price
induced abatement in the power sector?
The report is structured in two parts. First, we describe the EU ETS, its most important design
features, and the development of traded allowance volumes and allowance prices. Further, we
assess the impact of design features on the effectiveness of the system and the quality of the
allowance price along four dimensions:
► Environmental effectiveness: The environmental effectiveness equals the amount of
emissions abated.
► Reflection of marginal abatement cost (MAC): Examining the MAC enables to examine
whether the price signal is distorted.
► Long-term price predictability: Because investors have a planning horizon of several years,
the long-term predictability of the price signal is essential to foster low carbon investments.
► Price volatility: Volatile carbon prices are an indicator that a market is able to react to newly
revealed information, e.g., changes in production cost. Yet, excessive volatility makes it
difficult for market participants to make abatement and trading decisions.
Second, we describe the German and Polish electricity markets in terms of design, supply, and
demand. We then assess the interaction of carbon and electricity markets, focusing on the
impact of carbon prices on electricity generation, demand, and consequently abatement. We
assess this impact along the three main abatement channels:
► Fuel switch: Short-term abatement through change in dispatch.
► Low carbon investment/divestment: Long-term abatement through investment in low
carbon technologies or divestment from fossil technologies.
► Demand reduction: Short to long-run abatement due to demand reduction induced by higher
electricity prices for consumers in wholesale and retail markets.
All three abatement channels depend on the pass-through of the carbon price signal to bids in
the electricity market, and thus wholesale market prices. We thus also provide evidence on the
cost pass-through.

CLIMATE CHANGE - The European Emissions Trading System and the German and Polish Electricity Market
18
The framework of this report is based on Acworth et al. (2019). For the analyses, we (i) use
literature on carbon and electricity market regulations, research articles, and secondary
literature; (ii) analyse electricity and carbon market data from TGE, EUTL, ENTSOE, EPEX, OPSD,
and ICE; and (iii) conduct semi-structured interviews with different stakeholders from Germany
and Poland. Table 1 gives an overview of interview partners in both countries.
Table 1: Interview partners
Feature
Companies 5 3
Researchers and Think Tanks PIK, DIW Forum Energii, Wise Europa, Kozminski University
Regulators DEHSt KOBiZE
Others EEX, ICIS TGE
With our analyses we provide descriptive and narrative evidence on the interactions of carbon
and electricity market regulations in the two countries. A thorough quantitative assessment of
causal relations is beyond the scope of this project. Also, it is important to note that the results
from expert interviews provide a range of expert opinions, but cannot be seen as representative.
This report proceeds as follows. Section 2 describes design and regulation of the EU ETS, Section
3 assesses their impact on environmental effectiveness and the quality of the price signal,
Section 4 introduces the German and Polish electricity markets, Section 5 analyses the impact of
electricity market design on carbon price induced abatement in the power sector.
CLIMATE CHANGE - The European Emissions Trading System and the German and Polish Electricity Market
19
2 Design and regulation of the EU ETS The EU ETS covers around 40% of EU greenhouse gas emissions from large-scale facilities in the
power and industry sectors, as well as since 2012 the aviation sector. It is a cap and trade
system. Each ton of carbon dioxide (CO2) of the cap is worth one European emission allowance
(EUA) and gives the right to emit one ton of CO2 equivalent (CO2 eq.). Regulated entities need to
hand in allowances for each unit of emissions in the previous year. If the amount of surrendered
allowances does not match emissions, fines and make good provisions are imposed.
Up to now, the EU ETS can be divided into three phases. The pilot phase from 2005 to 2007
established the EU ETS as the world’s largest carbon market. In the second trading period from
2008 to 2012 Norway, Iceland and Liechtenstein joined. The third period runs from 2013-2020
and the system is regulated on the European level as one sector with a high share of auctioning.
In 2020, the Swiss ETS was linked to the EU ETS and from 2021 the EU ETS will enter its fourth
period lasting until 2030.
Table 2 gives an overview over supply and demand side design features in the EU ETS. In the
following, we describe the individual design features of the EU ETS. In the next section, we
reflect on the design features’ impact on the environmental effectiveness of the system and the
quality of the EUA price signal along the three dimensions (1) price volatility, (2) reflection of
the marginal abatement cost (MAC), and (3) long-term predictability.

CLIMATE CHANGE - The European Emissions Trading System and the German and Polish Electricity Market
20
Table 2: Overview supply and demand side design features in the EU ETS
Feature EU ETS Design Comment
Allowance Cap Absolute Absolute cap and constant linear reduction factor (LRF) 2012-2020: 1.74% (in relation to 2010 reference value, 38 Mio. EUA per year) from 2021 on: 2.2% (48 Mio. EUA per year)
Mid-term Target Long-term Target
2030 target: adopted 2050 target: under discussion
-43% against 2005 Continuation of LRF 2.2% would lead to 85% reduction, which is not in line with net-zero emissions, as proposed by the EU Green Deal
Primary Allocation (in electricity sector)
Auctioning in electricity sector, transitional free allocation for selected member states
DE: Auctioning in electricity sector PL: Auctioning in electricity sector and transitional free allocation (Art. 10c)
Banking Borrowing
Allowed Partly allowed
within & across periods within periods (use of current year’s free allocation for last year’s emissions)
Additional sources of Supply
Offsets Linking allowed
CER, ERU until 2020 only Linking with CH ETS since 2020
Market Stability Mechanism
Quantity bounds (Market Stability Reserve, MSR)
Since 2019: reduces (increases) auction amounts dependent on market surplus 2023: Cancellation of permits from MSR
Voluntary Cancellation
Allowed
Coverage 40% of EU GHG emissions (as of 2017)
Mostly CO2 but also N2O and PFCs
Market participation
Open System Non regulated entities can open accounts and participate in trade

CLIMATE CHANGE - Influence of the European Emission Trading System and the German and Polish Electricity Market
21
2.1 Allowance supply
This section describes the supply side features of the EU ETS.
2.1.1 Allowance cap and long-term targets
The EU ETS has an absolute allowance cap. It demands, that by the end of 2020, emissions have
decreased by 21% compared to 2005. To reach this target, the cap is decreased every year since
2013 by a linear reduction factor (LRF) of 1.74% of the 2010-cap (plus correction for enlarged
scope since 2013) or 38 million allowances per year.1 From 2021 onwards, the cap is reduced by
2.2% (48 million allowances2) per year, resulting in a reduction of 43% until the year 2030.
Targets after 2030 are not yet determined, but there is no expiration date of the linear reduction
factor. A continuation of this reduction path, leads to a reduction of 85% in 2050, which is not in
line with the target of net zero emissions in the year 2050 as proposed by the European Green
Deal. Discussions on future targets have just begun and it is not unlikely that the 2030 targets
will be revised downward to reflect ramped up ambition in the EU.
2.1.2 Initial allocation of allowances
There are two main options for initial permit allocation: free allocation or auctioning. Figure 1
shows the free allocation to combustion installations and other activities as well as the amount
of auctioned allowances. Whereas industrial installations still receive substantial free allocation
to lower competitive impacts for trade exposed industries, free allocation to combustion
installations significantly decreased since 2013. In the power sector, there is generally no free
allocation, i.e. firms need to buy all their allowances.3
However, under EC (2018a) Article 10c, a derogation was granted to eight Member States,
Bulgaria, Cyprus, Czech Republic, Estonia, Hungary, Lithuania, Poland and Romania.4 The power
sector in these countries continues to receive a (decreasing) amount of allowances for free. In
return, they agreed to invest the value of these freely received allowances in the modernization
of their power sectors. This derogation has to end by 2030.
1 Aviation is regulated under a separate cap for the 2013-2020 period. It lies 5% below average annual emissions during the years 2004 to 2006. 2 The absolute figure for the LRF is without accounting for the UK possibly leaving the EU ETS. 3 As an exception, combined heat and power (CHP) plant receive free allowances for heat delivered to sectors not covered under the EU ETS. 4 Malta and Latvia are also eligible for the derogation but decided to not use it.

CLIMATE CHANGE - Influence of the European Emission Trading System and the German and Polish Electricity Market
22
Figure 1: Allocation of Allowances in the EU ETS
Source: Own figure based on EEA Emission Viewer. The first trading period (2005-2007) is not included in this figure as it was a
pilot phase and allowances could not be transferred (banked) to future periods.
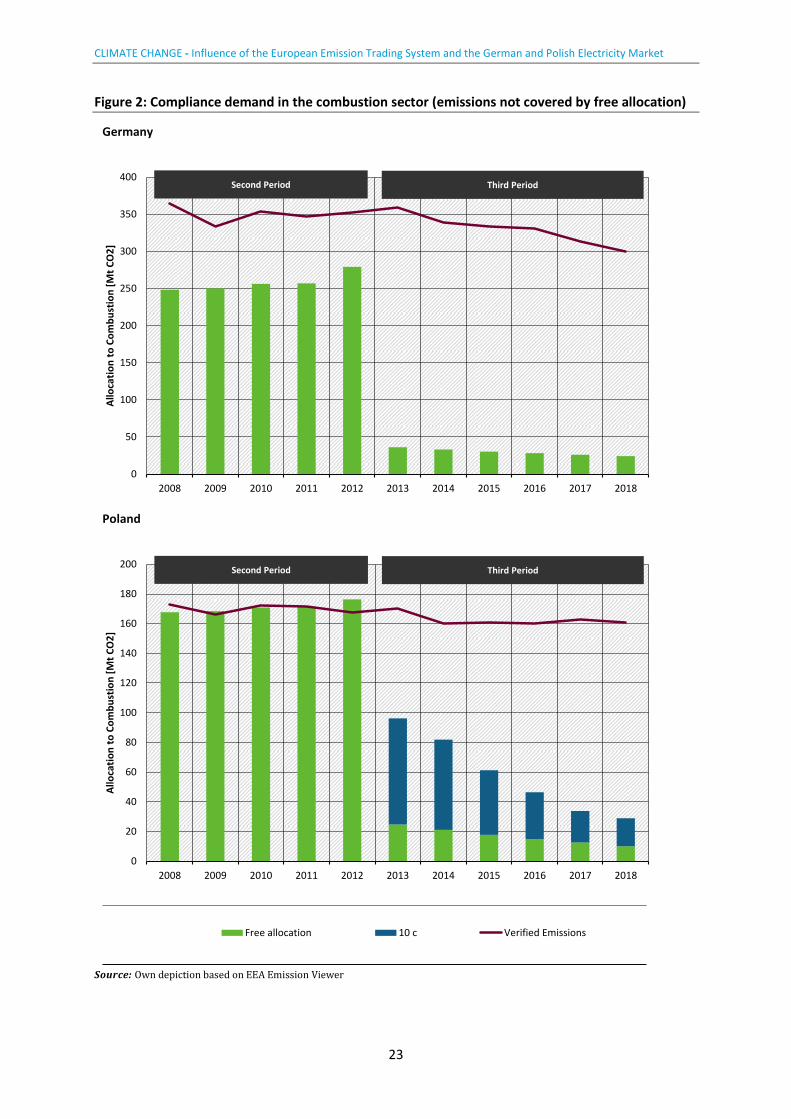
Figure 2 below shows free allocation for Germany and Poland (including free allocation under
Article 10c) for combustion installations together with verified emissions of these installations.
The difference between free allocation and verified emissions can be interpreted as the
compliance demand, i.e., the amount of allowances to be bought from the market in order to
comply with the EU ETS. In Germany, only a small amount of allowances is provided for free,
mainly to combustion installations for industry production and heat. In contrast, Poland shows a
high amount of free allowances. In fact, Poland is the country with the highest amount of free
allocation under Article 10c (see EC, 2019a).
0
500
1’000
1’500
2’000
2’500
2008 2009 2010 2011 2012 2013 2014 2015 2016 2017 2018
Allo
cati
on
of
Allo
wan
ces
[Mt
CO
2]
Free Allocation Industries Free Allocation Combustion Auctioned and sold allowances
Second Period Third Period
CLIMATE CHANGE - Influence of the European Emission Trading System and the German and Polish Electricity Market
23
Figure 2: Compliance demand in the combustion sector (emissions not covered by free allocation)
Source: Own depiction based on EEA Emission Viewer
0
50
100
150
200
250
300
350
400
2008 2009 2010 2011 2012 2013 2014 2015 2016 2017 2018
Allo
cati
on
to
Co
mb
ust
ion
[M
t C
O2
]
Free allocation 10 c Verified Emissions
Second Period Third Period
Germany
0
20
40
60
80
100
120
140
160
180
200
2008 2009 2010 2011 2012 2013 2014 2015 2016 2017 2018
Allo
cati
on
to
Co
mb
ust
ion
[M
t C
O2
]
Free allocation 10 c Verified Emissions
Poland
Second Period Third Period

CLIMATE CHANGE - Influence of the European Emission Trading System and the German and Polish Electricity Market
24
2.1.3 Banking and borrowing
With the exception of the first phase, the EU ETS allows banking across phases. If regulated
entities have a surplus of allowances at the end of a trading phase, they can transfer them to the
next phase. From phase 2 to phase 3, 1’749.5 million allowances have been banked (EC, 2019b).
Borrowing of allowances is implicitly allowed but only within a phase. Each February 28th, freely
allocated allowances for the current year are allocated to installations (EC, 2018a, Article 11).
Allowances to cover previous year’s emissions must be surrendered by April 30th. Therefore, it is
possible to surrender allowances for the current year to cover emissions of the previous year.
2.1.4 Provisions for additional allowances supply
Offsets
To a certain extent, regulated entities can use credits from flexible mechanisms set up under the
Kyoto Protocol. First, the Clean Development Mechanism (CDM) allows industrialized countries
with a binding reduction target (Annex 1 countries) to use credits of mitigation projects in
developing countries for their compliance under the Kyoto Protocol. The generated credits are
called Certified Emission Reductions (CERs). Second, the Joint Implementation (JI) program
allowed Annex I countries to meet their target by surrendering credits of mitigation projects in
other industrialized countries. Those credits were generated by transforming an Assigned
Amount Units into an Emission Reduction Units (ERUs). Since 2013, ERUs and CERs cannot be
surrendered directly, but are exchanged for EUAs (EC, 2015a).
Until mid-2019, about 1’510 Mt of international credits have been imported accounting for over
90% of the allowed maximum number of credits to be used (EC, 2019a). To put this number into
context, verified emissions of stationary installations in the year 2018 summed up to about
1’682 MtCO2. Thus, offsets imported into the system are almost equal to one year of emissions.
In the fourth trading period, it is no longer allowed to use international credits (EC, 2019a).
Linking
EC (2018a) Article 25 allows linking the EU ETS to other trading system. In 2017, EU and
Switzerland signed an agreement to link their emission trading systems. After passing the
ratification in the Swiss parliament in 2019, the link became operational at the beginning of
2020.5
2.1.5 Market stability mechanisms
As a response to a high surplus of allowances in the market, the EU decided in 2015 to
implement a so-called Market Stability Reserve (MSR) starting in 2019 (EC, 2015b). It
established upper and lower bounds on the structural allowance surplus in the market, and
automatically transfers allowances to or releases allowances from the reserve when the surplus
is outside of this range. From 2023, the total volume of allowances in the reserve is limited to
5https://www.bafu.admin.ch/bafu/de/home/themen/klima/fachinformationen/klimapolitik/emissionshandel/verknuepfung-der-emissionshandelssysteme-schweiz-eu.html

CLIMATE CHANGE - Influence of the European Emission Trading System and the German and Polish Electricity Market
25
the previous year’s auction volume, putting in place a mechanism to automatically cancel
allowances leading to a reduction of the allowance cap (EC, 2018b).
The MSR started in 2019. In its first year, the MSR intake from the market was 397 million EUA,
which means short-term supply decreases. Whether long-term supply decreases, depends on
how many allowances are canceled out of the reserve in 2023. Bocklet et al. (2019) simulate
allowances supply as well as EUA prices under the MSR. They find a one-time cancelation of
about 2’000 million EUAs in 2023.6
2.1.6 Voluntary cancellation of allowances
Market participants have the option to voluntarily cancel allowances out of the system. So far,
only a minor amount of 0.3 million has been canceled under Article 12.4 (EC, 2019b). With the
new ETS Directive (EC, 2018a), member states are allowed to cancel allowances in the case of
closures of power plants due to additional national policies. So far, no member state has used
this provision. Germany has, however, announced they intend to cancel allowances in line with
their structured coal phase out.
2.2 Demand
This section describes the demand side features of the EU ETS.
2.2.1 Coverage
The geographical scope of the EU ETS covers all European member states plus Iceland,
Liechtenstein, and Norway. The regulatory scope of the EU ETS is determined by a capacity
threshold (20 MW) for combustion activities and the activity of industrial installations, i.e., apart
from the capacity threshold only installations carrying out certain activities are regulated.7 The
main greenhouse gas covered is CO2 but also N2O and PFCs emission are regulated.
Figure 3 shows verified emissions for combustion installations, other industries, and aviation.
With that scope, the EU ETS covered around 40% of the total emissions of the EU in 2017.
Combustion installations constitute the major source of emissions covered. The combustion
emissions mainly stem from electricity production. Out of the 1’098 Mt CO2 emission of
combustion installations 949 Mt CO2 have been reported to be emissions by the power sector
(EC, 2019a). This amounts to about 54% of total emissions in the EU ETS (including aviation).
Thus, electricity production is the major source of emissions covered under the EU ETS.
6 Further details on the MSR can be found in Appendix A 7 See EC (2018a) Annex 1 for a detailed list of activities covered.

CLIMATE CHANGE - Influence of the European Emission Trading System and the German and Polish Electricity Market
26
Figure 3: Verified Emissions under the EU ETS
Source: Own depiction based on EEA Emission Viewer. Comparison across trading periods is difficult, as the scope of the system was extended between 2012 and 2013.
2.2.2 Market participation
The EU ETS is designed as an open system, i.e., also non-regulated entities can hold and trade
allowances. Generally, anyone with an account in the Union registry can buy or sell allowances
(EC, 2018a, Art. 19). Trading can either take place on a bilateral basis or on exchange platforms.
EC (2015a) reports that in practice most trading takes place by regulated entities and financial
intermediaries (also see Betz and Schmidt, 2016; Betz and Cludius, 2020).
0
500
1’000
1’500
2’000
2’500
2008 2009 2010 2011 2012 2013 2014 2015 2016 2017 2018
Ve
rifi
ed
Em
issi
on
s [M
t C
O2
]
Combustion of fuels Other Installations Aviation
Second Period Third Period

CLIMATE CHANGE - Influence of the European Emission Trading System and the German and Polish Electricity Market
27
2.3 Transaction and market oversight rules
Table 3 summarizes transaction and market oversight rules. They are described in the following
Table 3: Overview transaction and market oversight rules
Feature EU ETS Design
Legal nature Property right/private property
Fiscal nature VAT rates: 22% in Poland and 19% in Germany
Market Places Mainly EEX for spot trading and auctions; ICE for future contracts Mostly futures, also spot and auctions and a bit of OTC
Transparency Yearly reporting
2.3.1 Legal nature of allowances
The EU ETS directive does not define the legal or fiscal nature of allowances at a European level
(EC, 2019a). In Article 3 of EC (2018a), an EUA is the “allowance to emit one ton of carbon
dioxide equivalent”. Reins et al. (2019) published a study commissioned by the European
Commission on the legal nature of allowances in selected member states including Germany and
Poland and conclude that the legal status of EUAs is not explicitly defined, neither in Poland nor
in Germany. They state that EUAs have a mixed character in the sense of having “(…) elements of
both property and administrative rights” (Reins et al., 2019, p. 56). As a consequence, EUAs fall
under a variety of regulations including civil and administrative law. With MiFID II, allowances
also fall under financial law and are treated as financial instruments even when traded on the
spot market.
2.3.2 Fiscal nature of allowances
Neither in Germany nor in Poland the value added tax (VAT) is applied to the initial allocation of
allowances, but in both countries, VAT applies to the transfer of allowances via the secondary
market (Reins et al., 2019). The respective VAT rates are 22% in Poland and 19% in Germany.
Both countries use a reverse-charge system in which the buyer is paying the VAT. In Poland,
selling allowances creates a taxable income with a tax rate of 19%. Acquired allowances are
treated as operational cost.
Concerning accounting, Poland treats EUAs as intangible assets that must be booked into the
accounting sheet at the date of acquisition with the acquisition price (Reins et al., 2019). In the
financial report, the EUA positions need to be published as a separate group under intangible
assets and legal rights. In Germany, EUAs are also treated as intangible assets and freely
allocated allowances are treated as revenue neutral, i.e., with a zero price.
2.3.3 Market places
Emission allowances can either be bought in auctions, traded in organized exchanges or directly
between buyers and sellers, referred to as “Over the counter” (OTC) trades.

CLIMATE CHANGE - Influence of the European Emission Trading System and the German and Polish Electricity Market
28
Auctions are held on exchange platforms. German and Polish allowances are auctioned via the
EEX platform. There are different trading types: auctioned, cleared forward contracts, spot
contracts, and OTC trades. Forward contracts, which are mostly traded at ICE, are the major
mean of exchange followed by auctions (DEHSt, 2019). Spot and OTC trades do not play a major
role. The average monthly trading volume is around 300 million EUAs with an increasing trend
in 2018. Provided that the total number of allowances at the end of 2018 was 1’654 Mt CO2 (EC,
2019b), we evaluate a monthly trading share of 18% as a rather liquid market.
2.3.4 Transparency regulation
The central information tool of the EU ETS is the EU Transaction Log (EUTL). It is used to
transfer EUAs between the different accounts. Liable installations have to register an Operator
Holding Account (OHA). The functioning of the EUTL, including which information becomes
public at which point in time, is regulated in EC (2013) under Article 109 and Annex XIV.8
For all accounts, which are the entities transferring allowances, most information (except
personal information such as mails and telephone numbers) is public. Most installation and
aircraft operator information are also public, including the name and address of the installation.
This information is updated every 24 hours. Allocations, verified and surrendered emissions by
installation are also public. Surrendered emissions are made public at April 1st in the year after
realization. Concerning supply, the total amount of offsets imported into the system is made
public. Transactions between accounts are made public with a three-year delay. These
transactions include the name of acquiring and transferring accounts as well as the account, the
amount of units transferred and the type of unit. Under Article 110 EC (2013), the unique
account identifier is confidential. Thus, it is difficult to track transactions back to accounts and
installations.
8 In the case of criminal activities, additional information can be provided under Article 110 to the relevant authorities.

CLIMATE CHANGE - Influence of the European Emission Trading System and the German and Polish Electricity Market
29
3 Assessing the EU ETS design and the quality of the
allowance price Figure 4 provides the monthly average of the EUA price. Provided that allowances trade mainly
takes place using forwards (see Section 2.3.3.), we show ICE forward prices. Short-term volatility
defined as the monthly standard deviation is measured on the right axis. Volatility also becomes
visible in the 95% confidence interval of monthly prices provided as the shaded area around the
mean.
Figure 4: Development of EUA prices
Source: Own depiction. ICE daily forward prices obtained via Quandl (www.quandl.com) and aggregated to monthly averages. The left axis shows the monthly average of EUA prices in blue. The shaded area depicts the 95% confidence interval. The monthly standard deviation of the EUA price (dotted line) is measured on the right axis.
In the figure we observe two pronounced price drops. One in 2008/09 and one in 2011/12.
Moreover, starting in 2017 we observe a significant increase of prices lasting until 2019.
Concerning volatility, we differentiate between long- and short-run volatility. The former
describes the price variation over the whole time horizon whereas the latter is measured as the
monthly variation. Long-term price variation over the whole time horizon was high ranging from
a minimum price of 3.0 to a maximum of 20.5 €/tCO2. Concerning short-term volatility, the EUA
price did not show an excessive within month variation. The average monthly standard
deviation between 2008 and 2019 was 0.5 €/tCO2 with a maximum of 1.9 €/tCO2 occurring at a
similar time as the price peak in 2019. Overall, we do not observe a large variation in the short-
term volatility. In the remainder of this report, the term volatility only refers to short-term
volatility, i.e., the monthly standard deviation of EUA prices.
In the following, we reflect on the design features’ impact on volatility, reflection of MAC, long-
term predictability, and the environmental effectiveness of the ETS. Fehler! Verweisquelle k
onnte nicht gefunden werden. gives an overview.

CLIMATE CHANGE - Influence of the European Emission Trading System and the German and Polish Electricity Market
30
3.1 Volatility
Figure 4 shows that there is a slight correlation of the short-term volatility with the level of the
EUA price. Yet generally volatility was rather modest and stable over time. This observation is in
line with the statement of interview partners: they do not perceive short-term volatility as a
problem given that they are used to deal with higher price variations in fuel markets.
Whereas it is difficult to draw firm conclusions regarding the impact of different design elements
on volatility in EU ETS, we can highlight some of our observations. The EU ETS has some
features that according to theory (Acworth et al., 2019) have a decreasing impact on volatility: a
rather high transparency, an open designed system, a large very liquid and open secondary
market due to its size, auctioning of permits for the largest group of emitters (electricity
generation) and the design as an open system that allows participation of non-regulated actors.
The relatively low price volatility of the EU ETS can be seen as a weak indicator, that these
features also empirically show a decreasing impact on volatility.
We observe a temporary, slight peak in volatility in January 2013, which marks the transition
between period two and three. It is therefore difficult to attribute this to the change in certain
design features since many changes took place at the same time (inclusion of new activities and
greenhouse gases, limitations to borrowing between two trading periods, transitioning to full
auctioning for electricity generation, etc.).
Figure 4 shows another slight increase of volatility in mid-2017 which is around the time the
European Commission published the first official information about the Total Number of
Allowances in Circulation used for the calculations of the Market Stability Reserve (EC, 2017).
Afterwards, volatility decreased again, but seems to stay at a somewhat higher level. It is too
early to assess whether this increase is caused by the existence of the MSR and whether this is a
permanent effect or rather a transitory phenomenon caused by adjusting trading positions in
the EUA market to adjust the new, partly unforeseen policy change.
3.2 Reflection of MAC
In theory, a high quality or undistorted allowance price equals the marginal abatement cost
(MAC) of all market participants. The price is determined by the marginal supplier of abatement.
In practice, experts agree that currently the marginal supplier is likely to be the electricity
sector. Thus, the EUA price is expected to follow the relative fuel prices, which determine the
short-run MAC in the electricity sector. Interview partners share the opinion that abatement in
the electricity sector is relatively cheap, and thus EUA prices are currently determined by the
fuel switch price as the cheapest abatement option. To reach more stringent reduction targets in
the future, abatement beyond pure fuel switching in the electricity sector is needed.
Consequently, more expensive abatement measures in other industries are likely to induce an
increase in EUA prices.
There is little empirical evidence on how the reflection of the MAC in the EUA price is supported
or hindered by certain design features. The EU ETS has some features that according to theory
(Acworth et al., 2019) have a positive impact on the reflection of MAC that are prevalent in the
EU ETS: Auctioning of allowances in the electricity sector and functioning of secondary markets
including spot as well as derivative trades. Until 2017, the price signal was mainly influenced by
the large surplus in allowances. Without allowance scarcity, abatement requirements become
CLIMATE CHANGE - Influence of the European Emission Trading System and the German and Polish Electricity Market
31
zero making it difficult to define and measure MAC. The introduction of ETS reforms (MSR,
tighter cap for the fourth trading period), and the prospect of market scarcity (decreasing
surplus) seem to have led to an increase in market prices and possible an improved price
formation reflecting MAC. Further research is needed to investigate if EUA prices are indeed
driven at least partly by fuel switching levels.
3.3 Long-term predictability
Figure 4 shows a considerable variation of the EUA price over time. To take rational investment
decisions and, thus, to reflect long-term MAC, market participants need to be able to forecast
these price developments. Many factors impact the EUA price including international energy
prices, factor cost, as well as regulatory changes in the EU ETS itself and in complementary
policies affecting allowances supply and demand. These include, e.g., renewable promotion and
energy efficiency policies (see e.g. Hintermann et al., 2016). Thus, there are large uncertainties
regarding the predictability of the carbon price signal. Also, the causes of past price changes
cannot be firmly determined. Yet, recent changes, such as the MSR or the more stringent
reduction path for the fourth trading period seem to have strengthened the confidence in the
system. Nevertheless, experts emphasize that there are still large uncertainties about future
developments of the EUA price, resulting in a wide spread set of predictions, which heavily
depend on the underlying assumptions on policy developments and regulations as well as on the
pace and extent of emissions reductions due to the uptake of renewable energies and the phase
out of electricity from coal. The range of price forecasts from market analysts is therefore quite
large (e.g. varying between 22 € and 65 € for 2020 and 27 € and 60 € for 2030).9
It seems that the EUA price is rather unpredictable and subject to large uncertainties about
future emission development and policy changes (e.g. changes in climate targets, climate and
energy policy instruments). This is despite the fact that the EU ETS has some features which
have a positive impact on predictability: Auctioning of permits in the electricity sector, a target
and a clear cap reduction path determined up to 2030, and a high transparency of the market.
The MSR has helped to stabilize the price since 2018, but the large range of price forecasts
indicates that the price is still rather unpredictable.
3.4 Environmental effectiveness of EU ETS
The environmental effectiveness of the EU ETS is affected, if the allowances supply is changed by
a design feature. Given the nature of a cap-and-trade system, only features that change the cap
impact the effectiveness of the system: First, the use of international credits increased
allowances supply in the EU ETS by more than 1’500 million units (at substantially lower prices
than even the low EUA price). Allowing offset usage therefore decreased the domestic
environmental effectiveness of the system.10 Second, by design, the MSR is likely to alter
allowances supply. All studies find that the MSR leads to one-time cancelation of allowances in
2023, i.e., the MSR is expected to increase the environmental effectiveness of the EU ETS.
9 Analysts poll collected by Carbon Pulse, January 10th, 2020. 10 In theory, global environmental effectiveness would stay the same as more emissions are reduced abroad. This holds true, however, only as long as offsets used fulfill the criteria of additionality, i.e., would not have occurred without the offsetting system and environmental integrity which has been doubted in the case of many CDM and JI-projects.

CLIMATE CHANGE - Influence of the European Emission Trading System and the German and Polish Electricity Market
32
4 Introduction to German and Polish electricity markets
4.1 Market design and structure
4.1.1 Market Design
Table 4 compares the design features of German and Polish electricity markets, which will be
described in the following sections in more detail. Both markets are fully liberalized in the sense
that the dispatch is organized through a wholesale market, consumers are free to choose their
suppliers, and investment decisions are decentralized, i.e., taken by generators rather than by
the government.
Table 4: Comparison German and Polish electricity market
Feature Germany Poland
Dispatch Self-dispatch Central dispatch
Wholesale Pricing Liberalized Liberalized
Retail Pricing (Electricity Demand)
Volumetric tariffs Compensation for indirect carbon cost (large electricity consumers)
Volumetric tariffs Price cap in retail market for small consumers Compensation for indirect carbon cost (large electricity consumers)
Investments Decentralized Decentralized
Additional regulations Partly coordinated with ETS RES CHP support Coal phase-out Nuclear phase-out Capacity Reserve Mechanisms
Partly coordinated with ETS RES CHP support Capacity market for new and existing capacities
Electricity mix Transition, with diverse fuel sources, increasing share of RE (approx. 40%)
Fossil intensive, rather coal based system, slowly increasing RE (less than 10%)
Age of generation fleet Fossil: high avg. fleet age RE: low to high fleet age
Fossil: high avg. fleet age RE: low fleet age
Asset ownership Private and state-owned Mainly state-owned
Market concentration CR5: 76% CR5: 77%
Besides regulatory authorities, the major market actors in both markets are the transmission
system operators (TSOs) as well as the major generation companies. Whereas Poland has a
single TSO, four TSOs are active in Germany for historical reasons. The Polish TSO takes a more
prominent role in the scheduling of power plants, as the Polish market is centrally dispatched by
the TSO.
In Germany, the five major generation companies (RWE, LEAG, EnBW, E-On/Uniper, Vattenfall)
possess a joint market share in conventional capacity of about 76%. Likewise, the five largest

CLIMATE CHANGE - Influence of the European Emission Trading System and the German and Polish Electricity Market
33
producers in Poland (PGE, ENEA, TAURON, ZE PAK, ENERGA) have a joint market share of 77%.
German companies are private and state-owned, whereas in Poland for three out of five firms
the Polish government owns the majority of shares.11
Both countries historically rely on a fossil-fuel based capacity mix. However, in contrast to
Poland, the German capacity mix is more diverse as it includes a large share of gas-fired power
plants and nuclear capacity. Furthermore, the German capacity mix shows a clear sign of the
energy transition with and increasing share of renewable energies. Installed fossil capacity in
Poland is significantly older than in Germany.
Retail markets in both countries are fully liberalized. However, recently Poland introduced a
price cap on electricity prices for small final consumers.
In both markets, investments are affected by numerous additional policies. Investment in
renewable capacity is mainly driven by renewable promotion schemes in both countries.
Investment in conventional capacities is likely to be influenced by promotion schemes for CHP.
In Poland, the capacity mechanism introduced in 2018 mainly grants income for coal and lignite
power plants and, thus, favors the extension of plants’ life-times as well as investments into new
carbon-intense capacities.
Plant closure is rather unregulated in Poland, but regulated in Germany. On the one hand,
German regulation mandates the closure of nuclear and coal power plants. On the other hand,
Germany has implemented several capacity reserve mechanisms, which might impact the
decisions of power plant closures.
4.1.2 Market Structure and Dynamics
Capacity mix, investments and age of plant fleet
Germany
Germany has a diverse capacity mix. At the end of 2017, renewable energies accounted for the
major share of installed capacity with 25% (56 GW) and 19% (42 GW) of wind and solar power,
respectively. The major source of fossil capacity is hard coal (14%, 30 GW) followed by natural
gas (13%, 28 GW) and lignite (11%, 23 GW). Nuclear and hydro generation both account for
about 5% of installed capacity (11 and 10 GW, respectively) (BMWI, 2019c).
11 In contrast to Poland where companies are owned by the central government, public ownership in Germany is at the sub-national, i.e., state-level.

CLIMATE CHANGE - Influence of the European Emission Trading System and the German and Polish Electricity Market
34
Figure 5: Installed capacities in Germany
Source: Own depiction based on BMWi (2019c)
Between 2008 and 2017 we observe a massive increase in renewable capacity. Nuclear capacity
decreased by about 10 GW whereas gas capacity increased by about 5 GW. Lignite and hard-coal
capacity remained constant. However, as we explain below, not all of the lignite plants are
regularly used for electricity generation. As of 2019, 2.7 GW of the 23 GW are not active anymore
and about to be closed. Thus, we observe some slight dis-investment in lignite power.
The age of German conventional power plants varies with technologies. Hydro power plants are
on average the oldest plants with a weighted average of about 58 years.12 However, these power
plants are known to have a long lifetime. Both, nuclear and lignite power plants have an average
age of about 33 years followed by hard coal (30 years) and natural gas-fired plants (22 years).
Renewable plants are relatively young with an average age of 11 and 8 years for wind and solar
power generators, respectively.
Figure 7 shows the investments in conventional power technologies that are currently planned
in Germany and Poland. In Germany, BNetzA (2019a) reports that the Datteln power plant
installs an additional 1 GW of hard-coal becoming operational in 2020. Furthermore, additional
1.1 GW of gas-fired power plants will become active between 2019 and 2022. No lignite
investments are planned.
12 Own calculations based on the power plant list provided by the BnetzA. We compute the capacity weighted average of power plants still running in 2019.
0
50
100
150
200
250
2008 2009 2010 2011 2012 2013 2014 2015 2016 2017
Inst
alle
d C
apac
ity
[GW
]
Hydro Nuclear Lignite Hard Coal Gas Wind Solar Other

CLIMATE CHANGE - Influence of the European Emission Trading System and the German and Polish Electricity Market
35
Poland
The Polish capacity mix is dominated by lignite and hard coal. In 2018, total capacity amounted
to 43.3 GW of which 54% (20%) have been lignite (hard coal) power plants (see Figure 6).
Except for the addition of renewable capacities (6.6 GW in 2018), the capacity mix was stable
over time. With 2.3 GW in 2018, natural gas-fired power plants only play a minor role.
Figure 6: Installed capacities in Poland
Sources: Own depiction based on PSE (2018)
Between 2008 and 2017 we observe investments into renewable capacities. Also, about 1.5 GW
of gas-fired capacities has been installed in the same period. Hydro, hard coal, and lignite
capacities remained almost constant over time.
Conventional plants in Poland are rather old. On average the oldest technologies are hard coal-
fired power plants with an average age of 48 years.13 This is closely followed by lignite and
hydro plants with and average age of 45 and 46 years. As shown in Figure 6, renewable capacity
was added from the year 2008 onwards, implying that the age of the renewable fleet is much
lower. The high average age of the conventional power plants implies a high investment demand
in the near future. In fact, RAP (2018) reports that more than 50% of installed capacity will be
retired between 2020 and 2035 (also see NIK, 2015).
13 Own calculations based on the power plant list available on: https://pl.wikipedia.org/wiki/Lista_elektrowni_w_Polsce. We searched for the missing dates of installations and calculated the capacity weighted average age excluding plants closed until 2019.
0
5
10
15
20
25
30
35
40
45
50
2008 2009 2010 2011 2012 2013 2014 2015 2016 2017 2018
Inst
alle
d C
apac
ity
[GW
]
Hydro Lignite Hard Coal Gas Renewable
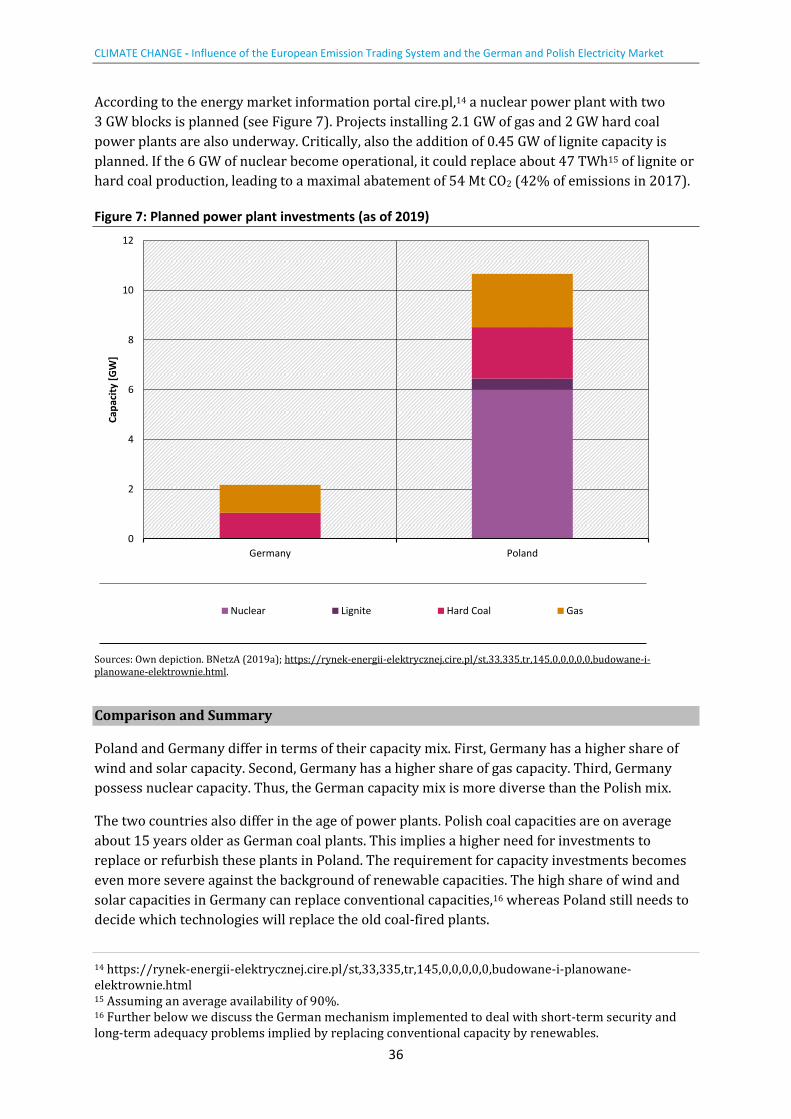
CLIMATE CHANGE - Influence of the European Emission Trading System and the German and Polish Electricity Market
36
According to the energy market information portal cire.pl,14 a nuclear power plant with two
3 GW blocks is planned (see Figure 7). Projects installing 2.1 GW of gas and 2 GW hard coal
power plants are also underway. Critically, also the addition of 0.45 GW of lignite capacity is
planned. If the 6 GW of nuclear become operational, it could replace about 47 TWh15 of lignite or
hard coal production, leading to a maximal abatement of 54 Mt CO2 (42% of emissions in 2017).
Figure 7: Planned power plant investments (as of 2019)
Sources: Own depiction. BNetzA (2019a); https://rynek-energii-elektrycznej.cire.pl/st,33,335,tr,145,0,0,0,0,0,budowane-i-planowane-elektrownie.html.
Comparison and Summary
Poland and Germany differ in terms of their capacity mix. First, Germany has a higher share of
wind and solar capacity. Second, Germany has a higher share of gas capacity. Third, Germany
possess nuclear capacity. Thus, the German capacity mix is more diverse than the Polish mix.
The two countries also differ in the age of power plants. Polish coal capacities are on average
about 15 years older as German coal plants. This implies a higher need for investments to
replace or refurbish these plants in Poland. The requirement for capacity investments becomes
even more severe against the background of renewable capacities. The high share of wind and
solar capacities in Germany can replace conventional capacities,16 whereas Poland still needs to
decide which technologies will replace the old coal-fired plants.
14 https://rynek-energii-elektrycznej.cire.pl/st,33,335,tr,145,0,0,0,0,0,budowane-i-planowane-elektrownie.html 15 Assuming an average availability of 90%. 16 Further below we discuss the German mechanism implemented to deal with short-term security and long-term adequacy problems implied by replacing conventional capacity by renewables.
0
2
4
6
8
10
12
Germany Poland
Cap
acit
y [G
W]
Nuclear Lignite Hard Coal Gas

CLIMATE CHANGE - Influence of the European Emission Trading System and the German and Polish Electricity Market
37
Ownership and Market Concentration
Germany
Market concentration in terms of installed conventional generation capacity is rather high in
Germany (see Figure 8). The concentration ratio17 (CR) of the five (three) biggest suppliers is
76% (63%) with RWE being the largest supplier. However, one has to be aware that this is the
concentration measure in terms of conventional capacity and ignores that 44% of total installed
capacity come from wind and solar power. According to expert opinions, the German day-ahead
market is perceived as very competitive. One reason is the large number of renewable energy
suppliers which recently entered the market.18
Figure 8: German Market Shares in Conventional Generation Capacity (2018)
Source: BMWi (2018), BNetzA (2019)
Table 5 shows the ownership structure of biggest suppliers in the market. Most of these
companies are privately owned. The major exception is ENBW which is owned 46.74% by the
state of Baden-Württemberg and municipalities in Baden-Württemberg, respectively. Vattenfall
is fully state-owned but not by the German but the Swedish government.
17 The concentration ratio is defined as the sum of the market share of the biggest suppliers. 18 In the case of balancing markets, the perception is somewhat different. While representatives of large companies also tend to perceive it as competitive, experts from smaller companies state that balancing markets are dominated by a few large players. Especially renewable producers still seem to have a disadvantage on balancing markets due to the definition of products, e.g., symmetric primary reserve.
32%
7%
12%9%
16%
24%
RWE Vattenfall EnBW E-ON/Uniper LEAG Other

CLIMATE CHANGE - Influence of the European Emission Trading System and the German and Polish Electricity Market
38
Table 5: Ownership structure of Germany electricity producers
Government Share [%] Other Investors’ Share [%]
RWE 8 92
LEAG 0 100
ENBW 94.5 5.5
E-ON/Uniper 0 100
Vattenfall 0 100
Sources: RWE: : www.group.rwe/en/investor-relations/the-rwe-share/shareholder-structure; LEAG:
www.leag.de/de/unternehmen/; ENBW: https://www.enbw.com/unternehmen/investoren/aktie/aktionaersstruktur.html; E-
ON/Uniper: https://www.eon.com/de/investor-relations/aktie/aktionaersstruktur.html Swedish government owns 100% of
Vattenfall.
Poland
In terms of capacity, the Polish market shows a high market concentration (see Figure 9). The
concentration ratio of the five (three) biggest producers (CR5, CR3) was about 77% (69%) in
2018. The PGE group is the largest supplier owning 43% of total Polish generation capacity.
Polish wholesale electricity markets are not perceived as competitive and many experts argue,
that large companies exercise market power. Next to the three largest electricity production
companies (PGE, Tauron, Enea), also the biggest coal production company (PGG) is perceived to
have a large impact on markets. Thus, according to some interview partners, this leads to a price
distortion, i.e., wholesale market prices which are above marginal cost of the marginal producer
in order to increase the margin of generators.

CLIMATE CHANGE - Influence of the European Emission Trading System and the German and Polish Electricity Market
39
Figure 9: Polish Market Shares in Conventional Generation Capacity (2018)
Sources: PSE (2018), Energy Regulation Office (2019).
Concerning ownership, most generators in Poland are state-owned. With the exception of
Tauron and ZE PAK, the government share in the total amount of company shares is over 50%
for the biggest companies (see Table 6).
Table 6: Ownership structure of Polish electricity producers
Government Share [%] Other Investors’ Share [%]
PGE 57.4 42.6
ENEA 51.5 48.5
Tauron 30.1 69.9
ZE PAK 0 100
Energa 51.5 48.5
Sources: www.gkpge.pl/investor-relations/Shares/Shareholders; https://ir.enea.pl/en/ir/investor-relations/shares-and-shareholders/shareholders-structure; https://en.tauron.pl/tauron/investor-relations/Pages/shareholder-structure.aspx; http://zak.grupaazoty.com/en/spolka/struktura.html; https://ir.energa.pl/en/ir/investor-relations-web-site/for-shareholders/shareholding-structure
Comparison and Summary
Both markets show a high market concentration in terms of conventional generation capacity. In
Germany, however, the share of renewable generation is much higher. Therefore, the exertion of
market power in the wholesale market is less likely. According to Polish interview partners,
43%
15%
11%
5%
3%
23%
PGE Polska Grupa Energetyczna SA ENEA SA TAURON Polska Energia SA ZE PAK SA ENERGA SA Other

CLIMATE CHANGE - Influence of the European Emission Trading System and the German and Polish Electricity Market
40
another source of market power occurs along the value-chain as the major Polish coal-supplier
PGG is delivering to all major suppliers and possible manipulates upstream prices.
Concerning the ownership structure, the two countries differ. Whereas German companies show
a mix between private and public owners, Polish companies are mainly state-owned.
Electricity generation and demand
Germany
The German generation mix (see Figure 10) mimics the diversity of the capacity mix. In 2019,
wind was the major supplier of electricity (21%, 126 TWh) for the first time ever. Lignite
production accounted for 19% (114 TWh) and hard coal for 9% (57 TWh). Natural gas-fired
plants provided 15% (91 TWh) and nuclear 12 % (75 TWh). With 8% (47 TWh) of solar
production, wind and solar production accounted for 29% of total electricity generation.
Figure 10: German generation mix
Source: BMWi (2019c), for 2019 preliminary numbers from AG Energiebilanzen (2020) are used.
Looking at the development of generation over time, the major visible trend is the large increase
of renewable generation. The share of wind and solar increased from 15 to 29%. Moreover, we
observe that the coal share decreased from about 43% to 28% in 2019. The major decline
occurred in 2019. This decline has mostly been achieved in hard-coal generation which
decreased by 54% since 2008. Lignite decreased by 24%. Gas and hydro production remain
constant over time, while nuclear generation decreased by about 50%.
Electricity demand in Germany was rather stable over time with a level of around 600 TWh (see
Figure 10). The only exception was the year of the financial crisis 2009.
0
100
200
300
400
500
600
700
2008 2009 2010 2011 2012 2013 2014 2015 2016 2017 2018 2019
An
nu
al G
en
era
tio
n [
TWh
]
Hydro Nuclear Other Lignite Hard Coal Gas Wind Solar Load
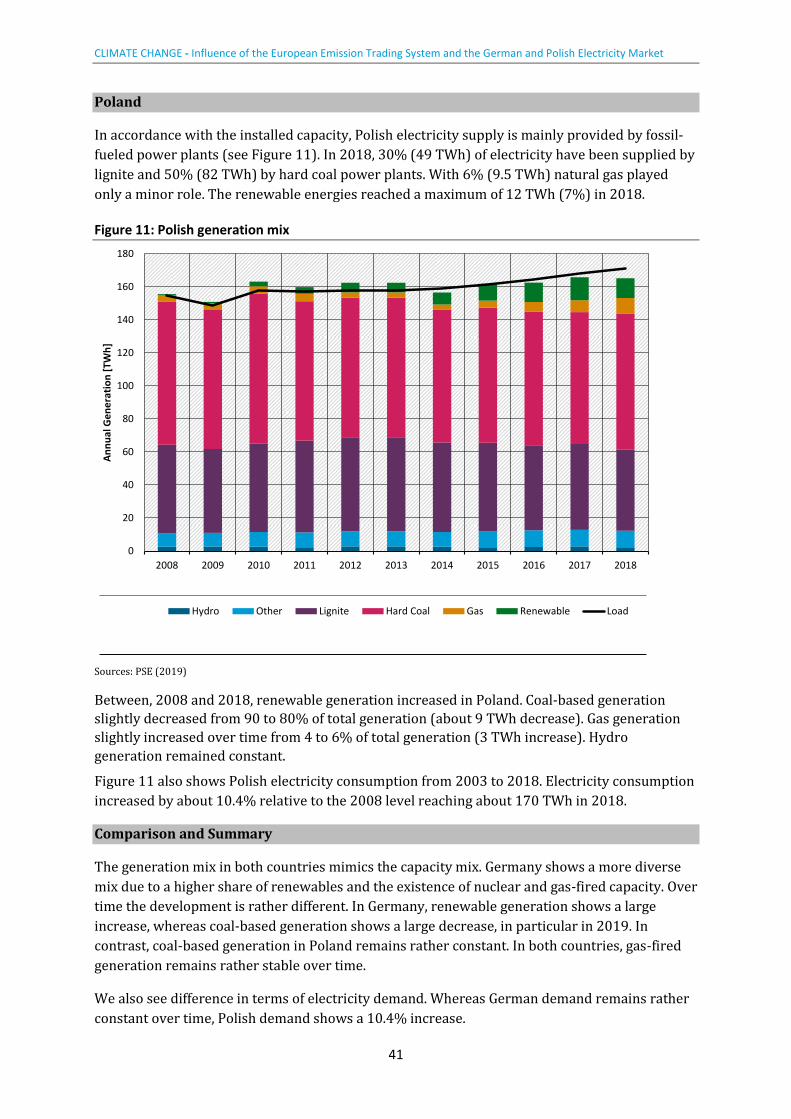
CLIMATE CHANGE - Influence of the European Emission Trading System and the German and Polish Electricity Market
41
Poland
In accordance with the installed capacity, Polish electricity supply is mainly provided by fossil-
fueled power plants (see Figure 11). In 2018, 30% (49 TWh) of electricity have been supplied by
lignite and 50% (82 TWh) by hard coal power plants. With 6% (9.5 TWh) natural gas played
only a minor role. The renewable energies reached a maximum of 12 TWh (7%) in 2018.
Figure 11: Polish generation mix
Sources: PSE (2019)
Between, 2008 and 2018, renewable generation increased in Poland. Coal-based generation
slightly decreased from 90 to 80% of total generation (about 9 TWh decrease). Gas generation
slightly increased over time from 4 to 6% of total generation (3 TWh increase). Hydro
generation remained constant.
Figure 11 also shows Polish electricity consumption from 2003 to 2018. Electricity consumption
increased by about 10.4% relative to the 2008 level reaching about 170 TWh in 2018.
Comparison and Summary
The generation mix in both countries mimics the capacity mix. Germany shows a more diverse
mix due to a higher share of renewables and the existence of nuclear and gas-fired capacity. Over
time the development is rather different. In Germany, renewable generation shows a large
increase, whereas coal-based generation shows a large decrease, in particular in 2019. In
contrast, coal-based generation in Poland remains rather constant. In both countries, gas-fired
generation remains rather stable over time.
We also see difference in terms of electricity demand. Whereas German demand remains rather
constant over time, Polish demand shows a 10.4% increase.
0
20
40
60
80
100
120
140
160
180
2008 2009 2010 2011 2012 2013 2014 2015 2016 2017 2018
An
nu
al G
en
era
tio
n [
TWh
]
Hydro Other Lignite Hard Coal Gas Renewable Load

CLIMATE CHANGE - Influence of the European Emission Trading System and the German and Polish Electricity Market
42
Cross-border electricity trade
Germany
Between the 2008 and 2019, total German electricity production increased although nuclear
capacity was already partly phased-out. This was mainly due to the increase in renewable
generation. As demand was relatively stable over time, German net-exports increased (see
Figure 12). In 2018 (2019) German net-exports made up about 9% (6%) of total demand.
In 2018, German exports mainly flow to the Netherlands (20 TWh), Austria (13 TWh), and
Switzerland (12 TWh). On an annual basis, electricity was only net-imported from France (8
TWh) and Sweden (1 TWh) (BMWi, 2019c).
Figure 12: Annual net-export of electricity
Sources: Poland: PSE (2019); Germany: BMWi (2019c), for 2019: preliminary numbers from AG Energiebilanzen (2020)
Poland
Polish production slightly increased between 2008 and 2018. This increase was, however, less
than the increase in demand (see Figure 11). Therefore, annual net-exports decreased (see
Figure 12). Consequently, Poland turned from a net-exporter in the years 2008 to 2013 to a net-
importer in the years after. With about 3%, imports in 2018 only covered a small fraction of
demand.
In 2018, the major part of imports came from Germany (7 TWh) and Sweden (3 TWh) followed
by Ukraine and Lithuania (1 TWh each). Polish exports flow to the Czech Republic (3.1 TWh) and
Slovakia (3.1 TWh) (PSE, 2019).
-10
0
10
20
30
40
50
60
2008 2009 2010 2011 2012 2013 2014 2015 2016 2017 2018 2019
An
nu
al n
et-
exp
ort
[TW
h]
Poland Germany

CLIMATE CHANGE - Influence of the European Emission Trading System and the German and Polish Electricity Market
43
Comparison and Summary
Both countries are well connected to their neighboring countries and actively engage in
electricity trade. In absolute values, Germany shows higher trade volumes which is likely due to
the large size of the German electricity market as well as the very central location of Germany in
Europe. German exports show an increasing trend by 2017, with a decrease both in 2018 and
2019. This might be explained by the increasing amount of low marginal cost renewable
generation and the low EUA price as well as low coal prices compared to gas prices making
electricity from German hard-coal power plants cheaper than from gas power plants abroad
(Agora 2015). In contrast, Poland turned from a net exporter to a net importer. One reason for
this might be the increase of renewable in neighboring countries that decrease the import price
leading to higher imports from Germany and Sweden.
4.2 Wholesale markets and dispatch19
Germany
The German electricity market is a self-dispatched market. Beside future and over-the-counter
(OTC) trade, the energy only market in Germany is sub-divided into two major markets as
shown by Figure 13: day-ahead (DAM) and intraday market (IDM). For both markets, the EPEX
trading platform is the major market place. With a volume of about 225 TWh the German day-
ahead market has a market size of about 38% of total electricity demand (EPEX, 2019). The
intraday market gained more popularity in recent years and reached a high of 50 TWh in 2018.
Ancillary services are procured by the four transmission systems operators (TSO).20
Figure 13: Timeline German electricity market
Sources: Own depiction.
The German day-ahead market is organized as a single auction with a uniform price. The market
is cleared at 12:00 the day before delivery (D-1). Market participants can bid supply curves
(with up to 256 steps) for the contract to deliver electricity for one hour of the preceding day.21
The upper (lower) price limit is 3000 (-500) €/MWh.
The intraday market functions in two sub-stages: an opening auction followed by continuous
trade. The opening auction takes places at 15:00 the day before delivery. Market participants bid
supply curves for 15 minute contracts to be delivered at the following day. The upper/lower
price bound amounts to +/- 3’000 €/MWh. The auction is cleared with a single uniform price. In
the continuous intraday stage only single price/quantity bids are allowed. The contract length
can be either 15 minutes or one hour. Compared to the intraday auction, price bounds are
increased to +/- 10’000 €/MWh and energy can be traded until 30 minutes before delivery.22
19 A more detailed discussion of German and Polish electricity market designs can be found in Appendix B. 20 Amprion, Tennet TSO, TransnetBW, and 50Hertz Transmission. 21 It also possible to trade block contracts. 22 Within a control zone, trade is possible until 5 minutes before delivery time.

CLIMATE CHANGE - Influence of the European Emission Trading System and the German and Polish Electricity Market
44
Poland
The Polish electricity market is a centrally dispatched market. One day before delivery time
market participants have to inform the transmission system operator (Polskie Sieci
Elektroenergetyczne, TSE) about their contract position and the corresponding production
schedule for the next day (see Figure 14). Based on these positions and new information such as
state of the transmission system and updated demand and renewable forecasts, TSE determines
the final production schedule using a cost-minimization algorithm. The adjustment of the
schedules is based on the real-time market (RTM),23 in which generators bid their capacity.
The Polish electricity market consists of different markets: In the day-ahead market, participants
trade energy, i.e., electricity generated. Besides the trade over the Polish Power Exchange
(Towarowa Giełda Energii, TGE), over-the-counter (OTC) trade is possible. In the RTM,
participants trade capacity available to be used for re-scheduling during the scheduling process
of TSE. Besides energy, TSE procures capacity for ancillary services in bilateral contracts with
suppliers (Siewierski, 2015).
The majority of trades take place over day-ahead markets (DAM) and OTC. Intra-day markets
(IDM) do not play a significant role in the Polish market (TGE, 2018). The major reason for their
very minor market share is the existence of the RTM. As the RTM already starts scheduling of
power plants before the IDM closes, there is simply no role for the IDM (also see Siewierski,
2015).
Figure 14: Timeline Polish electricity market
Sources: Own depiction.
The Polish DAM functions in different sub-markets (TGE, 2019a). Two markets allow the trade
of hourly electricity delivery for the next day. In market one (DAM I) market participants submit
single price-quantity bids, in market two (DAM II) market participants are able to submit supply
and demand curves with a maximum of 128 pricing steps. In both markets, prices have to lie in
the range of -500 to 3000 €. The market operator, TGE, determines a single price in both
markets. Provided the settlement of contracts, market participants determine the final operating
schedule until 14:50. This final day-ahead schedule is communicated to the PSE at 14:30 one day
before delivery. Market results become public at 17:00.
On the intraday market, hourly contracts are traded (TGE, 2019b). The price range lies between
-9999 and 9999 €/MWh. Trading starts shortly after the closure of DAM I at 11:30 at the day
before delivery. Trading at the day before delivery is possible until 15:30. Contracts with
delivery before 11:00 cannot be further traded implying a rather long gate closure up to 13.5
23 The Polish real-time market is often called “balancing market”. We use the term “real-time” market in order to avoid confusion with market for ancillary services.

CLIMATE CHANGE - Influence of the European Emission Trading System and the German and Polish Electricity Market
45
hours before delivery. At the day of delivery, gate closure is 2.5 hours before delivery for
contracts until 18:00. All remaining contracts have to be settled until 15:30.
In the RTM all large generating units are required to bid their entire capacity together with
prices. The market opens at 9:00 the day before delivery and closes at 14:30 (Siewierski, 2015).
Besides large generating units which are required to participate in the RTM, flexible loads are
allowed to bid load reduction. For load reduction bids, the market also opens at 9:30 but closes
one and a half hours before delivery time. The latest gate closure is at 21:30 at the delivery day.
PSE uses RTM bids to balance unforeseen deviation from the day-ahead production schedule. All
units are rewarded a uniform price for the delivery of energy. The same price is charged if units
are not able to deliver the energy contracted. Therefore, the RTM is revenue neutral for the PSE.
The combination of a DAM and an RTM used for balancing offers the possibility of market
manipulation. For example, the generators could withdraw capacity from the DAM in order to
increase prices in the RTM. In order to avoid such behavior, PSE is allowed to introduce
differentiated prices in the case of excessively high balancing quantities or prices.
Comparison and Summary
In both countries, a competitive wholesale market exists. Whereas in Germany, bidding in the
day-ahead market is voluntary, large Polish plants have to bid in the market. Nevertheless, the
share of electricity traded in the German day-ahead market is steadily increasing. In both
markets, price caps are high enough to allow the reflection of carbon prices in the wholesale
market price.
The major difference between the two markets concerns the intra-day market and the
dispatching and scheduling procedure. Germany has a self-dispatched market in which plant
owners decide about the dispatch. Information updates, e.g. new information about renewable
production are incorporated using the intra-day market. In contrast, Poland relies on a centrally
dispatched market in which the TSO determines the cost-minimal dispatch. In such a market,
new information is partly incorporated by the scheduling procedure of the TSO. In terms of
responses to carbon prices, we do not expect major differences between a central and self-
dispatched system. Both systems should implement the least-cost dispatch and therefore fully
incorporate carbon costs.
4.3 (Dis)investment and interacting policies
4.3.1 Regulation of generation investments and disinvestments (closures)
Germany
Besides the promotion policies incentivizing investments into certain technologies that are
described below, investments are not regulated.
Power plant closures mandate notification of the responsible Transmission System Operator
(TSO) as well as the Bundesnetzagentur (BNetzA) at least 12 months before the closure. The
closure of German power plants has been affected by two major policies. First, reserve
mechanisms avoiding the closure of power plants required to maintain system stability; second,
nuclear phase-out policies. Moreover, the German coal-phase out, which should be finalized by
2038 at the latest and sets dates for specific plants, will affect closures in the future.

CLIMATE CHANGE - Influence of the European Emission Trading System and the German and Polish Electricity Market
46
Reserve Mechanisms
Reserve mechanisms have been implemented against the background of an increasing share of
intermittent renewable energy capacity, in particular wind and solar power, as well as the
nuclear phase-out. To be able to cope with the situation of longer periods without wind and
solar production and also with grid problems due to short-term fluctuations of renewables,
some back-up capacity is needed. The German Energiewirtschaftsgesetz (EnWG) implements
three different reserve mechanisms: Sicherheitsbereitschaft, Netzreserve (grid reserve), and
Kapazitätsreserve (capacity reserve).
Sicherheitsbereitschaft (§ 13g EnWG) mandates that lignite plants, that are about to be closed
under the coal phase out, remain operational. For four years after the closure, plants have to be
able to generate electricity within 240 hours after a notification by the TSO, which is allowed to
activate these plants in case of severe system stability problems. 2.7 GW of lignite capacity are
currently in the Sicherheitsbereitschaft (BNetzA, 2019).24
Netzrerserve (§ 13g EnWG) is the procurement of capacity for additional redispatching measures
necessary due to high amounts of renewable generation. In particular in winter months, German
wind production is rather high leading to grid congestion. Thus, TSOs can classify power plants
that are shut-down as relevant for system stability. These power plants are not allowed to
participate in the electricity market but can be used by TSOs to maintain grid stability. In
particular flexible generation technologies are used for the Netzreserve which is implied by the
goal of balancing short-term deviations (BNetzA, 2019).
Kapazitätsreserve (§ 13e EnWG) is a new mechanism requiring TSOs to procure capacity for
winter months from 2020/2021 onwards. Currently the total amount is set to 2 GW. Power
plants in the Kapazitätsreserve are not allowed to participate in the electricity market. To be
eligible for the Kapazitätsreserve, power plants have to be able to go online within 12 hours. Due
to technical restrictions, this rules out most coal power plants. Therefore, the first auction
results show that mainly gas-fired plants are accepted for the Kapazitätsreserve.
It is important to note, that none of these mechanisms applies for power plants that are in the
market. All of these mechanisms set capacity aside to activate it in times of extreme market
situations. Therefore, they are not likely to affect investment decisions at least not for those
plants active in the daily energy markets. As these mechanisms however grant income to plants
outside the energy only market, they might incentivize withdrawal of capacity from the energy
only market. As Netz- and Kapazitätsreserve require a certain flexibility, the exit of coal-fired,
and in particular lignite, plants is not very likely to be incentivized.
Nuclear phase-out
After the Fukushima accident in March 2011, the German government decided to phase-out
nuclear until 2022. The nuclear phase-out is regulated in the Atomgesetz („Gesetz über die
friedliche Verwendung der Kernenergie und den Schutz gegen ihre Gefahren“) and specifies
which plant will be closed at which time. Since 2011 already 11.1 MW of nuclear capacity were
shut down. Until December 2022, another 10.2 MW are planned to close (AtG 2017; BMU, 2019).
24 Power plants in Sicherheitsbereitschaft receive the income they would have earned in the energy market (§14g (5) EnWG)

CLIMATE CHANGE - Influence of the European Emission Trading System and the German and Polish Electricity Market
47
Coal phase-out
The commission on Growth, Structural Change and Employment (“Kommission für Wachstum,
Strukturwandel und Beschäftigung,” WSB) the so-called “Kohlekommission” was created by the
government in 2018 to plan the German coal phase-out and recommend measures on social and
structural development and financing of States, where lignite is extracted. The commission
published its report in 2019 (BMWi, 2019b), recommending to shut down all coal capacity until
the year 2038 with an option to already phase-out until 2035. In the case of lignite, the
commission recommends to negotiate individual solutions, in the case of hard coal,
decommissioning auctions are proposed. The “Coal phase-out” law (adopted by the German
government in January 2019) is still in parliamentary process while writing this report.
Poland
There are no official regulations hindering investments or closures of power plants. Currently,
the Polish government however plans to build new nuclear power plants as one pillar of their
energy transition to a more carbon neutral electricity generation. Yet, according to experts, there
is a large uncertainty whether these plans will actually be implemented. Some believe that there
is a fifty-fifty chance that nuclear plants will be built as public opinion against nuclear power is
not as strong in Poland as in other countries. However, others believe that there is only a very
small chance of nuclear power plants being built, as (i) currently no one is able to plan and build
nuclear power plants within the promised time frame and at reasonable cost or (ii) the Polish
government is not able to provide the necessary regulatory framework.
Comparison and Summary
Both countries do implement policies specifically regulating investments. Investment decisions
are decentralized but the government might influence them indirectly through support
mechanisms as capacity markets and promotion policies described below.
In contrast to Poland, Germany has some reserve mechanism aiming to secure short-term
stability and long-term adequacy of the electricity system. These mechanisms are not likely to
impact the incentive to invest into new power plants. They also do not directly impact the
wholesale electricity market as plants in the reserve are not allowed to participate in the energy
(or balancing) market. The mechanisms, however, do grant income to plants leaving the energy
market and therefore might influence the decisions for power plant closure. As the eligibility
criterion of the mechanisms is flexibility, lignite power plants are unlikely to be affected by this.
4.3.2 Capacity markets
Germany
Except the above described reserve mechanisms, Germany does not have a capacity market. As
already mentioned, these reserve mechanisms are different from other capacity mechanisms in
that they only provide income for plants not active in the energy market.
Poland
In 2018, Poland introduced a capacity market aiming to incentivize the construction of new
power plants as well as modernization and longer operation of exiting power plants (SK&S Legal
2018c). Existing and new power plants as well as demand side response technologies are
CLIMATE CHANGE - Influence of the European Emission Trading System and the German and Polish Electricity Market
48
eligible to participate in the capacity market. However, renewable power generators are
excluded as long as they receive income under the renewable promotion scheme. In contrast,
power plants receiving investment aid under the 10c article of the EU ETS, i.e., free allocation for
the modernization of plants, are not excluded but income out of the capacity mechanism is
reduced avoiding overcompensation (EC, 2018c). Capacity remunerations are guaranteed for the
period of up to 15 years delivery to new plants, up to 5 years for modernized plants, and 1 year
for existing plants.
The Polish capacity mechanism neither includes specific rules on the efficiency of power plants
participating in the market nor differentiated between new and existing technologies in terms of
income awarded. There is the danger that the mechanism provides income to existing coal
plants or even incentivizes the construction of new carbon-intense plants. In fact, first auction
results grant income of about 55 €/kW mainly to existing coal and lignite power plants.25
Comparison and Summary
In contrast to Poland, no capacity market exists in Germany. The Polish market does not
differentiate neither between newly installed and existing power plants nor between efficient
and less-carbon intense or inefficient plants.
4.3.3 Promotion policies
Two major policies are in place in both countries: Renewable energy and combined heat and
power (CHP) promotion. The promotion of renewable energies is part of the EU’s strategy of
GHG mitigation. CHP promotion is accounted for in the EU ETS legislation as producers receive
free allowances for heat delivered to consumers outside of the EU ETS (EC, 2018a, §10a).
Besides these European rules, promotion policies are determined on a national basis.
Germany
Renewable Energy Promotion
Germany is known for its extensive renewable support over the last few years, and the
Renewable Energy Sources Act (EEG) was revised many times implementing different
renewable targets and support schemes. Currently, the goal of the revised EEG (2017) is to
increase the share of electricity generated from renewable energy sources to 40-45% by 2025;
55-60% by 2035 and at least 80% by 2050.
After many years of extensive renewable energy support, the current discussion in Germany
concerns the market integration of renewable energies. Experts agree that due to lower
production cost and currently higher electricity prices, the situation for renewables on the
market is improving. Thus, the current expectation of increasing EUA prices, also impact
profitability and investment incentives for renewable energies. Yet, the assessment whether and
to what extent renewables still need support differs among experts. Moreover, experts mention
that mainly in the case of onshore wind, it is not necessarily the missing support that prevents a
further deployment but local opposition and restrictive distance regulations.
25 See https://www.pse.pl/aukcja-glowna-na-rok-dostaw-2021 for auction results and http://www.caneurope.org/publications/press-releases/1686-first-auction-of-polish-capacity-mechanisms-sinks-billions-of-euros-into-subsidising-the-country-s-addiction-to-coal for analysis of preliminary auctions.

CLIMATE CHANGE - Influence of the European Emission Trading System and the German and Polish Electricity Market
49
Combined heat and power (CHP) Promotion
The support for CHP plants is regulated under the combined heat and power act (“KWK-
Gesetz”). Revised versions of the Act entered into force in 2016 and 2017 (KWKG 2017; BMWi,
2019a). Revisions included a doubling of the funding for CHP plants to 1.5 bn € per year. The
target is to increase power from CHP plants to 110 (120) TWh until the year 2020 (2025).
Support is granted for investments in highly efficient, low-carbon, i.e., gas-fired, installations as a
measure to reach climate targets.
Poland
Renewable Energy Promotion
Currently, Poland has implemented three main renewable support mechanisms (SK&S Legal
2019): Auctions, certificate-based incentive schemes, and feed-in tariffs. In 2018 an amount of
around 3.3 billion € (14.2 billion zloty) has been allocated to support 56.2 TWh of renewable
energy (SK&S Legal 2019). In the case of onshore wind, also the 10H distance requirement needs
to be mentioned. This requires a minimum distance of 10 times turbine height between a new
onshore park and households and mixed-use buildings (Aures II, 2019). This so-called “Distance
Act” also applies to existing plants. Thus, possible upgrades are ruled out.
In Poland, the situation for renewable energies was not perceived as stable in the past years,
resulting in lower renewable shares compared to Germany. Recently, the situation has been
changing due to high carbon and wholesale market prices, and more support. In the case of
onshore wind, the situation is similar to Germany: there is large local opposition and restrictive
distance regulations, which according to experts, makes deployment almost impossible.
CHP Promotion
From 2007 to 2018 a support scheme for CHP plants was active, which was based on different
types of certificates, depending on the technology (so-called “red”, “yellow” and “violet”
certificates). Since 2019 a new system is in place, promoting only electricity from high-efficiency
CHP, i.e., with emissions lower than 450kg CO2 per MWh of produced electricity. Four different
types of incentive schemes are in place, depending on the age and size of the plant (SK&S Legal,
2018). The budget for all incentives schemes is expected to amount to 538 million € (PLN 2.33
billion) per year (2019-2047) for new and substantially modernized CHP Units; and 48 million €
(PLN 208 million) per year (2019-2032) for the existing CHP Units.
Experts mention that CHP support is closely related to air quality issues: Many cities have coal-
based district heating systems, based on CHP or heat boilers. In rural areas, most houses have
their private heating system, where they burn everything from coal and wood to domestic waste.
This results in poor air quality and health problems. Thus, the support of CHP in Poland is
perceived to not only be important due to energy efficiency issues but also to reduce local air
pollution – if it is combined with an expansion of district heating systems. In addition, one expert
emphasizes that there is currently an incentive to build small CHP plants (below 1 MW) as they
do not have to pay for their carbon emissions from electricity generation. Thus, they can
produce electricity at very low cost as they are energy efficient, do not pay cost for emissions,
and can get subsidies from support schemes.
Comparison and Summary
Both countries employ renewable energy as well as CHP promotion. Consequently, we observe
an increase of renewable energy generation over time (see Figure 10 and Figure 11). In Poland
the renewable share is much lower than in Germany. According to experts, one reason seems to
be political uncertainty about the willingness to support green technologies in Poland.

CLIMATE CHANGE - Influence of the European Emission Trading System and the German and Polish Electricity Market
50
4.4 Retail market and consumer price regulation
Germany
German consumers pay volumetric tariffs. The German retail market is fully liberalized in the
sense that consumers are allowed to freely choose their suppliers. As a consequence, the retail
market is rather competitive. BNetzA (2019) reports a market share of the biggest four suppliers
(CR4) of 37% in the household and 25% in the industry consumer segment, respectively. 12.3%
of industry and 4.3% of household customers switched their suppliers in 2018.
On the demand side, there is one additional regulation relevant for our analysis that
compensates sectors with a risk of carbon leakage for carbon cost included in electricity prices:
Electricity price compensation (“Strompreiskompensation”)
Electricity price compensation is based on Article 10a(6) of the EU ETS directive (EC, 2018a).
The directive states that Member States may also adopt financial measures to support sectors
that are at risk of carbon leakage due to high electricity cost because of high carbon prices. In
line with this article, large German electricity consumers (e.g. aluminium smelters) receive a
compensation for indirect carbon cost to prevent Carbon Leakage (via electricity prices) from
the EU ETS (“Strompreiskompensation”). In 2017, the paid compensations amounted to around
200 million Euro. The compensation is financed from auction revenues within the Energie- und
Klimafonds (DEHSt, 2019).
The incentives for energy-efficiency investments within the industries eligible for the
compensation depend on the exact rules of the compensation. In Germany, the compensation is
product based. I.e., compensation is based on an average emission factor of 0.76 t CO2 per MWh
of electricity as well as a benchmarking factor determining electricity consumption per unit of
product.26 Moreover, the compensation intensity determines the share of carbon cost
compensated. Currently, consumers receive compensation for 80% of their electricity
consumption, however, this rate is diminishing from 85 in the past to 75% in the future.
Poland
Polish consumers pay volumetric tariffs. In retail markets, consumers are allowed to freely
choose their supplier. Yet, the switching rate of consumers stays at a rather low level of 4.6%
(Energy Regulation Office, 2019). Retail markets in Poland were perceived by interview partners
as competitive until the introduction of the price cap on retail prices.
In Poland, there are two additional demand-side regulations relevant for our analysis: First,
price caps on electricity retail prices; second, the compensation of indirect carbon cost.
Retail electricity price cap
In December 2018, the Polish Parliament adopted an act for the temporary stabilization of
electricity costs being incurred by final customers. This stabilization was realized by
implementing three sets of regulations (SK&S Legal, 2018b): temporary restrictions on traders,
which means that electricity prices (on retail markets) were frozen at the level of mid 2018;
temporary „freezing” of transmission and distribution tariffs applied by electricity grid
26 Benchmarking is used for more than half of all products. The remainder, so-called fallback products, is regulated using a fallback factor determining how much of relevant electricity consumption enters the calculation of carbon cost.

CLIMATE CHANGE - Influence of the European Emission Trading System and the German and Polish Electricity Market
51
operators; decrease in excise duty on electricity, and in the rates of transitional fee incurred by
final customers.
The act entered into force in January 2019. However, it has undergone further changes since
then. In July 2019 the cap was removed for mid-size and big companies because the energy
ministry has “not issued supplementary regulations to clarify technical issues related to prices at
which companies buy electricity” (SK&S Legal, 2019b). Energy companies that sell electricity can
apply for a compensation for their lost revenues due to the price cap. According to SK&S Legal
(2019b) they can receive the difference between the revenue from the sale of energy for the
maximum price and the revenue from the sale of the same amount of energy at the price
specified in the legislation. The Polish regulations regarding the stabilization of electricity cost
have been questioned by the European Commission (Reuters 2019b).
Although the decision was made by the regulatory office, all interview partners agree that this
price cap has purely political reasons as it was announced shortly before the elections. While it
prevents consumers from price increases (induced by high CO2 and coal prices), some of our
interviewed experts are very displeased with this new regulation for several reasons. First, it is a
large distortion of the market, which destroys the liberalization efforts of the past few years and
the trust in electricity markets. Second, it brings large uncertainties, especially for retailers. One
interview partner stated that they had to submit a form to the government to get a refund to
compensate for the lower revenues. Yet, currently they are still waiting and do not know
whether they will ever receive compensation for the forgone revenue. Another interview
partner mentioned that there have been bankruptcies of small retailers due to this policy. Third,
experts believe that the technical issues of this price cap are very complicated and unclear,
leading to a huge and unnecessary administrative effort.
Compensation for Indirect Carbon Cost to Energy-intensive Companies
Since 2019, energy-intensive companies receive a compensation for higher electricity prices
resulting from indirect emission costs under the EU ETS. This regulation is in accordance with
Article 10a(6) of EC (2018a), which allows member states to adopt financial measures to
support sectors at risk of carbon leakage due to high electricity cost because of high carbon
prices. It was approved by the EC in August 2019. It is expected that around 300 companies,
which are particularly exposed to international competition and high energy cost, will receive a
partial refund of their electricity cost. The provisional budget for 2019 and 2020 amounts to
approximately 417 million Euro for both years together (Reuters, 2019; Pubaffairs Bruxelles,
2019).
Comparison and Summary
Both, the Germany and Polish retail market are fully liberalized. However, since 2019 Poland has
a price cap on retail electricity prices for small consumers that might hinder the pass-through of
carbon cost to these consumers.

CLIMATE CHANGE - Influence of the European Emission Trading System and the German and Polish Electricity Market
52
5 Assessing electricity markets and the EU ETS’ impact on
abatement
Although it is not possible to quantitatively assess how the impact of the EU ETS on abatement
depends on electricity market design elements, in the following we summarize some descriptive
and narrative evidence. Before turning to the three abatement channels (fuel switch, low carbon
investment, and demand reduction), we assess the pass-through of carbon cost to wholesale
electricity market prices, which is a requirement for abatement through all channels.
5.1 Pass-through of carbon cost to wholesale electricity market prices
The pass-through of carbon cost in electricity markets is an indicator whether generators pass-
on carbon cost to the wholesale market price. This pass-through is the pre-condition that retail
prices reflect carbon cost and, thus, are able to incentivize carbon abatement at the demand side.
5.1.1 Observations
Figure 15 shows the German and Polish monthly average day-ahead electricity price (left axis)
together with the EUA forward price (right axis). It becomes evident, that the correlation of
wholesale electricity and EUA prices is rather high. In fact, the correlation between the German
(Polish) wholesale and the EUA price is 75% (79%). Given this strong correlation, it seems likely
that electricity generators pass the carbon price signal to the wholesale market.
Figure 15: Wholesale electricity and EUA prices
Sources: German day-ahead price: EPEX and https://open-power-system-data.org/; Polish day-ahead I price: TGE; EUA: ICE daily
forward prices obtained via Quandl (https://www.quandl.com/) and aggregated to monthly averages.
The carbon cost pass-through is also confirmed by more rigorous empirical analysis.
Hintermann (2016) finds a pass-through of nearly 100%. Fabra and Reguant (2014) find a
similar pass-through for Spain for the trading period 2005-2007.
This result is in line with the opinions of experts, who agree that carbon cost are passed-through
to wholesale market prices. Interview partners working for companies with own trading
departments (trading both electricity and emissions) state, that carbon prices are integrated as
CLIMATE CHANGE - Influence of the European Emission Trading System and the German and Polish Electricity Market
53
input cost and reflected in the bids on the market, i.e, they are treated like any other commodity.
Firms thus align carbon and electricity trading, meaning that they hedge emissions whenever
they sell electricity by continuously trading emissions on spot and future markets.
5.1.2 Impact of market structure and design
Carbon prices are very likely to be reflected in German and Polish wholesale market electricity
prices. There are no features neither in the electricity market designs hindering the pass-
through of carbon cost to wholesale markets. From a theoretical perspective, the result is not
very surprising. Both countries rely on a liberalized wholesale market with competitive bidding
in the day-ahead market. In such a system, generators bid their production cost including the
carbon cost. The major difference between wholesale market designs is the dispatching
procedure. Germany is self-dispatched whereas Poland is centrally dispatched. It does not seem
that the type of dispatching mechanism makes a difference for the pass-through of carbon-cost.
5.2 Fuel switch: Impact of carbon price on dispatch
If carbon costs are reflected in marginal costs (and thus bids) of generators, a sufficiently high
carbon price induces a change in dispatch through a switch in the merit-order. Carbon intensive
technologies such as coal are then replaced by low carbon technologies such as gas.
5.2.1 Observations
Fuel Switch Potential
Whereas Germany has a very diverse capacity mix including large natural gas capacities,
Poland’s conventional capacity mix is almost entirely relying on coal-based technologies. The
installed capacity determines the short-term abatement potential, i.e., the potential to substitute
carbon intense coal by gas generation. In the Appendix, we illustrate the fuel-switch potential for
both countries in the year 2017. The calculations reveal three major observations.
First, even under the most favorable set of assumptions, the short-term abatement potential in
both countries is limited. Therefore, for a deep decarbonization of the power sector, the fuel
switching incentivized by the carbon price is not sufficient, but investments in emission-free
generation capacities are needed.
Second, the short-term abatement potential in Germany is higher (up to 37% of power
emissions in 2017 or roughly 100 MtCO2 could have been saved if all hard-coal and lignite
electricity would have been replaced by gas, see annex for details of the calculation) than in
Poland (12% of power emissions or roughly 21 MtCO2), due to higher gas capacity in Germany.
Third, the existence of CHP capacities in Germany does not impose a major restriction on short-
term abatement. Most of the CHP capacities are anyway natural gas-fired plants. The small share
of coal- and lignite-fired CHP plants that cannot be replaced without foregoing their heat supply,
therefore does not pose a major problem.
Historical Fuel Switch
Fuel and carbon prices induce a switch from coal to gas generation, if they increase generation
costs such that gas generation becomes cheaper than coal generation. Figure 16 depicts the
average generation cost by technology (left axis) together with the EUA price (right axis). The
upper panel depicts the (hypothetical) generation cost in the absence of EUA prices; the lower
panel depicts carbon price-inclusive generation costs.

CLIMATE CHANGE - Influence of the European Emission Trading System and the German and Polish Electricity Market
54
Figure 16: Generation cost and EUA price
Sources: Own depiction. Fuel price: Worldbank: https://www.worldbank.org/en/research/commodity-markets; Lignite price is assumed to be constant at 1.5 €/MWhth (UBA, 2017). EUA: ICE daily forward prices obtained via Quandl (www.quandl.com) and aggregated to monthly averages. Carbon content of fuels and average heat efficiency of plants based on UBA (2018): Lignite 0.388 tCO2/MWhth, 34%, Coal: 0.337 tCO2/MWhth, 40%; Gas 0.201 tCO2/MWhth, 53%.
The figures provide the following main insights: For most of the years coal was significantly cheaper than gas. Only in recent years, relatively low gas and high coal prices have led to the situation where cost of coal and gas generation are within the same range (upper panel). In combination with the higher EUA price (lower panel), this situation has induced a change in the merit order: Since 2019, we observe that gas generation became cheaper than coal and partly even cheaper than lignite production.
This observed fuel switch in the merit order was induced by a combination of relative fuel and carbon prices: On the one hand, we can conclude that (except for a very short period at the end
Generation cost without carbon cost
Generation cost with carbon cost

CLIMATE CHANGE - Influence of the European Emission Trading System and the German and Polish Electricity Market
55
of 2019) the fuel switch would not have occurred without the EUA price. On the other hand, the same EUA price would not have triggered a fuel switch during most of the observation period (between 2010 and 2020), as the differences between coal and gas prices were too large to be overcome by a EUA price of around 25€.
When looking at electricity production in Figure 10 and Figure 11, both countries share similar trends in the generation mix: Renewable generation increased, coal generation decreased, and gas production stays nearly constant with a slight increase in 2019. However, we need to point out some differences: First, the share of renewable generation increased in both countries. As the renewable promotion in Germany already started in 2000, the relative increase between 2008 and 2018 is higher in Poland. The share in total generation is however much higher in Germany. Second, lignite and coal generation decreased in both countries. In Germany, hard-coal generation decreased the most whereas in Poland the reduction was about the same for coal and lignite. Third, in Germany, coal and lignite generation declined by 58 TWh in 2019. This was counterbalanced by an increase in renewable (+16 TWh) and gas generation (+8 TWh), as well as a decrease in electricity demand (-21 TWh) and exports (-14 TWh).27
Within this project, we are not aiming to quantify to what extent the EU ETS contributed to the
observed changes in the power mix. However, two mechanisms are noteworthy: First, the EUA
price was one reason why gas generation became cheaper than coal in 2019. This fuel switch, in
turn, very likely has led to more gas and less coal generation. Second, there is an interaction
between the impact of renewable on fossil generation and the carbon price: If coal becomes
more expensive than gas (due to changes in fuel or carbon prices), renewable generation is more
likely to push coal out of the market, inducing a higher abatement compared to the situation
where renewable generation replaces gas.
To summarize, in both countries experts agree that some fuel switching took place due to the EU
ETS (see also for example Marcu et al. 2020). Yet, the extent of it is unknown.
5.2.2 Impact of market structure and design
The impact of carbon prices on dispatch depends on various elements of the market structure
and design:
► Electricity mix: The mix of installed capacity heavily impacts the fuel switch potential. In
particular, the existence of natural-gas capacities plays a major role. This becomes evident
comparing Germany and Poland. Germany has a more diverse capacity mix which in
particular includes gas-fired power plants. In contrast, Poland relies almost exclusively on
coal-fired plants. Thus, the fuel-switching potential in Germany is higher than in Poland, i.e.,
in the short run, the EUA price is expected to show a larger impact on the German than on
the Polish generation mix. In 2019, we observe a switch in the merit order, i.e., gas became
cheaper than coal. This fuel switch was triggered by the combination of relatively low gas,
and relatively high EUA prices.
► Age of fleet: The age of the conventional power plant fleet is likely to increase the impact of
carbon prices on dispatch decisions as older plants are less efficient and, thus, more affected
by higher carbon prices. The fact that Polish plants are about as twice as old as German ones,
27 Some part of the decrease in electricity exports in Germany may also be induced by cross-border fuel switching, as in previous years (with lower EUA prices and higher gas prices relative to hard-coal), electricity from Germany was for example exported to the Netherlands where it substituted electricity from gas plants (Agora Energiewende, 2015).

CLIMATE CHANGE - Influence of the European Emission Trading System and the German and Polish Electricity Market
56
might be one possible explanation for the higher correlation of Polish day-ahead and EUA
prices. Older plants have lower heat efficiencies and, thus, higher carbon intensity leading to
higher carbon cost component.28
► Renewable energy support: We observe increasing shares of renewable power in both
countries mostly likely due to renewable energy support. Renewable generation partly
replaces conventional generation capacities leading to decreasing coal and lignite generation
in both countries. Thus, renewable support decreases carbon-based generation in the system
and consequently reduces the impact of carbon prices on the dispatch. This effect is more
pronounced in Germany.
► CHP support: In both countries, CHP support is harmonized with the goal of carbon
abatement by imposing efficiency requirements to be eligible for support. Nevertheless, CHP
support is granted to fossil-based generation mostly gas-fired plants. As these plants receive
subsidies and also partly receive allowances for free, the impact of the EUA price on these
plants is lower compared to a situation without these subsidies.
► Coal phase-out: So far, the coal phase-out in Germany is not implemented, i.e., we have no
empirical observations. Yet, as the goal of the phase-out is to eliminate coal capacities, it is
likely that the policy reduces the impact of the EUA price on the German dispatch.29
► Reserve mechanism: German reserve mechanism do not apply to power plants active in the
energy market. Thus, the power plant dispatch is not affected.
► Capacity market: The Polish capacity market does not differentiate support based on the
carbon-intensity of plants. So far, mostly coal and lignite plants receive capacity payments.
However, these payments are independent of the amount of generation and do not enter the
short-run marginal cost relevant for the dispatching decision. Thus, it is unlikely that the
capacity market directly impacts the influence of the EUA price on the Polish market as
relative cost of technologies are not affected.
5.3 Low carbon investment/disinvestment
Due to higher carbon prices, cleaner forms of electricity generation become relatively more
profitable, incentivizing investments in low-carbon technologies and their development.
Similarly, high-carbon assets earn lower margins and are encouraged to shut down. If the
expected carbon prices are sufficiently high (and stable) there is investment in low carbon
technologies (or fuel efficiency of plants).
28 The fact that Poland as nearly no gas-fired capacities together with the higher carbon-intensity due to the age of coal-fired power plants likely also explains the increase in price divergence of Polish and German electricity prices in 2019. 29 The coal-phase out leads to a decrease of allowances demand due to the market exit of coal-fired plants. If the supply of allowances is not adjusted accordingly, the EUA price is likely to decrease as a response. Germany announced to cancel allowances to compensate for the demand decrease. If allowances are canceled, the environmental effectiveness of the EU ETS is increasing. Even without the cancelation of the allowances, the MSR is likely to absorb part of the demand decrease leading to a higher environmental effectiveness. Both of these effects are summarized and discussed more generally under the voluntary cancelation and market stability reserve features.

CLIMATE CHANGE - Influence of the European Emission Trading System and the German and Polish Electricity Market
57
5.3.1 Observations
In both countries the major investments taking place since 2018 were investment into
renewable capacities, in particular wind and solar power. Apart from a slight increase in gas
capacity in Poland, we do not observe further investments in the past. Coal and lignite capacities
stayed rather constant in both countries. In Germany, 2.7 GW of the currently installed lignite
capacity is already announced to be shut-down and currently only used for system-security but
not for actual dispatching (BNetzA, 2019).
Concerning future investments, BNetzA (2019a) reports that the Datteln power plant installs an
additional 1 GW of hard coal in Germany becoming operational in 2020. Furthermore, additional
1.1 GW of gas-fired power plants will become active between 2019 and 2022. No lignite
investments are planned in Germany. Poland announced to rely on nuclear power announcing
5 GW of capacity and additionally 2 GW of gas and hard-coal, respectively.
5.3.2 Impact of market structure and design
We do not observe major investments or closures in the German or Polish power markets since
2008. In the following, we discuss the elements of market structure and design that have an
impact on carbon price induced investment or disinvestment:
► Electricity mix: Germany has a more diversified portfolio of capacity including gas
generation that offers the possibility to respond to carbon prices using short-run fuel
switching. Thus, it is reasonable to expect, that the EUA price is more likely to trigger
investment decisions in Poland than in Germany.
► Age of fleet: Capacity in both countries is rather old. In particular, the high fleet-age in
Poland requires major investments in the near future.30 It is thus likely that a high fleet age
increases the impact of the EUA price on investments.
► Renewable energy support: Renewable promotion incentivized huge investments into
renewable capacity mostly in Germany. These policies directly interact with the carbon price
by replacing carbon-intense power-plants. Thus, they reduce the impact of carbon prices on
investment behavior. This effect can be expected to be larger for Germany than Poland due
to the higher renewable share.31 Thus, one likely reason for not observing investments in the
past, is the increase in renewable capacity which induced overcapacity in the market.
However, as renewable electricity generation is intermittent and stochastic, the major
question arises how to incentivize conventional backup capacity to ensure long- and short-
run system stability, i.e., capacity adequacy and reliability.
30 As obstacle to past and current investments into power plant capacities in Poland, Graichen et al. (2018) mention the primary allocation rule. In Poland, free EUA allowances have been primarily allocated to coal and lignite power plants. As this grant additional income to the old and carbon-intense power plants, this causes the danger that the lifetime of these plants is extended. 31 Another interaction of renewable promotion and emission trading is the decrease of carbon prices due to decreasing demand from conventional power plants. This has been shown in the case of the EU ETS numerically by Abrell and Weigt (2008) and theoretically by Böhringer and Rosendahl (2010) and Böhringer and Behrens (2015). So far, no empirical ex-post study quantifies this effect for the EU ETS.

CLIMATE CHANGE - Influence of the European Emission Trading System and the German and Polish Electricity Market
58
► Reserve mechanisms: German reserve mechanisms only grant income to power plants
outside the power market. Therefore, these plants are only running under special
circumstances such as severe grid problems and adequacy problems that are by definition
are rather scare. Albeit reserve plants are often fossil plants emitting carbon, these reserve
mechanisms are unlikely to be directly affected by carbon prices. Moreover, as plants are
outside the market, i.e., do not participate in the daily electricity generation, these
mechanisms are unlikely to impact investment directly but might tip the scales to retire
some plants. Overall, these mechanisms do not seem to be an important determinant
altering the impact of the EUA price on power plant investments.
► Capacity market: The Polish capacity market grants income to new as well as existing
power plants. Eligibility for the mechanism does not depend on carbon intensity and we
observe that most income is paid to carbon-intense plants. As the capacity market pays parts
of plants’ capital cost, the relevance of carbon prices for investment decisions decreases.
► CHP support: Both countries implemented CHP promotion schemes. Such schemes interact
with carbon pricing by incentivizing the usage of fossil-fueled electricity generation by CHP
plants. In both countries, the schemes are designed in a way to incentivize more efficient
plants in terms of carbon emissions, i.e., encourage investment into gas and not coal-fired
plants. Yet, these policies decrease the relevance of the EUA price for investment decisions.
► Phase-out policies: Phase-out policies such as the German nuclear and coal phase-out (are
expected to) decrease installed capacity and increase the need for investments. A higher
investment need implies a more important role of carbon prices in investment decisions.32
Given these interacting policies, it is not possible to determine to what extent past investments
or disinvestments have been triggered by carbon prices. Yet, experts agree that in the past,
carbon prices were not perceived as stable. Thus, it was (and still is) difficult to base investment
decisions on carbon price expectations. According to experts, the large uncertainties regarding
the future development of carbon prices (carbon price risk) had the following impacts. First,
investments in fossil-base generation, especially coal, were reduced due to the latent risk of
rising carbon prices. However, the coal phase-out decision in Germany (divestment), was also
not (primarily) motivated by the carbon price. Second, no investments in renewables were
incentivized as carbon prices were not expected to be sufficiently high to make renewable
generation profitable. Currently, experts feel that the situation is about to change due to the new
ETS regulations. In both countries, renewables are assumed to be almost competitive at current
market prices, and especially in Poland large investments in renewable capacities are expected.
Summarizing, the high carbon price risk of projects was discouraging investment in fossil
technologies but not stable enough to incentivize renewable investments. Thus, most investment
and disinvestment decisions were likely to be triggered by interacting policies and not the ETS.
32 It remains an open question whether a coal phase-out might delay the closure of coal plants. In times of increasing carbon prices generators might keep coal-assets online until the date mandated by the phase-out policy but would have shut down plants without the phase-out policy. Whether such an effect occurs is not observable so far, as the phase-out is currently not into place.

CLIMATE CHANGE - Influence of the European Emission Trading System and the German and Polish Electricity Market
59
5.4 Demand reduction and pass-through of carbon cost to end consumer prices
Whether and to what extent electricity consumers decrease their demand due to an increase in
carbon prices depends (i) on how sensitive they are to price changes (elasticity of demand) and
(ii) on the pass-through of carbon cost to end consumer prices. We will focus here on the latter.
Also, we can broadly distinguish between three consumer types: Large consumers (electricity
intensive industry), which face wholesale market prices (see Section 5.1); small to medium sized
industry consumers; and households, both facing different retail prices.
5.4.1 Observations
Figure 17 and Figure 18 shows retail electricity price components for Germany (left panel) and
Poland (right panel) for households and industry customers (shaded columns) together with
day-ahead prices in the respective country. Three components are shown: Energy and network
charges (blue), levies (orange), and taxes (green). In Germany, the energy price component only
makes a small share of total retail prices paid by households and small customers due to high
taxes and levies. In Poland, energy and network charges account for the major share of retail
prices.
Given that carbon prices are highly correlated with the wholesale price, a proper pass-through
of carbon prices to final consumers would be given, if we would find a high correlation between
the energy component of retail prices and the wholesale price. For the case of Germany, we find
a correlation of industry energy prices with the wholesale prices of 60%. For households, the
correlation is negative (-60%). Considering that household contracts might take longer to be
adjusted, we also tested for lagged correlation (5%). With a two or more-year lag, correlation
becomes positive, indicating that household prices adjust to wholesale price with a rather long
lag time.
For Poland, we find the same phenomenon. Industry prices are correlated at a level of about
10% percent, but negative for households at least in the same year (-50%). Correlation of
household and wholesale prices becomes positive with a two or more-year lag (40%).
Provided these correlations, it seems that the pass-through of carbon cost to retail consumers is
rather limited. Only German industry customers seem to get a carbon price signal included in
their electricity prices. Neither in Poland nor in Germany final consumers seem to receive a
proper signal at least not within the same year.
These observations are in line with the opinions of experts, who do not believe that there was a substantial demand reduction or increase in energy efficiency due to carbon prices.

CLIMATE CHANGE - Influence of the European Emission Trading System and the German and Polish Electricity Market
60
Figure 17: Retail prices for households and industries - Germany
Sources: Retail prices: Eurostat. We use the DC (IF) band with consumption between 2.5 and 5 GWh/a (70 – 150 GWh/a) for households (industries); German day-ahead price: EPEX and https://open-power-system-data.org/
Figure 18: Retail prices for households and industries - Poland
Sources: Left panel: Germany; right panel: Poland. Retail prices: Eurostat. We use the DC (IF) band with consumption between 2.5 and 5 GWh/a (70 – 150 GWh/a) for households (industries); Polish day-ahead I price: TGE.

CLIMATE CHANGE - Influence of the European Emission Trading System and the German and Polish Electricity Market
61
5.4.2 Impact of market structure and design
The pass-through of wholesale to retail prices is rather limited. It is likely, that the major reason
for this phenomenon lies in the structure of household contracts. Household contracts are
usually rather inflexible in the sense that price adjustments do not take often place. For sure,
prices are not adjusted on a short-notice as it would be the case in real-time pricing schemes
which are missing in both countries.33
Besides the carbon cost pass-through to final consumers, the following electricity market design
elements are likely to have an impact on demand reduction: compensation for large electricity
consumers and retail price caps:
► Compensation of carbon cost: The compensation for large electricity consumers is
designed to reduce the risk of carbon leakage of electricity-intensive industries. Thus,
incentives to invest into costly energy-efficiency improvements are decreasing. In Germany,
a benchmarking system is used and the compensation intensity decreases over time. Thus,
industries still have an incentive to invest into energy efficiency in particular if most recent
data are used to determine the benchmarks (see Bonn et al., 2019). Nevertheless, the
incentive to reduce electricity consumption is reduced compared to a system without such a
compensation scheme.
► Retail price cap: Since 2018, a Polish retail price cap is implemented as an upper bound on
prices for small consumers. The cap is independent of carbon or fuel prices. Thus, it limits
the possibility of carbon-cost pass-through to final consumers. According to experts, the cap
was introduced by the government to prevent household and industry consumers from
raising electricity prices due to an increase in coal and carbon prices. Consequently, the cap
limits the role of carbon prices for demand reduction and energy efficiency improvements.
33 Aside the pass-through of carbon cost to electricity market prices, experts also mentioned the pass-through to prices for heat
generation in the case of CHP plants. In this case, experts from Germany noted, that they are only allowed to pass-through the cost
they have to pay but not the cost of certificates from free allocation. Thus, in this case the pass-through depends on the allocation
mechanism. Also, some experts have mentioned, that they assume that in industries the handling of freely allocated certificates might
differ from the power sector. In Poland, the heat sector is completely regulated, i.e., prices have to be accepted by the regulatory
office.
CLIMATE CHANGE - Influence of the European Emission Trading System and the German and Polish Electricity Market
62
References Abrell, J. (2016): The Swiss Wholesale Electricity Market. SCCER CREST WP3-2016/07,
https://www.ethz.ch/content/dam/ethz/special-interest/mtec/cer-eth/economics-energy-
economics-dam/documents/people/jabrell/Abrell_Swiss_Wholesale_Electricity_Market.pdf.
Abrell, J. and H. Weigt (2008): The Interaction of Emissions Trading and Renewable Energy
Promotion. Working Paper No. WP-EGW-05. Dresden: University of Technology.
Abrell, J. and S. Rausch (2017): Combining price and quantity controls under partitioned
environmental regulation. Journal of Public Economics, 145, 226-242.
Abrell, J., M. Kosch, and S. Rausch (2019): Carbon Abatement with renewables: Evaluation of
wind and solar subsidies in Germany and Spain. Journal of Public Economics, 196, 172-202.
Acworth, W., Kuneman, E., La Hoz Theuer, S., Abrell, J., Baer, J., Betz, R., Kosch, M., Müller, T.,
Cludius, J., Healy, S., Graichen, J., Boute, A., Zhang, H., Baisch, R. (2019): Influence of market
structures and market regulation on the carbon market - Interim report.
AG Energiebilanzen (2020): Strommix. https://ag-
energiebilanzen.de/index.php?article_id=29&fileName=ageb-strerz2019_18122019.pdf
Agora Energiewende (2015): Stromexport und Klimaschutz in der Energiewende. Analyse der
Wechselwirkungen von Stromhandel und Emissionsentwicklung im fortgeschrittenen
europäischen Strommarkt.
AtG (2017): Gesetz über die friedliche Verwendung der Kernenergie und den Schutz gegen ihre
Gefahren (Atomgesetz)
Aures II (2019): Auctions for the Support of Renewable Energy in Poland - Main results and
lessons learnt. http://aures2project.eu/wp-content/uploads/2019/08/Polish-
Auctions_final.pdf
Balietti, Anca (2016): Energy Policy, 98, 607-620.
Betz, R. and J. Cludius (2020): The role of banks in the EU emissions trading. The Energy Journal,
41(2), 275-299.
Betz, R. and Schmidt, T. (2016): Transfer patterns in Phase I of the EU Emissions Trading
System: a first reality check based on cluster analysis. Climate Policy, 16(4), 474-495.
BMU (2019): Kernkraftwerke in Deutschland. www.bmu.de/themen/atomenergie-
strahlenschutz/nukleare-sicherheit/aufsicht-ueber-kernkraftwerke/kernkraftwerke-in-
deutschland
Bocklet, J., M. Hintermayer, L. Schmidt, and T. Wildgrube (2019): The reformed EU ETS –
Intertemporal emission trading with restricted banking. Energy Economics, 84, 1-13.
Böhringer, C. and K. Rosendahl (2010): Green promotes the dirtiest: on the interaction between
black and green quotas in energy markets. Journal of Regulatory Economics, 37, 316-325.
Böhringer, C. and M. Behrens (2015): Interactions of Emission Caps and Renewable Electricity
Support Schemes. Journal of Regulatory Economics, 48, 74-96.
Bonn, M., G. Reichert, H. Voßwinkel (2019): Reform der Strompreiskompensation: Empfehlung
für die Überarbeitung der ETS Beihilfeleitlinien ab 2021.

CLIMATE CHANGE - Influence of the European Emission Trading System and the German and Polish Electricity Market
63
https://www.cep.eu/fileadmin/user_upload/cep.eu/Studien/Strompreiskompensation/cepSt
udie_Strompreiskompensation_2019-06-05_final.pdf
Bundesministerium für Wirtschaft und Energie (BMWi) (2019): Modern power plant
technologies. www.bmwi.de/Redaktion/EN/Artikel/Energy/modern-power-plant-
technologies.html
Bundesministerium für Wirtschaft und Energie (BMWi) (2019b): Kommission „Wachstum,
Strukturwandel und Beschäftigung“ – Abschlussbericht.
Bundesministerium für Wirtschaft und Energie (BMWi) (2019c): Gesamtausgabe der
Energiedaten – Datensammlung des BMWi. Available online:
https://www.bmwi.de/Redaktion/DE/Binaer/Energiedaten/energiedaten-gesamt-
xls.xlsx?__blob=publicationFile&v=117
Bundesnetzagentur (BNetzA) (2018): Monitoring Bericht 2018. Available online:
https://www.bundesnetzagentur.de/SharedDocs/Downloads/DE/Allgemeines/Bundesnetzag
entur/Publikationen/Berichte/2018/Monitoringbericht_Energie2018.pdf?__blob=publicationF
ile&v=6.
Bundesnetzagentur (BNetzA) (2019): Veröffentlichung Zu- und Rückbau – Stand 11.11.2019.
Available online:
https://www.bundesnetzagentur.de/SharedDocs/Downloads/DE/Sachgebiete/Energie/Unter
nehmen_Institutionen/Versorgungssicherheit/Erzeugungskapazitaeten/Kraftwerksliste/Vero
eff_ZuUndRueckbau_2019_2.xlsx?__blob=publicationFile&v=2.
Bundesregierung (2020): Entwurf eines Gesetzes zur Reduzierung und zur Beendigung der
Kohleverstromung und zur Änderung weiterer Gesetze (Kohleausstiegsgesetz). 29.01.2020.
https://www.bmwi.de/Redaktion/DE/Downloads/G/gesetzentwurf-
kohleausstiegsgesetz.pdf?__blob=publicationFile&v=8
Consentec (2014): Beschreibung von Regelleistungskonzepten und Regelleistungsmarkt.
Technical Report. https://www.regelleistung.net/ext/download/marktbeschreibung.
Deutsche Emissionshandelsstelle (DEHSt) (2019): Beihilfen für indirekte CO2-Kosten des
Emissionshandels (Strompreiskompensation) in Deutschland für das Jahr 2017.
www.dehst.de/SPK/SharedDocs/downloads/DE/auswertungen/Auswertungsbericht_2017.pd
f?__blob=publicationFile&v=4
Deutsche Emissionshandelsstelle (DEHSt) (2019): Auktionierung: Deutsche Versteigerungen
von Emissionsberechtigungen Periodischer Bericht: Jahresbericht 2018.
Energy Regulation Office (2019): National Report 2019. Available online:
https://www.ure.gov.pl/download/2/478/NationalReport2019.pdf.
ENTSO-E (2016): Continental Europe Operation Handbook.
https://www.entsoe.eu/publications/system-operations-reports/#continental-europe-
operation-handbook.
EPEX (2019): Annual Report 2018. Available online:
https://www.epexspot.com/document/40879/Annual%20Report%20-%202018.
European Commission (EC) (2012a): Commission Regulation (EU) No 601/2012 of 21 June 2012
on the monitoring and reporting of greenhouse gas emissions pursuant to Directive

CLIMATE CHANGE - Influence of the European Emission Trading System and the German and Polish Electricity Market
64
2003/87/EC of the European Parliament and of the Council. Official Journal of the European
Union, L181/30.
European Commission (EC) (2012b): Commission Regulation (EU) No 600/2012 of 21 June
2012 on the verification of greenhouse gas emission reports and tonne-kilometre reports and
the accreditation of verifiers pursuant to Directive 2003/87/EC of the European Parliament
and of the Council. Official Journal of the European Union, L181/1.
European Commission (EC) (2013): Commission Regulation No 389/2013 of 2 May 2013
establishing a Union Registry pursuant to Directive 2003/87/EC of the European Parliament
and of the Council, Decisions No 280/2004/EC and No 406/2009/EC of the European
Parliament and of the Council and repealing Commission Regulations (EU) No 920/2010 and
No 1193/2011. Official Journal of the European Union, L122/1.
European Commission (EC) (2015a): EU ETS Handbook. Available online:
https://ec.europa.eu/clima/sites/clima/files/docs/ets_handbook_en.pdf
European Commission (EC) (2015b): Decision (EU) 2015/1814 of the European Parliament and
of the Council: concerning the establishment and operation of a market stability reserve for the
Union greenhouse gas emission trading scheme and amending Directive 2003/87/EC. Official
Journal of the European Union, L264/1.
European Commission (EC) (2017): Communication from the Commission: Publication of the
total number of allowances in circulation for the purposes of the Market Stability Reserve
under the EU Emissions Trading System established by Directive 2003/87/EC. C(2017) 3228
final.
European Commission (EC) (2018a): Directive 2003/87/EC of the European Parliament and of
the Council establishing a system for greenhouse gas emission allowances trading within the
Union and amending Council Directive 96/61/EC. Consolidated version.
European Commission (EC) (2018b): Directive (EU) 2018/410 of the European Parliament and
of the Council: amending Directive 2003/87/EC to enhance cost-effective emission reductions
and low-carbon investments, and Decision (EU) 2015/1814. Official Journal of the European
Union, L76/3.
European Commission (EC) (2018c): State aid No. SA.46100 (2017/N) – Poland – Planned Polish
capacity mechanism. C(2018) 601 final.
European Commission (EC) (2019a): Report from the Commission to the European Parliament
and the Council: Report on the function of the European carbon market. COM(2018) 842 final.
European Commission (EC) (2019b): Communication from the Commission: Publication of the
total number of allowances in circulation in 2018 for the purposes of the Market Stability
Reserve under the EU Emissions Trading System established by Directive 2003/87/EC.
C(2019), 3288 final.
Fabra, N. and M. Regunat (2014): Pass-through of emissions costs in electricity markets.
American Economics Review, 104(9), 2872-2899.
Fraunhofer ISE (FHG ISE) (2018): Stromgestehungskosten Erneuerbare Energien. März, 2018.
Graichen, V., H. Förster, J. Graichen, S. Healy, J. Repenning, K. Schumacher, V. Duscha, N.
Friedrichsen, S. Lehmann, G. Erdogmus, I. Haug, S. Kim, A. Zaklan, and J. Diekmann (2018):

CLIMATE CHANGE - Influence of the European Emission Trading System and the German and Polish Electricity Market
65
Evaluierung und Weiterentwicklung des EU-Emissionshandels aus ökonomischer Perspektive
für die Zeit nach 2020 (EU-ETS-7). Climate Change 29/2018
Hepburn, C., K. Neuhoff, W. Acworth, D. Burtraw, and F. Jotzo (2016): The economics of the
European Union Emission Trading System (EU ETS) market stability reserve. Journal of
Environmental Economics and Management, 80.
Hintermann, B. (2016): Pass-through of CO2 Emission Cost to Hourly Electricity Prices in
Germany. Journal of the Association of Environmental and Resource Economists, 3(4), 857-
891.
Hintermann, B., S. Peterson, and W. Rickels (2016): Price and Market Behavior in Phase II of the
EUE ETS. A Review of the Literature. Review of Environmental Economics and Policy, 10, 108-
128.
Hirth, L. and I. Ziegenhagen: (2015): Balancing power and variable renewables: Three links.
Renewable and Sustainable Energy Reviews, 50, 1035–1051.
Khatir, A. A., R. Cherkaoui, and M. Zima (2010): Literature Survey on Fundamental Issues of
Frequency Control Reserve (FCR) Provision. Technical Report Swiss Electric Research.
KWKG (2017): Gesetz für die Erhaltung, die Modernisierung und den Ausbau der Kraft-Wärme-
Kopplung (Kraft-Wärme-Kopplungsgesetz).
Matthes, Felix Chr. (2019): Die Empfehlungen der Kommission „Wachstum, Strukturwandel und
Beschäftigung“ hinsichtlich Klimaschutz und Energiewirtschaft, Berlin.
PSE (2018): Raport 2017 KSE. Available online: https://www.pse.pl/dane-
systemowe/funkcjonowanie-rb/raporty-roczne-z-funkcjonowania-kse-za-rok/raporty-za-rok-
2017.
Pubaffairs Bruxelles (2019) : www.pubaffairsbruxelles.eu/state-aid-commission-approves-
compensation-to-energy-intensive-companies-in-poland-for-indirect-emission-costs-eu-
commission-press/
RAP (2018): Report on the Polish Power System. Version 2.0 Study commissioned by Agora
Energiewende.
Reins, L., M. Ballesteros, I. Bart, A. Riedel, V. Rouas, M. Wemaere, B. Goerlach, and M. Mehling
(2019): The Legal Nature of EU ETS allowances. Study commissioned by the European
Commission. Online available: https://op.europa.eu/en/publication-detail/-
/publication/9d985256-a6a9-11e9-9d01-01aa75ed71a1/language-en.
Reuters (2019): www.reuters.com/article/us-eu-poland-energy/poland-wins-eu-approval-to-
help-energy-intensive-companies-cut-electricity-bills-idUSKCN1VK1E0
Reuters (2019b): www.reuters.com/article/us-poland-energy-prices/poland-removes-power-
price-cap-for-big-clients-despite-attempts-to-curb-costs-idUSKCN1TF0IW
Siewierski, T. (2015): Empirics of Intraday and Real-time Markets in Europe: Poland. DIW,
Berlin.
SK&S Legal (2018) Legal Alert on “New incentive scheme for electricity generated in high
efficiency CHP units”. https://skslegal.pl/wp-content/uploads/2019/03/Alert-CHP-December-
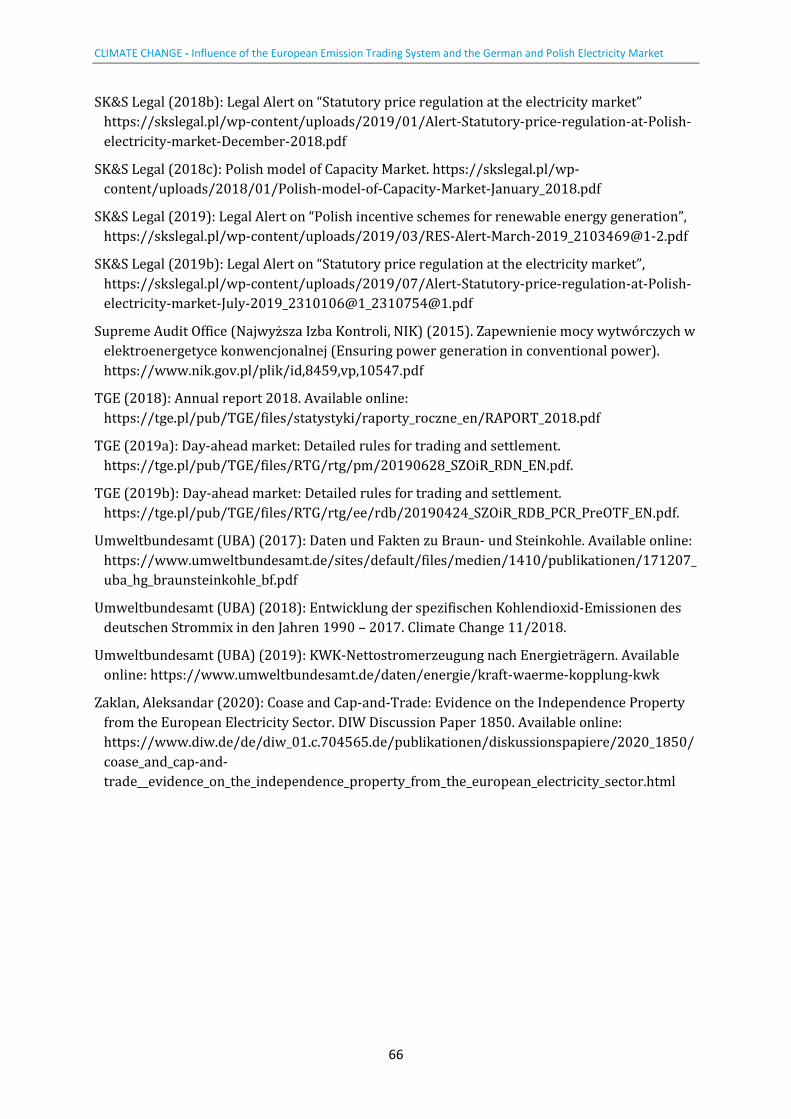
CLIMATE CHANGE - Influence of the European Emission Trading System and the German and Polish Electricity Market
66
SK&S Legal (2018b): Legal Alert on “Statutory price regulation at the electricity market”
https://skslegal.pl/wp-content/uploads/2019/01/Alert-Statutory-price-regulation-at-Polish-
electricity-market-December-2018.pdf
SK&S Legal (2018c): Polish model of Capacity Market. https://skslegal.pl/wp-
content/uploads/2018/01/Polish-model-of-Capacity-Market-January_2018.pdf
SK&S Legal (2019): Legal Alert on “Polish incentive schemes for renewable energy generation”,
https://skslegal.pl/wp-content/uploads/2019/03/[email protected]
SK&S Legal (2019b): Legal Alert on “Statutory price regulation at the electricity market”,
https://skslegal.pl/wp-content/uploads/2019/07/Alert-Statutory-price-regulation-at-Polish-
electricity-market-July-2019_2310106@[email protected]
Supreme Audit Office (Najwyższa Izba Kontroli, NIK) (2015). Zapewnienie mocy wytwórczych w
elektroenergetyce konwencjonalnej (Ensuring power generation in conventional power).
https://www.nik.gov.pl/plik/id,8459,vp,10547.pdf
TGE (2018): Annual report 2018. Available online:
https://tge.pl/pub/TGE/files/statystyki/raporty_roczne_en/RAPORT_2018.pdf
TGE (2019a): Day-ahead market: Detailed rules for trading and settlement.
https://tge.pl/pub/TGE/files/RTG/rtg/pm/20190628_SZOiR_RDN_EN.pdf.
TGE (2019b): Day-ahead market: Detailed rules for trading and settlement.
https://tge.pl/pub/TGE/files/RTG/rtg/ee/rdb/20190424_SZOiR_RDB_PCR_PreOTF_EN.pdf.
Umweltbundesamt (UBA) (2017): Daten und Fakten zu Braun- und Steinkohle. Available online:
https://www.umweltbundesamt.de/sites/default/files/medien/1410/publikationen/171207_
uba_hg_braunsteinkohle_bf.pdf
Umweltbundesamt (UBA) (2018): Entwicklung der spezifischen Kohlendioxid-Emissionen des
deutschen Strommix in den Jahren 1990 – 2017. Climate Change 11/2018.
Umweltbundesamt (UBA) (2019): KWK-Nettostromerzeugung nach Energieträgern. Available
online: https://www.umweltbundesamt.de/daten/energie/kraft-waerme-kopplung-kwk
Zaklan, Aleksandar (2020): Coase and Cap-and-Trade: Evidence on the Independence Property
from the European Electricity Sector. DIW Discussion Paper 1850. Available online:
https://www.diw.de/de/diw_01.c.704565.de/publikationen/diskussionspapiere/2020_1850/
coase_and_cap-and-
trade__evidence_on_the_independence_property_from_the_european_electricity_sector.html

CLIMATE CHANGE - Influence of the European Emission Trading System and the German and Polish Electricity Market
67
A. Overview Market Stability Reserve (MSR) The MSR works as follows: The surplus in the market is defined in terms of Total Number of
Allowances in Circulation (TNAC). TNAC is calculated as the total supply of allowances net of the
total demand. Supply is defined as sum of the amount of allowances banked from phase two to
three, the total amount of freely allocated and auctioned allowances, the sum of international
credits since 2013, and the number of allowances auctioned by the European Investment Bank
to feed the NER300 program.34 Demand is determined as the sum of verified emissions since
2013 and the number of allowances canceled by member states under EC (2018a) Article 12.4
(see below). Furthermore, the number of allowances in the MSR is deducted from TNAC.
Figure 19: Allowance cap, long-term targets and market stability reserve (installations)
Source: https://www.eea.europa.eu/data-and-maps/figures/illustrative-outlook-on-the-supply.
From 2019 onwards, if TNAC exceeds 833 Mt, 24% of the TNAC is transferred into the MSR
(Figure 19 upper red line). The share to be transferred to the reserve will be lowered to 12%
after 2023. If TNAC however falls below 400 Mt (Figure 19 lower red line), 100 million EUAs will
be transferred from MSR to the amount to be auctioned, in case there is a sufficient number of
allowances left in the MSR.
The 2018 change of the MSR implements an upper bound on the total number of allowances in
the MSR from 2023 onwards. If the total amount in the MSR exceeds the amount of allowances
34 The NER300-iniative was designed to fund investments in demonstration projects for carbon capture and sequestration and renewable energy technologies. The program was funded by selling 300 million EUAs to the market (see https://www.eib.org/en/products/advising/ner-300/index.htm). It is succeeded by the innovation fund in TP4 (450 million allowances will be auctioned between 2021 and 2030).
CLIMATE CHANGE - Influence of the European Emission Trading System and the German and Polish Electricity Market
68
auctioned in the previous year, all allowances above this threshold will be cancelled. This
process is shown in Figure 19. The light green area shows the development of TNAC overtime.
From 2019, there is an intake of allowances to the MSR and the amount of allowances in the
reserve (dark green area) increases. In 2023, the upper bound on the amount in the MSR
becomes active, leading to the cancelation of allowances in the MSR.
Table 7 shows the calculation of TNAC for the year 2018. TNAC up to the end of 2018 amount to
1’655 million EUAs clearly exceeding the upper threshold of 833 million. Therefore, 397 million
EUAs (24%) will be transferred to the MSR, i.e., deducted from auctioned amounts, until the end
of August 2020.
Table 7: Total number of allowances in circulation in 2018
Supply and demand Million EUAs
Total supply 12’287
Banking from phase 2 1’750
Freely allocated allowances since 2013 5’162
Auctioned allowances since 2013 4’641
Allowances for NER300 300
International credits since 2013 434
Total demand 10’632
Verified emissions since 2013 10’632
Cancelation under Article 12.4 0
Allowances in reserve 0
Total number of allowances in allocation (TNAC) 1’655
Source: EC (2019b). All values are calculated until the end of 2018.

CLIMATE CHANGE - Influence of the European Emission Trading System and the German and Polish Electricity Market
69
B. Electricity market design GERMANY
The German electricity market is a self-dispatched market. A day before delivery (D-1) at 12:00
an energy auction takes places (see Figure 13 and Table 8). The intraday market opens the day
before at 15:00. Energy can be traded until 30 minutes before delivery time.35 Ancillary services
are procured by the four transmission systems operators (TSO).36
Figure 20: Timeline German electricity market
Beside future and over-the-counter (OTC) trade, the energy only market in Germany is sub-
divided into two major markets: day-ahead and intraday market. For both markets, the EPEX
trading platform is the major market place. With a volume of about 225 TWh the German day-
ahead market has a market size of about 38% of total electricity demand (EPEX, 2019). The
intraday market gained more popularity in recent years and reached a high of 50 TWh in 2018.
Table 8: German electricity market design
Day-ahead Intraday Continuous Intraday
Gate Opens n.a. n.a. D-1 15:00
Gate Closure D-1 12:00 D-1 15:00 DT – 30 min (DT – 5 min in-zone)
Products Electricity 1 h contracts
Electricity 15 min contracts
Electricity 1 h (15 min) contracts
Bids Supply curves (up to 256 steps)
Supply curves (up to 256 steps)
Price/Quantity Bids
Bidding-Frequency Singles auction Single auction Continuous
Step Size 0.1 MWh 0.1 MWh 0.1 MWh
Pricing Uniform Price Uniform Price Uniform Price
Minimum Price -500 €/MWh -3’000 €/MWh -9’999 €/MWh
Maximum Price 3000 /MWh 3’000 €/MWh 9’999 €/MWh
Sources: : https://www.epexspot.com/en/product-info/auction/germany-luxembourg; https://www.epexspot.com/en/product-info/intradaycontinuous/germany; https://www.epexspot.com/en/product-info/intradayauction/germany
35 Within a control zone, trade is possible until 5 minutes before delivery time. 36 Amprion, Tennet TSO, TransnetBW, and 50Hertz Transmission.

CLIMATE CHANGE - Influence of the European Emission Trading System and the German and Polish Electricity Market
70
Energy-only market
Day-ahead Market
The German day-ahead market is organized as a single auction with a uniform price. It is cleared
at 12:00 the day before delivery. Market participants bid supply curves (with up to 256 steps)
for the contract to deliver electricity for one hour of the preceding day.37 The upper (lower)
price limit is 3000 (-500) €/MWh.
Intraday Market
The German intraday market functions in two sub-stages: an opening auction followed by
continuous trade. The opening auction takes places at 15:00 the day before delivery. Market
participants bid supply curves for 15 minute contracts to be delivered at the following day. The
upper/lower price bound amounts to +/- 3’000 €/MWh. The auction is cleared with a single
uniform price. In the continuous intraday stage only single price/quantity bids are allowed. The
contract length can be either 15 minutes or one hour. Compared to the intraday auction, price
bounds are increased to +/- 10’000 €/MWh.
Balancing market
German TSOs procure primary, secondary, and tertiary balancing capacity. Tenders for
balancing capacity are jointly carried out by the TSOs using the platform regelleistung.net.
Primary reserve capacity has to be available within 30 seconds and automatically activated
using frequency controllers.38 Primary capacity was procured in a weekly auction with a
symmetric product. The contract required the delivery for one week. Starting in July 2019,
primary reserve is procured in daily auctions two days before delivery time and the contract
length was decreased to one day. Market participants bid capacity into the tender. If bids are
accepted they are rewarded on a pay-as-bid basis. No reward is provided for the activation of
primary balancing energy. Regelleistung.net also procures primary capacity for neighboring
countries with a total demand for capacity of 1.4 GW.
Secondary capacity has to be able to produce after 30 seconds and to be fully available after 5
minutes and is activated semi-automatically. It is procured one week before delivery time.
Secondary capacity is procured as asymmetric product, i.e., positive and negative balancing
capacity are differentiated, and the contract length is four hours. Market participants make a
complex bid with a capacity and an energy price. Bids are selected based on a merit-order
ranking of the capacity bid. In case of activation the energy price is paid on a pay-as-bid basis.
The demand for the German control zone is about 1.9 GW for each time-slice.
Tertiary reserve has to be available within 15 minutes and needs to deliver up to an hour. It is
also procured one week before delivery as an asymmetric product in four-hour time slices. As
for secondary reserve, complex bids with capacity and energy are rewarded on a pay-as-bid
basis. The demand for negative (positive) tertiary reserve is about 1 GW (1.9 GW).
37 It also possible to trade block contracts. 38 For the following see https://www.regelleistung.net/ext/.

CLIMATE CHANGE - Influence of the European Emission Trading System and the German and Polish Electricity Market
71
POLAND
The Polish electricity market is a centrally dispatched market. One day before delivery time
(until 14:30) market participants have to inform the transmission system operator (Polskie Sieci
Elektroenergetyczne, TSE) about their contract position and the corresponding production
schedule for the next day (see Figure 21) Based on these positions as well as on new information
such as state of the transmission system and updated demand and renewable forecasts, TSE
determines the final production schedule using a cost-minimization algorithm. The adjustment
of production schedules is based on the real-time market,39 in which generators bid their
capacity in several steps.
The Polish electricity market consists of different markets: In the energy-only market, market
participants trade energy. Besides the energy trade over the Polish Power Exchange (Towarowa
Giełda Energii, TGE), Over-the-counter (OTC) trade is possible. In the real-time market,
participants trade capacity available to be used for re-scheduling during the scheduling process
of the TSE. Besides energy markets, TSE procures capacity for ancillary services in bilateral
contracts with suppliers (see Siewierski, 2015).
Figure 21: Timeline Polish electricity market
The majority of trades take place over day-ahead markets (DAM) and OTC. Intra-day markets
(IDM) do not play a significant role in the Polish market (TGE, 2018). The major reason for the
very minor market share of IDM is the existence of RTM. As the RTM already starts scheduling of
power plants before the IDM closes, there is simply no role of the IDM (see Siewierski, 2015).
Energy-only markets
Three different energy only markets exist (see Figure 21): Two day-ahead markets (DAM) and
one intraday market (IDM).
Day-ahead Market
The Polish DAM functions in different sub-markets (TGE, 2019a). Two markets allow the trade
of hourly electricity delivery for the next day. In market one (DAM I) market participants submit
single price-quantity bids. In contrast, in market two (DAM II) market participants are able to
submit supply and demand curves with a maximum of 128 pricing steps. In both markets, prices
have to lie in the range of -500 to 3000 € and the minimal quantity step is 0.1 MWh. The market
operator, TGE, determines a single price in both markets.
39 The Polish real-time market is often called “balancing market”. We use the term “real-time” market in order to avoid confusion with market for ancillary services.

CLIMATE CHANGE - Influence of the European Emission Trading System and the German and Polish Electricity Market
72
The timeline in the two markets slightly differs. To be able to bid in the markets, available
capacities have to be submitted to TGE two days before the delivery day until 18.30 at latest.
Markets open at 8:00 one day before delivery. In DAM1 bids can be continuously submitted and
modified until 10:30 and the single price is determined crossing demand and supply bids at
10:30. Until 13:30 continuous trade is possible. Bids in DAM2 are accepted until 12:00. The
determination of the price is variable and the exact time is announced one day before delivery
via a notification by TGE to market participants.
Table 9: Polish electricity market design
Day-ahead I Day-ahead II Intraday Real-time
Gate Opens D-1 08:00 D-1 08:00 D-1 11:30; D 8:00 D-1 09:00
Gate Closure D-1 13:30 D-1 12:00 D-1 15:30; D 15:30 D 21:30
Products Energy 1 h contracts
Energy 1 h contracts
Energy 1 h contracts
Energy
Bids Price-Quantity Bids
Supply curves Price-quantity in
maximum 128 steps
Price-Quantity Bids Whole capacity in 10 steps with prices
Bidding-Frequency Continuous Singles auction
Single auction Continuous
Step Size 0.1 MWh 0.1 MWh 0.1 MWh -
Pricing Uniform Price Uniform Price Uniform Price Uniform Price
Minimum Price -500 €/MWh -500 €/MWh -9999 €/MWh 70 PLN/MWh (~ 16 €/MWh)
Maximum Price 3000 /MWh 3000 €/MWh 9999 €/MWh 1500 PLN/MWh (~ 350 €/MWh)
Besides hourly contracts, block contracts are traded at TGE. Base (0:00 to 22:00), peak (7:00 to
22:00), and off-peak (0:00 to 7:00 and 22:00 to 24:00) contracts exist. At weekends, contract
specifications slightly differ: Base (0:00 to 24:00), peak (7:00 to 24:00), and off-peak (0:00 to
7:00 and 22:00 to 24:00). Price limits and quantity steps are the same as in the case of hourly
contracts (-500 to 3000 €, 0.1 MWh).
Provided the settlement of contracts, market participants determine the final operating schedule
until 14:50. This final day-head schedule is communicated to the PSE at 14:30 one day before
delivery. Market results become public at 17:00.
Intraday Market
On the intraday market, hourly contracts are traded (TGE, 2019b). The price range lies between
-9999 and 9999 €/MWh with quantity steps of 0.1 MWh. Trading starts shortly after the closure
of DAM1 at 11:30 at the day before delivery. Trading at the day before delivery is possible until
15:30. Contracts with delivery before 11:00 cannot be further traded implying a rather long gate
closure up to 13.5 hours before delivery. At the day of delivery, gate closure is 2.5 hours before
delivery for contracts until 18:00. All remaining contracts have to be settled until 15:30.

CLIMATE CHANGE - Influence of the European Emission Trading System and the German and Polish Electricity Market
73
Real-time market
In the real-time market all large generating units are required to bid their entire capacity
together with prices. Bids have to be submitted in ten steps with the lowest bid being equal to
the minimum capacity. The market opens at 9:00 the day before delivery and closes at 14:30
(Siewierski, 2015). Besides large generating units which are required to participate in the RTM,
flexible loads are also allowed to bid load reduction. For load reduction bids the market also
opens at 9:30 but closes one and a half hours before delivery time. The latest gate closure is at
21:30 at the delivery day.
PSE uses RTM bids to balance unforeseen deviation from the day-ahead production schedule.
This is done using numerical programming to minimize the system cost taking network
constraints into account. The first production schedule is published in the Daily Coordination
Schedule at 17:00 the day before delivery and updated every quarter hour. All units are
rewarded a uniform price for the delivery of energy. The same price is charged if the units are
not able to deliver the energy contracted. Therefore, the RTM is revenue neutral for the PSE.
The combination of a DAM and a RTM used for balancing offers the possibility of market
manipulation. For example, the generators could withdraw capacity from the DAM in order to
increase prices in the RTM. In order to avoid such behavior, PSE is allowed to introduce
differentiated prices in the case of excessively high balancing quantities or prices.
Beside the real-time market, TSE also procures capacity for ancillary services in bilateral
contracts with suppliers.

CLIMATE CHANGE - Influence of the European Emission Trading System and the German and Polish Electricity Market
74
C. Fuel switch potential
Methodology
We assess the potential for short-term reduction of emissions given the existing fossil capacities
in Germany and Poland in 2017. In all calculations, total generation of fossil-based generation is
kept constant. Using empirical average carbon coefficients per MWh, we calculate emissions
based on annual generation. For all technologies we assume a maximum availability of installed
capacity of 90% with the remaining 10% accounting for maintenance shut-downs.40 CHP
generation is considered as must-run generation. We thus assume that production of these
plants is driven by heat demand and electricity is the by-product. The fuel-switch potential is
calculated keeping total generation of fossil-based technologies constant and swapping
generation from one technology to another accounting for capacity and must-run conditions.
Emission savings are then the difference between emissions in the different situations.
Our approach needs to be seen as a back-of-the envelope calculation. Our annual analysis
disregards many aspects important for fuel switching such as dynamic cost curves induced by
start-up and ramping cost as well as minimum run- and down-time constraints. Moreover,
keeping conventional capacity constant, our approach is static and specific to year 2017. I.e., we
do not account for the possible future decrease (e.g. nuclear phase-out) or increase (e.g.,
renewable generation) of other technologies. All of these considerations would require a more
sophisticated approach using numerical modelling.
Germany
We use observed generation as well as installed capacity from BMWi (2019). Based on our
assumptions, total emissions of Germany power production in 2017 were about 282 Mt CO2. The
major source of emission has been lignite electricity production with 170 Mt CO2 followed by
generation from hard coal (79 Mt CO2), and gas (33 Mt CO2).
Depending on relative fuel and carbon prices, four different situations can occur. (1) A lignite to
hard coal switch, would have the potential to reduce emissions by 42 Mt CO2 (however, this case
would require very high carbon prices and would only happen if there are no gas power plants
which could replace lignite generation). (2) Replacing hard coal by gas generation would save a
maximum of 30 Mt CO2. (3) Replacing lignite by gas production would save 75 Mt CO2. This
corresponds to the highly unlikely situation in which gas is cheaper than lignite but hard coal is
still more expensive than lignite production. Finally (4), a complete environmental dispatch in
which gas is dispatched first, followed by hard coal and then lignite, would save the maximum
amount of 103 Mt CO2.
There are two major conclusions from the analysis. First and foremost, even in the most
favourable situation of lignite replacing gas, the short-term abatement potential is only about
37% of emissions given the currently installed capacities. Thus, for a deep decarbonization of
the power sector, the fuel switching incentivized by the carbon price is not sufficient, but
investments in low or emission-free generation capacities are needed. Second, CHP capacities
only slightly prevent the short-term fuel-switch. In the case of an environmental dispatch only
40 In particular for gas-fired plants, lower shares of full-load hours are observed as these plants typically run as mid- to peak-load plants. There is, however, no technical reason avoiding higher full-load hours.

CLIMATE CHANGE - Influence of the European Emission Trading System and the German and Polish Electricity Market
75
additionally 9 MtCO2 could be avoided shutting down lignite CHP plants. This is due to the fact,
that most CHP plants are anyways less carbon-intense natural gas power plants.
Table 10: Fuel switching potential in Germany (2017)
Lignite Hard Coal Gas Total
Technical parameters
Carbon Coefficient [t CO2/MWh] 1.15 0.85 0.38
Maximum load factor 90% 90% 90%
2017 Situation
Capacity [GW] 23 30 28
Generation [TWh] 148 93 87 328
CHP Generation [TWh] 7 9 68
Emissions [Mt CO2] 170 79 33 282
Maximum generation
Theoretical max. generation [TWh] 182 236 218
Maximum replacement [TWh] 141 84 19
Lignite vs. Hard coal
Generation [TWh] 7 234 87 328
Emissions [Mt CO2] 9 198 33 240
Fuel switch potential [Mt CO2] 42
Hard Coal vs. Gas
Generation [TWh] 148 28 151 328
Emissions [Mt CO2] 170 24 58 252
Fuel switch potential [Mt CO2] 30
Lignite vs. Gas
Generation [TWh] 101 9 218 328
Emissions [Mt CO2] 116 8 83 207
Fuel switch potential [Mt CO2] 75
Environ-mental Dispatch
Generation [TWh] 7 103 218 328
Emissions [Mt CO2] 9 87 83 179
Fuel switch potential [Mt CO2] 103
Sources: Own calculations. Emission coefficients: UBA (2018). Maximum load factor: own assumption. Capacities and generation: BMWi (2019). CHP generation: UBA (2019).
Poland
Table 11 shows the same calculation for Poland. As we do not have information on CHP
generation by technology type for Polish power plants, we assume that CHP generation does not
hinder a fuel switch. Again, we distinguish four cases: (1) Given the large amount of installed
hard coal capacity, switching hard coal for lignite production would completely phase-out lignite
generation, saving about 16 Mt CO2 of emissions. (2) With 5 Mt CO2, the potential of switching
hard coal to gas generation is rather limited. (3) A dispatch in which natural gas is cheaper than
lignite production but hard coal still more expensive than lignite could even lead to an increase
of emissions of 1 MtCO2. This is due to the fact, that lignite production will then drive hard-coal
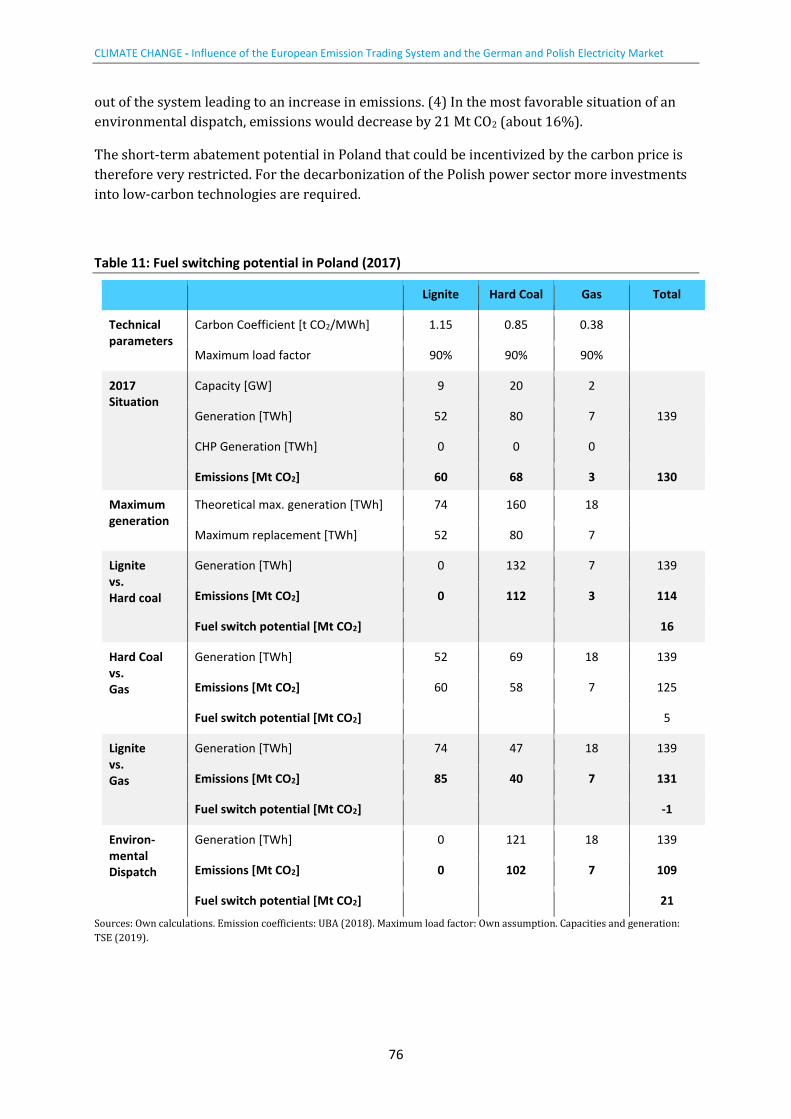
CLIMATE CHANGE - Influence of the European Emission Trading System and the German and Polish Electricity Market
76
out of the system leading to an increase in emissions. (4) In the most favorable situation of an
environmental dispatch, emissions would decrease by 21 Mt CO2 (about 16%).
The short-term abatement potential in Poland that could be incentivized by the carbon price is
therefore very restricted. For the decarbonization of the Polish power sector more investments
into low-carbon technologies are required.
Table 11: Fuel switching potential in Poland (2017)
Lignite Hard Coal Gas Total
Technical parameters
Carbon Coefficient [t CO2/MWh] 1.15 0.85 0.38
Maximum load factor 90% 90% 90%
2017 Situation
Capacity [GW] 9 20 2
Generation [TWh] 52 80 7 139
CHP Generation [TWh] 0 0 0
Emissions [Mt CO2] 60 68 3 130
Maximum generation
Theoretical max. generation [TWh] 74 160 18
Maximum replacement [TWh] 52 80 7
Lignite vs. Hard coal
Generation [TWh] 0 132 7 139
Emissions [Mt CO2] 0 112 3 114
Fuel switch potential [Mt CO2]
16
Hard Coal vs. Gas
Generation [TWh] 52 69 18 139
Emissions [Mt CO2] 60 58 7 125
Fuel switch potential [Mt CO2]
5
Lignite vs. Gas
Generation [TWh] 74 47 18 139
Emissions [Mt CO2] 85 40 7 131
Fuel switch potential [Mt CO2]
-1
Environ-mental Dispatch
Generation [TWh] 0 121 18 139
Emissions [Mt CO2] 0 102 7 109
Fuel switch potential [Mt CO2] 21
Sources: Own calculations. Emission coefficients: UBA (2018). Maximum load factor: Own assumption. Capacities and generation:
TSE (2019).