The European carbon balance. Part 3: forests - Main / … · The European carbon balance. Part 3:...
22
The European carbon balance. Part 3: forests S. LUYSSAERT * , P. CIAIS w , S. L. PIAO w , E.-D. SCHULZE z, M. JUNG z, S. ZAEHLE w , M. J. SCHELHAAS§, M. REICHSTEIN z, G. CHURKINA z, D. PAPALE } , G. ABRIL k, C. BEER z, J. GRACE **, D. LOUSTAU ww , G. MATTEUCCI zz, F. MAGNANI§§, G. J. NABUURS ***, H. VERBEECK w , M. SULKAVA }} , G. R. VAN DER WERF kk , I. A. JANSSENS * and members of the CARBOEUROPE-IP SYNTHESIS TEAM 1 *Department of Biology, University of Antwerpen, Universiteitsplein 1, 2610 Wilrijk, Belgium, wLaboratoire des Sciences du Climat et de l’Environnement, CEA CNRS UVSQ, 91191 Gif sur Yvette, France, zMax-Planck Institut fu ¨ r Biogeochemie, Hans-Knoell- Strasse 10, 07745 Jena, Germany, §Centre for Ecosystem Studies, Alterra, Wageningen UR, PO Box 47, NL-6700 AA Wageningen, the Netherlands, }Laboratory of Forest Ecology, Department of Forest Environment Science and Resource, University of Tuscia, DISAFRI, Via Camillo de Lellis, 01100 Viterbo, Italy, kDe ´partement de ge ´ologie et oce ´anographie, CNRS–UMR EPOC 5805, Universite ´ Bordeaux-1, avenue des Faculte ´s, 33405 Talence, France, **Institute of Atmospheric and Environmental Science, School of GeoSciences, The University of Edinburgh, Edinburgh EH9 3JN, Scotland, UK, wwUR1263 EPHYSE, 33883, Villenave d’Ornon, France, zzCNR-ISAFOM, Via Cavour 4-6, 87036 Rende, Italy, §§Department of Fruit Tree and Woody Plant Science, University of Bologna, Bologna I-40127, Italy, }}Department of Information and Computer Science, Helsinki University of Technology, PO Box 5400, Helsinki 02015 TKK, Finland, kkFaculty of Earth and Life Sciences, Vrije Universiteit, Amsterdam, the Netherlands, ***European Forest Institute Torikatu 34, 80100 Joensuu, Finland Abstract We present a new synthesis, based on a suite of complementary approaches, of the primary production and carbon sink in forests of the 25 member states of the European Union (EU-25) during 1990–2005. Upscaled terrestrial observations and model-based approaches agree within 25% on the mean net primary production (NPP) of forests, i.e. 520 75 g C m 2 yr 1 over a forest area of 1.32 10 6 km 2 to 1.55 10 6 km 2 (EU-25). New estimates of the mean long-term carbon forest sink (net biome production, NBP) of EU-25 forests amounts 75 20 g C m 2 yr 1 . The ratio of NBP to NPP is 0.15 0.05. Estimates of the fate of the carbon inputs via NPP in wood harvests, forest fires, losses to lakes and rivers and heterotrophic respiration remain uncertain, which explains the considerable uncertainty of NBP. Inventory-based assessments and assumptions suggest that 29 15% of the NBP (i.e., 22 g C m 2 yr 1 ) is sequestered in the forest soil, but large uncertainty remains concerning the drivers and future of the soil organic carbon. The remaining 71 15% of the NBP (i.e., 53 g C m 2 yr 1 ) is realized as woody biomass increments. In the EU-25, the relatively large forest NBP is thought to be the result of a sustained difference between NPP, which increased during the past decades, and carbon losses primarily by harvest and hetero- trophic respiration, which increased less over the same period. Keywords: covariance, ecosystem models, eddy, EU-25, forest inventories, greenhouse gas balance Received 21 January 2009; revised version received 21 January 2009 and accepted 19 July 2009 Introduction Forests have supplied energy, fodder, food and con- struction materials as well as a grazing opportunity for centuries and have been exploited as such throughout the history of Europe. In Europe, periods of large-scale deforestation and reforestation have followed each other since the Roman era, with different chronologies in different parts of Europe. The latest reforestation period followed World War II (UN-ECE & FAO, 2000b). Despite the reforestation efforts, most European forests were heavily depleted in carbon both in the soil and in the aboveground biomass by 1950, because of the harvesting of wood and litter (i.e., Behre, 1988; Bradshaw, 2004; Bu ¨ rgi & Gimmi, 2007). Since the 1950s, forest management moved toward intensive multipurpose systems which optimize several services including wood production, soil and water protection, recreation and conservation. The tendency to move away from solely production forests can be seen for instance, in the area of forests with a primarily Correspondence: S. Luyssaert, e-mail: sebastiaan.luyssaert@ ua.ac.be 1 M. Vetter, J. D. Paris, O. Bouriaud, P. Peylin, N. Viovy, N. Vuichard, A. Freibauer Global Change Biology (2010) 16, 1429–1450, doi: 10.1111/j.1365-2486.2009.02056.x r 2009 Blackwell Publishing Ltd 1429
Transcript of The European carbon balance. Part 3: forests - Main / … · The European carbon balance. Part 3:...

The European carbon balance. Part 3: forests
S . L U Y S S A E R T *, P. C I A I S w , S . L . P I A O w , E . - D . S C H U L Z E z, M . J U N G z, S . Z A E H L E w ,
M . J . S C H E L H A A S § , M . R E I C H S T E I N z, G . C H U R K I N A z, D . PA PA L E } , G . A B R I L k,C . B E E R z, J . G R A C E **, D . L O U S T A U w w , G . M AT T E U C C I zz, F . M A G N A N I § § ,
G . J . N A B U U R S ***, H . V E R B E E C K w , M . S U L K AVA } } , G . R . V A N D E R W E R F kk,I . A . J A N S S E N S * and m e m b e r s o f t h e C A R B O E U R O P E - I P S Y N T H E S I S T E A M 1
*Department of Biology, University of Antwerpen, Universiteitsplein 1, 2610 Wilrijk, Belgium, wLaboratoire des Sciences du Climat
et de l’Environnement, CEA CNRS UVSQ, 91191 Gif sur Yvette, France, zMax-Planck Institut fur Biogeochemie, Hans-Knoell-
Strasse 10, 07745 Jena, Germany, §Centre for Ecosystem Studies, Alterra, Wageningen UR, PO Box 47, NL-6700 AA Wageningen,
the Netherlands, }Laboratory of Forest Ecology, Department of Forest Environment Science and Resource, University of Tuscia,
DISAFRI, Via Camillo de Lellis, 01100 Viterbo, Italy, kDepartement de geologie et oceanographie, CNRS–UMR EPOC 5805,
Universite Bordeaux-1, avenue des Facultes, 33405 Talence, France, **Institute of Atmospheric and Environmental Science, School of
GeoSciences, The University of Edinburgh, Edinburgh EH9 3JN, Scotland, UK, wwUR1263 EPHYSE, 33883, Villenave d’Ornon,
France, zzCNR-ISAFOM, Via Cavour 4-6, 87036 Rende, Italy, §§Department of Fruit Tree and Woody Plant Science, University of
Bologna, Bologna I-40127, Italy, }}Department of Information and Computer Science, Helsinki University of Technology, PO Box
5400, Helsinki 02015 TKK, Finland, kkFaculty of Earth and Life Sciences, Vrije Universiteit, Amsterdam, the Netherlands,
***European Forest Institute Torikatu 34, 80100 Joensuu, Finland
Abstract
We present a new synthesis, based on a suite of complementary approaches, of the primaryproduction and carbon sink in forests of the 25 member states of the European Union (EU-25)during 1990–2005. Upscaled terrestrial observations and model-based approaches agree within25% on the mean net primary production (NPP) of forests, i.e. 520� 75 g C m�2 yr�1 over a forestarea of 1.32� 106 km2 to 1.55� 106 km2 (EU-25). New estimates of the mean long-term carbonforest sink (net biome production, NBP) of EU-25 forests amounts 75� 20 g C m�2 yr�1. The ratioof NBP to NPP is 0.15� 0.05. Estimates of the fate of the carbon inputs via NPP in wood harvests,forest fires, losses to lakes and rivers and heterotrophic respiration remain uncertain, whichexplains the considerable uncertainty of NBP. Inventory-based assessments and assumptionssuggest that 29� 15% of the NBP (i.e., 22 g C m�2 yr�1) is sequestered in the forest soil, but largeuncertainty remains concerning the drivers and future of the soil organic carbon. The remaining71� 15% of the NBP (i.e., 53 g C m�2 yr�1) is realized as woody biomass increments. In the EU-25,the relatively large forest NBP is thought to be the result of a sustained difference between NPP,which increased during the past decades, and carbon losses primarily by harvest and hetero-trophic respiration, which increased less over the same period.
Keywords: covariance, ecosystem models, eddy, EU-25, forest inventories, greenhouse gas balance
Received 21 January 2009; revised version received 21 January 2009 and accepted 19 July 2009
Introduction
Forests have supplied energy, fodder, food and con-
struction materials as well as a grazing opportunity for
centuries and have been exploited as such throughout
the history of Europe. In Europe, periods of large-scale
deforestation and reforestation have followed each
other since the Roman era, with different chronologies
in different parts of Europe. The latest reforestation
period followed World War II (UN-ECE & FAO,
2000b). Despite the reforestation efforts, most European
forests were heavily depleted in carbon both in the soil
and in the aboveground biomass by 1950, because of
the harvesting of wood and litter (i.e., Behre, 1988;
Bradshaw, 2004; Burgi & Gimmi, 2007).
Since the 1950s, forest management moved toward
intensive multipurpose systems which optimize several
services including wood production, soil and water
protection, recreation and conservation. The tendency
to move away from solely production forests can be
seen for instance, in the area of forests with a primarily
Correspondence: S. Luyssaert, e-mail: sebastiaan.luyssaert@
ua.ac.be
1M. Vetter, J. D. Paris, O. Bouriaud, P. Peylin, N. Viovy,
N. Vuichard, A. Freibauer
Global Change Biology (2010) 16, 1429–1450, doi: 10.1111/j.1365-2486.2009.02056.x
r 2009 Blackwell Publishing Ltd 1429

protective function (i.e., climate, coastal, avalanche,
wind protection and erosion protection) which
increased from 1.0� 106 km2 in 1990 to 1.4� 106 km2 in
2005 for the European continent including Russia,
Belarus and Ukraine (FAO, 2007). The surface area
of forests with a primary biodiversity conservation
function increased from 0.10� 106 km2 in 2000 to
0.12� 106 km2 in 2005 for the European Union (EU)
and EFTA countries (UN-ECE & FAO, 2007).
Today, forests cover, depending on the source and the
definition of forest, 1.32 (EEA, 2007) to 1.55� 106 km2
(UN-ECE & FAO, 2007) of the EU-25 (for a list of
abbreviations see P. Ciais et al.) area and the improve-
ment of silvicultural practices together with increased
atmospheric CO2 concentrations and nitrogen deposi-
tion has led to a substantial increase in growth across
Europe (Nabuurs et al., 2003). Despite the intensive
management that resulted in an absolute increase of
wood harvest, European forests have continued to
accumulate carbon at a high rate in their biomass
(Janssens et al., 2003) and soils (Schulze, 2000). This
carbon sequestration is thought to be the result of a
sustained difference between net primary productivity
(NPP), which increased during the past decades, and
carbon losses by harvest and heterotrophic respiration
(Rh), which increased less strongly over the same period.
� The goal of this paper is to contribute to a better level
of understanding of the productivity and carbon
balance of European forests in relation to other
terrestrial ecosystems such as croplands (P. Ciais
et al.) and grasslands (P. Ciais et al.). Here, from a
large database of ecological sites, we analyze
repeated extensive forest inventories, and the output
of biogeochemical models in order to address the
following questions:
� What is the net biome production (NBP), and NPP
of forests in the EU-25, as estimated by each inde-
pendent data stream?
� What is the fate of the carbon incorporated in
biomass and soils, and its return to the atmosphere?
� How does the long-term carbon balance or NBP
relate to NPP?
Components of the carbon balance
A general description of the carbon balance is given in
P. Ciais et al. (this thematic issue, part 1). In forests, the
bulk of NPP is allocated to the production of biomass in
different plant components: foliage, wood (including
branches and stems) and roots (including coarse and
fine roots). However, because not all of the produced
biomass remains on site, direct measurements of total
NPP are impossible and removed biomass needs to be
corrected for. Examples of biomass removal processes
include harvest, and natural herbivory by insects and
mammals. In addition other components of NPP are
rarely measured such as understory plant growth, repro-
ductive organs, emission of volatile organic compounds
(VOC), exudation from roots and carbon transfer to root
symbionts. The sum of all these components is the total
ecosystem NPP. However, depending on the ecosystem
some of these components are difficult to measure and
of minor importance. For example, biogenic emission of
isoprene totaled 3.5 g C m�2 yr�1 for the EU-15 plus
Norway and Switzerland (Arneth et al., 2008) and total
VOC emission, for which isoprene emissions is respon-
sible for about half totaled 6 g C m�2 yr�1 from forests in
France (Simon et al., 2001). In this paper, NPP of forest
denotes the sum of NPPfoliage, NPPwood and NPProots.
The net ecosystem carbon balance (NECB) is the term
applied to the total rate of organic carbon accumulation
(or loss) from ecosystems (Chapin et al., 2005). When
integrated over time and space the NECB equals the
NBP (Schulze & Heimann, 1998; Buchmann & Schulze,
1999; Chapin et al., 2005). In this study, NBP of forest is
quantified as: NBP 5 NEP�D�F�H and thus, did not
account for VOC and methane (CH4) losses and nitrous
(N2O) flux (Goldberg & Gebauer, 2009). Where NEP is
the net ecosystem production, D are losses through
rivers and lakes, F are losses through fires and H stands
for harvest. As our NPP estimate did not include VOC
production, the omission of VOC production from
NBP does not affect our estimate of NBP. However,
the omission of herbivory from NPP and CH4 from the
NBP estimate could result in small biases of the forest
NBP depending on the method (i.e., contrary to ecolo-
gical site studies, inventory-based NBP estimates
account for herbivory).
Materials and methods
Study area
The biogenic sinks and sources, representing the photo-
synthetic carbon uptake, respiratory and nonrespiratory
releases, are estimated for forests in Europe. Our defini-
tion of forest followed the land use classification of the
underlying data sources: for ecological site studies, we
followed the classification of the principal investigator
of the site; for forest inventories, we followed the
national classification and when data came from eco-
system models, we followed the CORINE land use
classification (EEA, 2007). Further, Europe was defined
as the 25 member states of the European Union i.e.,
Austria, Belgium, Cyprus, Czech Republic, Denmark,
Estonia, Finland, France, Germany, Greece, Hungary,
1430 S . L U Y S S A E R T et al.
r 2009 Blackwell Publishing Ltd, Global Change Biology, 16, 1429–1450

Ireland, Italy, Latvia, Lithuania, Luxembourg, Malta,
Netherlands, Poland, Portugal, Slovakia, Slovenia,
Spain, Sweden and United Kingdom.
In general, the numbers represent the mean values for
the EU-25 for the last decade and a half (Table 1).
However, with the need to understand better regional
details in the carbon cycle’s response to perturbations
and gradual changes, boreal, temperate and Mediterra-
nean forest biomes are discussed separately in sections.
Despite the general nature of the results, estimates at
the EU-25 level are derived from spatially explicit data
sets and models. There are inevitable inconsistencies in
the various input data set and methodologies that were
used and presented.
Data sources
Most of the results presented here are data or model
results, which were prepared between 2003 and 2008
(Fig. 1). References to these data or models are given in
Table 2. When other data were needed to complete the
analyses or discussion, in-text citations are given.
Inventories. We analyzed regionally aggregated statistics
of 30 European countries, of which 20 countries are from
the EU-25 over the period from 1990 to 1999. Data on
growing stock, increment, harvest, species composition
and forest area were collected from 400 000 plots through
national inventories. In their most basic form, inventory
surveys measure stand density and tree dimensions
(diameter, height) at consecutive dates. These mea-
surements were used to calculate whole tree biomass
increments by means of species-specific allometric
relationships (Goodale et al., 2002; Liski et al., 2002,
2003; Nabuurs et al., 2003). Subsequently, tree biomass
increments and appropriate turnover rates for leaves and
fine roots are used to estimate the litter fall. NPP was
estimated by summing tree biomass increments and
litter fall. Finally, NPP in combination with a
heterotrophic respiration model (Liski et al., 2002, 2003;
Nabuurs et al., 2003) are used to calculate carbon pool
changes and the net carbon balance of individual forests.
We used statistics in which national level averages per
species group are provided for growing stock, increment,
harvest and forest area. For Finland, Sweden, Ireland and
Spain, uncertainties were estimated based on the
allometric relationships, reported statistics and applied
soil models (Meyer et al., 2005). In this study, the
coefficients of variations for these four countries were
averaged and applied to the EU-25 estimates: 4.5% for
the biomass carbon pool, 25% for the biomass carbon
sink, 45% for the soil carbon pool and 30% for the soil
carbon sink (Meyer et al., 2005).
Leaching of carbon from terrestrial ecosystems was
calculated as the sum of CO2 outgassing and the carbon
load in inland waters. Organic and inorganic carbon
concentrations in inland water and river discharge were
compiled using the main European rivers database
(Meybeck & Ragu, 2006) and extrapolated for the
European sea’s catchments (8.2� 106 km2) on the basis
of runoff, land cover and rock types similarities (Ciais
et al., 2008a). The additional carbon loss as CO2
outgassing from rivers, lakes and estuaries was derived
from a previous estimate at the European scale (Ciais
et al., 2008a) that considered the ecosystem’s typical
average water–air CO2 fluxes and river, lakes and
Table 1 Spatial and temporal coverage of the different methods
Method Spatial coverage/upscaled to Temporal coverage
National inventories and
removal statistics
EU-25 excluding Malta, Cyprus, Estonia, Latvia and
Lithuania but including Albania, Bosnia, Herzegovina,
Bulgaria, Croatia, Macedonia, Norway
Romania, Switzerland, Turkey and Yugoslavia
1990–1999
River database European watershed draining into the Artic Sea,
Baltic Sea, North Sea, Atlantic Ocean, Mediterranean
sea and Black sea
1980–2000
Direct measurement, NPP EU-25 1971–2006
Direct measurement, Rh EU-25 1991–2005
Eddy covariance, NEP EU-25 1996–2006
BIOME-BGC EU-25 1980–2005
CASA EU-25 1997–2006
LPJ-DGVM EU-25 1980–2005
Modified LPJ EU-15 1990–2000
ORCHIDEE EU-25 1980–2005
EU-25, 25 member states of the European Union; NPP, net primary production; Rh, heterotrophic respiration; NEP, net ecosystem
CO2 production.
E U R O P E A N C A R B O N B A L A N C E 1431
r 2009 Blackwell Publishing Ltd, Global Change Biology, 16, 1429–1450

estuaries surface areas (Lehner & Doll, 2004). This sum
was then corrected by the ratio of organic over total
carbon concentrations in inland water (Ciais et al., 2007).
The number represents the average estimate and the
contributions of forests, grasslands and croplands
cannot be separated. The uncertainty of the estimated
leaching depends on the uncertainty in both terms and
the ratio. The uncertainty of 30% was calculated as the
spatio-temporal variability within the relevant databases.
Ecological site studies. Estimates of NPP, NEP and Rh
were collected from peer-reviewed literature, established
databases and personal communication with research
groups involved in the regional networks of FLUXNET
(Baldocchi et al., 2001). The NEP estimates that were
included in our data set (Luyssaert et al., 2007) were
typically derived from eddy covariance measurements of
net ecosystem exchange (NEE). NPP estimates were
included in our data set when they were based on
direct measurements of foliage, wood and root NPP.
Only estimates based on in situ measurements of fine-
root production were included. Estimates of Rh were
included when based on subtracting upscaled chamber
measurements of root respiration (Hanson et al., 2000)
from undisturbed soil respiration measurements or from
chamber measurements after trenching or girdling. Also
Rh estimates based on isotopes or soil C mineralization
(Persson et al., 2000) were included. In the following text,
Fig. 1 Summary of the 25 member states of the European Union (EU-25) forest carbon cycle. Fluxes in Tg C yr�1 over a forest area of
1.46� 106 km2. Heterotrophic respiration was calculated as the residual term to make the balance close, the observed heterotrophic
respiration is 600 � 45 Tg C yr�1. 16 Tg C yr�1 out of 685 Tg C yr�1 (the sum of wood harvest, fires and Rh) is due to natural disturbances
such as fires, storms and pests. The total sink of 109 � 45 Tg C yr�1 was estimated to be for almost 40% (40 Tg C yr�1) due to land use
change. The uncertainties show the standard deviation of the variability across approaches, hence, low uncertainties indicate
convergence between methods.
1432 S . L U Y S S A E R T et al.
r 2009 Blackwell Publishing Ltd, Global Change Biology, 16, 1429–1450
these types of studies were called ecological or intensive
site studies.
Site-level NPP estimates were upscaled to the EU-25
by estimating the fluxes as the mean flux of the nearest
three observations weighted by their inverse distance in
climate space, where climate space was defined by
radiation and precipitation during the growing season.
The growing season was defined by the months with a
mean temperature above 3 1C. Temperature was thus
implicitly included in the analysis as it determined the
length of the growing season. Climate data were
extracted from harmonized data sets between 1990 and
2002 (Mitchell & Jones, 2005) and incoming radiation
was calculated based on harmonized cloud cover data
between 1990 and 2002 using the respective submodel
from ORCHIDEE (Krinner et al., 2005). Subsequently, the
region-specific weighted mean was calculated by
weighting the flux estimates by the appropriate forest
area. Forest area and distribution were taken from
Loveland et al. (2000).
The controls of NPP, NEP and Rh were quantified by
means of a multiplicative regression model of two power
functions quantifying the relationship of radiation and
precipitation during the growing season with the carbon
fluxes under study.
FLUX ¼ a� fðradiationÞ � fðprecipitationÞ; ð1Þ
where f (radiation) 5 (radiation sum during growing
season)b, f (precipitation) 5 (precipitation sum during
growing season)c and a, b and c are fitted to the data.
Further, linear relationships were fitted to NPP, NEP
and Rh stratified according to management regime or N-
deposition class. ANCOVA was used to test for statistical
differences of the regressions statistic between mana-
gement and deposition classes. N-deposition classes
were based on ground observations (EMEP, NADP and
NDDN) of several N species that are available for
Western Europe and the conterminous USA (Holland
et al., 2005) and model simulations (Galloway et al., 2004;
Dentener, 2006) for the rest of the world.
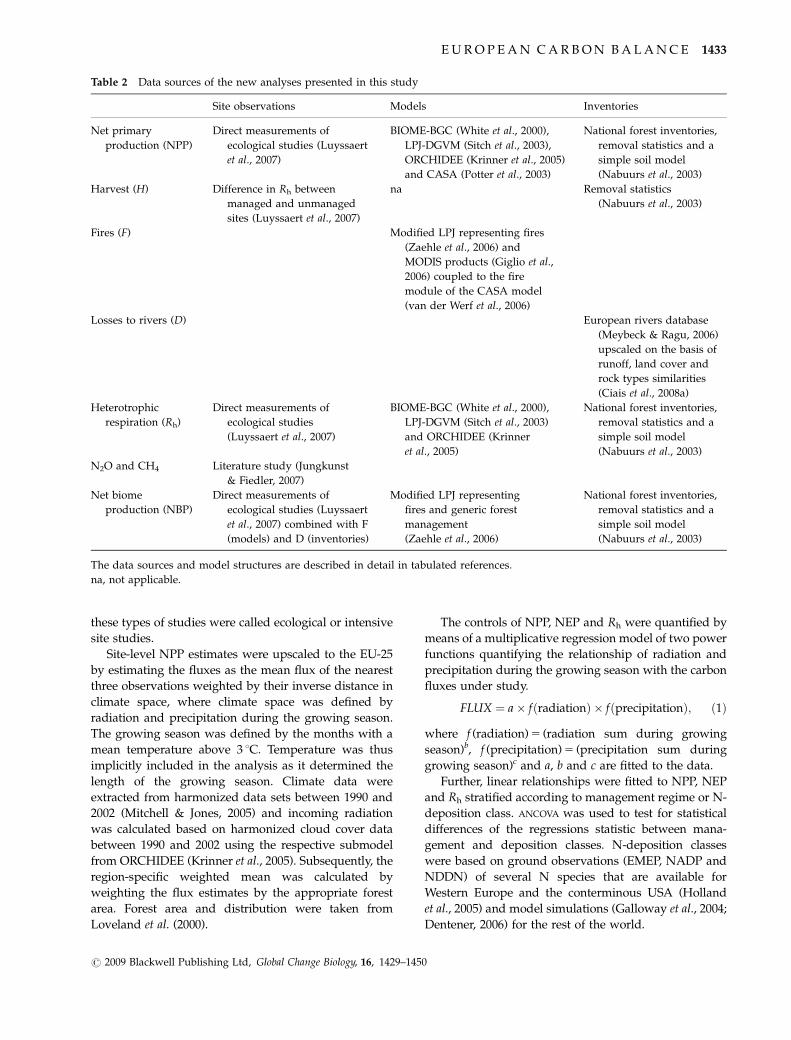
Table 2 Data sources of the new analyses presented in this study
Site observations Models Inventories
Net primary
production (NPP)
Direct measurements of
ecological studies (Luyssaert
et al., 2007)
BIOME-BGC (White et al., 2000),
LPJ-DGVM (Sitch et al., 2003),
ORCHIDEE (Krinner et al., 2005)
and CASA (Potter et al., 2003)
National forest inventories,
removal statistics and a
simple soil model
(Nabuurs et al., 2003)
Harvest (H) Difference in Rh between
managed and unmanaged
sites (Luyssaert et al., 2007)
na Removal statistics
(Nabuurs et al., 2003)
Fires (F) Modified LPJ representing fires
(Zaehle et al., 2006) and
MODIS products (Giglio et al.,
2006) coupled to the fire
module of the CASA model
(van der Werf et al., 2006)
Losses to rivers (D) European rivers database
(Meybeck & Ragu, 2006)
upscaled on the basis of
runoff, land cover and
rock types similarities
(Ciais et al., 2008a)
Heterotrophic
respiration (Rh)
Direct measurements of
ecological studies
(Luyssaert et al., 2007)
BIOME-BGC (White et al., 2000),
LPJ-DGVM (Sitch et al., 2003)
and ORCHIDEE (Krinner
et al., 2005)
National forest inventories,
removal statistics and a
simple soil model
(Nabuurs et al., 2003)
N2O and CH4 Literature study (Jungkunst
& Fiedler, 2007)
Net biome
production (NBP)
Direct measurements of
ecological studies (Luyssaert
et al., 2007) combined with F
(models) and D (inventories)
Modified LPJ representing
fires and generic forest
management
(Zaehle et al., 2006)
National forest inventories,
removal statistics and a
simple soil model
(Nabuurs et al., 2003)
The data sources and model structures are described in detail in tabulated references.
na, not applicable.
E U R O P E A N C A R B O N B A L A N C E 1433
r 2009 Blackwell Publishing Ltd, Global Change Biology, 16, 1429–1450

In general, uncertainties in the flux estimates have not
been reported in the literature. Therefore, we estimated
the total uncertainty for every component flux contained
in the data set using a consistent framework based
on expert judgment (Taylor & Kuyatt, 1994). A prior
uncertainty, depending on the latitude was determined
by expert judgment. This prior can be seen as an estimate
of NPP in the absence of any measurement. Because
all our NPP estimates were based on measurements this
prior uncertainty was reduced by a reduction factor
which depends on the method and the length of the
time series. For more details on this approach, see
Luyssaert et al. (2007). Thus, the uncertainty framework
in the database was designed to account for differences
in data quality between sites owing to length of time
series (e.g., inter-annual variability) and methodology
(e.g., eddy covariance).
These uncertainties were fully accounted for in the
statistical analyses by means of Monte Carlo simulations.
Within each Monte Carlo simulation, normally distributed
random errors, based on the uncertainty framework of the
database, were added to the observed fluxes. The Monte
Carlo-based uncertainties, however, do not account
for representativeness of the site observations currently
in the database. As a proxy for the latter uncertainty,
we upscaled the fluxes to the EU-25 for 100 realizations,
each realization using 90% of the available sites. The
reported uncertainties combine the standard deviation
of the Monte Carlo simulations and network represen-
tativeness. Uncertainty in the climate data used for
upscaling are not accounted for.
In parallel, an artificial neural network similar to
the one described in Papale & Valentini (2003) was used
to upscale the site-level eddy covariance measurements to
the EU-25. Many of the eddy covariance sites used to train
the neural network were also included in the upscaling
approach described above. When being upscaled, there
are three main sources of uncertainty in the eddy
covariance data: uncertainty in the data used to train the
neural network, uncertainty in the climate data used for
upscaling and uncertainty in the representativeness of the
network. Despite the recent progress in estimating the
uncertainty and consistency of the eddy covariance data
(Papale et al., 2006; Richardson et al., 2006; Moffat et al.,
2007; Lasslop et al., 2008; Luyssaert et al., 2009), the
uncertainty of the neural network which is used to
upscale these data has not been determined yet.
A proxy for the neural network uncertainty was
calculated for 32 sites in Europe. The neural network
was trained with one year of data for 31 sites, the
trained network was then used to estimate the NEE at
the site that had been removed from the training set. This
approach mimics the uncertainty in the observations and
representativeness of the network but does not deal with
uncertainty in the climate data used for upscaling. Also,
this proxy for uncertainty is estimated at the site level.
Compensation of site-level errors during upscaling may
result in similar or lower uncertainties at the regional than
that at the site level.
Ecosystem models. BIOME-BGC, LPJ-DGVM and
ORCHIDEE (Table 2) were applied for the European
continent at a spatial resolution of 25 km� 25 km using
harmonized climate, land cover and soil input data
(Vetter et al., 2008), and their output was averaged
over the EU-25. These models calculated NPP
between 1980 and 2005 as a function of climate, soil
properties and increasing atmospheric CO2. None of
these models account for disturbances, regrowth and
management, although a modified version of LPJ
including human-induced fires and generic forest
management was run to simulate NBP of the EU-15
(Zaehle et al., 2006, 2007). The modified version of LPJ
evaluated the model estimates against yield tables and
regional age-based forest statistics. Further, this version
simulated the propagation of age-classed vegetation
through time and accounted for changes in forest
area, harvest derived from resource use statistics and
process-based calculation of NPP, Rh, H and F that
accounted for size-dependent growth. The modified
version of LPJ also included a regional fire module
that allowed to estimate carbon losses because of
forest fires (Zaehle et al., 2006).
A second version of BIOME-BGC, including a nitrogen
cycle, was used to account for the effects of increases in
atmospheric N deposition (Churkina et al., 2007). In the
BIOME-BGC model plant demand for nitrogen is calcu-
lated from potential gross primary productivity and
carbon to nitrogen ratios of plant organs. Demand of
soil microbial community for nitrogen is determined by
potential litter and soil organic matter available for
decomposition and carbon to nitrogen ratios of corres-
ponding pools. Carbon to nitrogen ratios of plant organs
and leaf litter are assumed to stay constant. The amount
of nitrogen available to satisfy this demand is computed
as the sum of nitrogen deposited from atmosphere,
biological fixation and nitrogen mineralized from soil
organic matter decomposition. Possible forest dieback
subjected to high nitrogen inputs was not considered in
this study, because the atmospheric nitrogen depositions
were averaged over relatively coarse grid cells and did
not reach the high values, which could cause nutritional
imbalance of forests. Detailed description of nitrogen
cycle in the BIOME-BGC model can be found elsewhere
(Thornton, 1998 #2072).
Output from all three models comes with an
uncertainty caused by driver (e.g., the climate data used
to drive the model simulations), structural (e.g., equations
1434 S . L U Y S S A E R T et al.
r 2009 Blackwell Publishing Ltd, Global Change Biology, 16, 1429–1450

for soil respiration) parametric (e.g., setting for maximum
stomatal conductance) and flux definition (e.g., exclud-
ing understory vegetation in NPP) uncertainties, which
are all intermingled and cannot be easily teased apart.
Complete uncertainty analysis are not available yet,
therefore, we report the driver uncertainty which
amounted 25% for GPP (Jung et al., 2007a) and 40% for
NPP (Zhao et al., 2006). For both Rh and NEP, the para-
metric uncertainty of 30% (Zaehle et al., 2005; Trusilova
et al., 2009) was used.
To estimate fire emissions (van der Werf et al., 2006),
we also compiled simulated NPP from CASA, a satellite-
driven vegetation model. CASA was run at 11� 11 spatial
resolution, forced by distinct climate and land cover data
sets compared with the other three models. Carbon
released through forest fire emissions (F) was estimated
by coupling the Terra Moderate Resolution Imaging
Spectroradiometer (MODIS) data with the fire module
of the CASA model (van der Werf et al., 2006). Forest fire
emissions were estimated monthly for the period 1997–
2006. The burned fraction of each 11� 11 grid cell was
estimated based on MODIS satellite data of burned area
and fire hot spots (Giglio et al., 2006). In the absence of a
framework that accounts for uncertainties in CASA-
derived NPP and MODIS classification, interannual
variability was used as a proxy for the uncertainty in
fire emissions and a driver uncertainty of 40% (Zhao et al.,
2006) as a proxy for the uncertainty of NPP.
Results and discussion
NPP
Estimates of NPP. The European (EU-25) forest NPP
based on inventories was 447 � 112 g C m�2 yr�1 (Table
3). Upscaled stand-based NPP measurements from
intensive ecological site studies (Luyssaert et al., 2007)
estimated a mean NPP of 544 � 90 g C m�2 yr�1 for
European forests (Table 3). The inventory-based and
upscaled stand-level forest NPP values can be
compared with the NPP simulated across the EU-25
by four process-based vegetation models (Table 2).
Except for CASA which calculates NPP from satellite-
derived NDVI, these models calculated NPP as a
function of climate, soil properties and increasing
atmospheric CO2. The mean NPP value from BIOME-
BGC and CASA, respectively, 439 � 176 and
461 � 184 g C m�2 yr�1 are comparable with the forest
inventory estimate of 447 � 112 g C m�2 yr�1, while LPJ-
DGVM and ORCHIDEE give somewhat higher values
of 524 � 210 and 574 � 230 g C m�2 yr�1, respectively,
and are close to the upscaled stand-level NPP.
The NPP estimate for the modified version of LPJ-
DGVM (638 � 255 g C m�2 yr�1) exceeds all other
estimates. Contrary to the other models, the modified
LPJ-DGVM accounts for regrowth and age structure
of the EU forests. This could explain why the estimate
Table 3 Forest component fluxes (values in gC m�2 yr�1) over EU-25 from different methods
Method GPP NPP NEP Rh H F D NEP/NPP NBP* NBP/NPP
Inventories
National forest
inventories
na 447 � 112 160 � 20 287 � 115 61 � 3 na na 0.36 � 0.1 89 � 19 0.19 � 0.1
Soil losses to rivers na na na na na na 9.6 � 3.2 na na na
Ecological sites
Sites studies 1199 � 77 544 � 90 200 � 52w 387 � 59 88 � 21 na na 0.37 � 0.1 75 � 100w 0.14 � 0.3
Eddy covariance 1107 � 350 na 197 � 260 na na na na na na na
Vegetation models
BIOME-BGC 985 � 246 439 � 176 42 � 13 397 � 119 na na na 0.09 � 0.3 na na
LPJ-DGVM 899 � 225 524 � 210 19 � 6 505 � 151 na na na 0.04 � 0.3 na na
Modified LPJ 638 � 255 125 � 38 511 � 153 64 � 4 7.0 � na 63 � 19 0.10 � 0.3
ORCHIDEE 1183 � 295 574 � 230 47 � 14 527 � 158 na na na 0.08 � 0.3 na na
CASA na 461 � 184 na na na 4.7 � 1.3 na na na na
Forest component fluxes were updated with observation and model-based methods. The uncertainties show the standard deviation.
Different methods report different uncertainties and method-specific definitions for uncertainty are provided in the section ‘Materials
and methods’. Consequently, low uncertainties do not necessarily indicate precise methods. Values in bold were used in Fig. 1.
*Inventory- and model-based NBP estimates account for C sink because of afforestation. The NBP estimate based on upscaling
ecological site measurements likely underestimate the contribution of afforestation (see NBP estimates).
wEddy covariance-based NEP and biometric-based NEP differ by 40 g C m�2 yr�1. Consequently, NBP is estimated as a range.
EU-25, 25 member states of the European Union; GPP, Gross primary productivity; NPP, net primary productivity; NEP, net
ecosystem CO2 production; Rh, heterotrophic respiration; H, harvest; F, losses through Fires; D, losses to rivers; NBP, net biome
production; na, not applicable.
E U R O P E A N C A R B O N B A L A N C E 1435
r 2009 Blackwell Publishing Ltd, Global Change Biology, 16, 1429–1450

is higher than the NPP of the other models and the eco-
logical site estimate but does not explain why the
estimate is higher than the inventory-based NPP
which also account for regrowth and age structure.
BIOME-BGC, the only model that includes a nitrogen
cycle and accounts for N deposition, estimated the
lowest mean NPP (Table 3). Comparison of BIOME-
BGC simulations with and without nitrogen cycle, all
other drivers kept constant, shows that not accounting
for N deposition results in an 11 � 30% lower NPP for
the EU-25 (Fig. 2). This result indicates that N limitation
effects on NPP might not be ignored, and can lead to
overestimation of NPP. However, the reduction in
northern Europe and the southern Iberian Peninsula is
negligible, whereas not accounting for N deposition
could result in underestimating NPP by as much as
20% in high N-deposition regions in central Europe
(Fig. 2). Because the model assumes a continuous
vegetation cover, urban-island artifacts can be observ-
ed, i.e. an increase in NPP is predicted in areas that are
currently urban and have no substantial NPP.
Models also have systematic regional or biome-
specific NPP differences with ecological sites and
inventories. For example, ORCHIDEE and BIOME-BGC
overestimated GPP in boreal forests by 200 g C m�2 yr�1
(compared with eddy-covariance-based estimates) and
hence NPP possibly by 50–100 g C m�2 yr�1, probably
because of overestimated LAI (Jung et al., 2007a). In
Mediterranean forests, ORCHIDEE, LPJ-DGVM and
BIOME-BGC underestimated GPP compared with
eddy covariance sites. The tendency of all three models
to underestimate GPP in the water limited part of Europe
indicates either issues of model structure regarding
their soil hydrology, questionable meteorological input
data over this region or biased evaluation sites (Jung
et al., 2007a).
Despite the large methodological differences, the mean
forest NPP of the different approaches compare within
25% of each other. It is not possible to move one of these
estimates forward as being the best estimate, since all are
expected to have comparable uncertainties (Table 3)
originating from different problems. The estimate based
on the ecological sites probably represents the upper
bound of the NPP. Ecological studies provide high-
quality data at the site level but, their upscaling to the
EU-25 level heavily depends on the representativeness of
the available data. A lack of measurements in low
productive sites, i.e., recently disturbed forests and
shrublands, and not accounting for soil fertility in the
upscaling procedure may have led to overestimation of
NPP for the EU-25. On the other hand, the inventories
which are based on 400 000 plots are representative at the
EU-25 level but use general relationships to expand
measured stem wood NPP to ecosystem NPP. Even
small errors in the expansion factors for branches,
foliage and root NPP could result in a substantially
underestimated EU-25 NPP. As an example, the fraction
of foliage and root NPP to the total NPP equals 0.35 in the
inventory data, compared with values of 0.50 for conifers
and 0.45 for broadleaved forests obtained from ecological
site studies. Adding low productive sites to the network
of ecological sites or applying regional expansion factors
in the inventories would likely result in convergence of
the inventory and ecological approach. Nonetheless, the
robustness of NPP derived from independent methods is
encouraging and shows that the ecosystem models and
the inventory-based approaches are consistent with each
other (see ‘Controls of NPP’).
Controls of NPP. Based on a global compilation of
ecological site studies (Luyssaert et al., 2007), we
found that the amount of carbon that materializes as
forest NPP depends to a large extent on the amount of
carbon assimilated through photosynthesis (linear
regression, R2 5 0.48, Po0.01, n 5 69), N deposition
(linear regression on the residuals of the NPP–GPP
relationship, R2 5 0.13, Po0.01, n 5 69) and marginally
on LAI (linear regression on the residuals of the NPP–
GPP relationship, R2 5 0.12, Po0.14, n 5 47). At the
global scale and for a given GPP, the allocation of assimi-
lated compounds to NPP was insensitive to management
(Fig. 3a; ANCOVA P 5 0.92). We can also describe the
global pattern in NPP as a function of climate (Lieth &
Whittaker, 1975; Churkina & Running, 1998), however,
climate explains less of the large-scale variability in NPP
Fig. 2 Differences (%) in net primary productivity (NPP)
between BIOME-BGC simulations with and without N deposi-
tion relative to NPP without N deposition. Not accounting for N
deposition results in a mean underestimate of 11% of NPP across
25 member states of the European Union (EU-25).
1436 S . L U Y S S A E R T et al.
r 2009 Blackwell Publishing Ltd, Global Change Biology, 16, 1429–1450

than GPP (multiplicative regression model with two
power functions, p: not defined for nonlinear regres-
sions, R2 5 0.32, n 5 254). However, GPP is largely
controlled by climate.
Subsequently, we described the observed GPP as a
function of the precipitation and radiation sum during
the growing season. Because radiation and temperature
are strongly correlated at the site level (Pearson’s
correlation r5 0.90, Po0.01, n 5 115), temperature was
included implicitly in this analysis, as it was used to
determine the length of the growing season and as such
influences the precipitation and radiation sums. Globally,
incident radiation and precipitation during the growing
season, and temperature via its strong effect on the
length of the growing season, exert the dominant
control over large-scale patterns in GPP (multiplicative
regression model with two power functions, p: not
defined for nonlinear regressions, R2 5 0.67, n 5 169).
The observation-based controls on GPP and NPP
indicate that GPP can be estimated when radiation,
precipitation, temperature, LAI and N availability are
known. Subsequently, NPP could be derived from GPP.
Currently, ORCHIDEE, LPJ-DGVM and BIOME-BGC
estimate photosynthesis (GPP) based upon climate
factors and CO2 concentrations, and further calculate
NPP as the remaining carbon after the respiration
needs of the plant have been fulfilled. Because these
models are forced by (i.e., climate and CO2) or calculate
(i.e., LAI) most of the observed controls (except for
nutrient availability) are accounted for, hence, a good
agreement is to be expected and was indeed observed
between the ecosystem models, the inventory and
ecological site studies (Table 3).
Current ecosystem models seem to lack the controls of
the regional differences in NPP (see NPP estimates). In
general, regional representation of models could be
improved by better representing (1) key processes such
as seasonal water stress, crown development under
nutrient and water constraints and nutrient constraints
in general and (2) regional variability in plant traits.
Currently, many important plant traits (e.g., leaf
nitrogen concentration, specific leaf area, leaf longevity)
that control biogeochemical cycling are represented as
constant parameters within a plant functional type (PFT).
However, these traits are known to vary within and
between PFTs and systematically along environmental
gradients (Wright et al., 2004, 2006; Reich et al., 2006).
Trends in NPP. During the past 50 years, NPP of forests
in the EU-25 increased by a factor of 1.7 and the biomass
stock per forest area of forest increased in parallel by
a factor 1.8 (Ciais et al., 2008b). Moreover, forest
carbon stocks increased everywhere in Europe linearly
with NPP (Fig. 4), both for conifer and broadleaved
forest. The slope of the regression line between carbon
stocks and NPP was reported to be similar between
the different European countries, independently of
differences in regional climate, soil conditions, initial
stocks and NPP values, and management practices
(Ciais et al., 2008b).
Causes for the increase in NPP may be (no rank order
given): (i) the juvenile age structure of the European
forests, most of which are old coppices (broadleaves in
Southern Europe) or post-war plantations (conifers in
Fig. 3 Relationships between gross primary productivity (GPP)
and the amount of carbon that is allocated to net primary
production (NPP) and net ecosystem proportion (NEP). (a)
Relationship between NPP and GPP, n 5 16, n 5 40, and n 5 13
for unmanaged sites with background N deposition (green),
managed sites with background N deposition (blue), and man-
aged sites with elevated N deposition (red), respectively. (b)
Relationship between NEP and GPP, n 5 25, n 5 45, and n 5 40
for unmanaged sites with background N deposition (green),
managed sites with background (blue), and managed sites with
elevated N deposition (red), respectively. Circles, squares and
triangles show boreal, temperate and tropical forests, respec-
tively. The vertical lines mark the GPP range in which sites with
elevated N deposition were observed. The error bars and gray
zone around the curves show the standard deviation of the data
and curve fitting, respectively.
E U R O P E A N C A R B O N B A L A N C E 1437
r 2009 Blackwell Publishing Ltd, Global Change Biology, 16, 1429–1450
Central and Northern Europe) that still show increasing
increment rates, (ii) the increased fertility of forest soils
following a reduction of nutrient removals by the
cessation of practices such as grazing or litter raking
and by the reductions of sulfur emissions, which
induced nutrient leaching, (iii) forest area expansion
resulting in an increasing share of young productive
forests, (iv) changes in species composition toward more
productive tree species (i.e., Sitka spruce in Ireland and
the United Kingdom, poplar in France and Belgium and
Eucalyptus in Portugal), (v) the fertilizing effects of
increased nitrogen deposition and atmospheric CO2
concentration and (vi) changes in management practices.
Future NPP is expected to further increase above
current NPP levels owing to predicted increases in
temperature (Meehl et al., 2007) and CO2 concentration
(Norby et al., 2005; Meehl et al., 2007).
Expected increase in NPP (Cao & Woodward, 1998)
could, however, be offset by progressive limitations of
other nutrients (Gill et al., 2006; Luo, 2007), water stress
related to the predicted decreased growing season
precipitation (Meehl et al., 2007), climate change-induced
changes in species composition (Cramer et al., 2001;
Parmesan & Yohe, 2003; Gamache & Payette, 2004;
Jump et al., 2006), increasing ozone concentrations
(Sitch et al., 2007), increasing frequency of insect
outbreaks (Percy et al., 2002; Logan et al., 2003),
increased frequency and intensity in forest fires owing
to changes in species composition and climate (Westerling
et al., 2006; Bond-Lamberty et al., 2007) or increasing
storm damage because of increased storm intensity in
the temperate zone (Meehl et al., 2007) in combination
to the increased cultivation of tree species outside their
natural range (Schelhaas et al., 2003). According to
most emission scenarios, on the contrary, atmospheric N
deposition over Europe is expected to decline over
the next decades (Dentener et al., 2006), resulting in a
parallel decrease in forest NPP. The different dynamics of
temperature, CO2 and N deposition over the next century
make it all the more important to partition the observed
increase in forest growth among these driving variables.
Moreover, recently the role of climate variability and
extreme weather conditions such as the 2003 heat wave
has been identified as a factor that may strongly alter
responses of productivity to mean climate change (Ciais
et al., 2005; Reichstein et al., 2007a). The effect of a single
heat wave on site productivity carried over to the next
year(s) because of lowered soil water availability and
increased tree mortality (Granier et al., 2007). Hence, it
remains uncertain whether NPP will increase or decrease
in the next decades.
Carbon losses
Estimates of carbon losses. The NPP is the amount of
carbon that is available for the production of organic
molecules after the respiratory needs for growth and cell
maintenance have been met. Part of the NPP is lost from
the ecosystem via processes such as herbivory and VOC
emission. The remainder accumulates as biomass or is
deposited as soil organic carbon (SOC). Part of the
accumulated carbon is being consumed (Fig. 1) by
heterotrophic respiration (Rh), harvest (H), forest fires (F)
and losses to rivers (D). In the following paragraphs, we
estimate these components of the EU-25 carbon balance.
Between 1990 and 1999 harvested wood (H) is
estimated at 61 � 3 g C m�2 yr�1 (Table 3) (Nabuurs
et al., 2003). Despite a mean life-time of about 17–20
years for wood products excluding paper and cardboard
(Profft et al., 2008), the difference between the production
of new wood products and decomposition and burning of
disposed products (62 � 3 g C m�2 yr�1) resulted only in a
very small carbon sink in wood products of 1.5 �4 g C m�2 yr�1 (Nabuurs et al., 2003). About half of the
harvested wood is directly or indirectly used for energy
production (as firewood in Mediterranean countries, and
wood by-products in Northern countries) avoiding the
use of 40 Mt of diesel annually (EEA, 2006). Comparison
of the relationship between Rh and NPP in managed and
unmanaged forests indicated an average H flux of
88 � 3 g C m�2 yr�1 for ecological site studies (Luyssaert
et al., 2007). The ecological site study and inventory
approach both indicate that harvest (H) is only a small
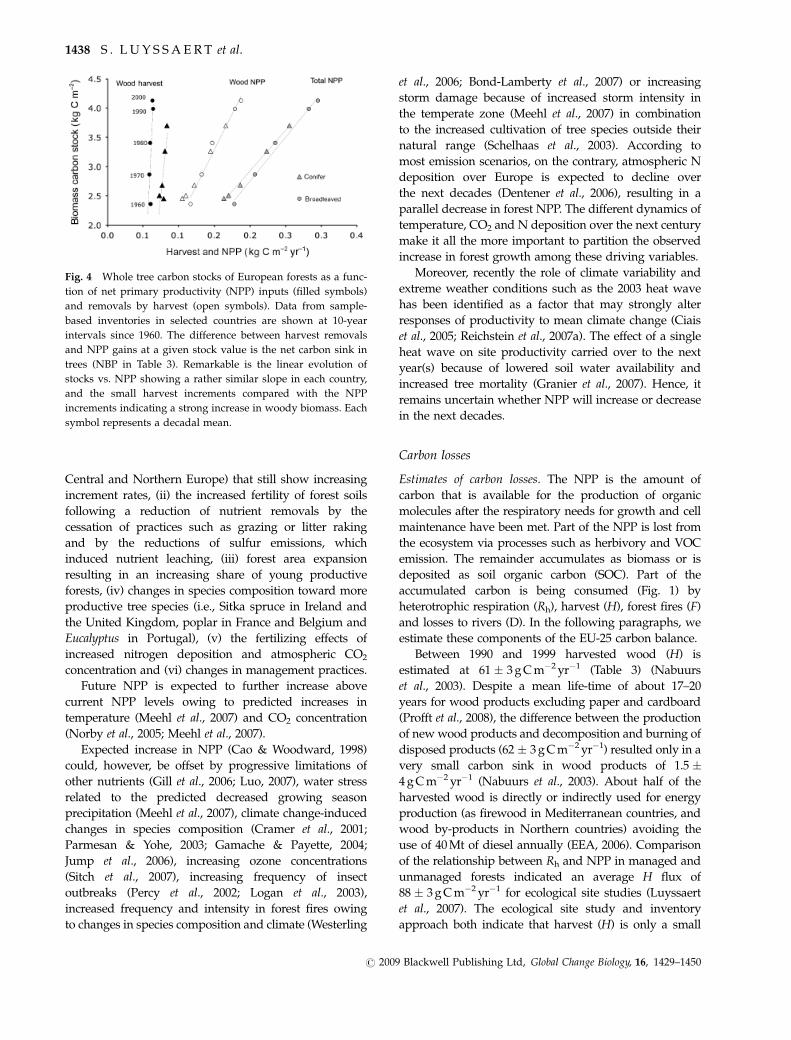
Fig. 4 Whole tree carbon stocks of European forests as a func-
tion of net primary productivity (NPP) inputs (filled symbols)
and removals by harvest (open symbols). Data from sample-
based inventories in selected countries are shown at 10-year
intervals since 1960. The difference between harvest removals
and NPP gains at a given stock value is the net carbon sink in
trees (NBP in Table 3). Remarkable is the linear evolution of
stocks vs. NPP showing a rather similar slope in each country,
and the small harvest increments compared with the NPP
increments indicating a strong increase in woody biomass. Each
symbol represents a decadal mean.
1438 S . L U Y S S A E R T et al.
r 2009 Blackwell Publishing Ltd, Global Change Biology, 16, 1429–1450

fraction of NPP (causes for the high NPP are given in
‘Trends in NPP’), which, in the absence of other large
losses because of fires, die back and storm damage,
implies a large potential carbon sink in the biomass of
European forests (Ciais et al., 2008b).
Estimates of the burnt area differ because of differences
in methodology and its limitations. According to the
MODIS estimates, 1 700 000–1 900 000 ha of land across
EU-25 was burned annually. Forests covered 300 000–
700 000 ha of that area (van der Werf et al., 2006). Despite
being spatially explicit, MODIS has difficulties in
distinguishing forests from shrublands and other
wooded lands. Official statistics report over the period
1990–2005 a yearly average of 520 000 ha of fires on forest
and other wooded land (Schulte et al., 2002), of which
270 000 ha was on forest land (Schelhaas et al., 2001). In the
1990s, the annually burnt forest area represented 0.2% of
the total forest area (Schelhaas et al., 2003). The ratio of
burned land is in reasonable agreement with the MODIS
estimate of 0.4% of Europe including forests, shrubland,
grassland and agricultural land (Giglio et al., 2006; van der
Werf et al., 2006), most of the burned area in EU-25 being
in Portugal and Spain (Fig. 5). In total, the Mediterranean
countries account for 93% of the fires; in Portugal and
Spain, 0.6% of the forest burns annually (Schelhaas et al.,
2003). Forest fires are a regional flux mainly confined to
the Mediterranean. For comparison, each year 2500 forest
fires destroy in total 1000 ha in Germany and Finland
together (Schulte et al., 2002).
Forest fire emissions (F) are estimated from satellite
data of burned area and fire hot spots (Giglio et al., 2006)
and were coupled to the fire module of the CASA model
(van der Werf et al., 2006). The total annual loss due to
forest fires is 5.1 � 1.4 Tg C yr�1 for the EU-25 or 4.7 �1.3 g C m�2 yr�1, the uncertainty was estimated as the
inter-annual variation between 1997 and 2006. A modi-
fied version of LPJ-DGVM estimated 6.8 � na g C m�2 yr�1
losses due to fire (Zaehle et al., 2006).
The F flux is much larger for Mediterranean forests and
shrublands that are mainly composed of broadleaved
species (i.e., 15% needle evergreen, 20% broadleaved
evergreen and 65% broadleaved summergreen; Loveland
et al., 2000), than for boreal and temperate forests that
contain the bulk of the coniferous trees in the EU-25. At the
EU-25 level, F equals 6.3 g C m�2 yr�1 for broadleaved and
3.4 g C m�2 yr�1 for conifer forest. At first, this seems
counter intuitive because if both traits occur in the same
region, the conifer trees are usually more prone to fires
than the broadleaves (Meyer, 2005). However, young and
dense stands favor fire spread, and forest floors with a
high amount of flammable material are more vulnerable
than others. In addition, climatic conditions in the Mediter-
ranean area are more likely to support fires. Hence, in the
EU-25, the dominance of the F flux in broadleaved species
seems to be a management and climate, rather than a
vegetation trait effect.
During 1990–2005, fire emissions represented on
average 1% of forest NPP (Table 3). The spatial
distribution of NPP (Fig. 5a) and fire emissions (Fig. 5b)
Fig. 5 Fire-related total carbon emissions from European eco-
systems over 1997–2006 from the CASA model with input data
from remote-sensing EOS-Terra-MODIS burned area. (a) Spatial
distribution of fire emissions, summing up to a total source of is
5.1 � 1.4 Tg C yr�1 over the 25 member states of the European
Union (EU-25). (b) Annual net primary productivity (NPP)
estimated by the CASA model, using a light-use efficiency
parameterization and remotely sensed light absorption by cano-
py. (c) Ratio of fire emission to NPP over 1997–2006.
E U R O P E A N C A R B O N B A L A N C E 1439
r 2009 Blackwell Publishing Ltd, Global Change Biology, 16, 1429–1450

across Europe was derived from CASA. The ratio F/NPP,
however, has large regional differences (Fig. 5c), ranging
from o0.05 in humid temperate forests, up to 0.15
over northern Portugal, where exceptionally large fires
occurred in 2003.
Disturbances through storm (Lindroth et al., 2009) and
pests are either salvaged or left on-site to decompose and
therefore end up in the H or Rh flux. The joined
contribution to the carbon sink of the main disturbances,
i.e. fire, storm and pests is discussed in ‘Controls of NBP’.
Leaching of carbon from forest soils into rivers (D) is
estimated by upscaling the chemical composition of
surface water and river flow measurements across
Europe (Meybeck & Ragu, 2006). Only carbon of photo-
synthetic origin was accounted (Ciais et al., 2007) by
considering that up to 60% of the organic and inorganic
carbon lateral flux transported by rivers to estuaries is of
atmospheric origin, according to lithology and weathering
intensity (Meybeck, 1987; Durr et al., 2005). The amount of
carbon in inland water, that represented 40 � 10% of the
total carbon flux, is based on a very large data set of carbon
concentrations in river waters (Ciais et al., 2008a). The
second term of CO2 outgassing is much more uncertain
owing to the general lack of CO2 data in rivers and lakes,
as well as the uncertainties on water surface areas (Lehner
& Doll, 2004), which result in an uncertainty of 50% (Ciais
et al., 2008a). Our approach resulted in a flux of photo-
synthetic carbon exported from ecosystems to rivers of
9.6 � 3.2 g C m�2 yr�1. This estimate is close to the mean
estimate of 11 � 8 g C m�2 yr�1 for Europe (Siemens, 2003)
and the global mean estimate of 10 � 10 g C m�2 yr�1
(Randerson et al., 2002) carbon leaching to rivers and
lakes. However, at the European scale it is impossible to
determine whether D is an almost fixed fraction of NPP
being channeled to the rivers or owing to disturbance of
old soil organic matter pools.
The only source of in situ heterotrophic respiration
estimates is ecological site studies. When these estimates
are upscaled, Rh was on average 387 � 59 g C m�2 yr�1
for the EU-25. The highest field observation of Rh is
almost twice as large as the lowest estimate, and the
upscaled observations are close to mid-range. Hetero-
trophic respiration of EU-25 forests is modeled at
283 � 115 g C m�2 yr�1 for the period 1990–1999 by the
forest inventory methods (Table 1). The ecosystem
models estimated Rh as a function of soil carbon stock,
available nitrogen (only in BIOME-BGC) and soil
temperature and moisture at 397 � 119 g C m�2 yr�1
(BIOME-BGC), 505 � 151 g C m�2 yr�1 (LPJ-DGVM) and
527 � 158 g C m�2 yr�1 (ORCHIDEE). Ecosystem models
calculate Rh as a function of soil carbon stock, which in
turn is a function of NPP (Krinner et al., 2005).
Consequently, high NPP estimates are propagated in the
soil carbon stock estimates and are likely to produce high
Rh estimates. The relationship between soil temperature
and soil moisture is often formalized as an exponen-
tial function known as the Q10 function. Owing to the
mathematical properties of this function, small differences
in temperature sensitivity or Q10 values could result in
large differences in Rh (Davidson & Janssens, 2006;
Davidson et al., 2006). The lack of convergence in Rh
estimates across methods will be reflected in a wide
range of NEP and ultimately NBP estimates (see ‘NBP’).
Controls of carbon losses. Strictly speaking, harvest has no
natural drivers and the mean harvest rate largely
depends on the physical characteristics and socio-
economic status of the regions within Europe (i.e.,
urban vs. rural regions). Global demand and wood
supply of distant regions such as Siberia, Canada and
the tropics, policy decisions as well as technological
innovations are likely reflected in the EU-25 harvest
intensity. In the past, industrial changes (i.e., the raise
and fall of the coal mining industry) resulted in changes
in harvest intensity and characteristics (Johann, 2007). At
the regional level, mean harvest rates may be disrupted
by salvage logging following fires, insect outbreaks and
windfall which is the most important cause of forest
damage in the EU-25 (Nabuurs et al., 2003).
To be started and propagated, forest fires need fuel,
favorable weather conditions and an ignition source.
Overly dense stands where management (or the
absence of management) and fire suppression has lead
to increased fuel stocks (Miller & Urban, 2000; Mason
et al., 2006) combined with prolonged periods of drought
(Mollicone et al., 2006; Achard et al., 2007) favor forest
fires. Typically, lightning is the natural source of ignition,
however, even in rather remote regions like Russia most
of the forest fires are of human origin (Mollicone et al.,
2006; Achard et al., 2007). Consequently, in densely popu-
lated regions such as the Mediterranean the majority of
the fires are expected to be started by arson.
A review of dissolved organic carbon (DOC) fluxes
and concentrations in temperate forests (Michalzik et al.,
2001) indicated no general difference between coniferous
and hardwood sites, increasing fluxes of DOC in forest
floor leachates with increasing annual precipitation,
increasing fluxes of DOC in forest floor leachates with
increasing fluxes of DOC in throughfall and higher
concentrations of DOC in forest floor leachates were
observed for higher pH of the forest floor, within a pH
range of 3.3–4.4. Further, increasing DOC leaching was
observed in response to NO3� deposition (Smemo et al.,
2006), increased primary production (Froberg et al., 2006;
Harrison et al., 2008) and increased temperature
(Harrison et al., 2008). Sorption dynamics and depletion
of DOC explains, respectively, peaks in DOC after
periods of droughts (Froberg et al., 2006) and low DOC
1440 S . L U Y S S A E R T et al.
r 2009 Blackwell Publishing Ltd, Global Change Biology, 16, 1429–1450

fluxes after periods of intense precipitation (Harrison
et al., 2008). Forest management practices such as liming
are reported to increase the carbon losses through DOC
and DIC (Nilsson et al., 2001).
However, not all of the DOC and DIC reach the rivers
and lakes. The positive water balance in boreal Europe
and the local importance of peatlands with anaerobic
conditions favors high DOC and DIC concentrations in
rivers and lakes. In the temperate region, the water
balance is only positive in winter and soil conditions
are dominantly aerobic resulting in low DOC fluxes. The
DOC flux in forest floor leachates of temperate forests
ranged between 10 and 40 g C m�2 yr�1 (Michalzik et al.,
2001). Whereas the mean average DOC fluxes from
forests (both boreal and temperate) to rivers and lakes
is 4 g C m�2 yr�1 (Siemens, 2003). Consequently, DOC
and DIC from forest floor leachates never enter rivers
and lakes because they are decomposed or retained in
deeper soil layers.
Heterotrophic respiration or microbial decomposition
depends on soil temperature, soil moisture, NPP of the
vegetation and substrate quality (Raich & Nadelhoffer,
1989; Janssens et al., 2001; Davidson & Janssens, 2006).
Higher temperature, soil moisture, NPP and substrate
quality all result in an increase of microbial activity. Also,
heterotrophic respiration is sensitive to the N availability.
Decomposition of fresh, recently fallen litter is N limited
(C/N litter � 50) and as such its early-stage decompo-
sition is accelerated by high internal N concentration
(Parton et al., 2007) and by elevated N deposition (Knorr
et al., 2005). In later phases of the decomposition process,
lignin concentration regulates decay of the remaining
biomass, both the ligneous and the more easily palatable
tissues protected by lignin fibres. N deposition has been
found to reduce activity of peroxidases, enzymes
responsible for degrading lignin among other mole-
cules, which explains why N deposition retards the
decay of litter during later stages of the decomposition
process (Fog, 1988; Berg & Matzner, 1997; DeForest et al.,
2004; Knorr et al., 2005; Pregitzer et al., 2008). Moreover,
the deposition-derived ammonium could stimulate the
formation of recalcitrant humic compounds and thus
further reduce the heterotrophic CO2 losses (Fog, 1988).
Hence, nitrogen deposition could exert an overall
stimulating effect on decomposition where sufficient
high-quality litter occurs and the stimulatory N effect
dominates litter decay (Knorr et al., 2005). At the site-
level, decreases in Rh because of N additions have often
been reported (Persson et al., 2000; Bowden et al., 2004;
Burton et al., 2004; Olsson et al., 2005; Phillips & Fahey,
2007; Mo et al., 2008). Observations in forests do, how-
ever, contradict the increase in Rh that was observed
following fertilization of alpine and arctic tundra
ecosystems (Neff et al., 2002; Mack et al., 2004),
suggesting that decomposition of the soil organic
matter in these ecosystems is much more N limited as
compared with boreal and temperate forests.
Trends in carbon losses. Since 1960, the fast increasing
wood demand in Europe was met only to a small extent
by an increase in harvest (i.e., the harvest increased
by 20% between 1960 and 2000 to a total of
� 450 million m3 in 1999) (UN-ECE & FAO, 2005;
Eurostat, 2008). To a large extent, the increase in
demand was met by increased processing efficiency
(i.e., sawing losses that are used by the pulp industry
and a highly efficient recycling of paper). Since 1960,
demand and supply are almost in balance but the gap
(i.e., 22 million m3 in 1999) needs to be closed by an
increasing net import of wood products (FAO, 2008).
The ecological site study and inventory approaches
both indicate that current harvest (H) is only a small
fraction of NPP, which, in the absence of large-scale
mortality, implies a large potential sink in the biomass
of European forests. This has not always been true; in
the 1950s the H to NPP ratio was 1.5 times higher than
today (UN-ECE & FAO, 2005). Consequently, over the
past 50 years, relative harvest intensity has decreased
throughout the EU-25 resulting in a real increase of
standing biomass (Fig. 4).
Wood demand is expected to further increase but
could be met by the increasing productivity of EU-25
forests without affecting the harvest intensity (UN-ECE
& FAO, 2005). However, the decision to increase the
share of renewable energy to 20% of the total energy
consumption by 2020 within Europe (COM, 2008), is
expected to almost double the wood demand for
bioenergy in EU-25. Such demand can only be met by
increasing the harvest rate of 55% of annual volume
increase in 2001 to 100% in 2020 (Ragwitz et al., 2005)
unless 11.5� 106 ha of short rotation forests are
established (Kuiper et al., 1998).
Not only the quantity but also the quality of the
harvested wood products may affect the carbon
sequestration potential of the EU-25 forests. Today, for
example, trees with smaller dimensions than before are
harvested, because of a shift toward wood-based panels
such as laminated, particle, fiber and oriented strand
boards (UN-ECE & FAO, 2005). The same technological
innovations also resulted in a more common use of hard-
wood fibers than before. The industry thus demands
smaller dimension which are produced in young forests
with short rotations and smaller carbon pools compared
with older forests managed with longer rotations. In
Mediterranean countries, on the contrary, the reduced
demand for fuelwood and increase in rotation length has
resulted in an increase in harvested tree dimensions and
standing carbon pools.
E U R O P E A N C A R B O N B A L A N C E 1441
r 2009 Blackwell Publishing Ltd, Global Change Biology, 16, 1429–1450

In the last two decades, several major storms, i.e.,
Viviane in 1990, Wiebke in 1990, Martin in 1999, Lothar
in 1999, Kyrill in 2007 and Emma in 2008 resulted
in increased salvage logging. The exceptional storms
in 1990 and 1999 alone damaged 120 million and
180 million m3 of wood, respectively, or the equivalent
of 30–50% of the annual fellings (Eurostat, 2008). Such
storms were often followed by bark beetle outbreaks
(Wermelinger, 2004) which further increased the
volume of salvage logging. As long as the salvaged
volume is lower than the wood demand, storms and
pest does not affect the total volume of wood harvest,
however, forest owners are likely to shorten rotation
periods to minimize storm damage. Although the mean
annual effect of storm on forest NBP is quite small, i.e. a
reduction of 2%, large storms such as Lothar in 1999 were
estimated to reduce the NBP by as much as 30%
(Lindroth et al., 2009). Consequently, a future increase
in storm frequency and intensity could lower the NBP for
the EU-25.
Between 1980 and 2000, the fire frequency in the
Mediterranean area increased from 35 000 to 60 000 per
year (Schulte et al., 2002). However, within the same
time frame, fire forecasting (i.e., European Forest Fire
Risk Forecasting System, EFFRFS) combined with rapid
intervention reduced the area of burnt forest and
shrubland from 550 000 to 450 000 ha yr�1 (Schulte et al.,
2002). Decreases in harvest intensity (Ciais et al., 2008b),
afforestation of abandoned lands (Schelhaas et al., 2003)
and probably also cessation of the removal of small logs
because of lower market value than the cost for hauling
and harvest (Mason et al., 2006) contributed to increased
fuel stocks and retention of fuel ladders. Over the last
decades or so, summer drought has become more
frequent and intense in the EU (Luterbacher et al.,
2004). Temperature and precipitation anomalies further
increase flammability of forests with an already increased
fuel stock (Westerling et al., 2006). Probably the interplay
of management, climate anomalies and arson, especially
in areas of unsettled property rights, increased the fire
risk and frequency in the Mediterranean. Depending on
the fire severity only part of the ecosystem carbon pool is
oxidized and released in the atmosphere.
Future climate, with more frequent and intense
summer droughts (Beniston, 2004; Luterbacher et al.,
2004), is expected to increase the fire risk of forests in
the EU. Whether these favorable climatic condition will
result in more and larger fires, ultimately depends on the
evolution of fuel stocks (and thus harvest), successful fire
prevention (given that most of the fires are ignited by
humans), rapid intervention and the ability of forest
managers to adapt fuel structure and composition to
the predicted longer and more severe fire seasons
(Hirsch et al., 2001; Palma et al., 2007).
Across northern Europe including the UK, a
widespread increase in concentrations of DOC in
surface waters has been reported (Worrall et al., 2004;
Monteith et al., 2007). The rising trends in DOC between
1990 and 2004 can be precisely explained by changes in
atmospheric sulfur deposition and catchment acid-
sensitivity (Monteith et al., 2007). The large-scale
increase was unrelated to climatic factors and N depo-
sition. However, DOC concentrations have increased in
proportion to the rates at which atmospherically
deposited anthropogenic sulfur and sea salt have de-
clined (Monteith et al., 2007). Owing to the unfavorable
conditions for DOC production in central and southern
compared with northern Europe (see section 5.2), it is no
surprise that we could not identify studies that presented
long-term trends in DOC concentrations in rivers and
lakes in central and southern Europe.
Given the large-scale drivers of DOC production,
future DOC fluxes are expected to follow NPP and
DOC fluxes in throughfall. However, DOC production
could be further enhanced or suppressed by changes in
deposition chemistry, i.e. reductions in S-deposition and
increases in N deposition, respectively.
To our knowledge there are no direct observations,
spanning several decades, which could be used to estab-
lish the magnitude and direction of past and current
trends in Rh, if any. During the past decades, increasing
temperature and NPP possibly stimulated Rh. This
increase, however, could be overridden by decreasing
Rh because of substrate limitations owing to lower slash
inputs as a result from decreasing harvests and reduction
of Rh because of widespread N deposition especially in
central Europe (Persson et al., 2000; Smemo et al., 2006).
Whether there really is a widespread reduction of Rh
because of N deposition remains an open question which
needs to be resolved by further study (Janssens
& Luyssaert, 2009). However, Rh could have increased
in, for example, deciduous forest because of the expected
litter stock following ageing of the forests. Hence,
the current and future trends in Rh are among the key
unknowns to predict the direction (i.e., sink or source)
of the future terrestrial carbon balance (Davidson
et al., 2003).
NBP
Estimates of NBP. NBP is the carbon that remains in the
long term in the ecosystem (Chapin et al., 2005) and is
sequestered in wood and soil carbon. Thus, NBP is the
amount of atmospheric CO2 sequestered in forest
ecosystems and represents the direct contribution of
ecosystems to climate change mitigation. In this study,
NBP was formalized as NPP�H�F�D�Rh. Over long
periods of time and in a constant environment, global
1442 S . L U Y S S A E R T et al.
r 2009 Blackwell Publishing Ltd, Global Change Biology, 16, 1429–1450

forest NBP is expected to be near-zero, but in today’s
changing environment the net carbon balance is
believed to be substantial.
In a first assessment, the NBP of the European forests
was estimated between 70 and 160 g C m�2 yr�1(Janssens
et al., 2003). More recent estimates indicate that the NBP
is likely to be lower than these initial estimates. In the
inventory method, NBP is inferred with models based on
sample plots data of annual stem volume increment and
felling volume statistics (Kauppi et al., 1992; Liski et al.,
2002, 2005; Nabuurs et al., 2002, 2003). After correction
for heterotrophic respiration, harvest, fire and losses
to rivers, the inventory approach suggests an increase
in tree biomass of 69 � 17 g C m�2 yr�1 and in soil carbon
content of 20 � 10 g C m�2 yr�1, leading to a total NBP
of 89 � 19 g C m�2 yr�1 (Table 3). However, the increase
in soil carbon content is estimated from model
simulations and therefore the current (incomplete)
uncertainty estimate, i.e. a coefficient of variation of
45%, appears optimistic.
Different inventory-based NBP estimates have been
reported (Nabuurs et al., 2003), using data from the 1980s
and mid-1990s, mainly from UN-ECE/FAO (UN-ECE &
FAO, 1985, 1992, 2000a). The studies covered different
areas, i.e., 15 western-European countries (Nabuurs et al.,
1997), 30 European countries (Nabuurs et al., 2003), or the
entire European continent (Goodale et al., 2002; Liski
et al., 2003). These estimates differed by the methods
used to convert the timber stocks and growth into carbon
pools or fluxes. The reported NBP in living wood largely
differs between studies, i.e. 25–35 g C m�2 yr�1 between
1971 and 1990 (Kauppi et al., 1992), 46 � na g C m�2 yr�1
between 1990 and 1999 (Goodale et al., 2002) or
69 � 17 g C m�2 yr�1 in the late 1990s (Nabuurs et al.,
2003). These values include afforestation but do not
account for woody encroachment of abandoned lands,
nor for Mediterranean shrublands and woodland eco-
systems which are not sampled by national inventories.
When using the EU-25 estimates for F and D and the
upscaled ecological measurements for NPP, H and Rh,
the NBP ranges between 53 and 98 g C m�2 yr�1 in wood
and soils based on ecological measurements, however,
the uncertainty is high because of the limited number of
sites available for upscaling to the EU-25. Few ecological
sites monitor the carbon fluxes following afforestation
and the upscaling procedure does not explicitly add-
resses afforestation, therefore it is impossible to estimate
to which extent the NBP estimate accounts for the effects
of afforestation. Eddy covariance measurements of NEP
at European forest sites were combined with maps of
climate and NDVI in a neural network to give a forest
NEP of 197 g C m�2 yr�1 (Table 3). Combing the eddy
covariance-based NEP with losses because of H, D and
F results in an NBP of 121 � 260 g C m�2 yr�1. The
between-approach difference in NBP remains unre-
solved but suggests that the EC network is biased
toward young productive forests. Although these new
estimates of NBP confirm the magnitude of the previous
assessment, the uncertainty warrants further research.
Inventories and ecological studies estimate a forest
carbon sink of about 10–20% of the NPP (Table 3),
probably caused by reforestation, restocking soil carbon
after over-use in the past and a build-up in the stem
wood because of incomplete harvesting of annual wood
increment (Liski et al., 2002; Ciais et al., 2008b). Harvest is
estimated at 15% of NPP (Table 3), leaving around
65–75% of the NPP for respiratory and other losses.
The partitioning of NBP between live biomass, and
SOC and litter pools is relatively similar among the
inventory studies (Nabuurs et al., 1997; Goodale et al.,
2002): 29 � 14% of NBP goes into the soil and 71 � 15%
into live biomass. Apparent convergence does not
necessarily reflect biological processes because all
inventory studies use similar models to estimate the
belowground carbon sequestration.
A modified version of LPJ constrained by regional
forest statistics estimated an NBP of 63 g C m�2 yr�1 after
accounting for D and afforestation (Zaehle et al., 2006).
As BIOME-BGC, LPJ-DGVM and ORCHIDEE do not in-
clude harvests and disturbances, these models are not
able to predict a proxy of NBP. Instead, these models
predict only NEP.
For forests on mineral soils, emissions of other green-
house gases are usually very low and around 1 g C m�2 y�1
(Jungkunst & Fiedler, 2007). Consequently, their effect
on radiative forcing does not substantially diminish
the carbon-based estimate of the sink-strength.
Moreover, in drought conditions, forest soils can serve
as a small but persistent sink for nitrous oxide (Goldberg
& Gebauer, 2009).
Controls of NBP. Since the development of the eddy
covariance technique, NEP is among the most
common ecosystem fluxes available. The difference
between the photosynthetic and respiratory CO2 flux
is the net ecosystem CO2 production (NEP). At the eco-
logical site studies, o5% of the observed variability in
NEP (multiplicative regression model with two power
functions, p: not defined for nonlinear regressions,
R2 5 0.04, n 5 164) could be explained by precipitation
and radiation during the growing season. However,
NEP is not a physiological process in itself, but the
combined result of several ecosystem processes with
different time scales and drivers (Piao et al., 2008). In
particular, time since disturbance has been found to
explain 92% of the total variability in NEP (Magnani
et al., 2007). This explains the lack of correlation
between annual NEP and environmental variables
E U R O P E A N C A R B O N B A L A N C E 1443
r 2009 Blackwell Publishing Ltd, Global Change Biology, 16, 1429–1450
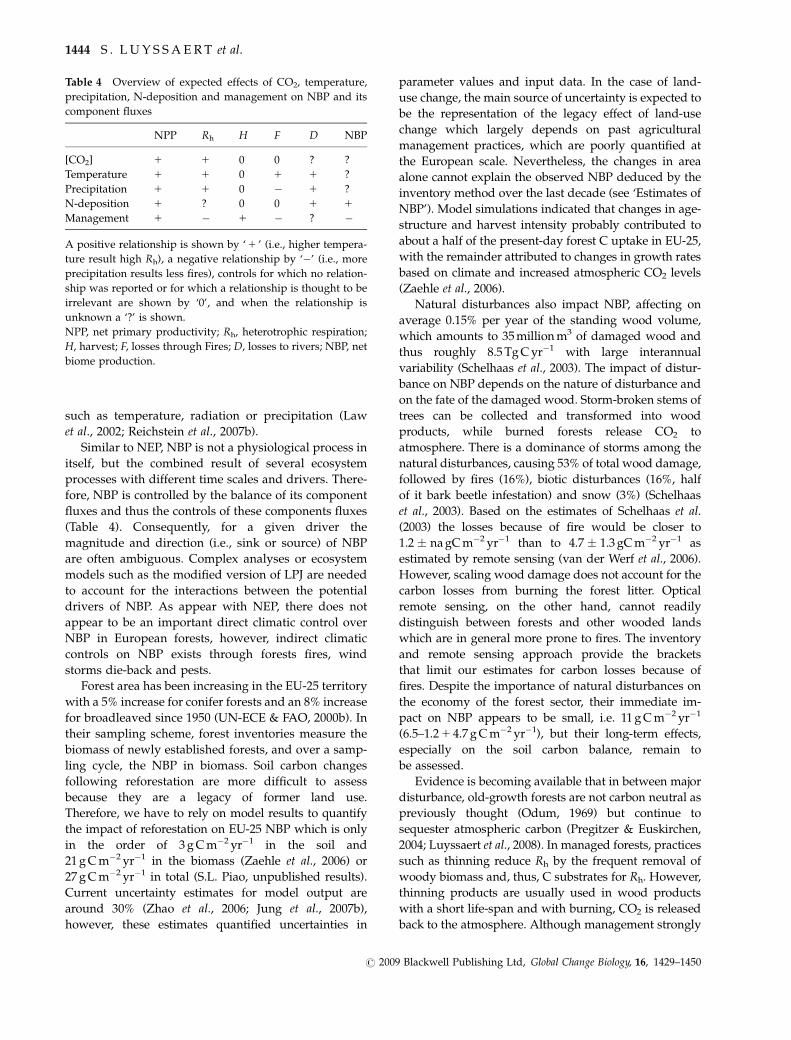
such as temperature, radiation or precipitation (Law
et al., 2002; Reichstein et al., 2007b).
Similar to NEP, NBP is not a physiological process in
itself, but the combined result of several ecosystem
processes with different time scales and drivers. There-
fore, NBP is controlled by the balance of its component
fluxes and thus the controls of these components fluxes
(Table 4). Consequently, for a given driver the
magnitude and direction (i.e., sink or source) of NBP
are often ambiguous. Complex analyses or ecosystem
models such as the modified version of LPJ are needed
to account for the interactions between the potential
drivers of NBP. As appear with NEP, there does not
appear to be an important direct climatic control over
NBP in European forests, however, indirect climatic
controls on NBP exists through forests fires, wind
storms die-back and pests.
Forest area has been increasing in the EU-25 territory
with a 5% increase for conifer forests and an 8% increase
for broadleaved since 1950 (UN-ECE & FAO, 2000b). In
their sampling scheme, forest inventories measure the
biomass of newly established forests, and over a samp-
ling cycle, the NBP in biomass. Soil carbon changes
following reforestation are more difficult to assess
because they are a legacy of former land use.
Therefore, we have to rely on model results to quantify
the impact of reforestation on EU-25 NBP which is only
in the order of 3 g C m�2 yr�1 in the soil and
21 g C m�2 yr�1 in the biomass (Zaehle et al., 2006) or
27 g C m�2 yr�1 in total (S.L. Piao, unpublished results).
Current uncertainty estimates for model output are
around 30% (Zhao et al., 2006; Jung et al., 2007b),
however, these estimates quantified uncertainties in
parameter values and input data. In the case of land-
use change, the main source of uncertainty is expected to
be the representation of the legacy effect of land-use
change which largely depends on past agricultural
management practices, which are poorly quantified at
the European scale. Nevertheless, the changes in area
alone cannot explain the observed NBP deduced by the
inventory method over the last decade (see ‘Estimates of
NBP’). Model simulations indicated that changes in age-
structure and harvest intensity probably contributed to
about a half of the present-day forest C uptake in EU-25,
with the remainder attributed to changes in growth rates
based on climate and increased atmospheric CO2 levels
(Zaehle et al., 2006).
Natural disturbances also impact NBP, affecting on
average 0.15% per year of the standing wood volume,
which amounts to 35 million m3 of damaged wood and
thus roughly 8.5 Tg C yr�1 with large interannual
variability (Schelhaas et al., 2003). The impact of distur-
bance on NBP depends on the nature of disturbance and
on the fate of the damaged wood. Storm-broken stems of
trees can be collected and transformed into wood
products, while burned forests release CO2 to
atmosphere. There is a dominance of storms among the
natural disturbances, causing 53% of total wood damage,
followed by fires (16%), biotic disturbances (16%, half
of it bark beetle infestation) and snow (3%) (Schelhaas
et al., 2003). Based on the estimates of Schelhaas et al.
(2003) the losses because of fire would be closer to
1.2 � na gC m�2 yr�1 than to 4.7 � 1.3 gC m�2 yr�1 as
estimated by remote sensing (van der Werf et al., 2006).
However, scaling wood damage does not account for the
carbon losses from burning the forest litter. Optical
remote sensing, on the other hand, cannot readily
distinguish between forests and other wooded lands
which are in general more prone to fires. The inventory
and remote sensing approach provide the brackets
that limit our estimates for carbon losses because of
fires. Despite the importance of natural disturbances on
the economy of the forest sector, their immediate im-
pact on NBP appears to be small, i.e. 11 g C m�2 yr�1
(6.5–1.2 1 4.7 g C m�2 yr�1), but their long-term effects,
especially on the soil carbon balance, remain to
be assessed.
Evidence is becoming available that in between major
disturbance, old-growth forests are not carbon neutral as
previously thought (Odum, 1969) but continue to
sequester atmospheric carbon (Pregitzer & Euskirchen,
2004; Luyssaert et al., 2008). In managed forests, practices
such as thinning reduce Rh by the frequent removal of
woody biomass and, thus, C substrates for Rh. However,
thinning products are usually used in wood products
with a short life-span and with burning, CO2 is released
back to the atmosphere. Although management strongly
Table 4 Overview of expected effects of CO2, temperature,
precipitation, N-deposition and management on NBP and its
component fluxes
NPP Rh H F D NBP
[CO2] 1 1 0 0 ? ?
Temperature 1 1 0 1 1 ?
Precipitation 1 1 0 � 1 ?
N-deposition 1 ? 0 0 1 1
Management 1 � 1 � ? �
A positive relationship is shown by ‘ 1 ’ (i.e., higher tempera-
ture result high Rh), a negative relationship by ‘�’ (i.e., more
precipitation results less fires), controls for which no relation-
ship was reported or for which a relationship is thought to be
irrelevant are shown by ‘0’, and when the relationship is
unknown a ‘?’ is shown.
NPP, net primary productivity; Rh, heterotrophic respiration;
H, harvest; F, losses through Fires; D, losses to rivers; NBP, net
biome production.
1444 S . L U Y S S A E R T et al.
r 2009 Blackwell Publishing Ltd, Global Change Biology, 16, 1429–1450

enhances NEP of forests, its effect on NBP is still
controversial as management is likely to add CO2 to
the atmospheric because the reduced life-span of wood
products, even of lumber, is shorter than the life-span of
on-site carbon storage (Harmon et al., 1990). Although
old growth forests are uncommon in the EU-25, extensi-
fying or giving up management may be considered as a
strategy to increase the terrestrial carbon pool in Europe.
Ageing of the currently young European forests is
expected to have a strong positive, albeit transient,
effect on the European carbon sink strength (Vetter
et al., 2005; Ciais et al., 2008b).
Two climate change mitigation strategies each on an
extreme end of the forest management spectrum are
developing. Short rotation forests with high producti-
vities could be established and its wood products (pulp
and energy) would partly substitute the need of fossil
fuels and thus would slow down the emission of CO2.
However, frequent disturbance would result in small
carbon pools and a negligible NBP. On the other hand,
management could be extensified. Large carbon pools
and substantial NBP would come at the cost of lower
productivities than in short rotation systems. Its high-
quality wood products should be put to a chain of
cascading demands, i.e. after an initial use as lumber
the wood could be used as pulp and the pulp burned to
produce energy. The application of these systems should
depend on soil quality, site accessibility and stock price
for CO2 (A. Freibauer, unpublished result).
The NPP of foliage and fine roots, short-lived tissues
that are rapidly transferred to the soil, is between 50%
and 60% of the total NPP for the inventory and ecological
studies, respectively (Ciais et al., 2008b). This leads to a
soil carbon sequestration ratio (NBPsoil/NPPfoliage 1 roots)
of 0.14 � 0.09, and to a live biomass sequestration ratio
(NBPbiomass/NPPwood) of 0.35 � 0.08. Therefore, an
increasing harvest, which is likely because of the
promotion of biomass energy (Ragwitz et al., 2005)
would immediately decrease the forest sector NBP.
Although BIOME-BGC, LPJ-DGVM and ORCHIDEE
do not include harvests and disturbances which is a
prerequisite to predict NBP, comparison of model
outputs with observations are indicative for the impor-
tance of the processes currently absent in the models.
Because a model spin-up guarantees steady-state
conditions at the start of the simulations and these
versions of the models do not account for carbon losses
through harvesting all the carbon remains on-site and is
decomposed by Rh with a time lag. Consequently, almost
all of the NPP (490%) is converted to Rh in the models,
and there is only a very small sink (NEP/NPP) in the
range of 4–10% of the NPP, compared with 36% observed
by inventory and ecological measurements (Table 3).
The discrepancy between modeled and measured NEP
confirms that management practices (Kowalski et al.,
2004), age structure (Kowalski et al., 2004; Magnani
et al., 2007) (i.e., with many young forests accumulating
carbon in the measured NEP estimate) and in some
regions nitrogen deposition (Magnani et al., 2007),
rather than changes in CO2 and climate, control the
carbon sequestration ratio (NBP/NPP) in EU-25 forests.
These models simulate NEP only as affected by
climatic variability, long-term changes in climate, N de-
position (only for BIOME-BGC) and rising CO2 trends.
The models include the effects of CO2 fertilization, and of
the longer growing seasons as a result of global
warming, as a result NPP increases in excess of Rh. The
resulting NEP is, however, a transient effect because in
the long term any increase in NPP will result in an
increase in modeled litter production, which feeds the
soil carbon pool which in turn will result in an increased
modeled Rh. Hence, the modeled NEP ranged from 19 to
47 g C m�2 yr�1 (Table 3). At best, the NEP of these
models can be seen as the fraction of NEP that is
caused by climate change and rising CO2, in the absence
of harvest and disturbances. The ratio of NEPmodels over
NBP inventory, thus, suggests that 20–50% of NBP can be
attributed to changes in climate and CO2 (and nitrogen in
the case of BIOME-BGC), and that the rest of the NBP
were because of aging, management, leaching and fires.
The modified version of LPJ, accounting for forest fires,
management, age-structure and reforestation estimated a
forest NEP of 125 g C m�2 yr�1 (Table 3) of which also
about 50% was caused by non-climatic factors.
Trends in NBP. In forest ecosystems, NBP is mainly rea-
lized in the woody biomass, with smaller contributions
of coarse woody debris and soil organic matter. During
the past 50 years, NPP increased by a factor of 1.7 (Ciais
et al., 2008b). Meanwhile, harvest and fires did not keep
pace with the NPP increase, which resulted in an
increasing woody biomass. The carbon sequestration
ratio (NBP/NPP) between 1950 and 2000 was in general
higher for broadleaved than for conifer species (Fig. 6).
The interannual variability could be owing to changes
in harvest intensity and natural disturbances. NBP is
also realized in coarse woody debris and litter. No long-
term EU-wide observations are available to quantify
changes in litter production.
Last a fraction of NBP is realized through carbon
sequestration in soil organic matter. Despite the
evidence in support of carbon accumulation in forest
soils in Belgium (Lettens et al., 2005), repeated sampling
indicated losses of SOC across England and Wales
(Bellamy et al., 2005) although its drivers are not
necessarily climate related (Fontaine et al., 2007;
Smith et al., 2007) as suggested by the authors. The
difference in sign of the above estimates shows that the
E U R O P E A N C A R B O N B A L A N C E 1445
r 2009 Blackwell Publishing Ltd, Global Change Biology, 16, 1429–1450

current and future drivers and subsequent trends
in carbon sequestration rates in forest soils warrant
future research.
Conclusions and recommendations
The mean forest NPP of EU-25 derived from three
independent approaches, i.e. ecosystem modeling, for-
est inventories, and upscaling of ecological data, was
found to agree within 25%. The overall mean NPP was
520 � 75 g C m�2 yr�1. New estimates of the mean forest
NBP of EU-25, were somewhat lower than previous
estimates, and ranged between 50 and 100 g C m�2 yr�1.
In the EU-25, forest is thus a carbon sink resulting from
changes in forested area (i.e., 5–10%), the juvenile age
structure and the increasing NPP because of CO2-ferti-
lization, elevated atmospheric nitrogen deposition and
climate change (i.e., 20–50%). The carbon sequestration
ratio (NBP/NPP) is 0.10–0.20 for the EU-25 forests.
Although all fluxes were presented with their uncer-
tainty, at present, uncertainties across methods are
inconsistent and reflect only part of the total uncer-
tainty. Consequently, methods that report a low uncer-
tainty are not necessarily more reliable than methods
with a high uncertainty as it is possible that the latter
simply report a more complete uncertainty estimate.
Despite our error analysis being incomplete and uncer-
tain, it gives a sense of the level of uncertainty that
we are dealing with to estimate carbon sinks/sources at
the regional level. Currently, any individual method is
prone to so much uncertainty that several, preferably
independent, methods need to be used to estimate a
regional C budget. Confidence concerning the accuracy
of such a budget is given by convergence across
methods of the different flux estimates rather than
low uncertainty within methods. Ideally, several pre-
cise estimates obtained from independent methods
should converge.
Convergence of the NPP estimates obtained from
different methods could be further improved by sepa-
rately analyzing wood, leaf and root NPP between
models and data, and between forest inventories
and ecological sites. Performance of the models could
be enhanced by accounting for processes that control
regional variation in growth (i.e., nutrient availability,
drought tolerance, crown development) and an en-
hanced representation of vegetation diversity in the
PFT. This will allow for a more direct NPP comparison
with inventory data. All observation-based estimates
would benefit from further harmonizing ecological
measurements and national inventory data (e.g., roots
and leaves expansion factors). Extension of all the
ecosystem models with management rules (i.e., Thorn-
ton et al., 2002; Zaehle et al., 2007) should be a priority as
this will enable a more direct comparison between
modeled and observed NBP estimates. Moreover, the
depletion of soil C because of past management prac-
tices should be taken into account, as the assumption of
steady-state conditions is likely to overestimate Rh and
underestimate NBP. Currently all large-scale SOC esti-
mates and carbon losses from soils to rivers are mod-
eled based on sparse observations. Consequently,
improving process understanding and extending direct
observations through repeated sampling is likely to
reduce the uncertainty in the SOC, DOC and thus the
NBP estimates.
Acknowledgements
We thank all site investigators, their funding agencies and thevarious regional flux networks and the Fluxnet project, whosesupport is essential for obtaining the measurements withoutwhich the type of integrated analyses conducted in this studywould not be possible. Koen Hufkens prepared Fig. 1, artworkcourtesy of the Integration and Application Network (http://ian.umces.edu/symbols/), University of Maryland Center forEnvironmental Science. Funding was received from CarboEu-rope-IP, Centre of Excellence ECO (UA-Methusalem) and theResearch Foundation – Flanders (FWO-Vlaanderen) who sup-ported SL with a post-doctoral fellowship and a research grant.
References
Achard F, Eva HD, Mollicone D, Beuchle R (2007) The effect of climate
anomalies and human ignition factor on wildfires in Russian boreal
forests. Philosophical Transactions of the Royal Society of London Series B –
Biological Sciences, doi: 10.1098/rstb.2007.2203.
Arneth A, Schurgers G, Hickler T, Miller PA (2008) Effects of species
composition, land surface cover, CO2 concentration and climate on
isoprene emissions from European forests. Plant Biology, 10, 150–162.
Fig. 6 Standing biomass C stocks as a function of net biome
production (NBP) since 1950. One can see that for a given net
primary productivity (NPP), the NBP is higher for broadleaved
than for conifer forests, most likely because harvest removals is a
lower fraction of wood NPP in broadleaved than in conifer
forests (see Fig. 4). Each point corresponds to the average value
for one decade since 1950.
1446 S . L U Y S S A E R T et al.
r 2009 Blackwell Publishing Ltd, Global Change Biology, 16, 1429–1450

Baldocchi D, Falge E, Gu LH et al. (2001) FLUXNET: a new tool to study
the temporal and spatial variability of ecosystem-scale carbon dioxide,
water vapor, and energy flux densities. Bulletin of the American Meteor-
ological Society, 82, 2415–2434.
Behre KE (1988) Vegetation history. In: Handbook of Vegetation Science, Vol 7
(eds Huntley B, Webb T), pp. 633–672. Kluwer Academic Publisher,
Dordrecht.
Bellamy PH, Loveland PJ, Bradley RI, Lark RM, Kirk GJD (2005) Carbon
losses from all soils across England and Wales 1978–2003. Nature, 437,
245–248.
Beniston M (2004) The 2003 heat wave in Europe: a shape of things to
come? An analysis based on Swiss climatological data and model
simulations. Geophysical Research Letters, 31, L02202, doi: 10.1029/
2003GL018857.
Berg B, Matzner E (1997) Effect of N deposition on decomposition of plant
litter and soil organic matter in forest systems. Environmental Reviews, 5,
1–25.
Bond-Lamberty B, Peckham SD, Ahl DE, Gower ST (2007) Fire as the
dominant driver of central Canadian boreal forest carbon balance.
Nature, 450, 89.
Bowden RD, Davidson E, Savage K, Arabia C, Steudler P (2004) Chronic
nitrogen additions reduce total soil respiration and microbial respira-
tion in temperate forest soils at the Harvard Forest. Forest Ecology and
Management, 196, 43.
Bradshaw RHW (2004) Past anthropogenic influence on European forests
and some possible genetic consequences. Forest Ecology and Manage-
ment, 197, 203–212.
Buchmann N, Schulze ED (1999) Net CO2 and H2O fluxes of terrestrial
ecosystems. Global Biogeochemical Cycles, 13, 751–760.
Burgi M, Gimmi U (2007) Three objectives of historical ecology: the case of
litter collecting in Central Europe. Landscape Ecology, 22, 77–87.
Burton AJ, Pregitzer KS, Crawford JN, Zogg GP, Zak DR (2004) Simulated
chronic NO3-deposition reduces soil respiration in northern hardwood
forests. Global Change Biology, 10, 1080–1091.
Cao MK, Woodward FI (1998) Dynamic responses of terrestrial ecosystem
carbon cycling to global climate change. Nature, 393, 249–252.
Chapin FS, Woodwell GM, Randerson JT et al. (2005) Reconciling
carbon-cycle concepts, terminology and methodology. Ecosystems, 9,
1041–1050.
Churkina G, Running SW (1998) Contrasting climatic controls on the
estimated productivity of global terrestrial biomes. Ecosystems, 1,
206–215.
Churkina G, Trusilova K, Vetter M, Dentener F (2007) Contributions of
nitrogen deposition and forest regrowth to terrestrial carbon uptake.
Carbon Balance and Management, 2, 5.
Ciais P, Borges AV, Abril G, Meybeck M, Folberth G, Hauglustaine D,
Janssens IA (2008a) The impact of lateral carbon fluxes on the European
carbon balance. Biogeosciences, 5, 1259–1271.
Ciais P, Bousquet P, Freibauer A, Naegler T (2007) Horizontal displace-
ment of carbon associated with agriculture and its impacts on atmo-
spheric CO2. Global Biogeochemical Cycles, 21, GB2014, doi: 10.1029/
2006GB002741.
Ciais P, Reichstein M, Viovy N et al. (2005) Europe-wide reduction in
primary productivity caused by the heat and drought in 2003. Nature,
437, 529–533.
Ciais P, Schelhaas MJ, Zaehle S et al. (2008b) Carbon accumulation in
European forests. Nature Geoscience, 1, 425–429.
Ciais P, Soussana JF, Vuichard N et al. The European carbon balance.
Part 1: Grasslands. Global Change Biology.
Ciais P, Wattenbach M, Vuichard N (2010) The European carbon balance.
Part 2: croplands. Global Change Biology, 16, 1409–1428.
COM (2008) Directive of the European Parliament and of the Council on the
Promotion of the Use of Energy from Renewable Sources. Commission of the
European Communities, Brussels, Belgium.
Cramer W, Bondeau A, Woodward FI et al. (2001) Global response of
terrestrial ecosystem structure and function to CO2 and climate change:
results from six dynamic global vegetation models. Global Change
Biology, 7, 357–373.
Davidson EA, Chorover J, Dail DB (2003) A mechanism of abiotic
immobilization of nitrate in forest ecosystems: the ferrous wheel
hypothesis. Global Change Biology, 9, 228–236.
Davidson EA, Janssens IA (2006) Temperature sensitivity of soil carbon
decomposition and feedbacks to climate change. Nature, 440, 165–173.
Davidson EA, Janssens IA, Luo Y (2006) On the variability of respiration
in terrestrial ecosystems: moving beyond Q10. Global Change Biology, 12,
154–164.
DeForest JL, Zak DR, Pregitzer KS, Burton AJ (2004) Atmospheric nitrate
deposition and the microbial degradation of cellobiose and vanillin in a
northern hardwood forest. Soil Biology and Biochemistry, 36, 965–971.
Dentener F, Drevet J, Lamarque JF et al. (2006) Nitrogen and sulfur
deposition on regional and global scales: a multimodel evaluation.
Global Biogeochemical Cycles, 20, GB4003, doi: 10.1029/2005GB002672.
Dentener FJ (2006) Global Maps of Atmospheric Nitrogen Deposition, 1860, 1993,
and 2050. Oak Ridge National Laboratory Distributed Active Archive
Center, Oak Ridge, TN, USA, Available at: http://www.daac.ornl.gov/
Durr HH, Meybeck M, Durr SH (2005) Lithologic composition of the
Earth’s continental surfaces derived from a new digital map emphasiz-
ing riverine material transfer. Global Biogeochemical Cycles, 19, GB4S10,
doi: 10.1029/2005GB002515.
EEA (2006) How Much Biomass Can Europe Use Without Harming the
Environment? European Environmental Agency, Luxembourg, Europe.
EEA (2007) Update of Corine Land Cover 2000. European Environmental
Agency, Luxembourg, Europe. Available at: http://www.eea.europa.eu.
Eurostat (2008) Natural Resources. Statistical Office of the European Com-
munities, Luxembourg, Europe. Available at: http://epp.eurostat.
ec.europa.eu
FAO (2007) State of the World’s Forests 2007. Food and Agriculture
Organization of the United Nations, Rome.
FAO (2008) FAOSTAT Forest Products and Trade. FAO, Available at: http://
www.fao.org/forestry/site/databases/en/
Fog K (1988) The effect of added nitrogen on the rate of decomposition of
organic matter. Biological Reviews, 63, 433–462.
Fontaine S, Barot S, Barre P, Bdioui N, Mary B, Rumpel C (2007) Stability
of organic carbon in deep soil layers controlled by fresh carbon supply.
Nature, 450, 277–280.
Froberg M, Berggren D, Bergkvist B, Bryant C, Mulder J (2006) Concen-
tration and fluxes of dissolved organic carbon (DOC) in three Norway
spruce stands along a climatic gradient in Sweden. Biogeochemistry,
77, 1–23.
Galloway JN, Dentener FJ, Capone DG et al. (2004) Nitrogen cycles: past,
present, and future. Biogeochemistry, 70, 153–226.
Gamache I, Payette S (2004) Height growth response of tree line black
spruce to recent climate warming across the forest-tundra of eastern
Canada. Journal of Ecology, 92, 835–845.
Giglio L, van der Werf GR, Randerson JT, Collatz GJ, Kasibhatla P (2006)
Global estimation of burned area using MODIS active fire observations.
Atmospheric Chemistry and Physics, 6, 957–974.
Gill RA, Anderson LJ, Polley HW, Johnson HB, Jackson RB (2006)
Potential nitrogen constraints on soil carbon sequestration under low
and elevated atmospheric CO2. Ecology, 87, 41–52.
Goldberg SD, Gebauer G (2009) Drought turns a Central European
Norway spruce forest soil from an N2O source to a transient N2O sink.
Global Change Biology, 15, 850–860.
Goodale CL, Apps MJ, Birdsey RA et al. (2002) Forest carbon sinks in the
Northern Hemisphere. Ecological Applications, 12, 891–899.
Granier A, Reichstein M, Breda N et al. (2007) Evidence for soil water control
on carbon and water dynamics in European forests during the extremely
dry year: 2003. Agricultural and Forest Meteorology, 143, 123–145.
E U R O P E A N C A R B O N B A L A N C E 1447
r 2009 Blackwell Publishing Ltd, Global Change Biology, 16, 1429–1450

Hanson PJ, Edwards NT, Garten CT, Andrews JA (2000) Separating root
and soil microbial contributions to soil respiration: a review of methods
and observations. Biogeochemistry, 48, 115–146.
Harmon ME, Ferrell WK, Franklin JF (1990) Effects on carbon storage of
conversion of old-growth forests to young forests. Science, 247, 699–702.
Harrison AF, Taylor K, Scott A et al. (2008) Potential effects of climate
change on DOC release from three different soil types on the Northern
Pennines UK: examination using field manipulation experiments.
Global Change Biology, 14, 687–702.
Hirsch K, Kafka V, Tymstra C et al. (2001) Fire-smart forest management: a
pragmatic approach to sustainable forest management in fire-domi-
nated ecosystems. Forestry Chronicle, 77, 357–363.
Holland EA, Braswell BH, Sulzman JM, Lamarque J-FDsAo-lhwdog-
fORNLDAAC, Oak Ridge, TN, USA (2005) Nitrogen Deposition onto
the United States and Western Europe. Oak Ridge National Laboratory
Distributed Active Archive Center, Oak Ridge, TN, USA, Available at:
http://www.daac.ornl.gov/.
Janssens IA, Freibauer A, Ciais P et al. (2003) Europe’s terrestrial bio-
sphere absorbs 7 to 12% of European anthropogenic CO2 emissions.
Science, 300, 1538–1542.
Janssens IA, Lankreijer H, Matteucci G et al. (2001) Productivity over-
shadows temperature in determining soil and ecosystem respiration
across European forests. Global Change Biology, 7, 269–278.
Janssens IA, Luyssaert S (2009) Carbon cycle: nitrogen’s carbon bonus.
Nature Geoscience, 2, 318–319.
Johann E (2007) Traditional forest management under the influence of
science and industry: the story of the alpine cultural landscapes. Forest
Ecology and Management, 249, 54–62.
Jump AS, Hunt JM, Penuelas J (2006) Rapid climate change-related
growth decline at the southern range edge of Fagus sylvatica. Global
Change Biology, 12, 2163–2174.
Jung M, Le Maire G, Zaehle S et al. (2007a) Assessing the ability of
three land ecosystem models to simulate gross carbon uptake of forests
from boreal to Mediterranean climate in Europe. Biogeosciences, 4,
647–656.
Jung M, Vetter M, Herold M et al. (2007b) Uncertainties of modeling gross
primary productivity over Europe: a systematic study on the effects of
using different drivers and terrestrial biosphere models. Global Biogeo-
chemical Cycles, 21, GB4021, doi: 10.1029/2006GB002915.
Jungkunst HF, Fiedler S (2007) Latitudinal differentiated water table
control of carbon dioxide, methane and nitrous oxide fluxes from
hydromorphic soils: feedbacks to climate change. Global Change Biology,
13, 2668–2683.
Kauppi PE, Mielikainen K, Kuusela K (1992) Biomass and carbon budget
of European forests, 1971 to 1990. Science, 256, 70–74.
Knorr M, Frey SD, Curtis PS (2005) Nitrogen additions and litter decom-
position: a meta-analysis. Ecology, 86, 3252–3257.
Kowalski AS, Loustau D, Berbigier P et al. (2004) Paired comparisons of
carbon exchange between undisturbed and regenerating stands in four
managed forests in Europe. Global Change Biology, 10, 1707–1723.
Krinner G, Viovy N, de Noblet-Ducoudre N et al. (2005) A dynamic global
vegetation model for studies of the coupled atmosphere-biosphere
system. Global Biogeochemical Cycles, 19, GB1015, doi: 10.1029/
2003GB002199.
Kuiper LC, Sikkema R, Stolp JAN (1998) Establishment needs for short
rotation forestry in the EU to meet the goals of the commission’s white
paper on renewable energy (November 1997). Biomass and Bioenergy, 15,
451–456.
Lasslop G, Reichstein M, Kattge J, Papale D (2008) Influences of observa-
tion errors in eddy flux data on inverse model parameter estimation.
Biogeosciences, 5, 1311–1324.
Law BE, Falge E, Gu L et al. (2002) Environmental controls over carbon
dioxide and water vapor exchange of terrestrial vegetation. Agricultural
and Forest Meteorology, 113, 97–120.
Lehner B, Doll P (2004) Development and validation of a global
database of lakes, reservoirs and wetlands. Journal of Hydrology, 296,
1–22.
Lettens S, van Orshoven J, van Wesemael B, Muys B, Perrin D (2005)
Soil organic carbon changes in landscape units of Belgium between
1960 and 2000 with reference to 1990. Global Change Biology, 11,
2128–2140.
Lieth HFH, Whittaker RH (1975) Primary Productivity of the Biosphere.
Springer-Verlag, New York.
Lindroth A, Lagergren F, Grelle A, Klemedtsson L, Langvall O, Weslien P,
Tuulik J (2009) Storms can cause Europe-wide reduction in forest
carbon sink. Global Change Biology, 15, 346–355.
Liski J, Korotkov AV, Prins CFL, Karjalainen T, Victor DG, Kauppi PE
(2003) Increased carbon sink in temperate and boreal forests. Climatic
Change, 61, 89–99.
Liski J, Palosuo T, Peltoniemi M, Sievanen R (2005) Carbon and
decomposition model Yasso for forest soils. Ecological Modelling, 189,
168–182.
Liski J, Perruchoud D, Karjalainen T (2002) Increasing carbon stocks
in forest soils of western Europe. Forest Ecology and Management, 169,
159–175.
Logan JA, Regniere J, Powell JA (2003) Assessing the impacts of global
warming on forest pest dynamics. Frontiers in Ecology and the Environ-
ment, 1, 130–137.
Loveland TR, Reed BC, Brown JF, Ohlen DO, Zhu Z, Yang L, Merchant JW
(2000) Development of a global land cover characteristics database and
IGBP DISCover from 1 km AVHRR data. International Journal of Remote
Sensing, 21, 1303–1330.
Luo Y (2007) Terrestrial carbon-cycle feedback to climate warming.
Annual Review of Ecology Evolution and Systematics, 38, 683–712.
Luterbacher J, Dietrich D, Xoplaki E, Grosjean M, Wanner H (2004)
European seasonal and annual temperature variability, trends, and
extremes since 1500. Science, 303, 1499–1503.
Luyssaert S, Inglima I, Jung M et al. (2007) CO2-balance of boreal,
temperate and tropical forest derived from a global database. Global
Change Biology, 13, 2509–2537.
Luyssaert S, Reichstein M, Schulze E-D et al. (2009) Towards a consistency
cross-check of eddy covariance flux based and biometric estimates of
ecosystem carbon balance. Global Biogeochemical Cycles, 23, GB3009, doi:
10.1029/2008GB003377.
Luyssaert S, Schulze E-D, Borner A et al. (2008) Old growth forests as
global carbon sinks. Nature, 455, 213–215.
Mack MC, Schuur EAG, Bret-Harte MS, Shaver GR, Chapin FS (2004)
Ecosystem carbon storage in artic tundra reduced by long-term ferti-
lization. Nature, 431, 440–443.
Magnani F, Mencuccini M, Borghetti M et al. (2007) The human foot-
print in the carbon cycle of temperate and boreal forests. Nature, 447,
848–850.
Mason CL, Lippke BR, Zobrist KW et al. (2006) Investments in fuel
removals to avoid forest fires result in substantial benefits. Journal of
Forestry, 104, 27–31.
Meehl GA, Stocker TF, Collins WD et al. (2007) Global climate projections.
In: Climate Change 2007: The Physical Science Basis. Contribution of
Working Group I to the Fourth Assessment Report of the Intergovernmental
Panel on Climate Change (eds Solomon S., Qin D, Manning M,
Chen Z, Marquis M, Averyt KB, Tignor M, Miller HL), pp. 747–845.
Cambridge University Press, Cambridge, UK and New York, NY,
USA.
Meybeck M (1987) Global chemical weathering of surficial rocks
estimated from river dissolved loads. American Journal of Science, 287,
401–428.
Meybeck M, Ragu A (2006) River Discharges to the Oceans, An Assessment of
Suspended Solids, Major Ions, and Nutrients. Environment Information
and Assessment Report. UNEP, 250 pp.
1448 S . L U Y S S A E R T et al.
r 2009 Blackwell Publishing Ltd, Global Change Biology, 16, 1429–1450

Meyer J (2005) Fire Effects on Forest Resource Development in the French
Mediterranean Region – Projections with a Large-Scale Forest Scenario
Model. European Forest Institute, Joensuu, Finland.
Meyer J, Vilen T, Peltoniemi M, Faubert P, Thurig E, Lindner M (2005)
Uncertainty Estimate of the National Level Biomass and Soil Carbon Stock
and Stock Change. Multi-Source Inventory Methods for Quantifying Carbon
Stocks and Stock Changes in European Forests, CarboInvent. European
Forest Institute and Joanneum Research, Joensuu, Finland.
Michalzik B, Kalbitz K, Park JH, Solinger S, Matzner E (2001) Fluxes and
concentrations of dissolved organic carbon and nitrogen – a synthesis
for temperate forests. Biogeochemistry, 52, 173–205.
Miller C, Urban DL (2000) Modeling the effects of fire management
alternatives on Sierra Nevada mixed-conifer forests. Ecological Applica-
tions, 10, 85–94.
Mitchell TD, Jones PD (2005) An improved method of constructing a
database of monthly climate observations and associated high-reso-
lution grids. International Journal of Climatology, 25, 693–712.
Mo J, Zhang WEI, Zhu W, Gundersen PER, Fang Y, Li D, Wang HUI (2008)
Nitrogen addition reduces soil respiration in a mature tropical forest in
southern China. Global Change Biology, 14, 403–412.
Moffat AJ, Papale D, Reichstein M et al. (2007) Comprehensive compar-
ison of gap-filling techniques for eddy covariance net carbon fluxes.
Agricultural and Forest Meteorology, 147, 209–232.
Mollicone D, Eva HD, Achard F (2006) Ecology: human role in Russian
wild fires. Nature, 440, 436.
Monteith DT, Stoddard JL, Evans CD et al. (2007) Dissolved organic
carbon trends resulting from changes in atmospheric deposition chem-
istry. Nature, 450, 537–540.
Nabuurs GJ, Paivinen R, Sikkema R, Mohren GMJ (1997) The role of
European forests in the global carbon cycle – a review. Biomass and
Bioenergy, 13, 345–358.
Nabuurs G-J, Pussinen A, Karjalainen T, Erhard M, Kramer K (2002)
Stemwood volume increment changes in European forests due to
climate change – a simulation study with the EFISCEN model. Global
Change Biology, 8, 304–316.
Nabuurs GJ, Schelhaas MJ, Mohren GMJ, Field CB (2003) Temporal
evolution of the European Forest carbon sink from 1950 to 1999. Global
Change Biology, 9, 152–160.
Neff JC, Townsend AR, Gleixner G, Lehman SJ, Turnbull J, Bowman WD
(2002) Variable effects of nitrogen additions on the stability and turn-
over of soil carbon. Nature, 419, 915–917.
Nilsson SI, Andersson S, Valeur I, Persson T, Bergholm J, Wiren A (2001)
Influence of dolomite lime on leaching and storage of C, N and S in a
Spodosol under Norway spruce (Picea abies (L.) Karst.). Forest Ecology
and Management, 146, 55–73.
Norby RJ, DeLucia EH, Gielen B et al. (2005) Forest response to elevated
CO2 is conserved across a broad range of productivity. Proceedings of
the National Academy of Sciences of the United States of America, 102,
18052–18056.
Odum EP (1969) The strategy of ecosystem development. Science, 164,
262–270.
Olsson P, Linder S, Giesler R, Hogberg P (2005) Fertilization of boreal
forest reduces both autotrophic and heterotrophic soil respiration.
Global Change Biology, 11, 1745–1753.
Palma CD, Cui W, Martell DL, Robak D, Weintraub A (2007) Assessing the
impact of stand-level harvests on the flammability of forest landscapes.
International Journal of Wildland Fire, 16, 584–592.
Papale D, Reichstein M, Aubinet M et al. (2006) Towards a standardized
processing of net ecosystem exchange measured with eddy covariance
technique: algorithms and uncertainty estimation. Biogeosciences, 3,
571–583.
Papale D, Valentini A (2003) A new assessment of European forests
carbon exchanges by eddy fluxes and artificial neural network spatia-
lization. Global Change Biology, 9, 525–535.
Parmesan C, Yohe G (2003) A globally coherent fingerprint of climate
change impacts across natural systems. Nature, 421, 37–42.
Parton W, Silver WL, Burke IC et al. (2007) Global-scale similarities in
nitrogen release patterns during long-term decomposition. Science, 315,
361–364.
Percy KE, Awmack CS, Lindroth RL et al. (2002) Altered performance of
forest pests under atmospheres enriched by CO2 and O3. Nature, 420,
403–407.
Persson T, Karlsson PS, Seyferth U, Rudebeck A (2000) Carbon miner-
alisation in European forest soils. In: Carbon and Nitrogen Cycling in
European Forest Ecosystems. Ecological Studies, Vol. 142 (ed. Schulze E-D),
pp. 257–275. Springer-Verlag, Berlin.
Phillips RP, Fahey TJ (2007) Fertilization effects on fine root biomass,
rhizosphere microbes and respiratory fluxes in hardwood forest soils.
New Phytologist, 176, 655–664.
Piao SL, Ciais P, Friedlingstein P et al. (2008) Net carbon dioxide losses of
northern ecosystems in response to autumn warming. Nature, 451, 49–52.
Potter C, Klooster S, Myneni R, Genovese V, Tan PN, Kumar V (2003)
Continental scale comparisons of terrestrial carbon sinks estimated
from satellite data and ecosystem modeling 1982–98. Global and Plane-
tary Change, 39, 201–213.
Pregitzer KS, Burton AJ, Zak DR, Talhelm AF (2008) Simulated chronic
nitrogen deposition increases carbon storage in Northern Temperate
forests. Global Change Biology, 14, 142–153.
Pregitzer KS, Euskirchen ES (2004) Carbon cycling and storage in world
forests: biome patterns related to forest age. Global Change Biology, 10,
2052–2077.
Profft I, Mund M, Weber GE, Weller E, Schulze E-D (2008) Forest manage-
ment and carbon sequestration in wood products. European Journal of
Forest Research, 128, 399–413.
Ragwitz M, Schleich J, Huber C et al. (2005) FORRES 2020: Analysis of the
renewable energy sources’ evolution up to 2020. Fraunhofer ISI, EEG,
ECOFYS, KEMA and REC supported by EC TREN/D2/10-2002, 89 pp.
Raich JW, Nadelhoffer KJ (1989) Belowground carbon allocation in forest
ecosystems – global trends. Ecology, 70, 1346–1354.
Randerson JT, Chapin FS, Harden JW, Neff JC, Harmon ME (2002) Net
ecosystem production: a comprehensive measure of net carbon accu-
mulation by ecosystems. Ecological Applications, 12, 937–947.
Reich PB, Tjoelker MG, Machado J-L, Oleksyn J (2006) Universal scaling of
respiratory metabolism, size and nitrogen in plants. Nature, 439, 457.
Reichstein M, Ciais P, Papale D et al. (2007a) Reduction of ecosystem
productivity and respiration during the European summer 2003 cli-
mate anomaly: a joint flux tower, remote sensing and modelling
analysis. Global Change Biology, 13, 634–651.
Reichstein M, Papale D, Valentini R et al. (2007b) Determinants of
terrestrial ecosystem carbon balance inferred from European eddy
covariance flux sites. Geophysical Research Letters, 34, L01402, doi:
10.1029/2006GL027880.
Richardson AD, Hollinger DY, Burba GG et al. (2006) A multi-site analysis
of random error in tower-based measurements of carbon and energy
fluxes. Agricultural and Forest Meteorology, 136, 1–18.
Schelhaas MJ, Nabuurs GJ, Schuck A (2003) Natural disturbances in the
European forests in the 19th and 20th centuries. Global Change Biology, 9,
1620–1633.
Schelhaas MJ, Varis S, Schuck A (2001) Database on Forest Disturbances in
Europe (DFDE). European Forest Institute, Joensuu, Finland, Available
at: http://www.efi.int/databases.
Schulte E, Schmuck G, San-Miguel-Ayanz J, Barbosa P, Liberta G (2002)
Forest Fires in Europe 2001 fire campaign. Official Publication of the
European Commission. Commission of the European Communities.
27 pp.
Schulze E-D (2000) The carbon and nitrogen cycle in forest ecosystems. In:
Carbon and Nitrogen Cycling in European Forest Ecosystems. Ecological
Studies, Vol. 142 (ed. Schulz E-D), Springer, Berlin.
E U R O P E A N C A R B O N B A L A N C E 1449
r 2009 Blackwell Publishing Ltd, Global Change Biology, 16, 1429–1450

Schulze ED, Heimann M (1998) Carbon and water exchange of terrestrial
systems. In: Asian Change in the Context of Global Change. IGBP series,
Vol. 3 (eds Galloway JN, Melillo J), pp. 145–161. Cambridge University
Press, Cambridge.
Siemens J (2003) The European carbon budget: a gap. Science, 302, 1681.
Simon V, Luchetta L, Torres L (2001) Estimating the emission of volatile
organic compounds (VOC) from the French forest ecosystem. Atmo-
spheric Environment, 35, 115–126.
Sitch S, Cox PM, Collins WJ, Huntingford C (2007) Indirect radiative
forcing of climate change through ozone effects on the land-carbon
sink. Nature, 448, 791–794.
Sitch S, Smith B, Prentice IC et al. (2003) Evaluation of ecosystem
dynamics, plant geography and terrestrial carbon cycling in the LPJ
Dynamic Global Vegetation Model. Global Change Biology, 9, 161–185.
Smemo KA, Zak DR, Pregitzer KS (2006) Chronic experimental NO3-
deposition reduces the retention of leaf litter DOC in a northern
hardwood forest soil. Soil Biology & Biochemistry, 38, 1340–1347.
Smith P, Chapman SJ, Scott WA et al. (2007) Climate change cannot be
entirely responsible for soil carbon loss observed in England and
Wales, 1978–2003. Global Change Biology, 13, 2605–2609.
Taylor BN, Kuyatt CE (1994) NIST Technical Note 1297 Guide for evaluating
and expressing the uncertainty of NIST measurement results. United States
Department of Commerce Technology Administration, National Insti-
tute of Standards and Technology. 25 pp.
Thornton PE (1998) Regional ecosystem simulation: combining surface and
satellite-based observations to study linkages between terrestrial energy and
mass budgets. University of Montana, Missoula. PhD thesis, 280 pp.
Thornton PE, Law BE, Gholz HL et al. (2002) Modeling and measuring the
effects of disturbance history and climate on carbon and water budgets
in evergreen needleleaf forests. Agricultural and Forest Meteorology, 113,
185–222.
Trusilova K, Trembath J, Churkina G (2009) Parameter estimation and
validation of the terrestrial ecosystem model BIOME-BGC using eddy-
covariance flux measurements. Technical Reports. Max-Planck Institute
for Biogeochemistry.
UN-ECE, FAO (1985) The forest resources of the ECE region (Europe, the USSR
and North America): United Nations Economic Commission for Europe, Food
and Agriculture Organization. United Nations Economic Commission for
Europe; Food and Agricultural Organization.
UN-ECE, FAO (1992) The Forest Resources of the Temperate Zones, The UN-
ECE/FAO 1990 Forest Resource Assessment. Vol. 1. General Forest Re-
source Information. United Nations Economic Commission for Europe;
Food and Agricultural Organization.
UN-ECE, FAO (2000a) Forest resources of Europe, CIS, North America,
Australia, Japan and New Zealand (industrialized temperate/boreal coun-
tries): UN-ECE/FAO contribution to the global forest resources Assessment
2000. United Nations Economic Commission for Europe; Food and
Agricultural Organization. 445 pp.
UN-ECE, FAO (2000b) Temperate and boreal forest resource assessment.
United Nations Economic Commission for Europe; Food and Agricul-
tural Organization. 445 pp.
UN-ECE, FAO (2005) European Forest Sector Outlook Study 1960–2000–2020.
United Nations Economic Commission for Europe; Food and Agricul-
tural Organization. 265 pp.
UN-ECE, FAO (2007) State of Europe’s forests 2007. The MCPFE report on
sustainable forest management in Europe. Liaison unit, Warsaw. 247 pp.
van der Werf GR, Randerson JT, Giglio L, Collatz GJ, Kasibhatla PS, Arellano
AF (2006) Interannual variability in global biomass burning emissions
from 1997 to 2004. Atmospheric Chemistry and Physics, 6, 3423–3441.
Vetter M, Churkina G, Jung M et al. (2008) Analyzing the causes and
spatial pattern of the European 2003 carbon flux anomaly using seven
models. Biogeosciences, 5, 561–583.
Vetter M, Wirth C, Bottcher H, Churkina G, Schulze ED, Wutzler T,
Weber G (2005) Partitioning direct and indirect human-induced
effects on carbon sequestration of managed coniferous forests using
model simulations and forest inventories. Global Change Biology, 11,
810–827.
Wermelinger B (2004) Ecology and management of the spruce bark beetle
Ips typographus – a review of recent research. Forest Ecology and Manage-
ment, 202, 67–82.
Westerling AL, Hidalgo HG, Cayan DR, Swetnam TW (2006) Warming
and earlier spring increase western U.S. forest wildfire activity. Science,
313, 940–943.
White AM, Thornton PE, Running SW, Nemani RR (2000) Parameteriza-
tion and sensitivity analysis of the BIOME-BGC terrestrial ecosystem
model: net primary production controls. Earth Interactions, 4, 85.
Worrall F, Harriman R, Evans CD et al. (2004) Trends in dissolved organic
carbon in UK rivers and lakes. Biogeochemistry, 70, 369–402.
Wright IJ, Reich PB, Westoby M et al. (2004) The worldwide leaf economics
spectrum. Nature, 428, 821–827.
Wright JP, Naeem S, Hector A, Lehman C, Reich PB, Schmid B, Tilman D
(2006) Conventional functional classification schemes underestimate
the relationship with ecosystem functioning. Ecology Letters, 9, 111–120.
Zaehle S, Bondeau A, Carter TR et al. (2007) Projected changes in
terrestrial carbon storage in Europe under climate and land-use
change, 1990–2100. Ecosystems, 10, 380–401.
Zaehle S, Sitch S, Prentice IC, Liski J, Cramer W, Erhard M, Hickler T, Smith B
(2006) The importance of age-related decline in forest NPP for modeling
regional carbon balances. Ecological Applications, 16, 1555–1574.
Zaehle S, Sitch S, Smith B, Hatterman F (2005) Effects of parameter
uncertainties on the modeling of terrestrial biosphere dynamics. Global
Biogeochemical Cycles, 19, GB3020, doi: 10.1029/2004GB002395.
Zhao M, Running SW, Nemani RR (2006) Sensitivity of Moderate Resolu-
tion Imaging Spectroradiometer (MODIS) terrestrial primary produc-
tion to the accuracy of meteorological reanalyses. Journal of Geophysical
Research – Biogeosciences, 111, G01002.
1450 S . L U Y S S A E R T et al.
r 2009 Blackwell Publishing Ltd, Global Change Biology, 16, 1429–1450