The euro area economy: a longer term perspective
24
The euro area economy: a longer-term perspective ECB Central Banking Seminar Frankfurt am Main, 2 July 2019 Agostino Consolo Supply Side, Labour and Surveillance Division Directorate General Economics European Central Bank ECB - Public
Transcript of The euro area economy: a longer term perspective

The euro area economy: a longer-term perspective
ECB Central Banking Seminar Frankfurt am Main, 2 July 2019
Agostino Consolo Supply Side, Labour and Surveillance Division Directorate General Economics European Central Bank
ECB - Public

Rubric
www.ecb.europa.eu © 2
ECB - Public Overview of the talk
A. Motivation
B. Long-term drivers of productivity growth
• Innovation, R&D and intangible capital;
• Capital and labour (inc. demographics)
• Factors’ allocation and efficiency
C. Heterogeneity
• Across countries (convergence) and individuals (inequality)
D. New challenges
• Digitalisation, Automation and AI
• Climate change
The euro area economy: a longer-term perspective
Rubric
www.ecb.europa.eu © 3
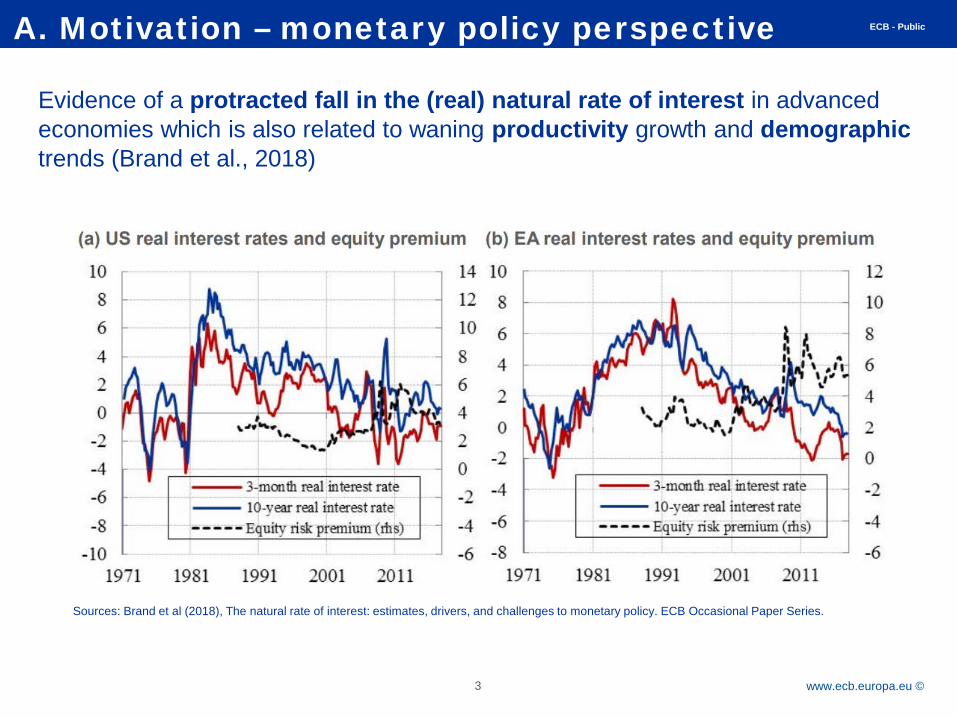
ECB - Public A. Motivation – monetary policy perspective
Sources: Brand et al (2018), The natural rate of interest: estimates, drivers, and challenges to monetary policy. ECB Occasional Paper Series.
Evidence of a protracted fall in the (real) natural rate of interest in advanced economies which is also related to waning productivity growth and demographic trends (Brand et al., 2018)

Rubric
www.ecb.europa.eu © 4
ECB - Public Overview
A. Motivation
B. Long-term drivers of productivity growth
• Innovation, R&D and intangible capital;
• Capital and labour (inc. demographics)
• Factors’ allocation and efficiency
C. Heterogeneity
• Across countries (convergence) and individuals (inequality)
D. New challenges
• Digitalisation, Automation and AI
• Climate change

Rubric
www.ecb.europa.eu © 5
ECB - Public B.1 A simple view on potential growth
Total hours worked and human capital Physical and technological capital TFP (R&D, innovation) and …
• Country institutional factors • Framework conditions • Public administration efficiency • Firm organisational capital • Spillovers - Global Value Chain
Long-term drivers of productivity are the engine of sustainable economic growth
A macro-view on the drivers of output (and productivity)

Rubric
www.ecb.europa.eu © 6
ECB - Public B.2 Productivity developments There is no unique way to measure aggregate productivity and each indicator has some drawbacks. According to two standard measures, GDP per hours and TFP, there is evidence of a productivity slowdown across major advanced economies
Source: European Commission, Eurostat, AMECO database. Note: Definition of both measures follows the one in the AMECO database. The interquartile range (IQR) and the average refer to the following countries: Canada, EA-12, Japan, UK and US. TFP growth is not adjusted for capacity utilisation.

Rubric
www.ecb.europa.eu © 7
ECB - Public B.3 Euro area labour productivity A quantitative representation of productivity growth in the euro area highlights the role of TFP and ICT capital
Contributions to labour productivity growth (per hour)
Sources: EU KLEMS and ECB staff calculations (see ECB Occasional Paper on Economic Structures 20 Years into the Euro, No 224, 2019). Notes: LPH is the sum of non-ICT and ICT capital, labour composition and TFP. The contribution to the knowledge economy is given by the sum of the latter three. Data focus on the market economy, which excludes real estate, health, education, public administration and defence. The reported euro area aggregate consists only of AT, DE, ES, FR, FI and IT, the only countries with data dating back to 1996.
Rubric
www.ecb.europa.eu © 8
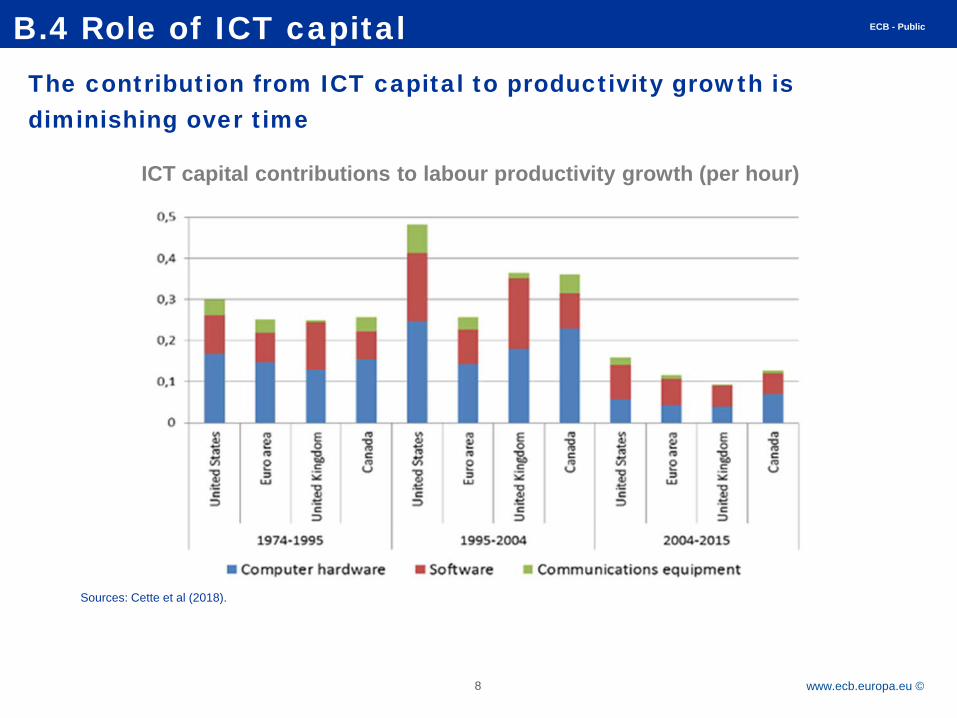
ECB - Public B.4 Role of ICT capital The contribution from ICT capital to productivity growth is diminishing over time
ICT capital contributions to labour productivity growth (per hour)
Sources: Cette et al (2018).
Rubric
www.ecb.europa.eu © 9
ECB - Public B.5 Explaining the productivity slowdown
• A look at the euro area productivity slowdown requires an understanding of both global and regional factors.
Issue 1:
− An analysis of the global technological frontier could shed light on the innovation process
Issue 2:
− The diffusion and adoption of innovation across firms and sectors could provide evidence of the bottlenecks to productivity growth

Rubric
www.ecb.europa.eu © 10
ECB - Public B.6 Firms’ technological frontier
Average annual labour productivity growth (in percent) 2010 - 2013
Sources: ECB Staff calculations based on OECD and Amadeus. Note: Sample is based on firms with more than 20 employees.
• Frontier firms in the euro area display lower productivity growth than in other OECD countries
• Larger gaps for the service sector

Rubric
www.ecb.europa.eu © 11
ECB - Public B.7 Firms’ productivity dispersion
Labour productivity growth in the euro area and OECD countries
Sources: ECB staff calculations based on OECD and the 5th vintage of CompNet data Notes: The OECD frontier and non-frontier productivity developments are taken from OECD (2015). Labour productivity growth in the euro area is the unweighted average across Belgium, Finland, France, Italy and Spain of the median firm in each two-digit industry based on CompNet data. Industries are then aggregated with value added shares.
• Over time, productivity dispersion signals a bottleneck in the diffusion of innovation or a lack of firm reallocation
• Differently from the US, market power metrics have remained stable in the euro area (Cavalleri et al, 2018)

Rubric
www.ecb.europa.eu © 12
ECB - Public B.8 Productivity dispersion and firm size
Labour productivity by firm size
Source: OECD, Entrepreneurship at a Glance Highlights 2018 Note: Value added per person employed in the business economy, thousands of USD, current PPPs, 2016, or latest available year
Source: OECD, Entrepreneurship at a Glance Highlights 2018 Note: Percentage of all persons employed, 2016, or latest available year
Share of employment by firm size
• SMEs feature lower productivity growth and they cover a large share of employment
• Innovative (riskier) projects may require more internal funds and SMEs may not be able to mobilise them to make production more “digital”

Rubric
www.ecb.europa.eu © 13
ECB - Public B.9 Productivity dispersion and reallocation
• Regardless of firm size, firm reallocation may be hindered by the weakness of the banking system as well as the efficiency of the insolvency framework.
• Andrews and Petroulakis (2017) and Storz et al (2017) find a negative relationship between distressed firms and bank’s health
• Consolo et al (2018) finds that the efficiency of insolvency framework plays a role in the deleveraging process and in the pace of reduction of bank’s non-performing loans; hence supporting reallocation
Source: Andrew and Petroulakis (2017)
Rubric
www.ecb.europa.eu © 14
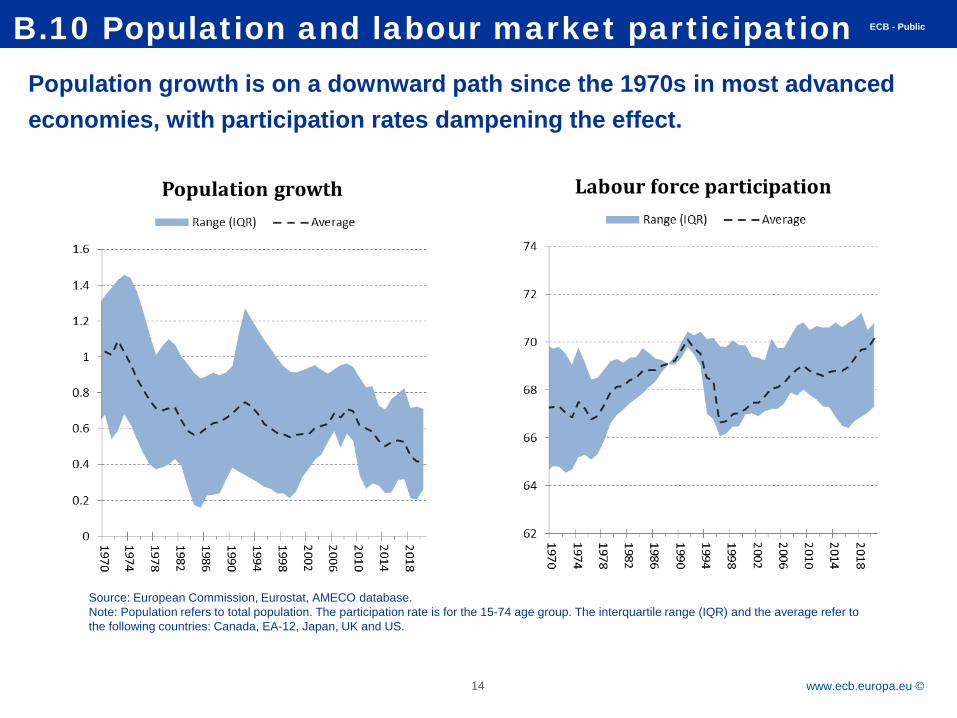
ECB - Public B.10 Population and labour market participation Population growth is on a downward path since the 1970s in most advanced economies, with participation rates dampening the effect.
Source: European Commission, Eurostat, AMECO database. Note: Population refers to total population. The participation rate is for the 15-74 age group. The interquartile range (IQR) and the average refer to the following countries: Canada, EA-12, Japan, UK and US.

Rubric
www.ecb.europa.eu © 15
ECB - Public B.11 Female participation and ageing Labour force participation has recently increased in the euro area driven by older cohorts, women and immigration
Source: European Commission, Eurostat, Labour Force Survey database. Note: Each coloured bar represents the contribution (in pp) to the gender-specific participation rate for the euro area as a whole.
Male participation rates by age Female participation rates by age

Rubric
www.ecb.europa.eu © 16
ECB - Public Overview
A. Motivation
B. Long-term drivers of productivity growth
• Innovation, R&D and intangible capital;
• Capital and labour (inc. demographics)
• Factors’ allocation and efficiency
C. Heterogeneity
• Across countries (convergence) and individuals (inequality)
D. New challenges
• Digitalisation, Automation and AI
• Climate change

Rubric
www.ecb.europa.eu © 17
ECB - Public C.1 Cross-country heterogeneity • Cross-country heterogeneity and lack of convergence over time signals a
potential misallocation of capital and labour in the euro area
• Convergence in productivity growth has been limited.
• Convergence in employment ratios has stopped with the start of the crisis
Employment-population ratio Productivity growth
Source: European Commission, Eurostat, AMECO database. Note: Productivity growth is computed as real GDP per hour worked. EA – Group 1 contains all EA 19 countries. EA – Group 2 includes all the euro area countries but Estonia, Latvia, Lithuania, Slovakia and Slovenia.

Rubric
www.ecb.europa.eu © 18
ECB - Public C.2 Inequality and human capital depreciation • Compared to the US, (disposable) income inequality in the euro area is lower
and has not deteriorated during the crisis – supported by the welfare system
• While equality of (income) outcomes has been broadly preserved during the crisis, equality of opportunities – especially among the youngest – remains unanswered. This could hit on the stock of human capital going forward
Young people (NEET) Gini inequality
Source: European Commission, EU-SILC. Inequality of outcomes, 2018, S. Filauro and G. Thirion. This chart shows the Gini index for market and disposable income at each point in time
Source: European Commission, Eurostat, Labour Force Survey database

Rubric
www.ecb.europa.eu © 19
ECB - Public Overview
A. Motivation
B. Long-term drivers of productivity growth
• Innovation, R&D and intangible capital;
• Capital and labour (inc. demographics)
• Factors’ allocation and efficiency
C. Heterogeneity
• Across countries (convergence) and individuals (inequality)
D. New challenges
• Digitalisation, Automation and AI
• Climate change

Rubric
www.ecb.europa.eu © 20
ECB - Public D.1 New challenges from technological changes
• Digitalisation, automation and AI are going to significantly affect economic outcomes – ie, economic growth, labour market, trade and inflation.
• Going forward, a smooth introduction of new technologies will require resilient economic structures that can allow firms to adjust their production mix – as a consequence, certain jobs/tasks will become obsolete.
• There is a large uncertainty on how these new technologies will play on employment reallocation and productivity.
• While robots can displace jobs in the short term, the productivity enhancement is likely to free up resources for additional job creation in the medium term.
• In this respect, it would be key to set in place policies which can support the up- and re-skilling of workers in job positions which become highly routinized.

Rubric
www.ecb.europa.eu © 21
ECB - Public D.2 New challenges from climate changes
• The global warming poses a significant risk to the supply side of the economy and increases long-term uncertainty.
• Estimates of the impact of climate change remain diverse among market participants and the balance of risks is on the downside. This can further weaken the low productivity growth environment.
• The high degree of uncertainty may delay a market-based adjustment of (energy) production and an effective reallocation of resources. This may ultimately lead to a sudden structural change and possible financial stability concerns.
• Public policies may thus be needed to overcome market failures and to coordinate private sector initiatives. At the same time, policies addressing the global warming need to be coordinated at an intergovernmental level

Rubric
www.ecb.europa.eu © 22
ECB - Public Concluding remarks
• The euro area – as other advanced economies – features a productivity slowdown
• From a monetary policy perspective, this can have important implications both for the equilibrium real rate and for the potential output of the economy
• In the euro area, market concentration does not appear to be a driver of low productivity diffusion. Firm market structure, labour market institutions and framework conditions seem to play a role in the reallocation process
• Labour force participation has supported the slow population growth, but its skill composition could further affect productivity going forward
• The digitalisation process continues to call for resilient labour market institutions to support job reallocation
• Relevance of disruptive supply-side developments – lack of integration in the global digital economy, climate change – may pose additional downside risks to the long-term productivity outlook

Rubric
www.ecb.europa.eu © 23
ECB - Public Annex
Number of patents per thousand persons
Source: World Bank database WPIO

Rubric
www.ecb.europa.eu © 24
ECB - Public Annex
Unemployment by skill type
Source: European Commission, Eurostat, Labour Force Survey database