THE EU FISH MARKETEU+fish+market... · Scope “The EU fish market” aims at providing an economic...
120
THE EU FISH MARKET HIGHLIGHTS THE EU IN THE WORLD EU MARKET SUPPLY CONSUMPTION IMPORT - EXPORT EU LANDINGS AQUACULTURE PRODUCTION WWW.EUMOFA.EU Maritime affairs and fisheries 2018 EDITION THE EU FISH MARKET
Transcript of THE EU FISH MARKETEU+fish+market... · Scope “The EU fish market” aims at providing an economic...
THE EU FISH MARKET
HIGHLIGHTS
THE EU IN THE WORLD
EU MARKET SUPPLY
CONSUMPTION
IMPORT - EXPORT
EU LANDINGS
AQUACULTURE PRODUCTION
WWW.EUMOFA.EU Maritime affairs
and fisheries
2018 EDITION
THE EU FISH MARKET
Scope
“The EU fish market” aims at providing an economic description of the whole European fisheries and aquaculture
industry. It replies to questions such as what is produced/exported/imported, when and where, what is consumed,
by whom and what are the main trends.
A comparative analysis allows to assess the performance of fishery and aquaculture products in the EU market
compared with other food products. The report is made analysing nominal values (and prices).
This publication is one of the services delivered by the European Market Observatory for Fisheries and Aquaculture
Products (EUMOFA).
This edition is based on data available as of June 2018. The analyses included in this report do not take into account
possible updates occurred in the sources used after this date.
More detailed and complementary data are available in the EUMOFA database: by species, place of sale, Member
State, partner country. Data are updated daily.
EUMOFA, developed by the European Commission, represents one of the tools of the Market Policy in the framework
of the Common Fisheries Policy. [Regulation (EU) No 1379/2013 on the common organisation of the markets in
fishery and aquaculture products, Article 42].
As a market intelligence tool, EUMOFA provides regular weekly indicators, monthly market trends and annual
structural data along the supply chain.
The database is based on data provided and validated by Member States and European institutions. It is available
in all 24 EU languages.
EUMOFA website, publicly available as from April 2013, can be accessed at www.eumofa.eu.
Table of contents
Methodological background p. 1
0. Highlights p. 10
1. The EU in the world p. 14
1.1 Production p. 14
1.2 Import - Export p. 17
1.3 Expenditure p. 18
1.4 Consumption p. 18
2. EU market supply p. 21
2.1 Supply balance and apparent consumption p. 21
2.2 EU self sufficiency p. 23
3. Consumption p. 29
3.1 Expenditures and volume of fish consumption p. 29
3.2 Consumer prices – fish vs meat and food in general p. 32
3.3 Apparent consumption p. 32
3.4 Household consumption of fresh seafood p. 37
3.5 Sales channels p. 44
3.6 Production and consumption of organic fish and seafood p. 46
3.7 Geographical indications and traditional specialities guaranteed p. 47
4. Import - Export p. 50
4.1 Extra-EU balance trade p. 53
4.2 Comparison between imports of fish and meat p. 54
4.3 Extra-EU imports p. 55
4.4 Extra-EU exports p. 66
4.5 Intra-EU trade p. 75
5. EU landings p. 81
6. Aquaculture production p. 100
6.1 Most relevant market updates in 2017 and 2018 p. 112
1
Methodological background
The present report is mainly based on consolidated and exhaustive volume and value data collected through different sources and published by EUMOFA at all stages of the supply chain. Within EUMOFA, data on fisheries and aquaculture products are harmonised into “Main commercial species”, each referring to “Commodity groups”, in order to allow comparisons along the different supply chain stages. At the following links, users can view and download:
• The list of EUMOFA Main commercial species and Commodity groups
http://www.eumofa.eu/documents/20178/24415/Metadata+2+-+DM+-+Annex%2B1_%2BList%2Bof%2BMCS%2Band%2BCG.pdf/0d849918-162a-4d1a-818c-9edcbb4edfd2
• The correlation table used for harmonizing data on fish species at ERS1 code level (data on catches, landings, aquaculture production) to the EUMOFA standards
http://www.eumofa.eu/documents/20178/24415/Metadata+2+-+DM+-+Annex+3+Corr+of+MCS_CG_ERS.PDF/1615c124-b21b-4bff-880d-a1057f88563d
• The correlation table used for harmonizing data at CN-8 code level2 (data on EU trade) to the EUMOFA standards
http://www.eumofa.eu/documents/20178/24415/Metadata+2+-+DM+-+Annex+4+Corr+CN8-CG-MCS+%282002+-+2014%29.pdf/ae431f8e-9246-4c3a-a143-2b740a860291
MAIN SOURCES OF
DATA
EUMOFA, EUROSTAT, national administrations of the EU, FAO, OECD,
Federation of European Aquaculture Producers (FEAP), Europanel,
Euromonitor. The sections below in this Methodological background provide
detailed information on the sources used.
SUPPLY BALANCE
SHEET
The supply balance is a proxy that allows to follow the evolutions of internal
supply and apparent consumption of fishery and aquaculture products in the EU.
In the light of this, the supply balance and apparent consumption should be used
in relative terms (e.g. analysing trends) rather than in absolute terms.
The supply balance is built on the basis of the following equation, calculated in
live weight equivalent:
(catches for food use + aquaculture + imports) – exports
=
apparent consumption
Data included in the supply balance available in the chapter “EU market supply”
of this report are broken down by commodity group. Possible discrepancies in
totals are due to rounding.
The sources used are as follows:
➢ Catches: products caught by fishing vessels of the EU Member States and
destined to human consumption. Amounts of catches not destined to human
consumption were estimated using proxies based on destination use of
1 The acronym “ERS” refers to the Electronic Reporting System established by Council Regulation (EU) N° 1966/2006. 2 The acronym “CN” refers to the Combined Nomenclature, i.e. the goods classification used within the EU for the purposes of foreign trade statistics. This classification is based on the Harmonised Commodity Description and Coding System (HS) managed by the World Customs Organisation (WCO). The HS uses a six digit numerical code for the coding of products and the Combined Nomenclature is further breaking down the coding into a eighth digit level according to EU needs.
2
landings (as available in EUROSTAT). Catches data are available in live
weight equivalent.
Source: EUROSTAT (reference dataset: fish_ca).
➢ Aquaculture: products farmed in the EU Member States. Aquaculture data
are available in live weight equivalent.
Sources: EUROSTAT (reference dataset: fish_aq2a), integrated with data from FAO, FEAP and national administrations (for sources’ details by year and country, please refer to the “Aquaculture” section of this methodological background).
➢ Import: fishery and aquaculture products imported by the European Union
from non-EU countries. Non-food use products are not included.
Import data are available in net weight. For the supply balance purposes, net
weight is converted into live weight equivalent in order to have a harmonized
supply balance sheet (for conversion to live weight equivalent, please refer to
the specific section below).
Through the assessment of origin of imports in terms of production methods,
it is possible to estimate the share of imports originating from aquaculture
and capture making use of FAO data (for the method applied, please refer to
the specific section below).
Source: EUROSTAT – COMEXT.
➢ Export: fishery and aquaculture products exported by the European Union
to non-EU countries. Non-food use products are not included.
Export data are available in net weight. For the supply balance purposes, net
weight is converted into live weight equivalent in order to have a harmonized
supply balance sheet (for conversion to live weight equivalent, please refer to
the specific section below).
Through the assessment of origin of exports in terms of production methods,
it is possible to estimate the share of exports originating from aquaculture
and capture making use of FAO data (for the method applied, please refer to
the specific section below).
Source: EUROSTAT – COMEXT.
➢ Apparent consumption (and per capita consumption): total amount
of fishery and aquaculture products consumed in the European Union. Per
capita consumption indicates the amount of fish (wild + farmed) consumed
by each individual person in the EU.
ASSESSMENT OF
ORIGIN OF IMPORTS
AND EXPORTS IN
TERMS OF PRODUCTION
METHOD
The objective of the assessment of origin in terms of production methods is to
quantify the role of aquaculture in the EU supply balance analysis. For each
Member State, on the basis of the total imports and exports volumes from extra-
EU countries, the production methods of the countries of origin and destinations
of exports is assessed, averaging the latest three years of production volumes in
terms of catches and aquaculture.
Further assessment provides an estimate of a weighted average share of
aquaculture in the total production (aquaculture + capture) and it is expressed
as a coefficient.
Through this proxy, the origin of imports and destinations of exports in terms of
production methods, i.e. if imports/exports of a given Member State derive from
farming or fishery activities, is determined.
3
CONVERSION OF NET
WEIGHT INTO LIVE
WEIGHT EQUIVALENT
Since EUROSTAT provides production data in live weight, import/export net
volumes are converted by using conversion factors (CF) for the purpose of
building a harmonized supply balance sheet.
Taking the example of CF for cod, or more specifically for the item whose CN8
code is 0304 44 10: this item corresponds to the following description: “Fresh or
chilled fillets of cod ‘Gadus morhua, Gadus ogac, Gadus macrocephalus’ and of
fish of the species "Boreogadus saida’”. The CF is set at 2,85, representing an
average of those found for skinned and boned fillets for this species in
EUROSTAT and FAO publications.
For the complete list of CFs used for the EUMOFA purposes, please refer to the
Metadata published within the EUMOFA website at the link:
http://www.eumofa.eu/documents/20178/24415/Metadata+2+-+DM+-
+Annex+8+CF+per+CN8_%252707-%252714.pdf/7e98ac0c-a8cc-4223-9114-
af64ab670532.
EXPENDITURE FOR
FISHERY AND
AQUACULTURE
PRODUCTS
Expenditure data of this “EU fish market” are provided by EUROSTAT (for EU
countries, see Charts 13, 14 and 16). These data are compiled basing on a common
methodology elaborated within the “EUROSTAT – OECD PPP Programme”
(http://www.oecd.org/std/prices-ppp/eurostat-
oecdmethodologicalmanualonpurchasingpowerparitiesppps.htm).
In “The EU fish market” report, the “Nominal expenditure at national prices in
euro (millions)” and the “Nominal expenditure per head at national prices in
euros” have been used. The “expenditure” is taken as a component of the GDP
and concerns the final consumption expenditures on goods and services
consumed by individual households.
Expenditure is provided in Purchasing Power Parities (PPPs) which are spatial
deflators and currency converters that eliminate the effects of the differences in
price levels between Member States/countries, thus allowing volume
comparisons of GDP components and comparisons of price levels.
For the countries outside the Euro-zone, Price Level Indices (PLIs) are used for
harmonising different currencies in a single currency (euro in this case). PLIs are
obtained as ratios between PPPs and current nominal exchange rates, therefore,
PPPs and PLIs values coincide in the Euro-zone countries.
“Fishery and aquaculture products” is an aggregate of products, corresponding
to COICOP 01.1.3, including fresh, chilled, frozen, preserved and processed
seafood
(http://ec.europa.eu/eurostat/ramon/nomenclatures/index.cfm?TargetUrl=LS
T_NOM_DTL&StrNom=HICP_2000&StrLanguageCode=EN&IntPcKey=&Str
LayoutCode=EN).
OUT-OF-HOME
CONSUMPTION
Data for the out-of-home consumption of fish products are provided by
EUROMONITOR for 5 EU Member States: France, Germany, Italy, Spain and
the UK.
Data are provided for the category “fish and seafood”, as well as for the
subcategories fish, crustaceans and molluscs and cephalopods, more detailed
below:
4
Fish and seafood: This is the aggregation of fish, crustaceans and molluscs
(including cephalopods). This category includes packaged and unpackaged
unprocessed fish and seafood (fresh, chilled, frozen). Chilled and frozen fish
and seafood can be cleaned, gutted, peeled/trimmed/filleted/cut to a different
extent, but not cooked and no sauces, herbs or condiments can be added.
- Crustaceans: Includes all fresh, chilled and frozen but uncooked crustaceans (i.e. animals living in water with firm body and have a hard outer shell) such as lobsters, shrimps and crabs, whether sold packaged or unpackaged.
- Finfish: Includes all fresh, chilled and frozen but uncooked freshwater and marine fish (wild caught or farmed), whether sold packaged or unpackaged, cut or whole.
Molluscs (including cephalopods): Includes all fresh, chilled and
frozen but uncooked molluscs (shell fish such as oysters and clams) and
cephalopods (such as the octopus, squid, cuttlefish), whether sold
packaged or unpackaged.
HOUSEHOLD
CONSUMPTION OF
FRESH FISH PRODUCTS
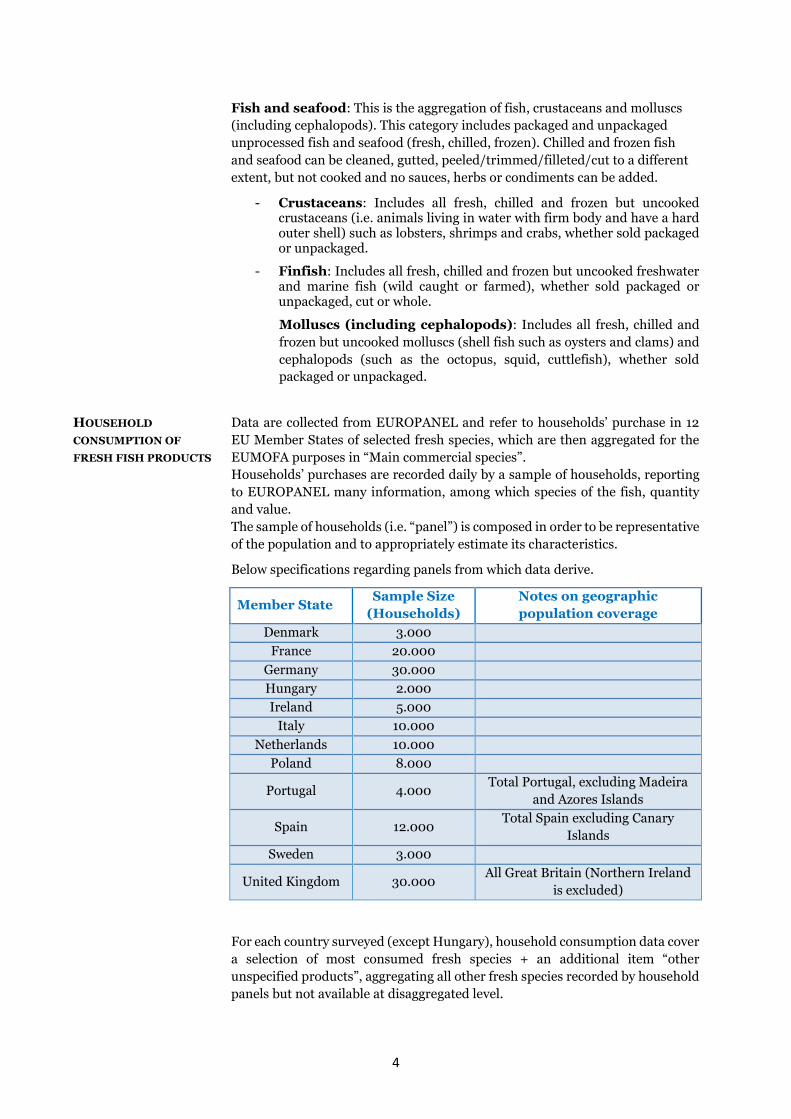
Data are collected from EUROPANEL and refer to households’ purchase in 12
EU Member States of selected fresh species, which are then aggregated for the
EUMOFA purposes in “Main commercial species”.
Households’ purchases are recorded daily by a sample of households, reporting
to EUROPANEL many information, among which species of the fish, quantity
and value.
The sample of households (i.e. “panel”) is composed in order to be representative
of the population and to appropriately estimate its characteristics.
Below specifications regarding panels from which data derive.
Member State Sample Size
(Households)
Notes on geographic
population coverage
Denmark 3.000
France 20.000
Germany 30.000
Hungary 2.000
Ireland 5.000
Italy 10.000
Netherlands 10.000
Poland 8.000
Portugal 4.000 Total Portugal, excluding Madeira
and Azores Islands
Spain 12.000 Total Spain excluding Canary
Islands
Sweden 3.000
United Kingdom 30.000 All Great Britain (Northern Ireland
is excluded)
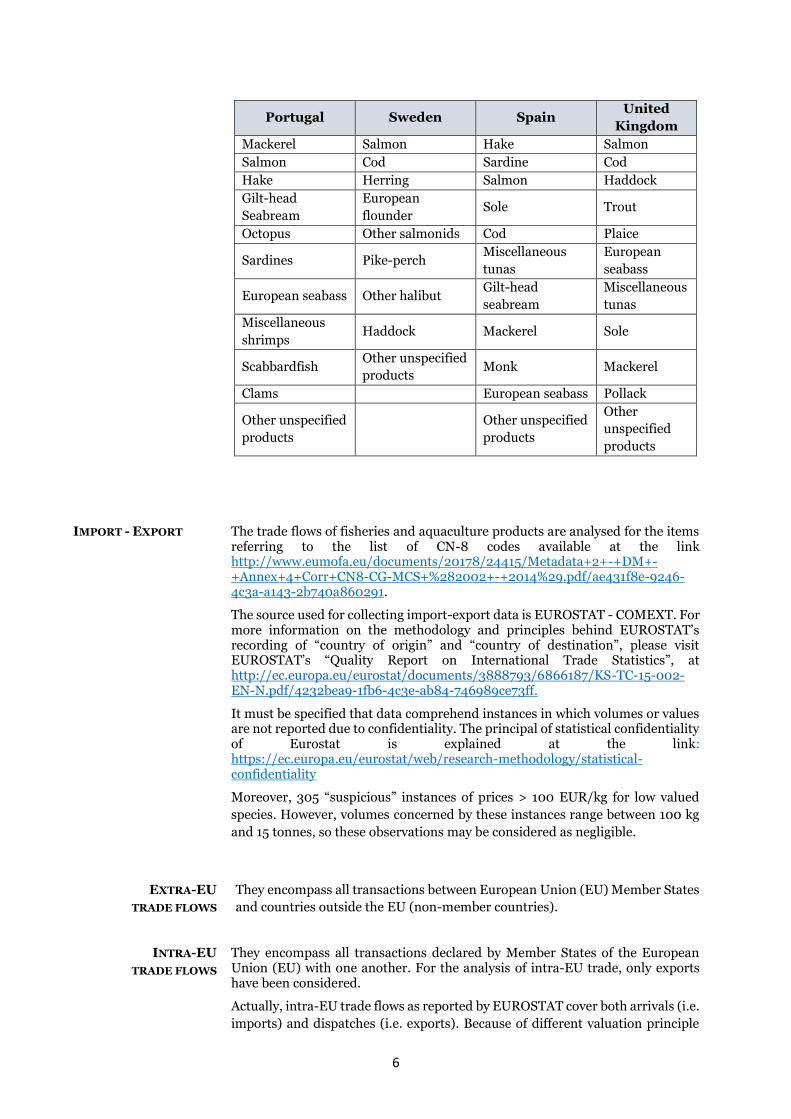
For each country surveyed (except Hungary), household consumption data cover
a selection of most consumed fresh species + an additional item “other
unspecified products”, aggregating all other fresh species recorded by household
panels but not available at disaggregated level.
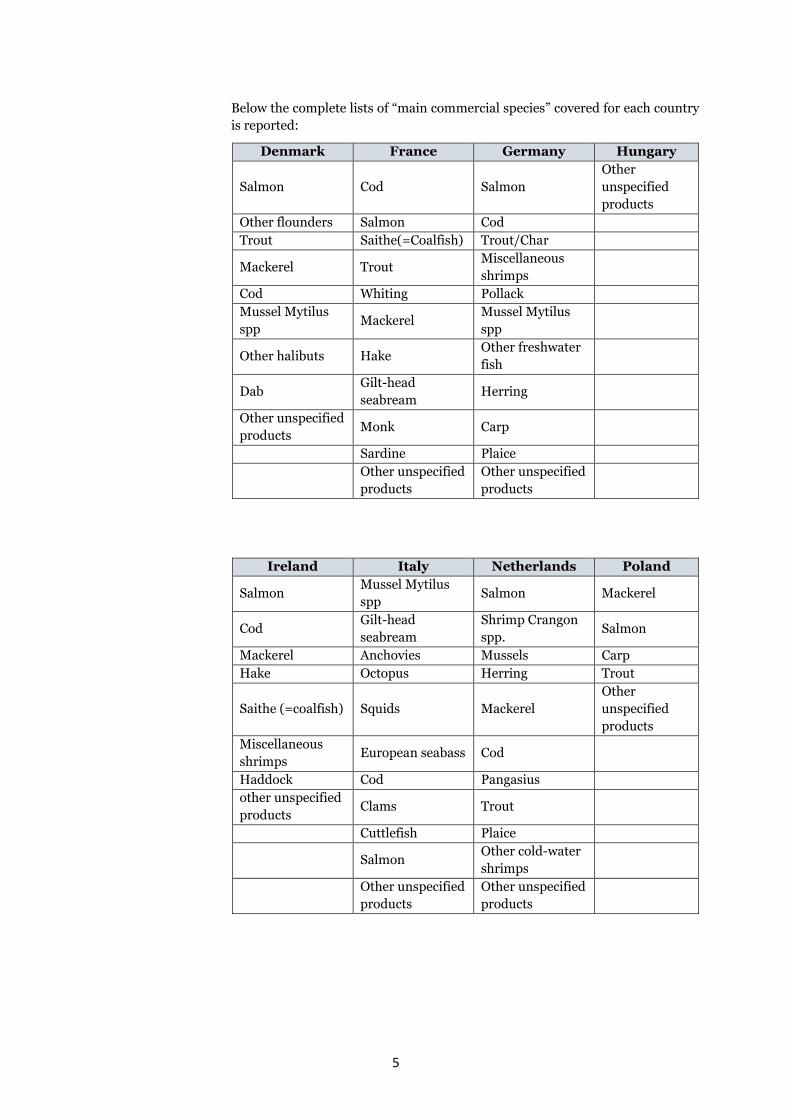
5
Below the complete lists of “main commercial species” covered for each country
is reported:
Denmark France Germany Hungary
Salmon Cod Salmon
Other
unspecified
products
Other flounders Salmon Cod
Trout Saithe(=Coalfish) Trout/Char
Mackerel Trout Miscellaneous
shrimps
Cod Whiting Pollack
Mussel Mytilus
spp Mackerel
Mussel Mytilus
spp
Other halibuts Hake Other freshwater
fish
Dab Gilt-head
seabream Herring
Other unspecified
products Monk Carp
Sardine Plaice
Other unspecified
products
Other unspecified
products
Ireland Italy Netherlands Poland
Salmon Mussel Mytilus
spp Salmon Mackerel
Cod Gilt-head
seabream
Shrimp Crangon
spp. Salmon
Mackerel Anchovies Mussels Carp
Hake Octopus Herring Trout
Saithe (=coalfish) Squids Mackerel
Other
unspecified
products
Miscellaneous
shrimps European seabass Cod
Haddock Cod Pangasius
other unspecified
products Clams Trout
Cuttlefish Plaice
Salmon Other cold-water
shrimps
Other unspecified
products
Other unspecified
products
6
Portugal Sweden Spain United
Kingdom
Mackerel Salmon Hake Salmon
Salmon Cod Sardine Cod
Hake Herring Salmon Haddock
Gilt-head
Seabream
European
flounder Sole Trout
Octopus Other salmonids Cod Plaice
Sardines Pike-perch Miscellaneous
tunas
European
seabass
European seabass Other halibut Gilt-head
seabream
Miscellaneous
tunas
Miscellaneous
shrimps Haddock Mackerel Sole
Scabbardfish Other unspecified
products Monk Mackerel
Clams European seabass Pollack
Other unspecified
products
Other unspecified
products
Other
unspecified
products
IMPORT - EXPORT
The trade flows of fisheries and aquaculture products are analysed for the items referring to the list of CN-8 codes available at the link http://www.eumofa.eu/documents/20178/24415/Metadata+2+-+DM+-+Annex+4+Corr+CN8-CG-MCS+%282002+-+2014%29.pdf/ae431f8e-9246-4c3a-a143-2b740a860291.
The source used for collecting import-export data is EUROSTAT - COMEXT. For more information on the methodology and principles behind EUROSTAT’s recording of “country of origin” and “country of destination”, please visit EUROSTAT’s “Quality Report on International Trade Statistics”, at http://ec.europa.eu/eurostat/documents/3888793/6866187/KS-TC-15-002-EN-N.pdf/4232bea9-1fb6-4c3e-ab84-746989ce73ff.
It must be specified that data comprehend instances in which volumes or values are not reported due to confidentiality. The principal of statistical confidentiality of Eurostat is explained at the link: https://ec.europa.eu/eurostat/web/research-methodology/statistical-confidentiality
Moreover, 305 “suspicious” instances of prices > 100 EUR/kg for low valued
species. However, volumes concerned by these instances range between 100 kg
and 15 tonnes, so these observations may be considered as negligible.
EXTRA-EU
TRADE FLOWS
They encompass all transactions between European Union (EU) Member States
and countries outside the EU (non-member countries).
INTRA-EU
TRADE FLOWS
They encompass all transactions declared by Member States of the European Union (EU) with one another. For the analysis of intra-EU trade, only exports have been considered.
Actually, intra-EU trade flows as reported by EUROSTAT cover both arrivals (i.e.
imports) and dispatches (i.e. exports). Because of different valuation principle
7
(CIF > FOB)3, arrivals should be slightly higher valued than dispatches. This is
one of the main reasons explaining asymmetries between import and export
figures. In general, bilateral comparisons between MS of intra-EU flows have
revealed major and persistent discrepancies. Therefore, comparisons dealing
with intra-EU trade statistics and related results must be taken into account
cautiously and should consider the existence of these discrepancies.
SPECIFICATIONS
ABOUT LANDINGS DATA
Eurostat data regarding landings (fish_ld) comprise the initial unloading of any
fisheries products from on board a fishing vessel to land in a given EU Member
State. Landings are made by vessels from EU Member States and from Iceland
and Norway. Data include landings of species not destined to human
consumption and seaweed.
The following issues should be mentioned regarding data used for the “EU
landings” chapter:
➢ Greece 2016 data do not include confidential figures related to landings of some
items of the following main commercial species: cuttlefish, john dory,
octopus, squid, sole (other than common sole), seabream (other than
gilt-head seabream), flounder (other than European flounder), other
sharks and other marine fish.
➢ Malta Data for the period 2012-2016 do not include confidential figures related
to landings made by vessels with Cyprus flag.
➢ Ireland The following data were collected from SFPA:
o 2013 and 2014 data regarding hake
o 2014 data regarding mackerel
o 2016 data regarding herring
➢ Data include estimates for landings expressed in value produced by EUROSTAT in cases where zero prices were reported by Member States. Countries and years concerned are listed below:
o Belgium – 2009, 2010, 2011, 2012, 2013, 2014 and 2015
o Bulgaria – 2012
o Denmark – 2009, 2010, 2011, 2012, 2013 and 2014
o Germany – 2009 and 2014
o Ireland – 2009 and 2010
o Netherlands – 2011
o Poland – 2011 and 2012
o Portugal – 2009, 2010, 2011, 2012 and 2015
o Sweden – 2009, 2010 and 2011
o United Kingdom – 2009, 2010, 2011 and 2012
3 Cost, Insurance and Freight (CIF) and Free on Board (FOB) are international shipping agreements used in the transportation of goods. The CIF rule places an obligation on the seller to arrange insurance for the consignment. If the FOB rule is used, once the goods have been loaded on board, risk transfers to the buyer, who bears all costs thereafter.
8
AQUACULTURE DATA:
ESTIMATES AND
EXTRAPOLATIONS
FROM EUROSTAT,
FAO, FEAP AND
MEMBER STATES’
PUBLICATIONS
For the purpose of properly conducting an analysis on aquaculture production in
the EU, EUROSTAT data (fish_aq2a) have been integrated with data deriving
from FAO, national sources and sector associations.
Below are listed both the instances in which EUROSTAT data were integrated
with figures from other sources and those instances for which data are estimates
or provisional figures:
➢ Austria 2012, 2014 and 2015 confidential data were integrated with figures from FAO.
➢ Belgium 2010-2016 confidential data were integrated with figures from FAO.
➢ Bulgaria 2016 values for seaweed and eel were collected from FAO.
➢ Denmark 2010 and 2013 confidential values were estimated by multiplying the volumes of each main commercial species to its average price (average calculated using the price corresponding to year-1 and year+1) if available within Danish AgriFish Agency. 2014, 2015 and 2016 confidential data were integrated with figures from FAO. Those on eel and seaweed for 2016 are FAO estimates.
➢ Estonia 2012, 2014 and 2015 confidential data were integrated with figures from FAO.
➢ France 2010-2014 data for salmon were integrated with figures provided by FEAP; respective values were estimated by multiplying the volumes to its 2008 unit price, as available in EUROSTAT. 2009-2014 data for turbot were integrated with figures provided by FEAP; respective values were estimated by multiplying the volumes to its 2008 unit price, as available in EUROSTAT. 2016 data are FAO estimates.
➢ Germany Data on carp for the years 2008-2012 and 2014-2015 were collected from FAO. 2011 confidential data were integrated with figures provided by the national source (DESTATIS). They refer to trout, pike, pike-perch, eel, other freshwater fish and molluscs. Specifically as concerns mollusc figures, since no details at species level is provided by DESTATIS, the aggregate amount was entirely assigned to the species “mussel”. In fact, mussel is the main mollusc farmed in Germany (oyster production is limited). Since DESTATIS does not report values for 2011, they have been estimated by multiplying the volumes to its price as for year-1 (namely, 2010). 2012 and 2014 data were collected from FAO, as data for almost all species were confidential in EUROSTAT. Data on oyster are FAO estimates. For 2013, data on salmon were collected from EUROSTAT; for other species, confidential data were integrated with figures from FAO. Data on oyster are FAO estimates. 2015 and 2016 confidential data were integrated with figures from FAO. Those on oyster for 2015 are FAO estimates.
➢ Greece 2013 confidential data were integrated with figures from FAO.
9
For 2015, data are National provisional figures available in EUROSTAT; the instances of confidential data were integrated with FAO estimates. 2016 data on the grouping “other freshwater fish” were collected from FAO.
➢ Hungary 2016 data were collected from FAO.
➢ Ireland For 2014, values are National estimates available in EUROSTAT except from scallop and the grouping “Other molluscs and aquatic invertebrates”, whose confidential values were integrated with figures from FAO. For 2015, confidential values of the grouping “Other molluscs and aquatic invertebrates” were integrated with figures from FAO. 2016 data on the grouping “other molluscs and aquatic invertebrates” were collected from FAO.
➢ Italy 2015 data are National estimates and forecasts available in EUROSTAT. 2016 data are FAO estimates.
➢ Latvia 2014 and 2015 confidential data were integrated with figures from FAO.
➢ Netherlands 2015 data on mussel, eel, freshwater catfish and the grouping “other marine fish” are National estimates available in EUROSTAT. 2016 data on pike-perch are FAO estimates.
➢ Poland 2010 data were collected from FAO. Data on pike, freshwater catfish and other freshwater fish are FAO estimates. 2011 data for freshwater crayfish, pike, trout, salmon and other freshwater fish are National provisional figures available in EUROSTAT. 2016 data on tilapia are FAO estimates.
➢ Portugal 2013 and 2014 data on clam are National estimates available in EUROSTAT. For 2015, data on trout and clam are National estimates available in EUROSTAT while data on all other species are National provisional figures available in EUROSTAT.
➢ Romania 2015 data are National estimates available in EUROSTAT. 2016 data were collected from FAO.
➢ Slovenia 2013, 2014, 2015 and 2016 confidential data were integrated with figures from FAO. 2016 data on clam and European seabass are FAO estimates.
➢ United Kingdom 2008 values of Atlantic halibut, European seabass, clam, warmwater shrimp, turbot, great Atlantic scallop and the grouping “Other molluscs and aquatic invertebrates” were integrated using FAO; values of Queen scallop were estimated by multiplying the volumes to its 2009 unit price, as available in EUROSTAT. 2014 and 2015 values are National estimates available in EUROSTAT.
E U R O P E A N M A R K E T O B S E R V A T O R Y F O R F I S H E R I E S A N D A Q U A C U L T U R E P R O D U C T S - T H E E U F I S H M A R K E T - E D I T I O N 2 0 1 8
HIGHLIGHTS
10
Highlights
In 2016, the EU supply of seafood (domestic production + imports)
rose by 3%, increasing 450.000 tonnes above 2015 and reaching
14,22 million tonnes. Imports proved to be the main driver of the
supply increase, reaching a 10-year peak. As a result, and despite
increased internal production, the EU registered a self-sufficiency
ratio4 of 41,7%, which was the lowest since 2011. Indeed, the top five
species consumed in the EU – tuna, cod, salmon, Alaska pollock
and shrimps – representing 43% of the market in 2016, were mostly
imported from non-EU countries.
Per capita consumption reached 24,33 kg, which was an increase of
763 grams, or 3% above 2015. An upward trend was registered for
almost all main commercial species consumed in the EU. Among
them, the per capita consumption of herring increased the most.
Compared with 2015, it rose from 0,93 to 1,23 kg, an increase of
32% that equalled its average per capita consumption during the
period 2007–2013.
Portugal’s apparent consumption of fish and seafood increased 3%
from 2015 to 2016, reaching 57 kg, the highest in the EU. This was
more than twice the EU’s average per capita consumption of 24,3
kg.
In general, wild products continued to predominate in the EU
seafood market, accounting for 76% of the total per capita
consumption. In 2016, consumption of farmed products reached
5,72 kg per capita, slightly higher than in 2015. Salmon and mussels
accounted for more than half of farmed-product consumption.
Starting in 2014, fish prices began to grow significantly and, by
2017, they had increased 10% compared with 2013. Over the same
period, the prices of meat and food in general followed a flat trend.
The EU household expenditure for fisheries and aquaculture
products in 2017 grew to EUR 56,6 billion, a 2,9% increase from
2016, and an all-time peak. The UK, the only Member State
registering a decrease, had a 3% drop in household expenditure,
while Portugal again had the highest per capita household
expenditure at EUR 337, which was three times the EU average.
The amount spent for purchasing fish in 2017, namely EUR 56,6
billion, was around one quarter of the EUR 221,3 billion spent for
purchasing meat. In the EU countries with the highest total
expenditures for purchasing fish, namely Italy, France and Spain,
4 Ratio between EU production and apparent consumption of the EU market.
Slight increase in consumption
of seafood in the EU and
contraction of self-sufficiency
Relevance of wild seafood
supply
Higher prices and increasing
expenditure of the EU
households for purchasing fish
Expenditure for fish compared
with meat
0
E U R O P E A N M A R K E T O B S E R V A T O R Y F O R F I S H E R I E S A N D A Q U A C U L T U R E P R O D U C T S - T H E E U F I S H M A R K E T - E D I T I O N 2 0 1 8
HIGHLIGHTS
11
different behaviours could be observed: in Italy, expenditure on
meat was three times higher than on fish; in Spain, it was twice as
high; in France, households spent four times as much on meat as
on fish. The greatest 2017 imbalance was observed in Hungary,
where consumers spent 20 times more on meat than fish.
The EU is the world’s largest trader of fishery and aquaculture
products in terms of value. In 2017, trade flows between the EU and
the rest of the world surpassed those of China, the second ranked,
by over EUR 2,3 billion.
In 2017, the sum of trade flows with non-EU countries and
exchanges among Member States (exports only) amounted to EUR
57 billion, an increase of EUR 2,6 billion from 2016. Intra-EU
exports contributed the most to the overall growth, increasing by
EUR 1,44 billion, for a 6% growth from EUR 25,2 billion in 2016 to
EUR 26,7 billion in 2017. However, the largest flows were salmon
originating from Norway, and entering in the EU market through
northern Member States.
Despite exports to third countries reaching a 13-year value peak in
2017, the deficit reached a negative peak of EUR 20,2 billion, 3% or
EUR 558 million greater than in 2016. This was due to the growing
role of both frozen and prepared/preserved products imported by
EU Member States in terms of value, whereas the deficit for fresh
products is decreasing.
Extra-EU imports increased 4% from 2016 and reached a 10-year
peak of EUR 25,3 billion. This was mainly due to increased imports
of frozen cuttlefish and squid, mostly originating from India and
China, and of prepared/preserved skipjack tuna from Ecuador.
However, of all fisheries and aquaculture products imported in the
EU, salmon accounted for the largest share, with 14% in volume and
22% in value terms. In 2017, imports of salmon totalled 802.443
tonnes worth EUR 5,5 billion, mainly consisting of fresh whole
products originating from Norway.
Five Member States account for over 70% of the volume of extra-
EU exports of fisheries and aquaculture products: the Netherlands,
which is responsible for almost one-quarter of the total, Spain,
Denmark, Ireland and the UK. In value terms, France is among the
top five instead of Ireland, as it exports high-value products such as
oyster and smoked salmon.
The US and China are the main destination markets of EU exports
in terms of value, but the highest volumes are destined for Norway
and Nigeria. This is due to the different product categories involved
in such flows: while the US and China mainly import salmon and
cod, Norway is a major importer of fish oil, and Nigeria of small
pelagics, herring and mackerel in particular.
Pivotal role of the EU in the
global fish and seafood trade
E U R O P E A N M A R K E T O B S E R V A T O R Y F O R F I S H E R I E S A N D A Q U A C U L T U R E P R O D U C T S - T H E E U F I S H M A R K E T - E D I T I O N 2 0 1 8
HIGHLIGHTS
12
In 2016, the EU ranked fifth in world production of fisheries and
aquaculture, after the four main Asian producers (China,
Indonesia, India and Viet Nam).
The main products landed in the EU recorded a price increase, as a
result of which the total value of all EU landings reached EUR 7,38
billion, the highest amount of the last ten years. The species
registering the most intense value growth were yellowfin tuna,
herring and shrimp Crangon spp., with major growth recorded,
respectively, in Spain, Denmark and the Netherlands.
Landings of fisheries products in the EU registered a 7% drop and
totalled 4,30 million tonnes. This was 312.276 tonnes less than in
2015. The drop was mostly due to decreased landings of sandeels
and sprat in Denmark, and mackerel and blue whiting in the
Netherlands.
Aquaculture production in the EU continued the recovery started
in 2014, reaching 1,29 million tonnes with a value of EUR 4,25
billion. Indeed, 2016 was a record year for the production of
European seabass, especially in Greece and Spain. However,
declined production of mussel generated a decrease of Spanish
aquaculture, as this species covers 3/4 of the overall aquaculture
production of this country. France and Italy registered an
increasing trend in volume terms of their aquaculture production,
but volumes produced were well below that of 10 years ago, when
more oysters and clams were farmed, respectively, in the two
countries.
The value of farmed salmon has continued to increase, driven by
production in both the UK and Ireland.
Prices of fisheries and aquaculture products imported by Member
States from non-EU countries were on average 5% higher in 2017
than in 2016. A decrease was registered in the first four months of
2018, but they increased again during summer. Still, the average
price in July 2018 was 8% lower than December 2017 and 5% lower
than July 2017.
From an all-time high in 2016, EU import prices for salmon (fresh
whole) trended a slight 1% up in 2017, averaging 6,53 EUR/kg.
Retail prices for salmon fillets increased 10% in France, 18% in
Poland and 6% in the UK.5 This indicated higher margins along the
supply chain in 2017 compared with 2016. The price gap widened
in the first seven months of 2018, as EU import prices for fresh
whole salmon fell 9% compared with the same period in 2017, while
prices for fresh fillets at retail level decreased 6% in France and 2%
in Poland, and increased 3% in the UK.
EU imports of tuna rose by 8% in volume terms, mostly driven by
the increase recorded by those from Ecuador, a country that, alone,
provides close to 20% of EU imports of tuna. Ecuador and the EU
5 Source: EUMOFA.
Increasing value of landings
and aquaculture production in
the EU
Recent dynamics for some main
species

E U R O P E A N M A R K E T O B S E R V A T O R Y F O R F I S H E R I E S A N D A Q U A C U L T U R E P R O D U C T S - T H E E U F I S H M A R K E T - E D I T I O N 2 0 1 8
HIGHLIGHTS
13
entered into a Free Trade Agreement in January 2017. Stimulated
by the elimination of tariffs on industrial and fisheries products, EU
imports of tuna from Ecuador rose by 22% in terms of volume from
2016 to 2017. In value terms, they rose by 45%, mainly driven by an
increase in prices for skipjack and yellowfin tuna. The increase in
skipjack tuna import prices continued in the first seven months of
2018.
Imports of European seabass and gilthead seabream, mainly
consisting of farmed products, rose by 12% in volume terms and 9%
in value from 2016 to 2017. The 51.208 tonnes imported in the EU
in 2017, of which 98% originated in Turkey, represented an historic
high in import volume. As for EU import price for these species,
from 2015 to 2017 they fell by 7% for seabass and 14% for gilthead
seabream, a downward trend that continued in the first 7 months
of 2018.
Over the last eight years, price inflation6 for fish in the EU has been
higher than for food in general. From 2016 to 2017, it reached 3,6%
while prices of food in general increased by 2,2%. The inflation for
fish was highest in the northern EU countries.
In the first 8 months of 2018, consumer prices for fish in the EU
have remained stable, but almost 2% lower than the same period
last year.
In 2017, the EUR recorded different behaviours compared with
2016 for four currencies of importance to seafood suppliers to the
EU: it appreciated 2% compared with USD; was relatively stable
with a slight 0,4% increase compared with the Norwegian NOK;
and depreciated compared with the Icelandic króna (ISK) and
British pound (GBP), dropping 10% compared with ISK, and 7%
compared with GBP. Although the GBP had weakened 7%
compared with the EUR in 2017, it has remained stable during the
first 9 months of 20187.
In 2017, marine fuel prices8 in the EU increased 6% compared with
2016 and have continued to follow an upward trend in 20189. In
September 2018, they were 23% higher than December 2017 and
34% higher than a year earlier, in September 2017.
6 Source: EUROSTAT. 7 Source: European Central Bank (ECB), Bank of Norway. 8 Sources: EUMOFA based on MABUX. 9 Data up to September 2018.
Macroeconomic trends
E U R O P E A N M A R K E T O B S E R V A T O R Y F O R F I S H E R I E S A N D A Q U A C U L T U R E P R O D U C T S - T H E E U F I S H M A R K E T - E D I T I O N 2 0 1 8
The EU in the world
14
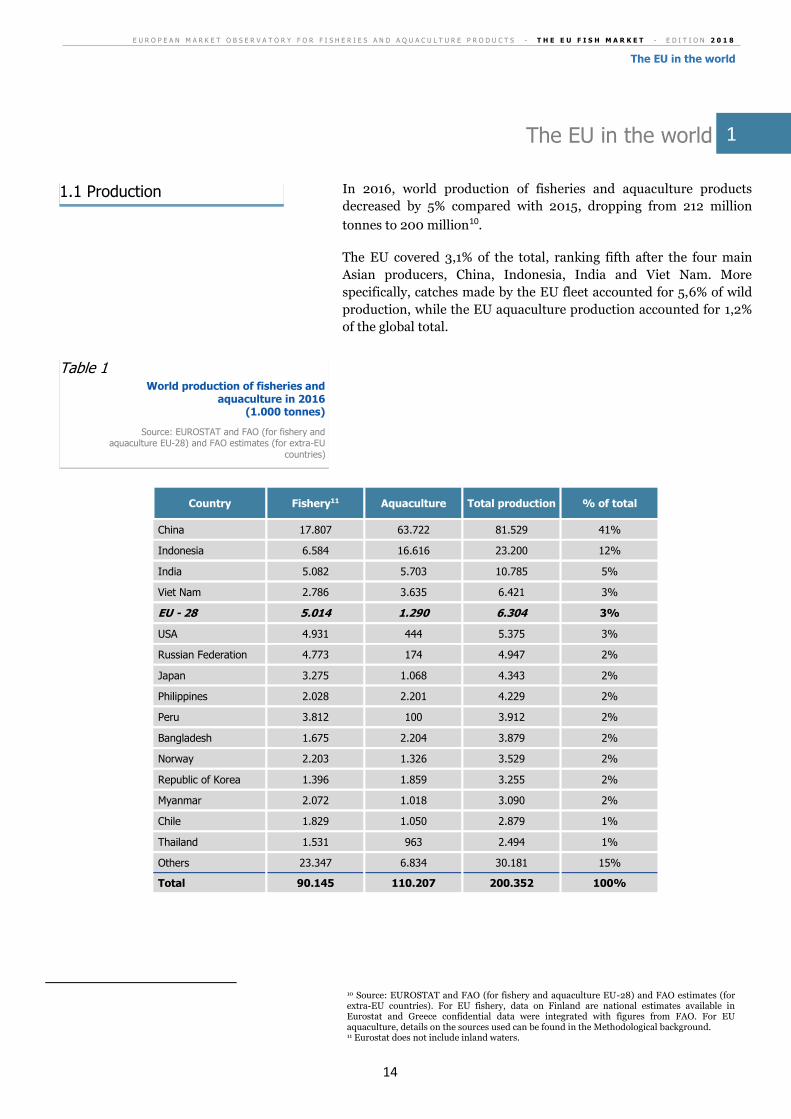
The EU in the world
In 2016, world production of fisheries and aquaculture products
decreased by 5% compared with 2015, dropping from 212 million
tonnes to 200 million10.
The EU covered 3,1% of the total, ranking fifth after the four main
Asian producers, China, Indonesia, India and Viet Nam. More
specifically, catches made by the EU fleet accounted for 5,6% of wild
production, while the EU aquaculture production accounted for 1,2%
of the global total.
Country Fishery11 Aquaculture Total production % of total
China 17.807 63.722 81.529 41%
Indonesia 6.584 16.616 23.200 12%
India 5.082 5.703 10.785 5%
Viet Nam 2.786 3.635 6.421 3%
EU - 28 5.014 1.290 6.304 3%
USA 4.931 444 5.375 3%
Russian Federation 4.773 174 4.947 2%
Japan 3.275 1.068 4.343 2%
Philippines 2.028 2.201 4.229 2%
Peru 3.812 100 3.912 2%
Bangladesh 1.675 2.204 3.879 2%
Norway 2.203 1.326 3.529 2%
Republic of Korea 1.396 1.859 3.255 2%
Myanmar 2.072 1.018 3.090 2%
Chile 1.829 1.050 2.879 1%
Thailand 1.531 963 2.494 1%
Others 23.347 6.834 30.181 15%
Total 90.145 110.207 200.352 100%
10 Source: EUROSTAT and FAO (for fishery and aquaculture EU-28) and FAO estimates (for extra-EU countries). For EU fishery, data on Finland are national estimates available in Eurostat and Greece confidential data were integrated with figures from FAO. For EU aquaculture, details on the sources used can be found in the Methodological background. 11 Eurostat does not include inland waters.
Table 1 World production of fisheries and
aquaculture in 2016 (1.000 tonnes)
Source: EUROSTAT and FAO (for fishery and aquaculture EU-28) and FAO estimates (for extra-EU
countries)
1.1 Production
1
E U R O P E A N M A R K E T O B S E R V A T O R Y F O R F I S H E R I E S A N D A Q U A C U L T U R E P R O D U C T S - T H E E U F I S H M A R K E T - E D I T I O N 2 0 1 8
The EU in the world
15
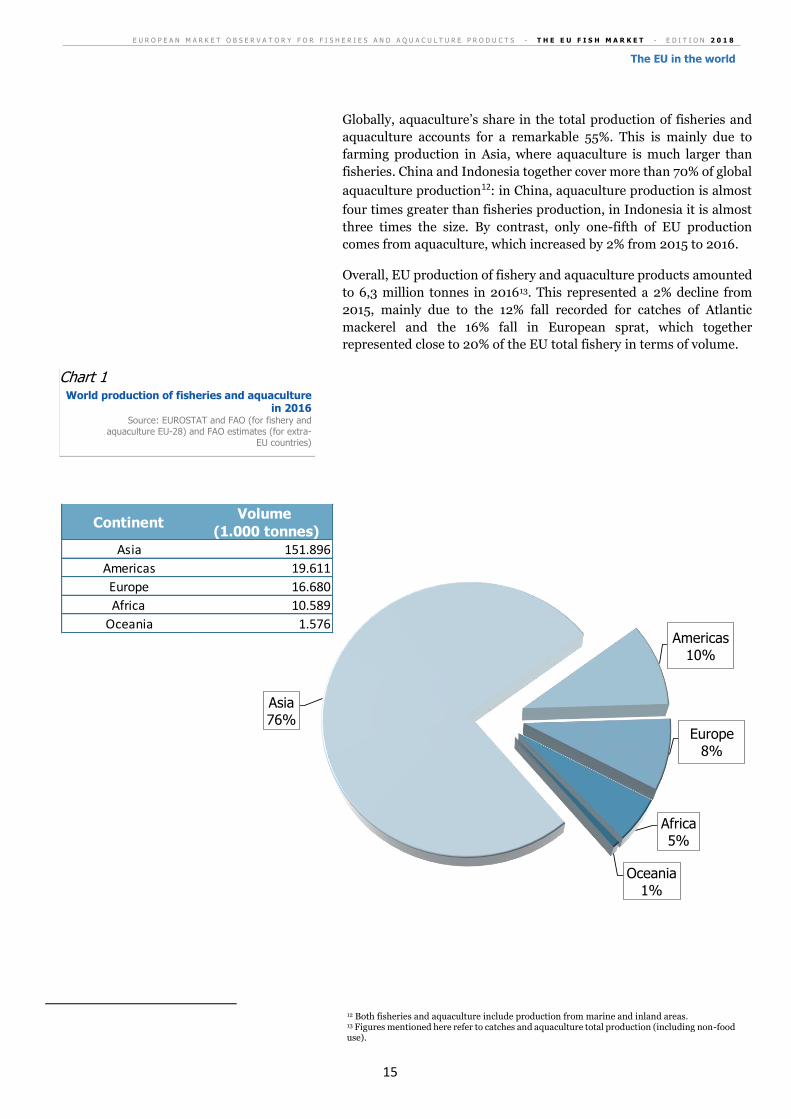
Globally, aquaculture’s share in the total production of fisheries and
aquaculture accounts for a remarkable 55%. This is mainly due to
farming production in Asia, where aquaculture is much larger than
fisheries. China and Indonesia together cover more than 70% of global
aquaculture production12: in China, aquaculture production is almost
four times greater than fisheries production, in Indonesia it is almost
three times the size. By contrast, only one-fifth of EU production
comes from aquaculture, which increased by 2% from 2015 to 2016.
Overall, EU production of fishery and aquaculture products amounted
to 6,3 million tonnes in 201613. This represented a 2% decline from
2015, mainly due to the 12% fall recorded for catches of Atlantic
mackerel and the 16% fall in European sprat, which together
represented close to 20% of the EU total fishery in terms of volume.
12 Both fisheries and aquaculture include production from marine and inland areas. 13 Figures mentioned here refer to catches and aquaculture total production (including non-food use).
Asia76%
Americas10%
Europe8%
Africa5%
Oceania1%
ContinentVolume
(1.000 tonnes)
Asia 151.896
Americas 19.611
Europe 16.680
Africa 10.589
Oceania 1.576
Chart 1 World production of fisheries and aquaculture
in 2016 Source: EUROSTAT and FAO (for fishery and
aquaculture EU-28) and FAO estimates (for extra-EU countries)
E U R O P E A N M A R K E T O B S E R V A T O R Y F O R F I S H E R I E S A N D A Q U A C U L T U R E P R O D U C T S - T H E E U F I S H M A R K E T - E D I T I O N 2 0 1 8
The EU in the world
16
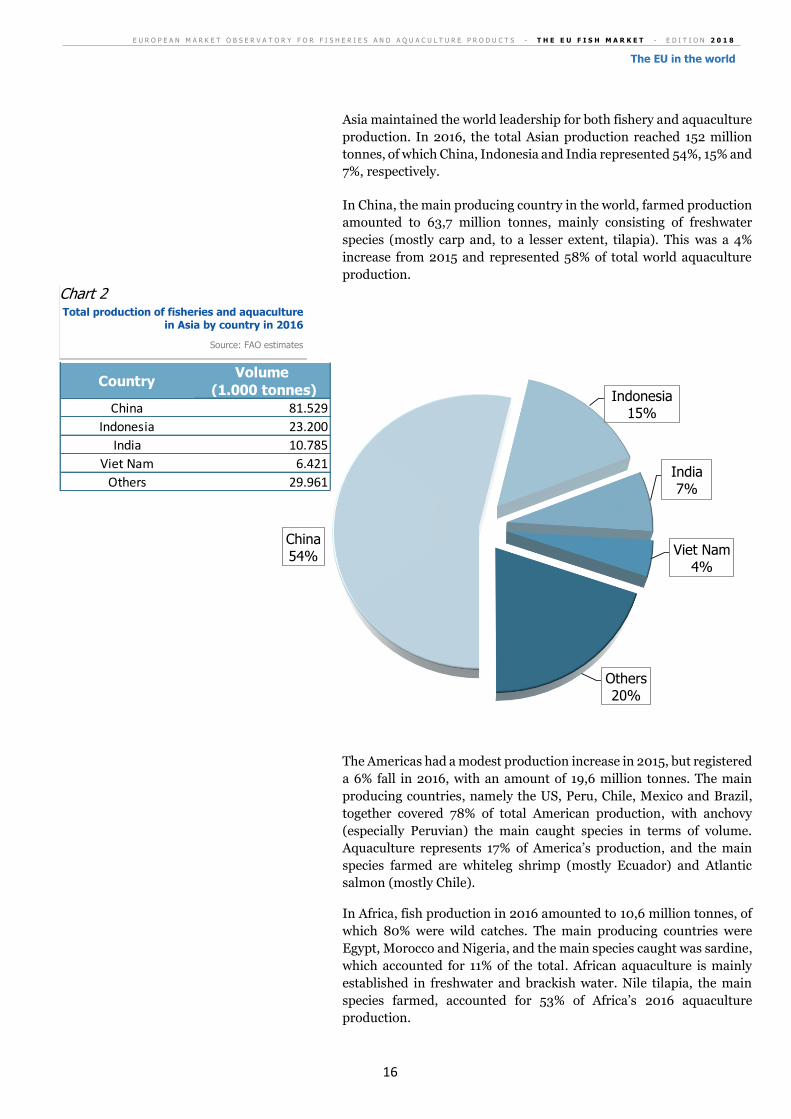
Asia maintained the world leadership for both fishery and aquaculture
production. In 2016, the total Asian production reached 152 million
tonnes, of which China, Indonesia and India represented 54%, 15% and
7%, respectively.
In China, the main producing country in the world, farmed production
amounted to 63,7 million tonnes, mainly consisting of freshwater
species (mostly carp and, to a lesser extent, tilapia). This was a 4%
increase from 2015 and represented 58% of total world aquaculture
production.
The Americas had a modest production increase in 2015, but registered
a 6% fall in 2016, with an amount of 19,6 million tonnes. The main
producing countries, namely the US, Peru, Chile, Mexico and Brazil,
together covered 78% of total American production, with anchovy
(especially Peruvian) the main caught species in terms of volume.
Aquaculture represents 17% of America’s production, and the main
species farmed are whiteleg shrimp (mostly Ecuador) and Atlantic
salmon (mostly Chile).
In Africa, fish production in 2016 amounted to 10,6 million tonnes, of
which 80% were wild catches. The main producing countries were
Egypt, Morocco and Nigeria, and the main species caught was sardine,
which accounted for 11% of the total. African aquaculture is mainly
established in freshwater and brackish water. Nile tilapia, the main
species farmed, accounted for 53% of Africa’s 2016 aquaculture
production.
China54%
Indonesia15%
India7%
Viet Nam4%
Others20%
CountryVolume
(1.000 tonnes)
China 81.529
Indonesia 23.200
India 10.785
Viet Nam 6.421
Others 29.961
Chart 2 Total production of fisheries and aquaculture
in Asia by country in 2016
Source: FAO estimates
E U R O P E A N M A R K E T O B S E R V A T O R Y F O R F I S H E R I E S A N D A Q U A C U L T U R E P R O D U C T S - T H E E U F I S H M A R K E T - E D I T I O N 2 0 1 8
The EU in the world
17
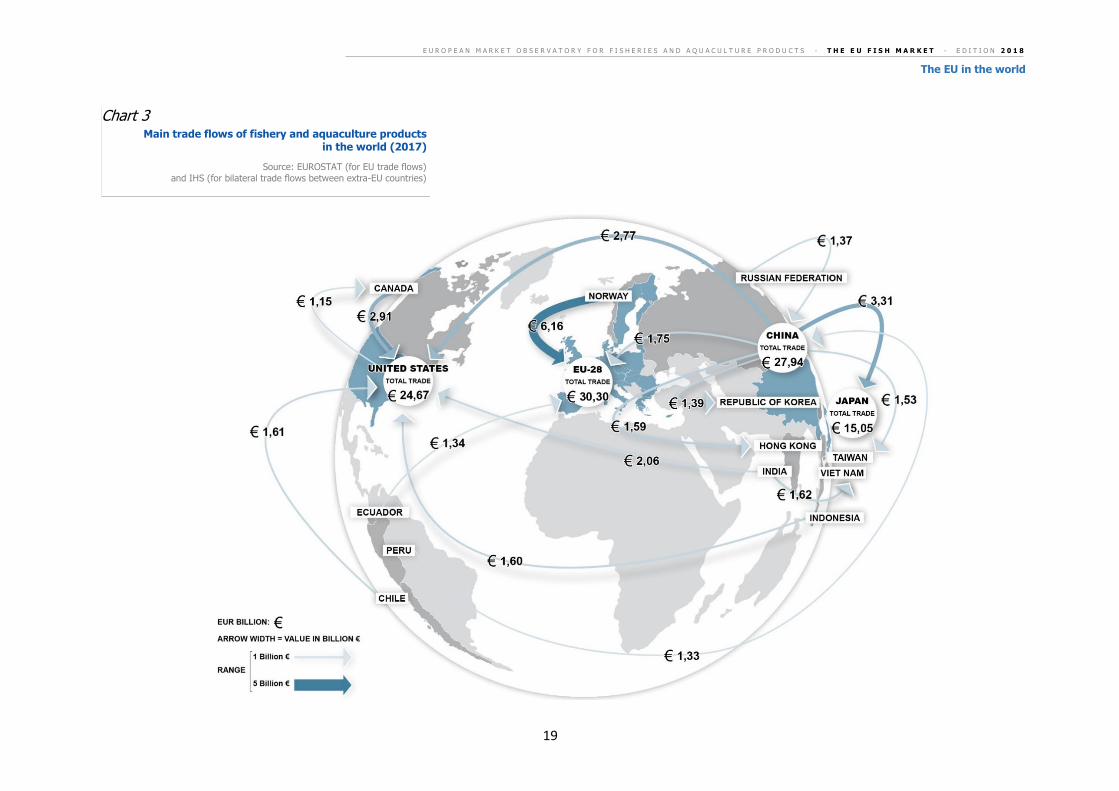
The value of the EU trade flows14 of fisheries and aquaculture products,
which reached EUR 30,3 billion in 2017, is the highest in the world. It
mostly consists of imports, which cover around 70% of the EU
domestic consumption15.
In 2017, the EU imported fisheries and aquaculture products with a
value of EUR 25,3 billion, mainly consisting of salmon, cod, shrimps
and tuna. The EU’s exports, which amounted to EUR 5 billion, mainly
included salmon, tuna, mackerel and fishmeal.
China ranked second to the EU in terms of total trade value, with EUR
27,9 billion. Unlike the EU, it is a net exporter – its 2017 exports
reached EUR 18,2 billion and were two times higher than its imports,
which totalled EUR 9,7 billion.
The main EU supplier is Norway, with exports totalling 1,44 million
tonnes worth EUR 6,16 billion in 2017. Salmon accounted for 73% of
the value of products imported from Norway in 2017, followed by cod,
with 14% of the total. Salmon was mainly imported fresh and whole,
while cod was mainly imported frozen, whole or in fillets.
The Russian Federation is also a main supplier of (frozen) cod to the
EU. In 2017, its cod exports to EU countries increased by 13%
compared with 2016, from 98.024 to 110.606 tonnes, which
corresponded to a 20% value rise, from EUR 368 million to EUR 444
million.
Ecuador, Viet Nam, India and Argentina are other relevant suppliers,
mainly providing the EU with frozen warmwater shrimps and
miscellaneous shrimps and prawns, either frozen or prepared/
preserved.
Ecuador, together with Seychelles and Mauritius, are also important
suppliers of tuna products. In value terms, tuna imported in the EU
mainly consists of processed products: canned tuna and frozen tuna
loins for the canning industry. In terms of species, skipjack and
yellowfin tuna cover 49% and 31%, respectively, of the total value of
tuna imported in the EU.
14 Extra-EU imports + extra-EU exports. 15 In 2016, imports covered 72% of EU domestic supply, according to a EUMOFA analysis, based on elaboration of data from Eurostat and FAO.
1.2 Import - Export
E U R O P E A N M A R K E T O B S E R V A T O R Y F O R F I S H E R I E S A N D A Q U A C U L T U R E P R O D U C T S - T H E E U F I S H M A R K E T - E D I T I O N 2 0 1 8
The EU in the world
18
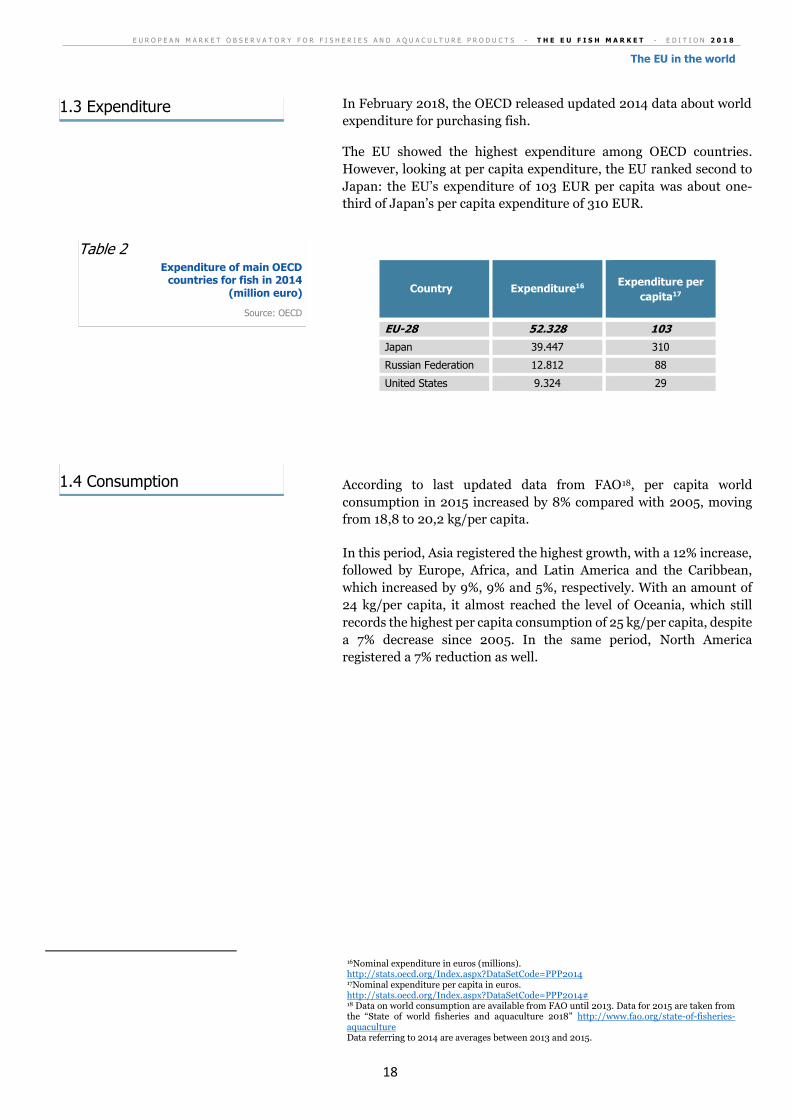
In February 2018, the OECD released updated 2014 data about world
expenditure for purchasing fish.
The EU showed the highest expenditure among OECD countries.
However, looking at per capita expenditure, the EU ranked second to
Japan: the EU’s expenditure of 103 EUR per capita was about one-
third of Japan’s per capita expenditure of 310 EUR.
Country Expenditure16
Expenditure per
capita17
EU-28 52.328 103
Japan 39.447 310
Russian Federation 12.812 88
United States 9.324 29
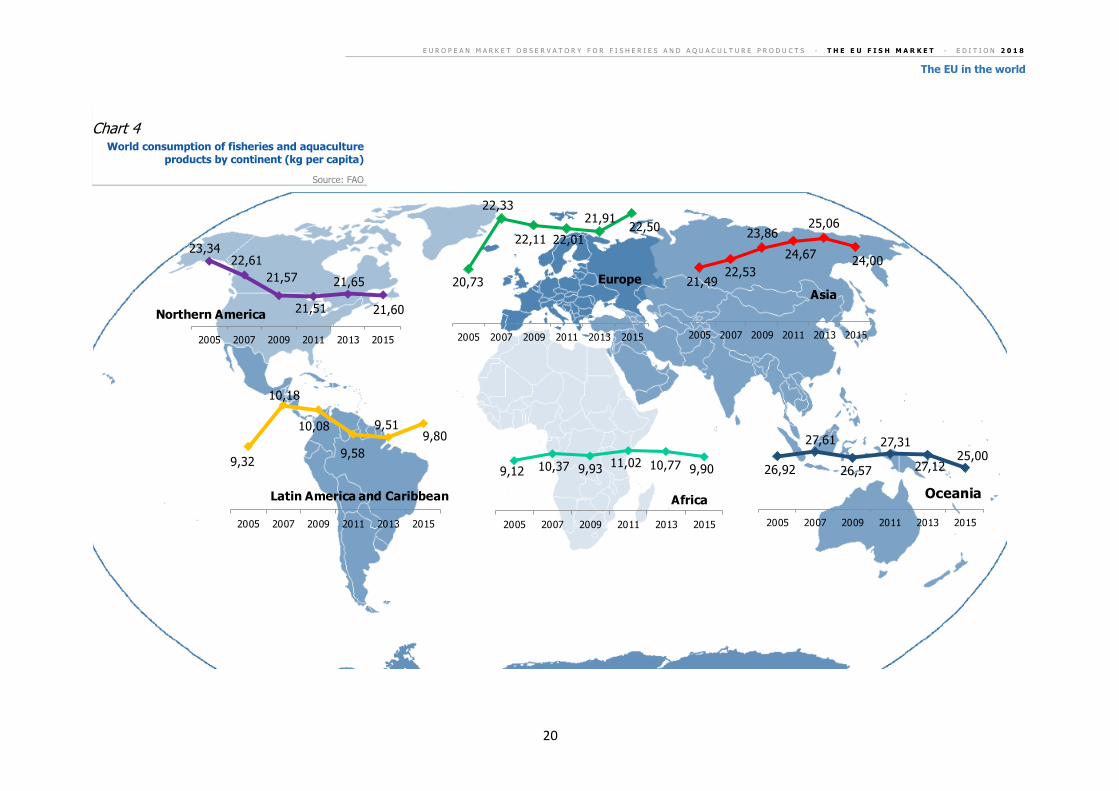
According to last updated data from FAO18, per capita world
consumption in 2015 increased by 8% compared with 2005, moving
from 18,8 to 20,2 kg/per capita.
In this period, Asia registered the highest growth, with a 12% increase,
followed by Europe, Africa, and Latin America and the Caribbean,
which increased by 9%, 9% and 5%, respectively. With an amount of
24 kg/per capita, it almost reached the level of Oceania, which still
records the highest per capita consumption of 25 kg/per capita, despite
a 7% decrease since 2005. In the same period, North America
registered a 7% reduction as well.
16Nominal expenditure in euros (millions). http://stats.oecd.org/Index.aspx?DataSetCode=PPP2014 17Nominal expenditure per capita in euros. http://stats.oecd.org/Index.aspx?DataSetCode=PPP2014# 18 Data on world consumption are available from FAO until 2013. Data for 2015 are taken from the “State of world fisheries and aquaculture 2018” http://www.fao.org/state-of-fisheries-aquaculture Data referring to 2014 are averages between 2013 and 2015.
Table 2 Expenditure of main OECD
countries for fish in 2014 (million euro)
Source: OECD
1.3 Expenditure
1.4 Consumption
E U R O P E A N M A R K E T O B S E R V A T O R Y F O R F I S H E R I E S A N D A Q U A C U L T U R E P R O D U C T S - T H E E U F I S H M A R K E T - E D I T I O N 2 0 1 8
The EU in the world
19
Chart 3 Main trade flows of fishery and aquaculture products
in the world (2017)
Source: EUROSTAT (for EU trade flows)
and IHS (for bilateral trade flows between extra-EU countries)
E U R O P E A N M A R K E T O B S E R V A T O R Y F O R F I S H E R I E S A N D A Q U A C U L T U R E P R O D U C T S - T H E E U F I S H M A R K E T - E D I T I O N 2 0 1 8
The EU in the world
20
23,3422,61
21,57
21,51
21,65
21,60
2005 2007 2009 2011 2013 2015
Northern America
9,32
10,18
10,08
9,58
9,519,80
2005 2007 2009 2011 2013 2015
Latin America and Caribbean
9,12 10,37 9,9311,02 10,77 9,90
2005 2007 2009 2011 2013 2015
Africa
20,73
22,33
22,11 22,01
21,9122,50
2005 2007 2009 2011 2013 2015
Europe
26,92
27,61
26,57
27,31
27,1225,00
2005 2007 2009 2011 2013 2015
Oceania
21,4922,53
23,86
24,67
25,06
24,00
2005 2007 2009 2011 2013 2015
Asia
Chart 4 World consumption of fisheries and aquaculture
products by continent (kg per capita)
Source: FAO
E U R O P E A N M A R K E T O B S E R V A T O R Y F O R F I S H E R I E S A N D A Q U A C U L T U R E P R O D U C T S - T H E E U F I S H M A R K E T - E D I T I O N 2 0 1 8
EU market supply
21
EU market supply
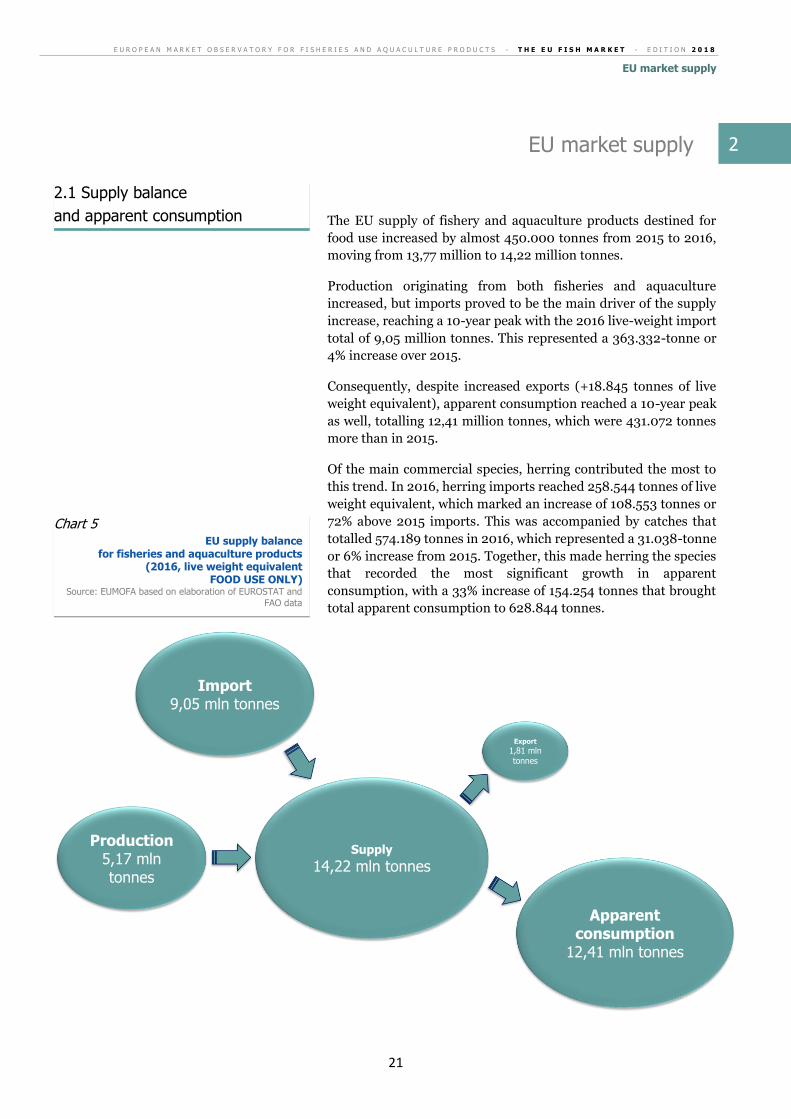
The EU supply of fishery and aquaculture products destined for
food use increased by almost 450.000 tonnes from 2015 to 2016,
moving from 13,77 million to 14,22 million tonnes.
Production originating from both fisheries and aquaculture
increased, but imports proved to be the main driver of the supply
increase, reaching a 10-year peak with the 2016 live-weight import
total of 9,05 million tonnes. This represented a 363.332-tonne or
4% increase over 2015.
Consequently, despite increased exports (+18.845 tonnes of live
weight equivalent), apparent consumption reached a 10-year peak
as well, totalling 12,41 million tonnes, which were 431.072 tonnes
more than in 2015.
Of the main commercial species, herring contributed the most to
this trend. In 2016, herring imports reached 258.544 tonnes of live
weight equivalent, which marked an increase of 108.553 tonnes or
72% above 2015 imports. This was accompanied by catches that
totalled 574.189 tonnes in 2016, which represented a 31.038-tonne
or 6% increase from 2015. Together, this made herring the species
that recorded the most significant growth in apparent
consumption, with a 33% increase of 154.254 tonnes that brought
total apparent consumption to 628.844 tonnes.
Supply
14,22 mln tonnes
Production5,17 mln tonnes
Import9,05 mln tonnes
Export
1,81 mln tonnes
Apparent consumption
12,41 mln tonnes
Chart 5 EU supply balance
for fisheries and aquaculture products (2016, live weight equivalent
FOOD USE ONLY) Source: EUMOFA based on elaboration of EUROSTAT and
FAO data
2.1 Supply balance
and apparent consumption
2
E U R O P E A N M A R K E T O B S E R V A T O R Y F O R F I S H E R I E S A N D A Q U A C U L T U R E P R O D U C T S - T H E E U F I S H M A R K E T - E D I T I O N 2 0 1 8
EU market supply
22
2011 2012 2013 2014 2015 2016
Food use Catches 3.644.690 3.614.409 3.834.079 4.216.254 3.824.012 3.883.916
Aquaculture 1.271.816 1.235.825 1.186.672 1.252.608 1.263.141 1.289.823
Total production destined to food use
4.916.506 4.850.234 5.020.751 5.468.862 5.087.153 5.173.739
Non-food use Catches 1.117.468 741.332 994.911 1.165.413 1.320.207 1.130.563
Of EU production destined for food use, 75% comes from wild
products. In 2016, catches increased by 2%, marking a recovery from
2015’s 9% decrease. Aquaculture production increased as well,
growing by 2% and continuing the upward trend started in 2014.
Non-food catches19 interrupted the positive trend started in 2013 and
registered a 14% fall. This was mostly due to decreased catches of
sandeels and sprats, which dropped by 169.013 and 68.439 tonnes,
respectively.
Data as of June 2018. Data may differ from those currently available on the EUMOFA website as these are constantly updated (see
methodological background for the details).
19 Source: Eurostat. For the species considered not to be destined to human consumption, please refer to the Methodological background.
Fishery Aquaculture Fishery Aquaculture Fishery Aquaculture Fishery Aquaculture Total Fishery Aquaculture Total
Bivalves and other molluscs and
aquatic invertebrates224.464 602.043 372.773 86.278 34.614 9.072 562.623 679.249 1.241.872 1,10 1,33 2,43
Cephalopods 93.217 2 541.428 0 30.617 1 604.027 1 604.027 1,18 0 1,18
Crustaceans 169.271 402 570.830 308.218 107.644 474 632.457 308.146 940.604 1,24 0,60 1,84
Flatfish 198.179 11.244 155.633 697 67.807 334 286.004 11.607 297.611 0,56 0,02 0,58
Freshwater fish 17.222 106.000 101.596 311.373 8.511 8.344 110.307 409.030 519.337 0,22 0,80 1,02
Groundfish 623.099 0 2.754.331 682 254.772 0 3.122.658 682 3.123.341 6,12 0 6,12
Miscellaneous aquatic products 55.390 672 310.184 0 15.399 0 350.175 672 350.847 0,69 0 0,69
Other marine fish 334.806 175.741 401.481 61.237 114.323 12.666 621.964 224.312 846.276 1,22 0,44 1,66
Salmonids 4.936 376.119 97.064 1.002.610 39.993 102.222 62.007 1.276.507 1.338.514 0,12 2,50 2,62
Small pelagics 1.762.776 0 603.119 0 686.842 0 1.679.054 0 1.679.054 3,29 0 3,29
Tuna and tuna-like species 400.556 17.599 1.365.450 95 301.969 9.754 1.464.037 7.941 1.471.977 2,87 0,02 2,88
Total 3.883.916 1.289.823 7.273.889 1.771.191 1.662.493 142.866 9.495.313 2.918.148 12.413.461 18,61 5,72 24,33
Apparent consumption
per capita (kg)Commodity group
Production (tonnes) Import (tonnes) Export (tonnes) Apparent consumption (tonnes)
Table 3 EU production details (tonnes)
Source: EUMOFA based on elaboration of EUROSTAT, National sources, FEAP and FAO data
Table 4 EU supply balance
for fisheries and aquaculture products by commodity group and production method
(2016, live weight equivalent FOOD USE ONLY)
Source: EUMOFA based on elaboration of EUROSTAT and FAO data

E U R O P E A N M A R K E T O B S E R V A T O R Y F O R F I S H E R I E S A N D A Q U A C U L T U R E P R O D U C T S - T H E E U F I S H M A R K E T - E D I T I O N 2 0 1 8
EU market supply
23
In 2016, per capita consumption of fisheries and aquaculture
products in the EU reached 24,33 kg, which was an increase of 763
grams or 3% from per capita consumption in 2015. Wild products
predominated the market in 2016, accounting for 18,61 kg per capita
or 76% of the total. This represented the highest amount of the 2012–
2016 period and an increase of 723 grams over 2015. The most
remarkable consumption increases were for herring (+299 grams),
sardine (+157 grams) and skipjack tuna (+95 grams). On the other
hand, the main decreases were with sprat (-67 grams) and the
groupings “other groundfish”20(-90 grams) and “miscellaneous
tunas”21 (-63 grams). Per capita apparent consumption of farmed
products in 2016 increased a slight 1% from the previous year,
bringing it to 5,72 kg, almost at the 10-year peak level of 5,73 kg
reached in 2014. More than half of total per capita apparent
consumption of farmed products is represented by salmon (2,08 kg)
and mussels (1,01 kg), both stable compared with 2015.
The supply of a market is ensured by production and imports. Self-
sufficiency is the ratio of domestic production over domestic
demand, which namely indicates what is consumed. Within the EU
market for fisheries and aquaculture products, this ratio decreased
from 42,5% in 2015 to 41,7% in 2016 – meaning that a higher share
of demand had been met through imports than through EU catches
or aquaculture production. This decrease was mainly due to a
substantial increase of imports which was much more intense than
that registered for farmed and wild EU production. Indeed, the top-
5 species consumed in the EU – tuna, cod, salmon, Alaska pollock
and shrimps – representing 43% of the market in 2016, were mostly
imported from third countries.
20 Mostly consisting of sandeels. 21 Mostly consisting of Atlantic bonito.
0,0%
10,0%
20,0%
30,0%
40,0%
50,0%
60,0%
70,0%
80,0%
90,0%
100,0%
0,00
2,00
4,00
6,00
8,00
10,00
12,00
14,00
2007 2008 2009 2010 2011 2012 2013 2014 2015 2016
Se
lf-s
uff
icie
ncy r
ate
Ap
pa
ren
t co
nsu
mp
tio
n
Apparent consumption (million tonnes) Self-sufficiency rate
In 2016, the average EU citizen consumed 24,33 kg
of fisheries and aquaculture products, 763 grams more
than in 2015.
2.2 EU self sufficiency
Chart 6 EU market trend and self-sufficiency rates Source: EUMOFA based on elaboration of EUROSTAT,
National sources, FEAP and FAO data
E U R O P E A N M A R K E T O B S E R V A T O R Y F O R F I S H E R I E S A N D A Q U A C U L T U R E P R O D U C T S - T H E E U F I S H M A R K E T - E D I T I O N 2 0 1 8
EU market supply
24
Products and share of total apparent consumption
Self-sufficiency rate
Mackerel (2%) 123%
Herring (5%) 91%
Trout (2%) 89%
Mussel (5%) 82%
Sardine (3%) 74%
Hake (4%) 38%
Scallop (1%) 30%
Tuna (11%) 28%
Salmon (9%) 16%
Cod (10%) 9%
Squid (3%) 9%
Shrimp (6%) 9%
Freshwater catfish (2%) 4%
Alaska pollock (7%) 0%
Surimi (2%) 0%
Commodity groups and share of total apparent consumption
Self-sufficiency rates
2007 2008 2009 2010 2011 2012 2013 2014 2015 2016
Groundfish (25%)
21% 21% 18% 18% 17% 19% 19% 22% 22% 20%
Small pelagics (14%)
104% 103% 100% 107% 105% 110% 107% 131% 121% 105%
Tuna and tuna-like species (12%)
23% 32% 14% 15% 23% 26% 29% 34% 27% 28%
Salmonids (11%)
34% 33% 34% 34% 33% 31% 31% 30% 28% 28%
Bivalves and other molluscs and aquatic invertebrates (10%)
65% 62% 61% 58% 59% 64% 61% 60% 64% 67%
Crustaceans (8%)
20% 18% 16% 16% 17% 17% 18% 18% 18% 18%
Other marine fish (7%)
48% 49% 51% 51% 57% 68% 67% 65% 63% 60%
Cephalopods (5%)
18% 17% 15% 14% 18% 20% 20% 22% 19% 15%
Freshwater fish (4%)
18% 16% 16% 14% 15% 17% 18% 21% 23% 24%
Miscellaneous aquatic products (3%)
13% 13% 0% 0% 13% 13% 20% 17% 6% 16%
Flatfish (1%)
86% 93% 92% 95% 97% 76% 78% 73% 74% 70%
Total 41,5% 41,8% 38,6% 38,4% 40,1% 42,2% 41,9% 44,6% 42,5% 41,7%
Table 5 Self-sufficiency rate
of most consumed products (2016) Source: EUMOFA based on elaboration of EUROSTAT and
FAO data
Table 6 Self-sufficiency rate by commodity group,
ranked by share of total apparent consumption
Source: EUMOFA based on elaboration of EUROSTAT, National sources, FEAP and FAO data
E U R O P E A N M A R K E T O B S E R V A T O R Y F O R F I S H E R I E S A N D A Q U A C U L T U R E P R O D U C T S - T H E E U F I S H M A R K E T - E D I T I O N 2 0 1 8
EU market supply
25
In 2016, the EU self-sufficiency rate for groundfish fell to 20%, a
decrease of 2% compared with both 2014 and 2015. The decrease was
largely driven by reduced catches of cod and increased imports of
both cod and Alaska pollock.
The two species accounted for 64% of the apparent consumption of
groundfish in 2016: cod had a self-sufficiency rate of 9% while all
Alaska pollock was imported. Together, these products significantly
contribute to making the EU less self-sufficient.
The EU is fully capable of meeting the demand of small pelagics
through fisheries production.
The self-sufficiency rate for this commodity group has averaged
109% during the last ten years. In 2014, it skyrocketed to 131%,
thanks to increased catches of mackerel, but then began a downward
trend. In 2015, the self-sufficiency rate decline was due to lower
production of sardine and horse mackerel; in 2016, it continued to
drop due to increased imports of herring, which also contributed to
the overall decline in the EU self-sufficiency rate for fisheries and
aquaculture products.
0%
10%
20%
30%
40%
50%
60%
70%
80%
90%
100%
0,00
0,50
1,00
1,50
2,00
2,50
3,00
3,50
2007 2008 2009 2010 2011 2012 2013 2014 2015 2016
Se
lf-s
uff
icie
ncy r
ate
Ap
pa
ren
t co
nsu
mp
tio
n
Apparent consumption (million tonnes) Self-sufficiency rate
0%
20%
40%
60%
80%
100%
120%
140%
0,00
0,50
1,00
1,50
2,00
2007 2008 2009 2010 2011 2012 2013 2014 2015 2016
Se
lf-s
uff
icie
ncy r
ate
Ap
pa
ren
t co
nsu
mp
tio
n
Apparent consumption (million tonnes) Self-sufficiency rate
Groundfish
Chart 7 EU market trend and self-sufficiency rates
for groundfish Source: EUMOFA based on elaboration of EUROSTAT,
National sources, FEAP and FAO data
In 2016, increased imports of herring determined the
decline of the EU self-sufficiency for fisheries
and aquaculture products compared with 2015.
Small pelagics
Chart 8 EU market trend and self-sufficiency rates
for small pelagics Source: EUMOFA based on elaboration of EUROSTAT,
National sources and FAO data
E U R O P E A N M A R K E T O B S E R V A T O R Y F O R F I S H E R I E S A N D A Q U A C U L T U R E P R O D U C T S - T H E E U F I S H M A R K E T - E D I T I O N 2 0 1 8
EU market supply
26
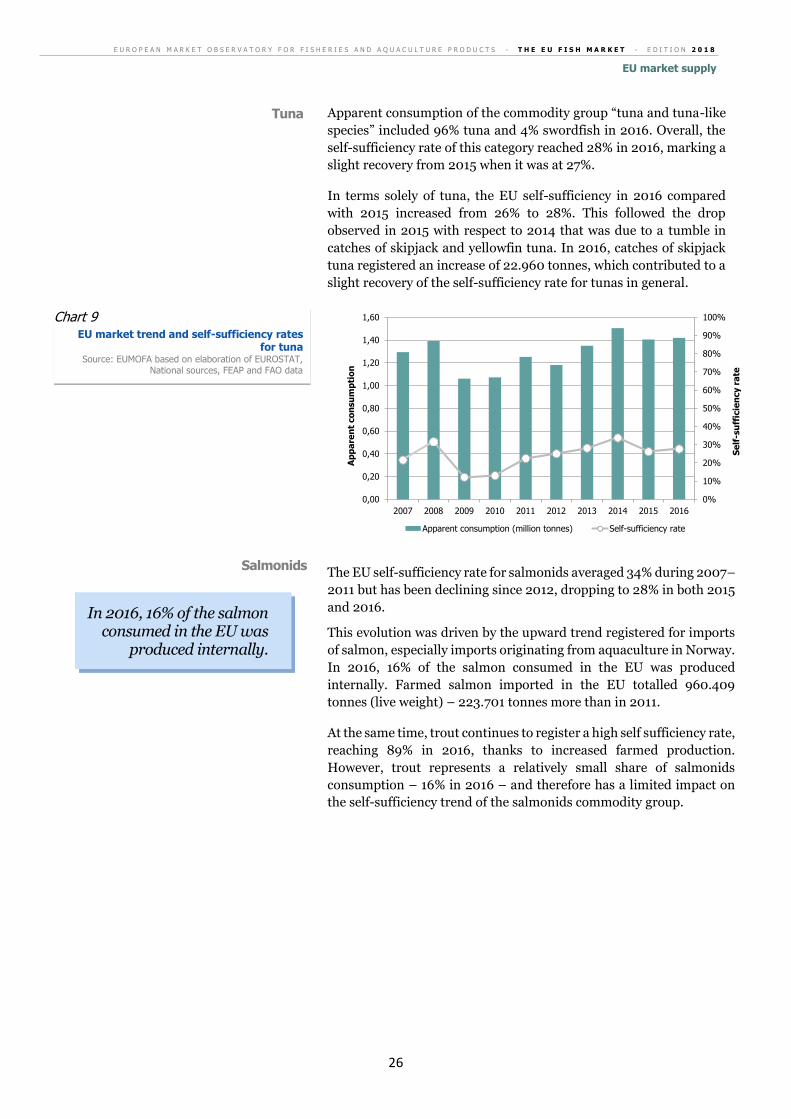
Apparent consumption of the commodity group “tuna and tuna-like
species” included 96% tuna and 4% swordfish in 2016. Overall, the
self-sufficiency rate of this category reached 28% in 2016, marking a
slight recovery from 2015 when it was at 27%.
In terms solely of tuna, the EU self-sufficiency in 2016 compared
with 2015 increased from 26% to 28%. This followed the drop
observed in 2015 with respect to 2014 that was due to a tumble in
catches of skipjack and yellowfin tuna. In 2016, catches of skipjack
tuna registered an increase of 22.960 tonnes, which contributed to a
slight recovery of the self-sufficiency rate for tunas in general.
The EU self-sufficiency rate for salmonids averaged 34% during 2007–
2011 but has been declining since 2012, dropping to 28% in both 2015
and 2016.
This evolution was driven by the upward trend registered for imports
of salmon, especially imports originating from aquaculture in Norway.
In 2016, 16% of the salmon consumed in the EU was produced
internally. Farmed salmon imported in the EU totalled 960.409
tonnes (live weight) – 223.701 tonnes more than in 2011.
At the same time, trout continues to register a high self sufficiency rate,
reaching 89% in 2016, thanks to increased farmed production.
However, trout represents a relatively small share of salmonids
consumption – 16% in 2016 – and therefore has a limited impact on
the self-sufficiency trend of the salmonids commodity group.
0%
10%
20%
30%
40%
50%
60%
70%
80%
90%
100%
0,00
0,20
0,40
0,60
0,80
1,00
1,20
1,40
1,60
2007 2008 2009 2010 2011 2012 2013 2014 2015 2016
Se
lf-s
uff
icie
ncy r
ate
Ap
pa
ren
t co
nsu
mp
tio
n
Apparent consumption (million tonnes) Self-sufficiency rate
Tuna
Chart 9 EU market trend and self-sufficiency rates
for tuna Source: EUMOFA based on elaboration of EUROSTAT,
National sources, FEAP and FAO data
In 2016, 16% of the salmon consumed in the EU was
produced internally.
Salmonids

E U R O P E A N M A R K E T O B S E R V A T O R Y F O R F I S H E R I E S A N D A Q U A C U L T U R E P R O D U C T S - T H E E U F I S H M A R K E T - E D I T I O N 2 0 1 8
EU market supply
27
The EU self-sufficiency rate for crustaceans has shown a relatively
stable trend during the last ten years. Since 2013, it has been at 18%,
which was also its 10-year average.
The EU is self-sufficient for squillid, Norway lobster and crab, with
ratios of 100%, 97% and 97% respectively in 2016. As for shrimp
Crangon, the biggest part of what is exported to non-EU countries
(mostly Morocco) is not consumed there but comes back to the EU
after peeling.
For other species of crustaceans, imports are predominant. The
lowest self-sufficiency rates are those concerning the most consumed
types of shrimps, namely warm-water shrimps (1%) and
miscellaneous shrimps (2%), the latter consisting mainly of
Argentine red shrimp, frozen or prepared/preserved.
0%
10%
20%
30%
40%
50%
60%
70%
80%
90%
100%
0,00
0,25
0,50
0,75
1,00
1,25
1,50
2007 2008 2009 2010 2011 2012 2013 2014 2015 2016
Se
lf-s
uff
icie
ncy r
ate
Ap
pa
ren
t co
nsu
mp
tio
n
Apparent consumption (million tonnes) Self-sufficiency rate
0%
10%
20%
30%
40%
50%
60%
70%
80%
90%
100%
0,00
0,20
0,40
0,60
0,80
1,00
2007 2008 2009 2010 2011 2012 2013 2014 2015 2016
Se
lf-s
uff
icie
ncy r
ate
Ap
pa
ren
t co
nsu
mp
tio
n
Apparent consumption (million tonnes) Self-sufficiency rate
Chart 10 EU market trend and self-sufficiency rates
for salmonids Source: EUMOFA based on elaboration of EUROSTAT,
National sources, FEAP and FAO data
Crustaceans
Chart 11 EU market trend and self-sufficiency rates
for crustaceans Source: EUMOFA based on elaboration of EUROSTAT,
National sources, FEAP and FAO data
E U R O P E A N M A R K E T O B S E R V A T O R Y F O R F I S H E R I E S A N D A Q U A C U L T U R E P R O D U C T S - T H E E U F I S H M A R K E T - E D I T I O N 2 0 1 8
EU market supply
28
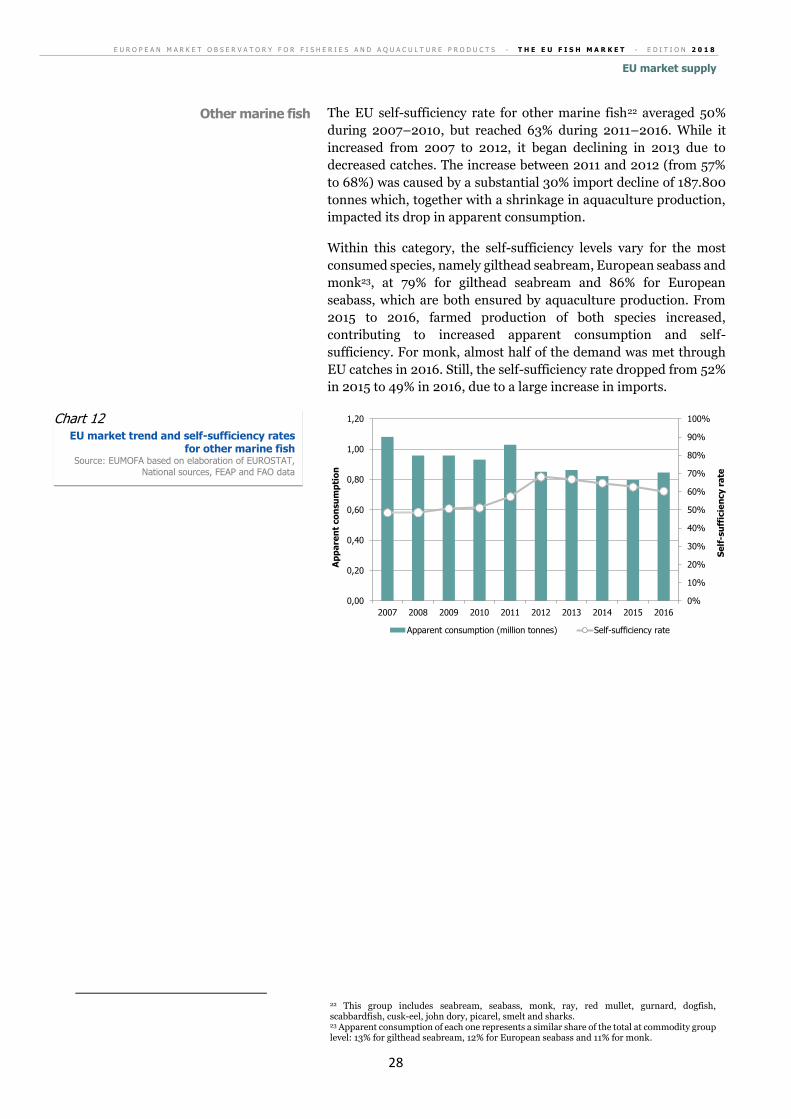
The EU self-sufficiency rate for other marine fish22 averaged 50%
during 2007–2010, but reached 63% during 2011–2016. While it
increased from 2007 to 2012, it began declining in 2013 due to
decreased catches. The increase between 2011 and 2012 (from 57%
to 68%) was caused by a substantial 30% import decline of 187.800
tonnes which, together with a shrinkage in aquaculture production,
impacted its drop in apparent consumption.
Within this category, the self-sufficiency levels vary for the most
consumed species, namely gilthead seabream, European seabass and
monk23, at 79% for gilthead seabream and 86% for European
seabass, which are both ensured by aquaculture production. From
2015 to 2016, farmed production of both species increased,
contributing to increased apparent consumption and self-
sufficiency. For monk, almost half of the demand was met through
EU catches in 2016. Still, the self-sufficiency rate dropped from 52%
in 2015 to 49% in 2016, due to a large increase in imports.
22 This group includes seabream, seabass, monk, ray, red mullet, gurnard, dogfish, scabbardfish, cusk-eel, john dory, picarel, smelt and sharks. 23 Apparent consumption of each one represents a similar share of the total at commodity group level: 13% for gilthead seabream, 12% for European seabass and 11% for monk.
0%
10%
20%
30%
40%
50%
60%
70%
80%
90%
100%
0,00
0,20
0,40
0,60
0,80
1,00
1,20
2007 2008 2009 2010 2011 2012 2013 2014 2015 2016
Se
lf-s
uff
icie
ncy r
ate
Ap
pa
ren
t co
nsu
mp
tio
n
Apparent consumption (million tonnes) Self-sufficiency rate
Other marine fish
Chart 12 EU market trend and self-sufficiency rates
for other marine fish Source: EUMOFA based on elaboration of EUROSTAT,
National sources, FEAP and FAO data
E U R O P E A N M A R K E T O B S E R V A T O R Y F O R F I S H E R I E S A N D A Q U A C U L T U R E P R O D U C T S - T H E E U F I S H M A R K E T - E D I T I O N 2 0 1 8
Consumption
29
Consumption
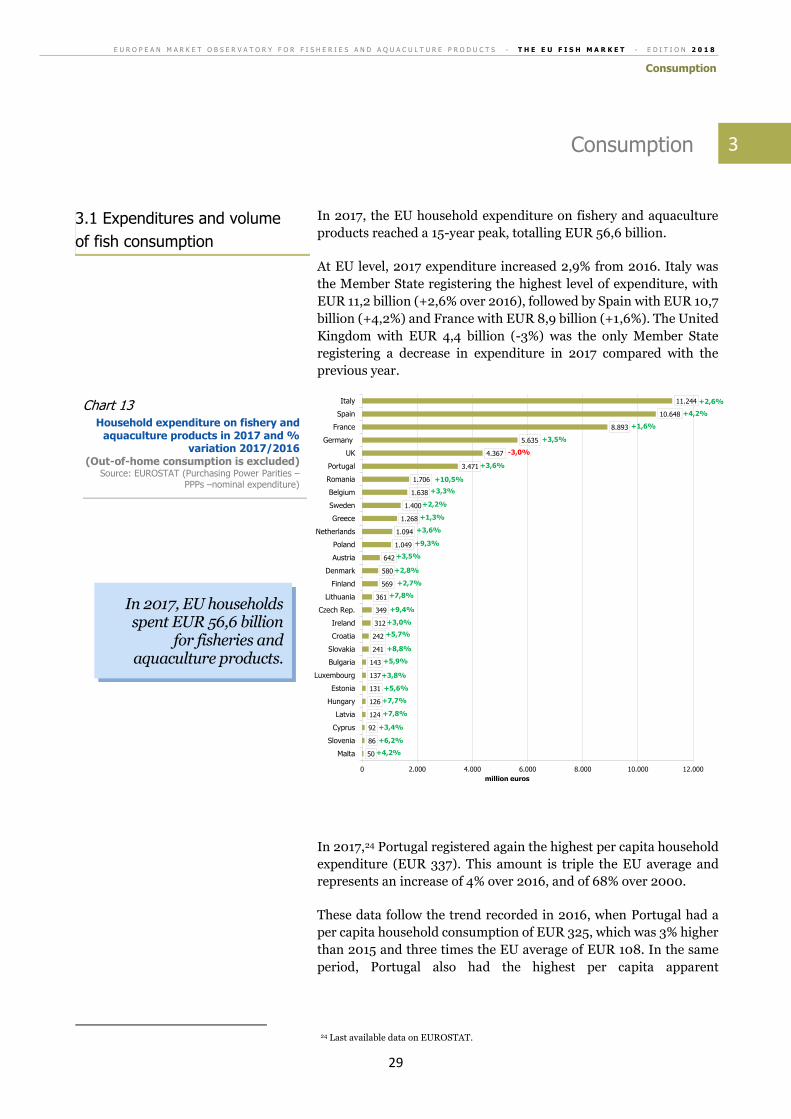
In 2017, the EU household expenditure on fishery and aquaculture
products reached a 15-year peak, totalling EUR 56,6 billion.
At EU level, 2017 expenditure increased 2,9% from 2016. Italy was
the Member State registering the highest level of expenditure, with
EUR 11,2 billion (+2,6% over 2016), followed by Spain with EUR 10,7
billion (+4,2%) and France with EUR 8,9 billion (+1,6%). The United
Kingdom with EUR 4,4 billion (-3%) was the only Member State
registering a decrease in expenditure in 2017 compared with the
previous year.
In 2017,24 Portugal registered again the highest per capita household
expenditure (EUR 337). This amount is triple the EU average and
represents an increase of 4% over 2016, and of 68% over 2000.
These data follow the trend recorded in 2016, when Portugal had a
per capita household consumption of EUR 325, which was 3% higher
than 2015 and three times the EU average of EUR 108. In the same
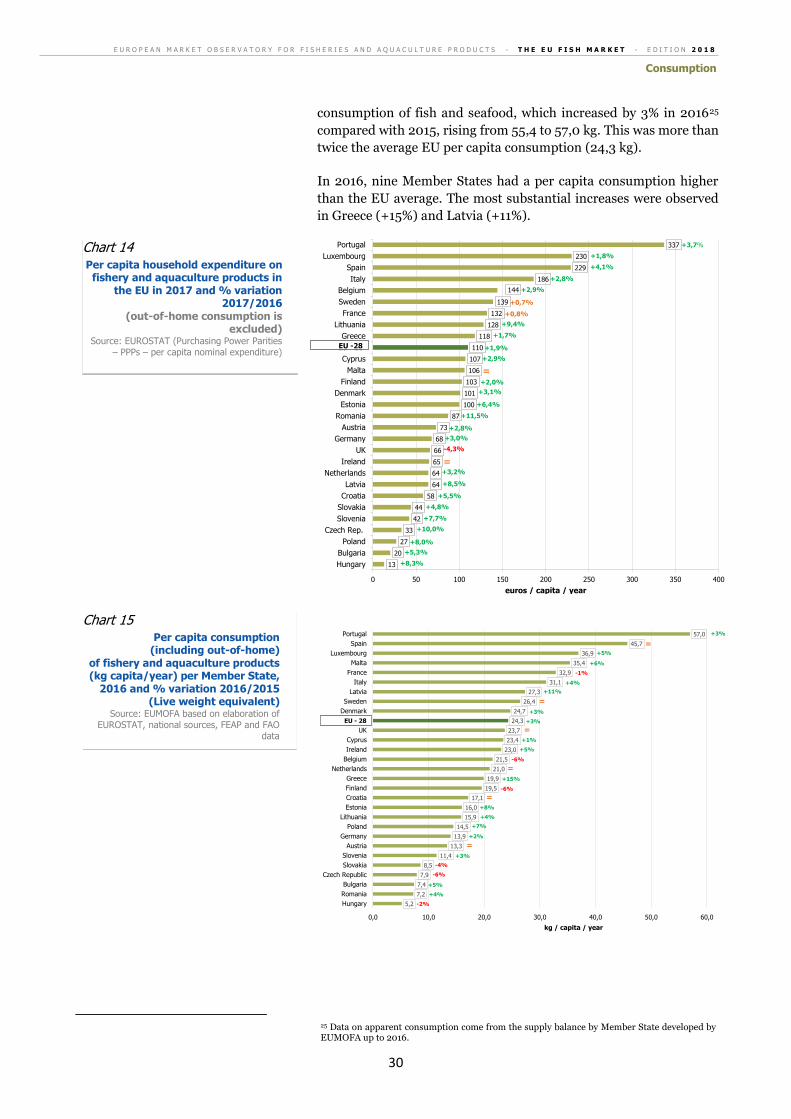
period, Portugal also had the highest per capita apparent
24 Last available data on EUROSTAT.
50
86
92
124
126
131
137
143
241
242
312
349
361
569
580
642
1.049
1.094
1.268
1.400
1.638
1.706
3.471
4.367
5.635
8.893
10.648
11.244
0 2.000 4.000 6.000 8.000 10.000 12.000
Malta
Slovenia
Cyprus
Latvia
Hungary
Estonia
Luxembourg
Bulgaria
Slovakia
Croatia
Ireland
Czech Rep.
Lithuania
Finland
Denmark
Austria
Poland
Netherlands
Greece
Sweden
Belgium
Romania
Portugal
UK
Germany
France
Spain
Italy
million euros
+2,8%
+3,5%
+9,3%
+3,6%
+1,3%
+2,2%
+3,3%
+10,5%
+3,6%
-3,0%
+3,5%
+1,6%
+4,2%
+7,8%
+7,7%
+5,6%
+3,8%
+5,9%
+8,8%
+5,7%
+3,0%
+9,4%
+7,8%
+2,7%
+4,2%
+6,2%
+3,4%
+2,6%
In 2017, EU households spent EUR 56,6 billion
for fisheries and aquaculture products.
Chart 13
Household expenditure on fishery and aquaculture products in 2017 and %
variation 2017/2016 (Out-of-home consumption is excluded)
Source: EUROSTAT (Purchasing Power Parities – PPPs –nominal expenditure)
3.1 Expenditures and volume
of fish consumption
3
E U R O P E A N M A R K E T O B S E R V A T O R Y F O R F I S H E R I E S A N D A Q U A C U L T U R E P R O D U C T S - T H E E U F I S H M A R K E T - E D I T I O N 2 0 1 8
Consumption
30
consumption of fish and seafood, which increased by 3% in 201625
compared with 2015, rising from 55,4 to 57,0 kg. This was more than
twice the average EU per capita consumption (24,3 kg).
In 2016, nine Member States had a per capita consumption higher
than the EU average. The most substantial increases were observed
in Greece (+15%) and Latvia (+11%).
25 Data on apparent consumption come from the supply balance by Member State developed by EUMOFA up to 2016.
13
20
27
33
42
44
58
64
64
65
66
68
73
87
100
101
103
106
107
110
118
128
132
139
144
186
229
230
337
0 50 100 150 200 250 300 350 400
Hungary
Bulgaria
Poland
Czech Rep.
Slovenia
Slovakia
Croatia
Latvia
Netherlands
Ireland
UK
Germany
Austria
Romania
Estonia
Denmark
Finland
Malta
Cyprus
Eu - 28
Greece
Lithuania
France
Sweden
Belgium
Italy
Spain
Luxembourg
Portugal
euros / capita / year
+3,7%
+2,9%
+4,1%
+1,8%
+6,4%
+2,9%
+1,9%
=
+1,7%
+9,4%
+0,8%
+0,7%
+2,8%
+2,0%
+3,2%
-4,3%
+3,0%
+2,8%
+11,5%
+3,1%
+8,0%
+10,0%
+7,7%
+4,8%
+5,5%
+8,5%
+8,3%
+5,3%
EU -28
=
5,2
7,2
7,4
7,9
8,5
11,4
13,3
13,9
14,5
15,9
16,0
17,1
19,5
19,9
21,0
21,5
23,0
23,4
23,7
24,3
24,7
26,4
27,3
31,1
32,9
35,4
36,9
45,7
57,0
0,0 10,0 20,0 30,0 40,0 50,0 60,0
Hungary
Romania
Bulgaria
Czech Republic
Slovakia
Slovenia
Austria
Germany
Poland
Lithuania
Estonia
Croatia
Finland
Greece
Netherlands
Belgium
Ireland
Cyprus
UK
EU - 28
Denmark
Sweden
Latvia
Italy
France
Malta
Luxembourg
Spain
Portugal
kg / capita / year
+3%
EU - 28
+5%
+6%
-1%
+4%
+11%
+3%
+3%
+1%
+5%
-6%
+15%
-6%
+8%
+4%
+7%
+2%
+3%
-4%
-6%
+5%
+4%
-2%
=
=
=
=
=
=
Chart 14 Per capita household expenditure on
fishery and aquaculture products in the EU in 2017 and % variation
2017/2016 (out-of-home consumption is
excluded) Source: EUROSTAT (Purchasing Power Parities
– PPPs – per capita nominal expenditure)
Chart 15
Per capita consumption (including out-of-home)
of fishery and aquaculture products (kg capita/year) per Member State,
2016 and % variation 2016/2015 (Live weight equivalent)
Source: EUMOFA based on elaboration of EUROSTAT, national sources, FEAP and FAO
data
E U R O P E A N M A R K E T O B S E R V A T O R Y F O R F I S H E R I E S A N D A Q U A C U L T U R E P R O D U C T S - T H E E U F I S H M A R K E T - E D I T I O N 2 0 1 8
Consumption
31
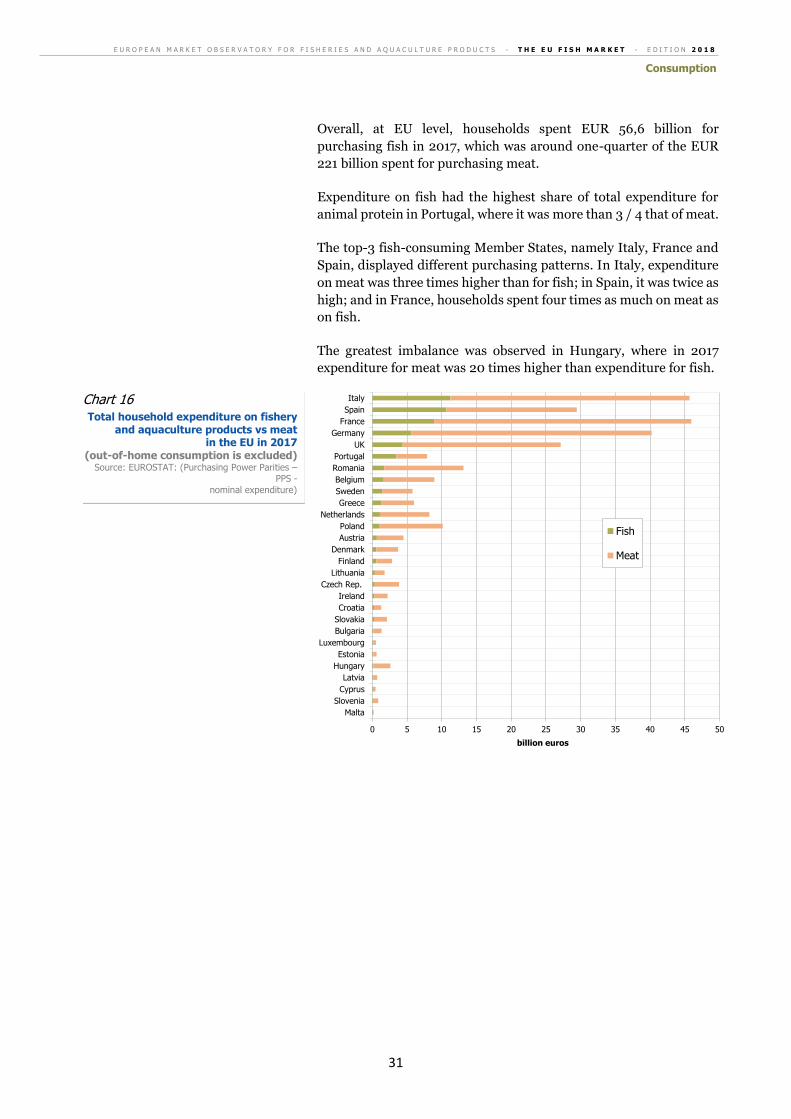
Overall, at EU level, households spent EUR 56,6 billion for
purchasing fish in 2017, which was around one-quarter of the EUR
221 billion spent for purchasing meat.
Expenditure on fish had the highest share of total expenditure for
animal protein in Portugal, where it was more than 3 / 4 that of meat.
The top-3 fish-consuming Member States, namely Italy, France and
Spain, displayed different purchasing patterns. In Italy, expenditure
on meat was three times higher than for fish; in Spain, it was twice as
high; and in France, households spent four times as much on meat as
on fish.
The greatest imbalance was observed in Hungary, where in 2017
expenditure for meat was 20 times higher than expenditure for fish.
0 5 10 15 20 25 30 35 40 45 50
Malta
Slovenia
Cyprus
Latvia
Hungary
Estonia
Luxembourg
Bulgaria
Slovakia
Croatia
Ireland
Czech Rep.
Lithuania
Finland
Denmark
Austria
Poland
Netherlands
Greece
Sweden
Belgium
Romania
Portugal
UK
Germany
France
Spain
Italy
billion euros
Fish
Meat
Chart 16
Total household expenditure on fishery and aquaculture products vs meat
in the EU in 2017 (out-of-home consumption is excluded)
Source: EUROSTAT: (Purchasing Power Parities – PPS -
nominal expenditure)
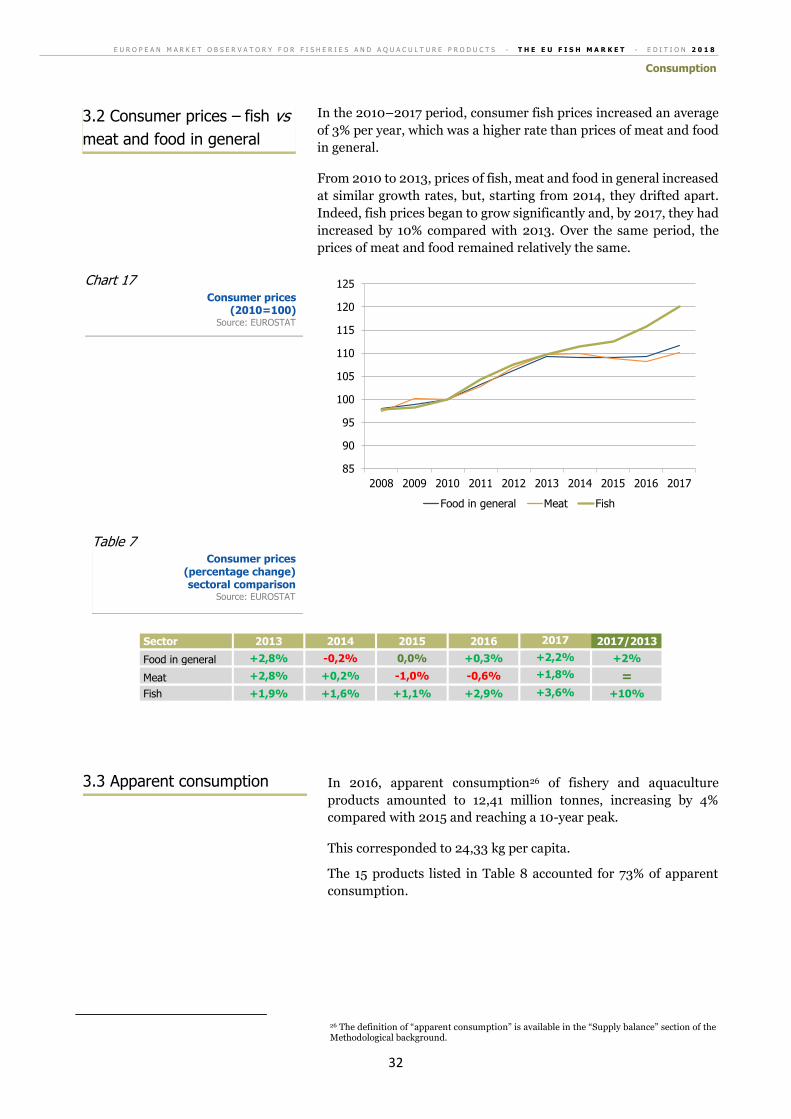
E U R O P E A N M A R K E T O B S E R V A T O R Y F O R F I S H E R I E S A N D A Q U A C U L T U R E P R O D U C T S - T H E E U F I S H M A R K E T - E D I T I O N 2 0 1 8
Consumption
32
In the 2010–2017 period, consumer fish prices increased an average
of 3% per year, which was a higher rate than prices of meat and food
in general.
From 2010 to 2013, prices of fish, meat and food in general increased
at similar growth rates, but, starting from 2014, they drifted apart.
Indeed, fish prices began to grow significantly and, by 2017, they had
increased by 10% compared with 2013. Over the same period, the
prices of meat and food remained relatively the same.
Sector 2013 2014 2015 2016 2017 2017/2013
Food in general +2,8% -0,2% 0,0% +0,3% +2,2% +2%
Meat +2,8% +0,2% -1,0% -0,6% +1,8% =
Fish +1,9% +1,6% +1,1% +2,9% +3,6% +10%
In 2016, apparent consumption26 of fishery and aquaculture
products amounted to 12,41 million tonnes, increasing by 4%
compared with 2015 and reaching a 10-year peak.
This corresponded to 24,33 kg per capita.
The 15 products listed in Table 8 accounted for 73% of apparent
consumption.
26 The definition of “apparent consumption” is available in the “Supply balance” section of the Methodological background.
85
90
95
100
105
110
115
120
125
2008 2009 2010 2011 2012 2013 2014 2015 2016 2017
Food in general Meat Fish
Chart 17 Consumer prices
(2010=100) Source: EUROSTAT
3.2 Consumer prices – fish vs
meat and food in general
Table 7 Consumer prices
(percentage change) sectoral comparison
Source: EUROSTAT
3.3 Apparent consumption
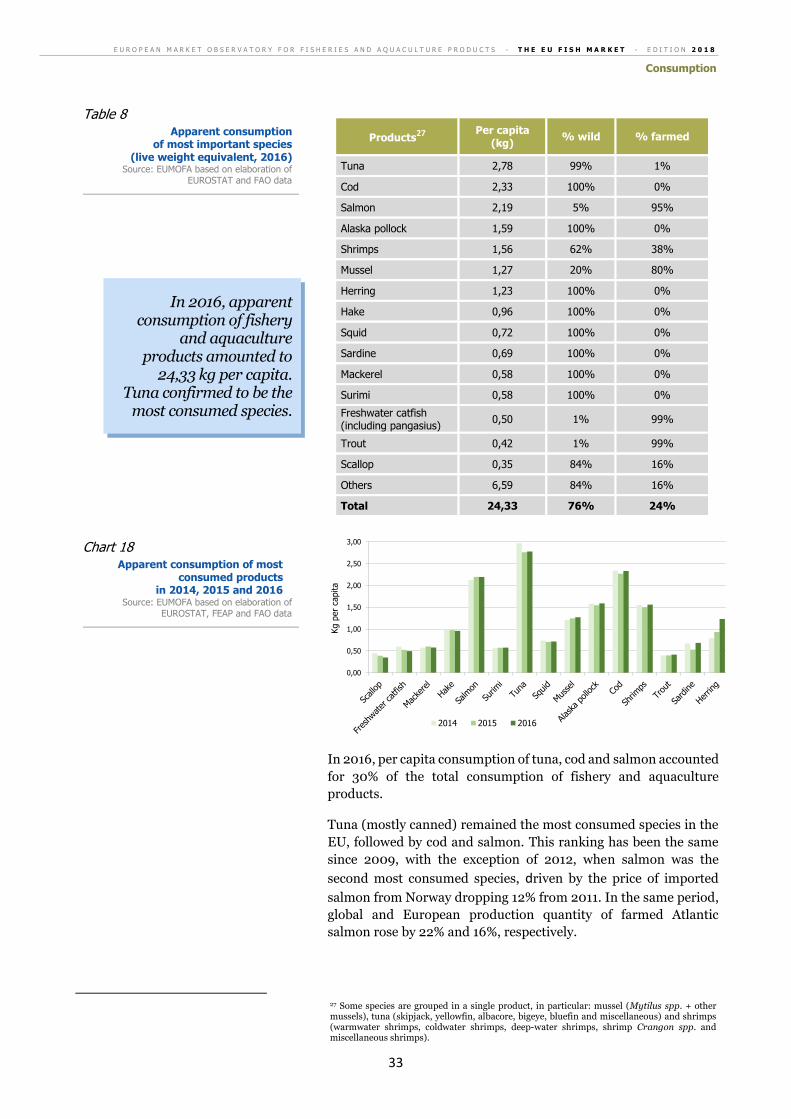
E U R O P E A N M A R K E T O B S E R V A T O R Y F O R F I S H E R I E S A N D A Q U A C U L T U R E P R O D U C T S - T H E E U F I S H M A R K E T - E D I T I O N 2 0 1 8
Consumption
33
Products27
Per capita
(kg) % wild % farmed
Tuna 2,78 99% 1%
Cod 2,33 100% 0%
Salmon 2,19 5% 95%
Alaska pollock 1,59 100% 0%
Shrimps 1,56 62% 38%
Mussel 1,27 20% 80%
Herring 1,23 100% 0%
Hake 0,96 100% 0%
Squid 0,72 100% 0%
Sardine 0,69 100% 0%
Mackerel 0,58 100% 0%
Surimi 0,58 100% 0%
Freshwater catfish (including pangasius)
0,50 1% 99%
Trout 0,42 1% 99%
Scallop 0,35 84% 16%
Others 6,59 84% 16%
Total 24,33 76% 24%
In 2016, per capita consumption of tuna, cod and salmon accounted
for 30% of the total consumption of fishery and aquaculture
products.
Tuna (mostly canned) remained the most consumed species in the
EU, followed by cod and salmon. This ranking has been the same
since 2009, with the exception of 2012, when salmon was the
second most consumed species, driven by the price of imported
salmon from Norway dropping 12% from 2011. In the same period,
global and European production quantity of farmed Atlantic
salmon rose by 22% and 16%, respectively.
27 Some species are grouped in a single product, in particular: mussel (Mytilus spp. + other mussels), tuna (skipjack, yellowfin, albacore, bigeye, bluefin and miscellaneous) and shrimps (warmwater shrimps, coldwater shrimps, deep-water shrimps, shrimp Crangon spp. and miscellaneous shrimps).
0,00
0,50
1,00
1,50
2,00
2,50
3,00
Kg p
er
capita
2014 2015 2016
In 2016, apparent consumption of fishery
and aquaculture products amounted to
24,33 kg per capita. Tuna confirmed to be the
most consumed species.
Table 8 Apparent consumption
of most important species (live weight equivalent, 2016)
Source: EUMOFA based on elaboration of EUROSTAT and FAO data
Chart 18 Apparent consumption of most
consumed products in 2014, 2015 and 2016
Source: EUMOFA based on elaboration of EUROSTAT, FEAP and FAO data
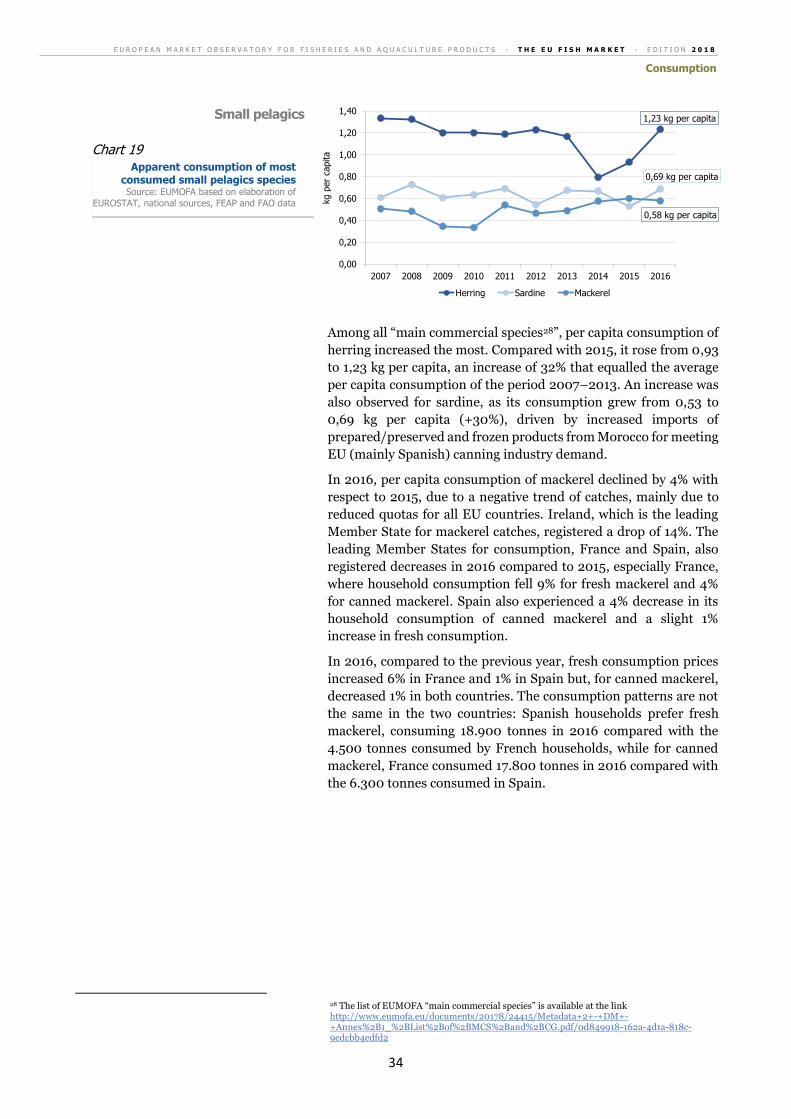
E U R O P E A N M A R K E T O B S E R V A T O R Y F O R F I S H E R I E S A N D A Q U A C U L T U R E P R O D U C T S - T H E E U F I S H M A R K E T - E D I T I O N 2 0 1 8
Consumption
34
Among all “main commercial species28”, per capita consumption of
herring increased the most. Compared with 2015, it rose from 0,93
to 1,23 kg per capita, an increase of 32% that equalled the average
per capita consumption of the period 2007–2013. An increase was
also observed for sardine, as its consumption grew from 0,53 to
0,69 kg per capita (+30%), driven by increased imports of
prepared/preserved and frozen products from Morocco for meeting
EU (mainly Spanish) canning industry demand.
In 2016, per capita consumption of mackerel declined by 4% with
respect to 2015, due to a negative trend of catches, mainly due to
reduced quotas for all EU countries. Ireland, which is the leading
Member State for mackerel catches, registered a drop of 14%. The
leading Member States for consumption, France and Spain, also
registered decreases in 2016 compared to 2015, especially France,
where household consumption fell 9% for fresh mackerel and 4%
for canned mackerel. Spain also experienced a 4% decrease in its
household consumption of canned mackerel and a slight 1%
increase in fresh consumption.
In 2016, compared to the previous year, fresh consumption prices
increased 6% in France and 1% in Spain but, for canned mackerel,
decreased 1% in both countries. The consumption patterns are not
the same in the two countries: Spanish households prefer fresh
mackerel, consuming 18.900 tonnes in 2016 compared with the
4.500 tonnes consumed by French households, while for canned
mackerel, France consumed 17.800 tonnes in 2016 compared with
the 6.300 tonnes consumed in Spain.
28 The list of EUMOFA “main commercial species” is available at the link http://www.eumofa.eu/documents/20178/24415/Metadata+2+-+DM+-+Annex%2B1_%2BList%2Bof%2BMCS%2Band%2BCG.pdf/0d849918-162a-4d1a-818c-9edcbb4edfd2
1,23 kg per capita
0,69 kg per capita
0,58 kg per capita
0,00
0,20
0,40
0,60
0,80
1,00
1,20
1,40
2007 2008 2009 2010 2011 2012 2013 2014 2015 2016
kg p
er
capita
Herring Sardine Mackerel
Chart 19 Apparent consumption of most
consumed small pelagics species Source: EUMOFA based on elaboration of
EUROSTAT, national sources, FEAP and FAO data
Small pelagics
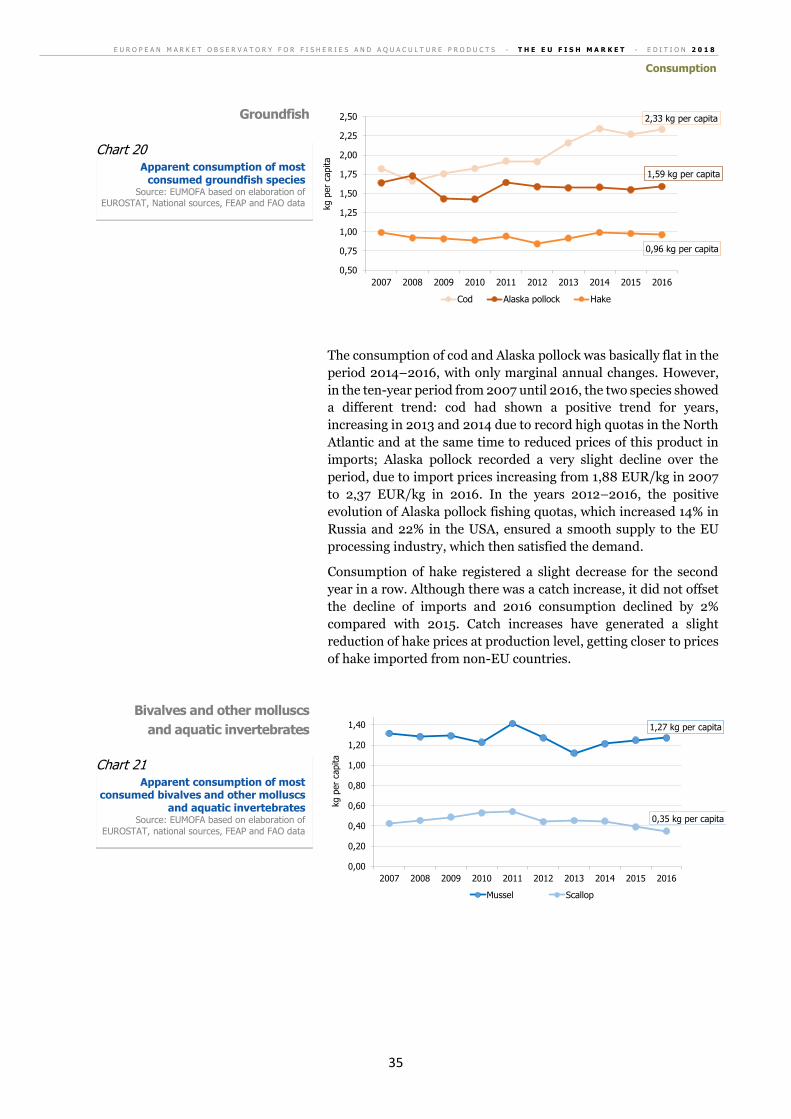
E U R O P E A N M A R K E T O B S E R V A T O R Y F O R F I S H E R I E S A N D A Q U A C U L T U R E P R O D U C T S - T H E E U F I S H M A R K E T - E D I T I O N 2 0 1 8
Consumption
35
The consumption of cod and Alaska pollock was basically flat in the
period 2014–2016, with only marginal annual changes. However,
in the ten-year period from 2007 until 2016, the two species showed
a different trend: cod had shown a positive trend for years,
increasing in 2013 and 2014 due to record high quotas in the North
Atlantic and at the same time to reduced prices of this product in
imports; Alaska pollock recorded a very slight decline over the
period, due to import prices increasing from 1,88 EUR/kg in 2007
to 2,37 EUR/kg in 2016. In the years 2012–2016, the positive
evolution of Alaska pollock fishing quotas, which increased 14% in
Russia and 22% in the USA, ensured a smooth supply to the EU
processing industry, which then satisfied the demand.
Consumption of hake registered a slight decrease for the second
year in a row. Although there was a catch increase, it did not offset
the decline of imports and 2016 consumption declined by 2%
compared with 2015. Catch increases have generated a slight
reduction of hake prices at production level, getting closer to prices
of hake imported from non-EU countries.
2,33 kg per capita
1,59 kg per capita
0,96 kg per capita
0,50
0,75
1,00
1,25
1,50
1,75
2,00
2,25
2,50
2007 2008 2009 2010 2011 2012 2013 2014 2015 2016
kg p
er
capita
Cod Alaska pollock Hake
1,27 kg per capita
0,35 kg per capita
0,00
0,20
0,40
0,60
0,80
1,00
1,20
1,40
2007 2008 2009 2010 2011 2012 2013 2014 2015 2016
kg p
er
capita
Mussel Scallop
Chart 20 Apparent consumption of most
consumed groundfish species Source: EUMOFA based on elaboration of
EUROSTAT, National sources, FEAP and FAO data
Groundfish
Chart 21 Apparent consumption of most
consumed bivalves and other molluscs and aquatic invertebrates
Source: EUMOFA based on elaboration of
EUROSTAT, national sources, FEAP and FAO data
Bivalves and other molluscs
and aquatic invertebrates
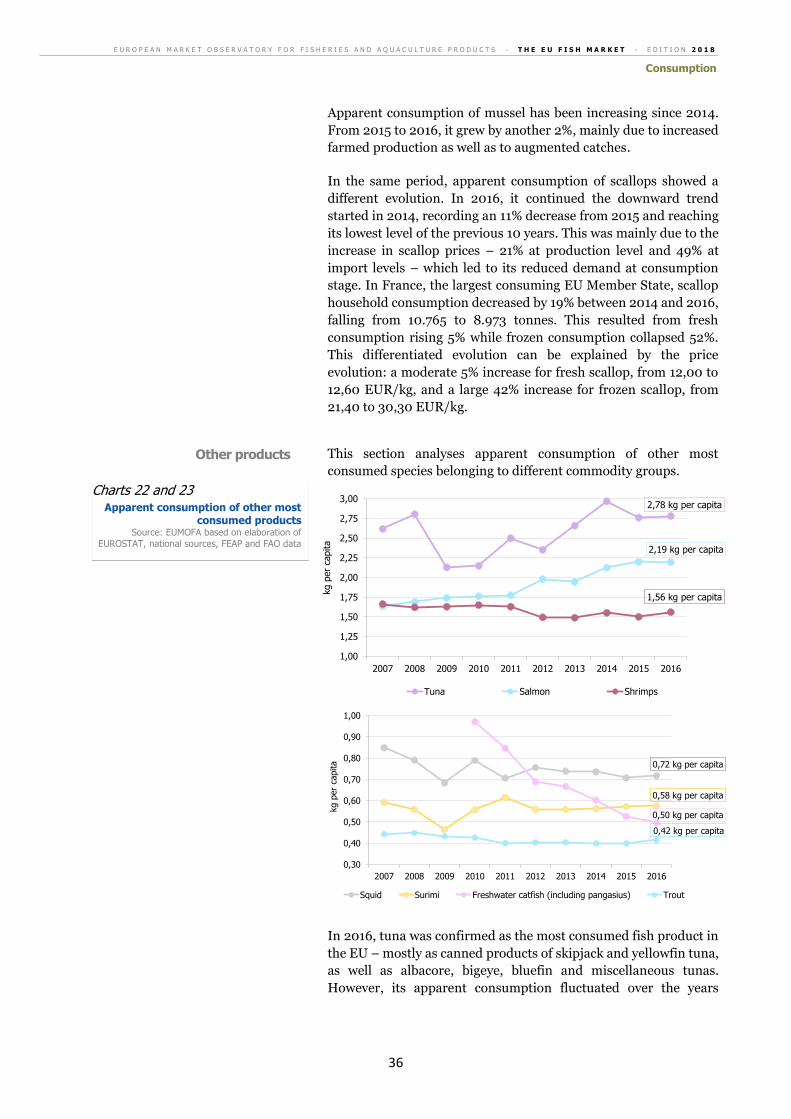
E U R O P E A N M A R K E T O B S E R V A T O R Y F O R F I S H E R I E S A N D A Q U A C U L T U R E P R O D U C T S - T H E E U F I S H M A R K E T - E D I T I O N 2 0 1 8
Consumption
36
Apparent consumption of mussel has been increasing since 2014.
From 2015 to 2016, it grew by another 2%, mainly due to increased
farmed production as well as to augmented catches.
In the same period, apparent consumption of scallops showed a
different evolution. In 2016, it continued the downward trend
started in 2014, recording an 11% decrease from 2015 and reaching
its lowest level of the previous 10 years. This was mainly due to the
increase in scallop prices – 21% at production level and 49% at
import levels – which led to its reduced demand at consumption
stage. In France, the largest consuming EU Member State, scallop
household consumption decreased by 19% between 2014 and 2016,
falling from 10.765 to 8.973 tonnes. This resulted from fresh
consumption rising 5% while frozen consumption collapsed 52%.
This differentiated evolution can be explained by the price
evolution: a moderate 5% increase for fresh scallop, from 12,00 to
12,60 EUR/kg, and a large 42% increase for frozen scallop, from
21,40 to 30,30 EUR/kg.
This section analyses apparent consumption of other most
consumed species belonging to different commodity groups.
In 2016, tuna was confirmed as the most consumed fish product in
the EU – mostly as canned products of skipjack and yellowfin tuna,
as well as albacore, bigeye, bluefin and miscellaneous tunas.
However, its apparent consumption fluctuated over the years
2,78 kg per capita
2,19 kg per capita
1,56 kg per capita
1,00
1,25
1,50
1,75
2,00
2,25
2,50
2,75
3,00
2007 2008 2009 2010 2011 2012 2013 2014 2015 2016
kg p
er
capita
Tuna Salmon Shrimps
0,72 kg per capita
0,58 kg per capita
0,50 kg per capita
0,42 kg per capita
0,30
0,40
0,50
0,60
0,70
0,80
0,90
1,00
2007 2008 2009 2010 2011 2012 2013 2014 2015 2016
kg p
er
capita
Squid Surimi Freshwater catfish (including pangasius) Trout
Charts 22 and 23 Apparent consumption of other most
consumed products Source: EUMOFA based on elaboration of
EUROSTAT, national sources, FEAP and FAO data
Other products
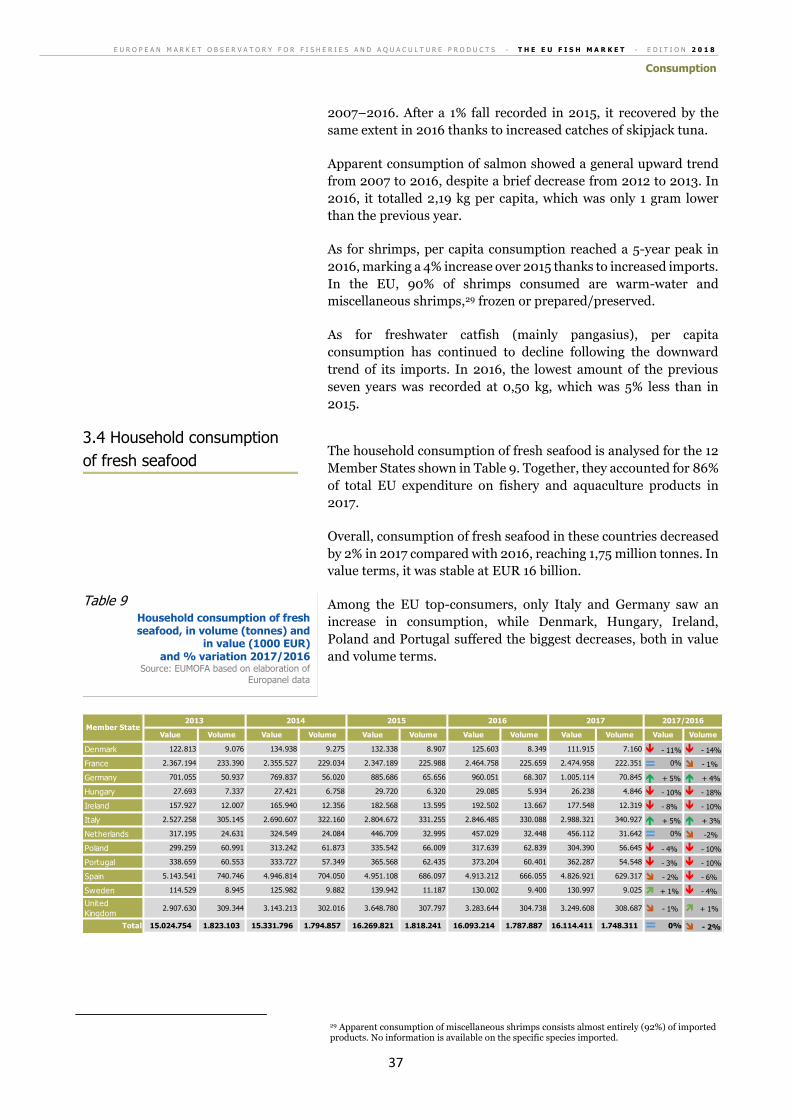
E U R O P E A N M A R K E T O B S E R V A T O R Y F O R F I S H E R I E S A N D A Q U A C U L T U R E P R O D U C T S - T H E E U F I S H M A R K E T - E D I T I O N 2 0 1 8
Consumption
37
2007–2016. After a 1% fall recorded in 2015, it recovered by the
same extent in 2016 thanks to increased catches of skipjack tuna.
Apparent consumption of salmon showed a general upward trend
from 2007 to 2016, despite a brief decrease from 2012 to 2013. In
2016, it totalled 2,19 kg per capita, which was only 1 gram lower
than the previous year.
As for shrimps, per capita consumption reached a 5-year peak in
2016, marking a 4% increase over 2015 thanks to increased imports.
In the EU, 90% of shrimps consumed are warm-water and
miscellaneous shrimps,29 frozen or prepared/preserved.
As for freshwater catfish (mainly pangasius), per capita
consumption has continued to decline following the downward
trend of its imports. In 2016, the lowest amount of the previous
seven years was recorded at 0,50 kg, which was 5% less than in
2015.
The household consumption of fresh seafood is analysed for the 12
Member States shown in Table 9. Together, they accounted for 86%
of total EU expenditure on fishery and aquaculture products in
2017.
Overall, consumption of fresh seafood in these countries decreased
by 2% in 2017 compared with 2016, reaching 1,75 million tonnes. In
value terms, it was stable at EUR 16 billion.
Among the EU top-consumers, only Italy and Germany saw an
increase in consumption, while Denmark, Hungary, Ireland,
Poland and Portugal suffered the biggest decreases, both in value
and volume terms.
29 Apparent consumption of miscellaneous shrimps consists almost entirely (92%) of imported products. No information is available on the specific species imported.
Value Volume Value Volume Value Volume Value Volume Value Volume Value Volume
Denmark 122.813 9.076 134.938 9.275 132.338 8.907 125.603 8.349 111.915 7.160 - 11% - 14%
France 2.367.194 233.390 2.355.527 229.034 2.347.189 225.988 2.464.758 225.659 2.474.958 222.351 0% - 1%
Germany 701.055 50.937 769.837 56.020 885.686 65.656 960.051 68.307 1.005.114 70.845 + 5% + 4%
Hungary 27.693 7.337 27.421 6.758 29.720 6.320 29.085 5.934 26.238 4.846 - 10% - 18%
Ireland 157.927 12.007 165.940 12.356 182.568 13.595 192.502 13.667 177.548 12.319 - 8% - 10%
Italy 2.527.258 305.145 2.690.607 322.160 2.804.672 331.255 2.846.485 330.088 2.988.321 340.927 + 5% + 3%
Netherlands 317.195 24.631 324.549 24.084 446.709 32.995 457.029 32.448 456.112 31.642 0% -2%
Poland 299.259 60.991 313.242 61.873 335.542 66.009 317.639 62.839 304.390 56.645 - 4% - 10%
Portugal 338.659 60.553 333.727 57.349 365.568 62.435 373.204 60.401 362.287 54.548 - 3% - 10%
Spain 5.143.541 740.746 4.946.814 704.050 4.951.108 686.097 4.913.212 666.055 4.826.921 629.317 - 2% - 6%
Sweden 114.529 8.945 125.982 9.882 139.942 11.187 130.002 9.400 130.997 9.025 + 1% - 4%
United
Kingdom2.907.630 309.344 3.143.213 302.016 3.648.780 307.797 3.283.644 304.738 3.249.608 308.687 - 1% + 1%
Total 15.024.754 1.823.103 15.331.796 1.794.857 16.269.821 1.818.241 16.093.214 1.787.887 16.114.411 1.748.311 0% - 2%
2017 2017/2016Member State
2013 2014 2015 2016
Table 9 Household consumption of fresh seafood, in volume (tonnes) and
in value (1000 EUR) and % variation 2017/2016
Source: EUMOFA based on elaboration of
Europanel data
3.4 Household consumption
of fresh seafood
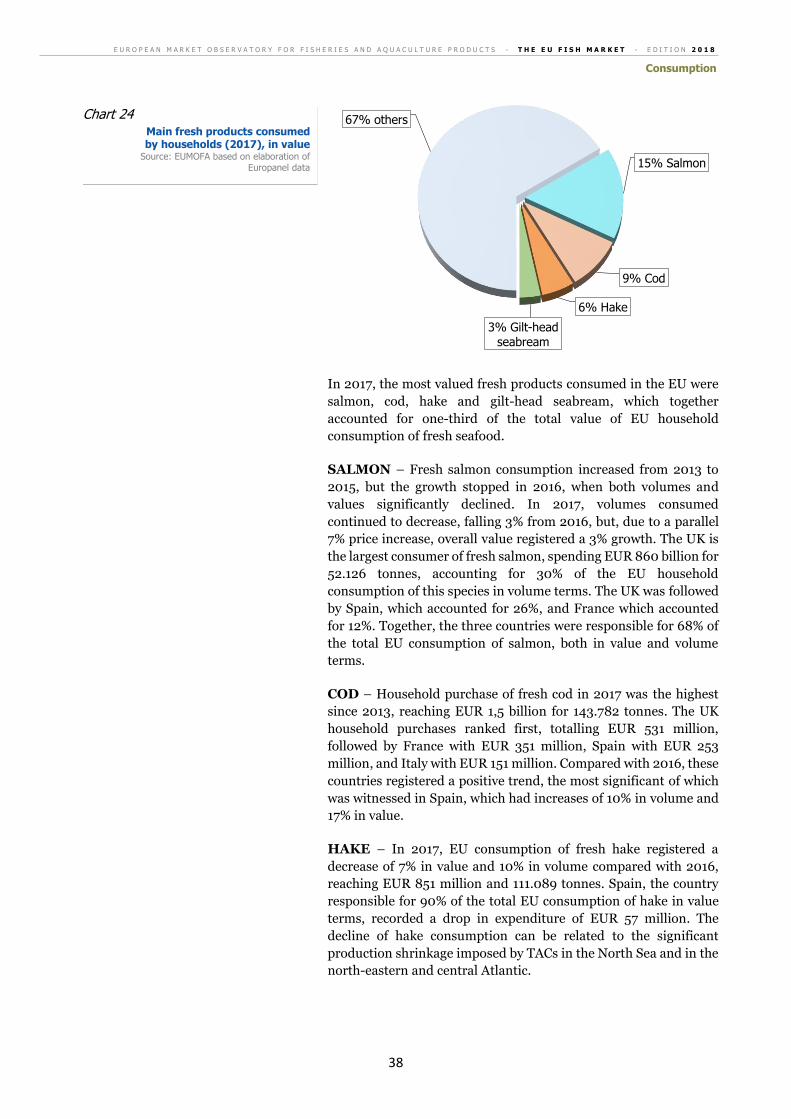
E U R O P E A N M A R K E T O B S E R V A T O R Y F O R F I S H E R I E S A N D A Q U A C U L T U R E P R O D U C T S - T H E E U F I S H M A R K E T - E D I T I O N 2 0 1 8
Consumption
38
In 2017, the most valued fresh products consumed in the EU were
salmon, cod, hake and gilt-head seabream, which together
accounted for one-third of the total value of EU household
consumption of fresh seafood.
SALMON – Fresh salmon consumption increased from 2013 to
2015, but the growth stopped in 2016, when both volumes and
values significantly declined. In 2017, volumes consumed
continued to decrease, falling 3% from 2016, but, due to a parallel
7% price increase, overall value registered a 3% growth. The UK is
the largest consumer of fresh salmon, spending EUR 860 billion for
52.126 tonnes, accounting for 30% of the EU household
consumption of this species in volume terms. The UK was followed
by Spain, which accounted for 26%, and France which accounted
for 12%. Together, the three countries were responsible for 68% of
the total EU consumption of salmon, both in value and volume
terms.
COD – Household purchase of fresh cod in 2017 was the highest
since 2013, reaching EUR 1,5 billion for 143.782 tonnes. The UK
household purchases ranked first, totalling EUR 531 million,
followed by France with EUR 351 million, Spain with EUR 253
million, and Italy with EUR 151 million. Compared with 2016, these
countries registered a positive trend, the most significant of which
was witnessed in Spain, which had increases of 10% in volume and
17% in value.
HAKE – In 2017, EU consumption of fresh hake registered a
decrease of 7% in value and 10% in volume compared with 2016,
reaching EUR 851 million and 111.089 tonnes. Spain, the country
responsible for 90% of the total EU consumption of hake in value
terms, recorded a drop in expenditure of EUR 57 million. The
decline of hake consumption can be related to the significant
production shrinkage imposed by TACs in the North Sea and in the
north-eastern and central Atlantic.
67% others
15% Salmon
9% Cod
6% Hake
3% Gilt-head seabream
Chart 24 Main fresh products consumed by households (2017), in value
Source: EUMOFA based on elaboration of Europanel data
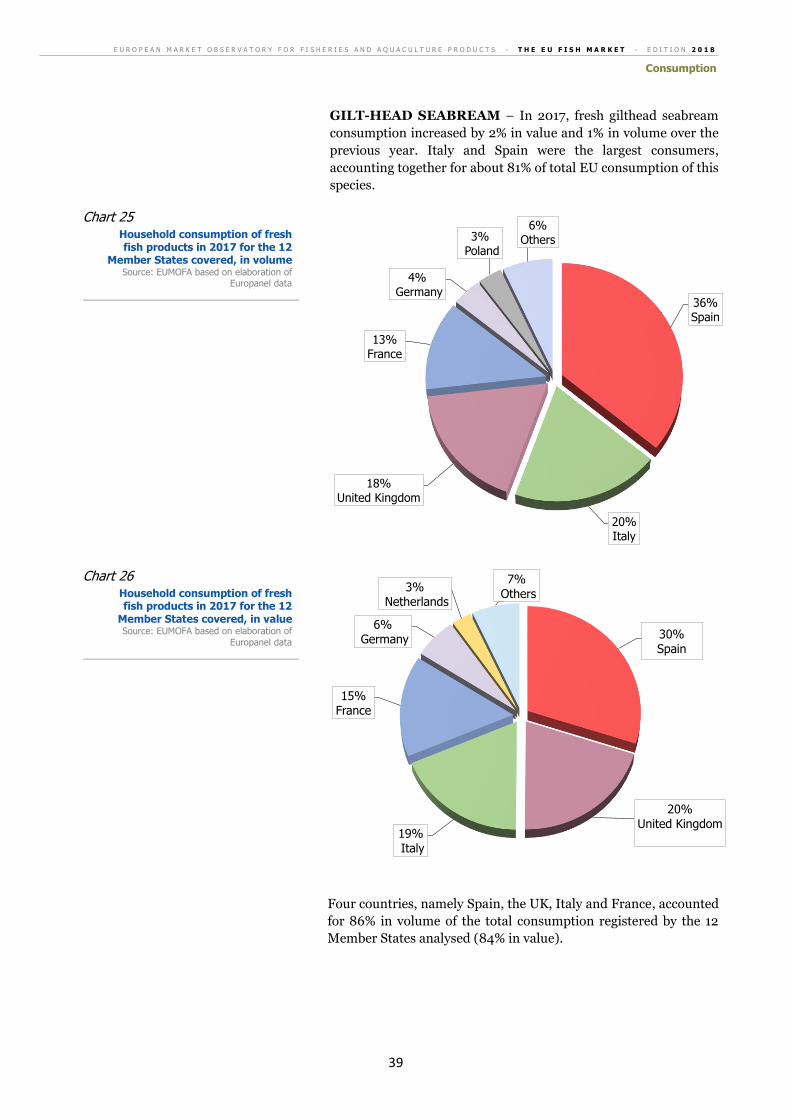
E U R O P E A N M A R K E T O B S E R V A T O R Y F O R F I S H E R I E S A N D A Q U A C U L T U R E P R O D U C T S - T H E E U F I S H M A R K E T - E D I T I O N 2 0 1 8
Consumption
39
GILT-HEAD SEABREAM – In 2017, fresh gilthead seabream
consumption increased by 2% in value and 1% in volume over the
previous year. Italy and Spain were the largest consumers,
accounting together for about 81% of total EU consumption of this
species.
Four countries, namely Spain, the UK, Italy and France, accounted
for 86% in volume of the total consumption registered by the 12
Member States analysed (84% in value).
36%Spain
20%Italy
18%United Kingdom
13% France
4%Germany
3%Poland
6%Others
30%Spain
20%United Kingdom
19%Italy
15% France
6%Germany
3%Netherlands
7%Others
Chart 25 Household consumption of fresh fish products in 2017 for the 12
Member States covered, in volume Source: EUMOFA based on elaboration of
Europanel data
Chart 26 Household consumption of fresh fish products in 2017 for the 12
Member States covered, in value Source: EUMOFA based on elaboration of
Europanel data
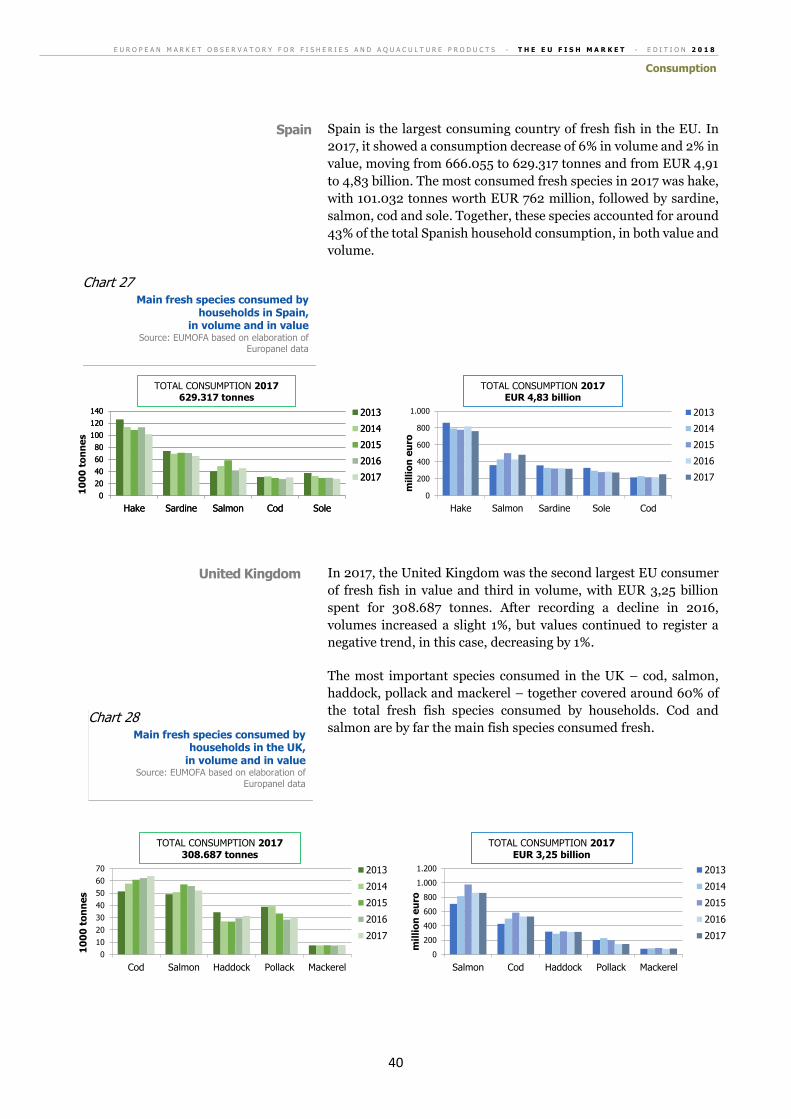
E U R O P E A N M A R K E T O B S E R V A T O R Y F O R F I S H E R I E S A N D A Q U A C U L T U R E P R O D U C T S - T H E E U F I S H M A R K E T - E D I T I O N 2 0 1 8
Consumption
40
Spain is the largest consuming country of fresh fish in the EU. In
2017, it showed a consumption decrease of 6% in volume and 2% in
value, moving from 666.055 to 629.317 tonnes and from EUR 4,91
to 4,83 billion. The most consumed fresh species in 2017 was hake,
with 101.032 tonnes worth EUR 762 million, followed by sardine,
salmon, cod and sole. Together, these species accounted for around
43% of the total Spanish household consumption, in both value and
volume.
In 2017, the United Kingdom was the second largest EU consumer
of fresh fish in value and third in volume, with EUR 3,25 billion
spent for 308.687 tonnes. After recording a decline in 2016,
volumes increased a slight 1%, but values continued to register a
negative trend, in this case, decreasing by 1%.
The most important species consumed in the UK – cod, salmon,
haddock, pollack and mackerel – together covered around 60% of
the total fresh fish species consumed by households. Cod and
salmon are by far the main fish species consumed fresh.
0
20
40
60
80
100
120
140
Hake Sardine Salmon Cod Sole
10
00
to
nn
es
2013
2014
2015
2016
2017
TOTAL CONSUMPTION 2017629.317 tonnes
0
200
400
600
800
1.000
Hake Salmon Sardine Sole Cod
mil
lio
n e
uro
2013
2014
2015
2016
2017
TOTAL CONSUMPTION 2017EUR 4,83 billion
0
20
40
60
80
100
120
140
Hake Sardine Salmon Cod Sole
2013
2014
2015
2016
2017
0
10
20
30
40
50
60
70
Cod Salmon Haddock Pollack Mackerel
10
00
to
nn
es
2013
2014
2015
2016
2017
TOTAL CONSUMPTION 2017308.687 tonnes
0
200
400
600
800
1.000
1.200
Salmon Cod Haddock Pollack Mackerel
mil
lio
n e
uro
2013
2014
2015
2016
2017
TOTAL CONSUMPTION 2017EUR 3,25 billion
Spain
Chart 27 Main fresh species consumed by
households in Spain, in volume and in value
Source: EUMOFA based on elaboration of Europanel data
Chart 28 Main fresh species consumed by
households in the UK, in volume and in value
Source: EUMOFA based on elaboration of
Europanel data
United Kingdom
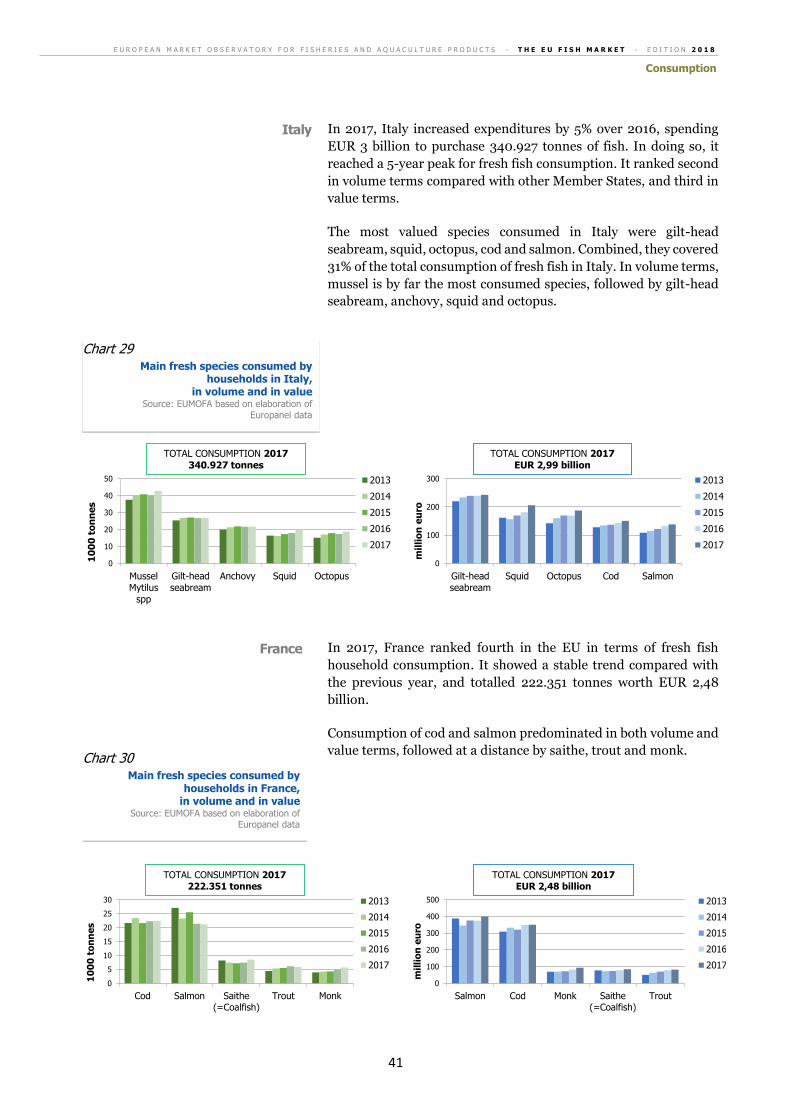
E U R O P E A N M A R K E T O B S E R V A T O R Y F O R F I S H E R I E S A N D A Q U A C U L T U R E P R O D U C T S - T H E E U F I S H M A R K E T - E D I T I O N 2 0 1 8
Consumption
41
In 2017, Italy increased expenditures by 5% over 2016, spending
EUR 3 billion to purchase 340.927 tonnes of fish. In doing so, it
reached a 5-year peak for fresh fish consumption. It ranked second
in volume terms compared with other Member States, and third in
value terms.
The most valued species consumed in Italy were gilt-head
seabream, squid, octopus, cod and salmon. Combined, they covered
31% of the total consumption of fresh fish in Italy. In volume terms,
mussel is by far the most consumed species, followed by gilt-head
seabream, anchovy, squid and octopus.
In 2017, France ranked fourth in the EU in terms of fresh fish
household consumption. It showed a stable trend compared with
the previous year, and totalled 222.351 tonnes worth EUR 2,48
billion.
Consumption of cod and salmon predominated in both volume and
value terms, followed at a distance by saithe, trout and monk.
0
10
20
30
40
50
MusselMytilus
spp
Gilt-headseabream
Anchovy Squid Octopus
10
00
to
nn
es
2013
2014
2015
2016
2017
TOTAL CONSUMPTION 2017340.927 tonnes
0
100
200
300
Gilt-headseabream
Squid Octopus Cod Salmon
mil
lio
n e
uro
2013
2014
2015
2016
2017
TOTAL CONSUMPTION 2017EUR 2,99 billion
0
5
10
15
20
25
30
Cod Salmon Saithe(=Coalfish)
Trout Monk
10
00
to
nn
es
2013
2014
2015
2016
2017
TOTAL CONSUMPTION 2017222.351 tonnes
0
100
200
300
400
500
Salmon Cod Monk Saithe(=Coalfish)
Trout
mil
lio
n e
uro
2013
2014
2015
2016
2017
TOTAL CONSUMPTION 2017EUR 2,48 billion
Italy
Chart 29 Main fresh species consumed by
households in Italy, in volume and in value
Source: EUMOFA based on elaboration of Europanel data
Chart 30 Main fresh species consumed by
households in France, in volume and in value
Source: EUMOFA based on elaboration of Europanel data
France
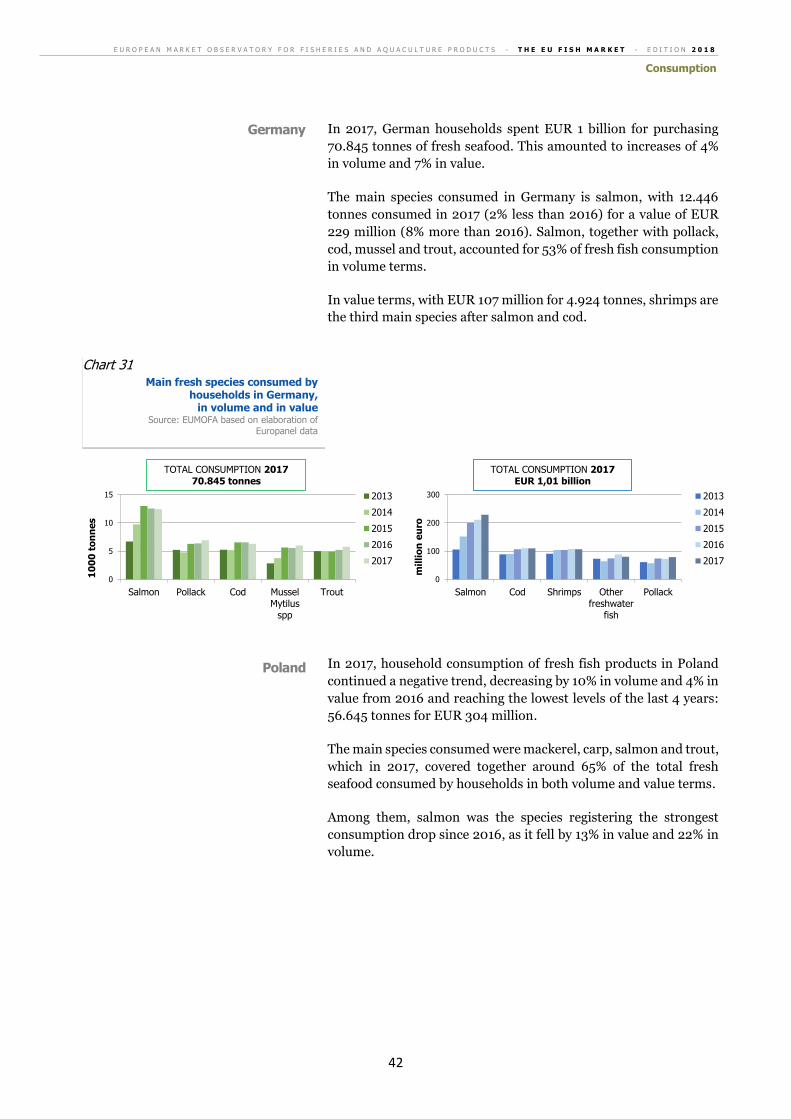
E U R O P E A N M A R K E T O B S E R V A T O R Y F O R F I S H E R I E S A N D A Q U A C U L T U R E P R O D U C T S - T H E E U F I S H M A R K E T - E D I T I O N 2 0 1 8
Consumption
42
In 2017, German households spent EUR 1 billion for purchasing
70.845 tonnes of fresh seafood. This amounted to increases of 4%
in volume and 7% in value.
The main species consumed in Germany is salmon, with 12.446
tonnes consumed in 2017 (2% less than 2016) for a value of EUR
229 million (8% more than 2016). Salmon, together with pollack,
cod, mussel and trout, accounted for 53% of fresh fish consumption
in volume terms.
In value terms, with EUR 107 million for 4.924 tonnes, shrimps are
the third main species after salmon and cod.
In 2017, household consumption of fresh fish products in Poland
continued a negative trend, decreasing by 10% in volume and 4% in
value from 2016 and reaching the lowest levels of the last 4 years:
56.645 tonnes for EUR 304 million.
The main species consumed were mackerel, carp, salmon and trout,
which in 2017, covered together around 65% of the total fresh
seafood consumed by households in both volume and value terms.
Among them, salmon was the species registering the strongest
consumption drop since 2016, as it fell by 13% in value and 22% in
volume.
0
5
10
15
Salmon Pollack Cod MusselMytilus
spp
Trout
10
00
to
nn
es
2013
2014
2015
2016
2017
TOTAL CONSUMPTION 201770.845 tonnes
0
100
200
300
Salmon Cod Shrimps Otherfreshwater
fish
Pollack
mil
lio
n e
uro
2013
2014
2015
2016
2017
TOTAL CONSUMPTION 2017EUR 1,01 billion
Germany
Chart 31 Main fresh species consumed by
households in Germany, in volume and in value
Source: EUMOFA based on elaboration of Europanel data
Poland
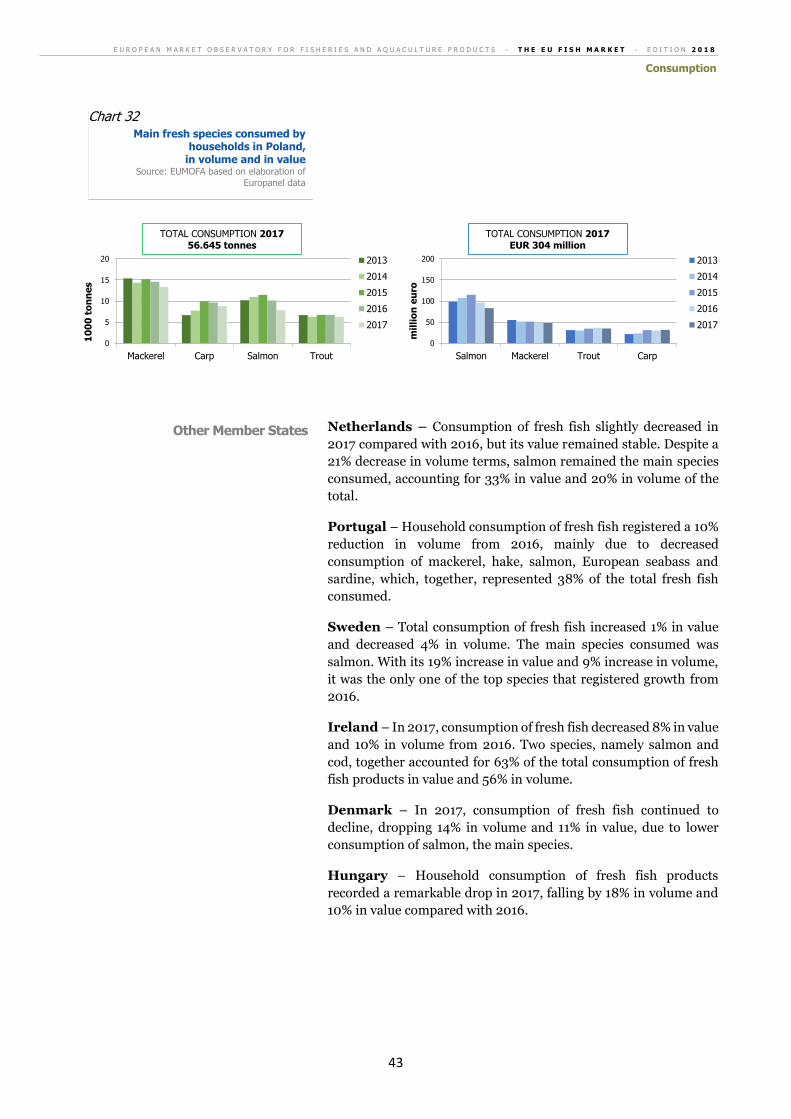
E U R O P E A N M A R K E T O B S E R V A T O R Y F O R F I S H E R I E S A N D A Q U A C U L T U R E P R O D U C T S - T H E E U F I S H M A R K E T - E D I T I O N 2 0 1 8
Consumption
43
Netherlands – Consumption of fresh fish slightly decreased in
2017 compared with 2016, but its value remained stable. Despite a
21% decrease in volume terms, salmon remained the main species
consumed, accounting for 33% in value and 20% in volume of the
total.
Portugal – Household consumption of fresh fish registered a 10%
reduction in volume from 2016, mainly due to decreased
consumption of mackerel, hake, salmon, European seabass and
sardine, which, together, represented 38% of the total fresh fish
consumed.
Sweden – Total consumption of fresh fish increased 1% in value
and decreased 4% in volume. The main species consumed was
salmon. With its 19% increase in value and 9% increase in volume,
it was the only one of the top species that registered growth from
2016.
Ireland – In 2017, consumption of fresh fish decreased 8% in value
and 10% in volume from 2016. Two species, namely salmon and
cod, together accounted for 63% of the total consumption of fresh
fish products in value and 56% in volume.
Denmark – In 2017, consumption of fresh fish continued to
decline, dropping 14% in volume and 11% in value, due to lower
consumption of salmon, the main species.
Hungary – Household consumption of fresh fish products
recorded a remarkable drop in 2017, falling by 18% in volume and
10% in value compared with 2016.
0
5
10
15
20
Mackerel Carp Salmon Trout
10
00
to
nn
es
2013
2014
2015
2016
2017
TOTAL CONSUMPTION 201756.645 tonnes
0
50
100
150
200
Salmon Mackerel Trout Carp
mil
lio
n e
uro
2013
2014
2015
2016
2017
TOTAL CONSUMPTION 2017EUR 304 million
Chart 32 Main fresh species consumed by
households in Poland, in volume and in value
Source: EUMOFA based on elaboration of
Europanel data
Other Member States
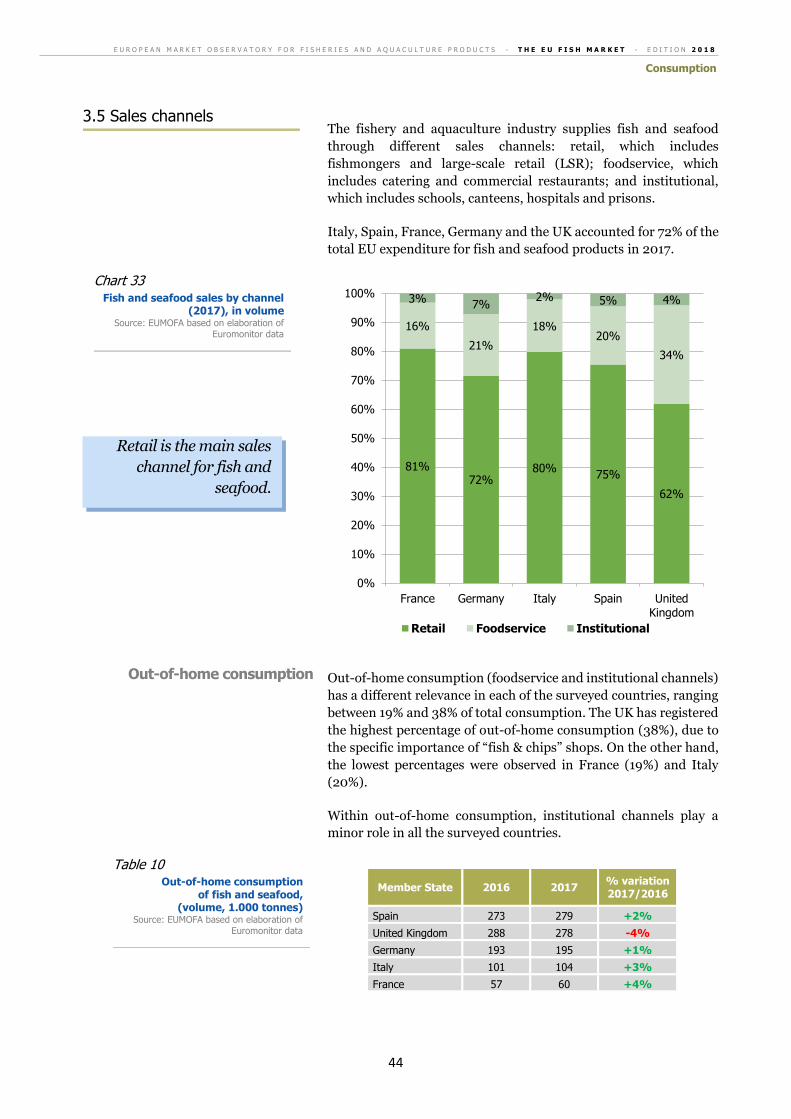
E U R O P E A N M A R K E T O B S E R V A T O R Y F O R F I S H E R I E S A N D A Q U A C U L T U R E P R O D U C T S - T H E E U F I S H M A R K E T - E D I T I O N 2 0 1 8
Consumption
44
The fishery and aquaculture industry supplies fish and seafood
through different sales channels: retail, which includes
fishmongers and large-scale retail (LSR); foodservice, which
includes catering and commercial restaurants; and institutional,
which includes schools, canteens, hospitals and prisons.
Italy, Spain, France, Germany and the UK accounted for 72% of the
total EU expenditure for fish and seafood products in 2017.
Out-of-home consumption (foodservice and institutional channels)
has a different relevance in each of the surveyed countries, ranging
between 19% and 38% of total consumption. The UK has registered
the highest percentage of out-of-home consumption (38%), due to
the specific importance of “fish & chips” shops. On the other hand,
the lowest percentages were observed in France (19%) and Italy
(20%).
Within out-of-home consumption, institutional channels play a
minor role in all the surveyed countries.
Member State 2016 2017 % variation 2017/2016
Spain 273 279 +2%
United Kingdom 288 278 -4%
Germany 193 195 +1%
Italy 101 104 +3%
France 57 60 +4%
81%72%
80%75%
62%
16%
21%
18%20%
34%
3%7%
2% 5% 4%
0%
10%
20%
30%
40%
50%
60%
70%
80%
90%
100%
France Germany Italy Spain UnitedKingdom
Retail Foodservice Institutional
3.5 Sales channels
Retail is the main sales
channel for fish and
seafood.
Chart 33 Fish and seafood sales by channel
(2017), in volume Source: EUMOFA based on elaboration of
Euromonitor data
Out-of-home consumption
Table 10 Out-of-home consumption
of fish and seafood, (volume, 1.000 tonnes)
Source: EUMOFA based on elaboration of Euromonitor data
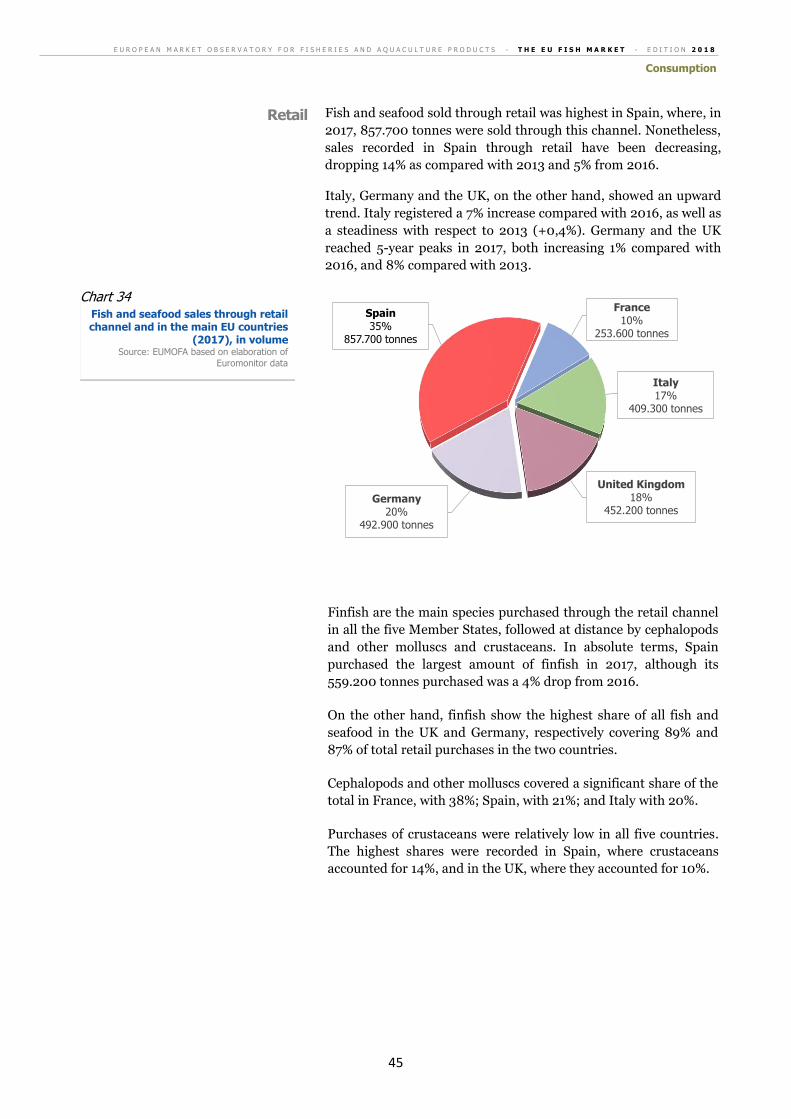
E U R O P E A N M A R K E T O B S E R V A T O R Y F O R F I S H E R I E S A N D A Q U A C U L T U R E P R O D U C T S - T H E E U F I S H M A R K E T - E D I T I O N 2 0 1 8
Consumption
45
Fish and seafood sold through retail was highest in Spain, where, in
2017, 857.700 tonnes were sold through this channel. Nonetheless,
sales recorded in Spain through retail have been decreasing,
dropping 14% as compared with 2013 and 5% from 2016.
Italy, Germany and the UK, on the other hand, showed an upward
trend. Italy registered a 7% increase compared with 2016, as well as
a steadiness with respect to 2013 (+0,4%). Germany and the UK
reached 5-year peaks in 2017, both increasing 1% compared with
2016, and 8% compared with 2013.
Finfish are the main species purchased through the retail channel
in all the five Member States, followed at distance by cephalopods
and other molluscs and crustaceans. In absolute terms, Spain
purchased the largest amount of finfish in 2017, although its
559.200 tonnes purchased was a 4% drop from 2016.
On the other hand, finfish show the highest share of all fish and
seafood in the UK and Germany, respectively covering 89% and
87% of total retail purchases in the two countries.
Cephalopods and other molluscs covered a significant share of the
total in France, with 38%; Spain, with 21%; and Italy with 20%.
Purchases of crustaceans were relatively low in all five countries.
The highest shares were recorded in Spain, where crustaceans
accounted for 14%, and in the UK, where they accounted for 10%.
France10%
253.600 tonnes
Italy17%
409.300 tonnes
United Kingdom18%
452.200 tonnesGermany
20%492.900 tonnes
Spain35%
857.700 tonnes
Retail
Chart 34 Fish and seafood sales through retail channel and in the main EU countries
(2017), in volume Source: EUMOFA based on elaboration of
Euromonitor data
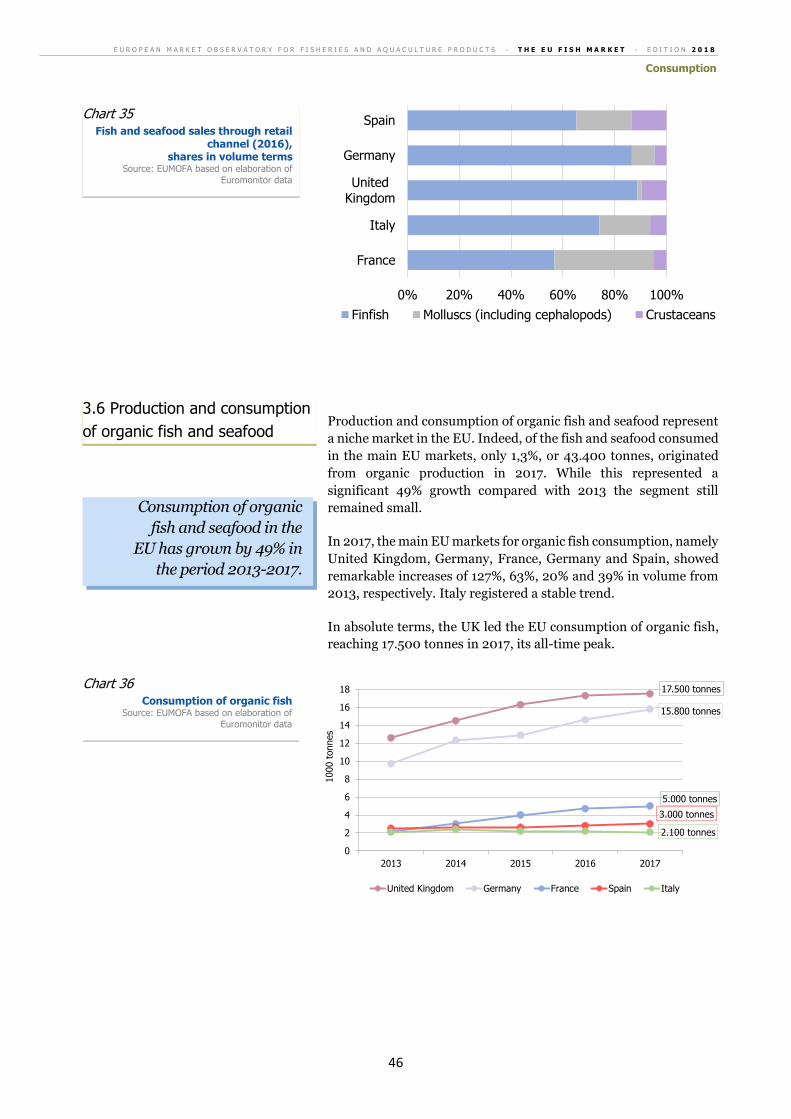
E U R O P E A N M A R K E T O B S E R V A T O R Y F O R F I S H E R I E S A N D A Q U A C U L T U R E P R O D U C T S - T H E E U F I S H M A R K E T - E D I T I O N 2 0 1 8
Consumption
46
Production and consumption of organic fish and seafood represent
a niche market in the EU. Indeed, of the fish and seafood consumed
in the main EU markets, only 1,3%, or 43.400 tonnes, originated
from organic production in 2017. While this represented a
significant 49% growth compared with 2013 the segment still
remained small.
In 2017, the main EU markets for organic fish consumption, namely
United Kingdom, Germany, France, Germany and Spain, showed
remarkable increases of 127%, 63%, 20% and 39% in volume from
2013, respectively. Italy registered a stable trend.
In absolute terms, the UK led the EU consumption of organic fish,
reaching 17.500 tonnes in 2017, its all-time peak.
0% 20% 40% 60% 80% 100%
France
Italy
UnitedKingdom
Germany
Spain
Finfish Molluscs (including cephalopods) Crustaceans
2.100 tonnes
3.000 tonnes
5.000 tonnes
15.800 tonnes
17.500 tonnes
0
2
4
6
8
10
12
14
16
18
2013 2014 2015 2016 2017
1000 t
onnes
United Kingdom Germany France Spain Italy
Chart 35 Fish and seafood sales through retail
channel (2016), shares in volume terms
Source: EUMOFA based on elaboration of
Euromonitor data
Consumption of organic
fish and seafood in the
EU has grown by 49% in
the period 2013-2017.
3.6 Production and consumption
of organic fish and seafood
Chart 36 Consumption of organic fish
Source: EUMOFA based on elaboration of
Euromonitor data
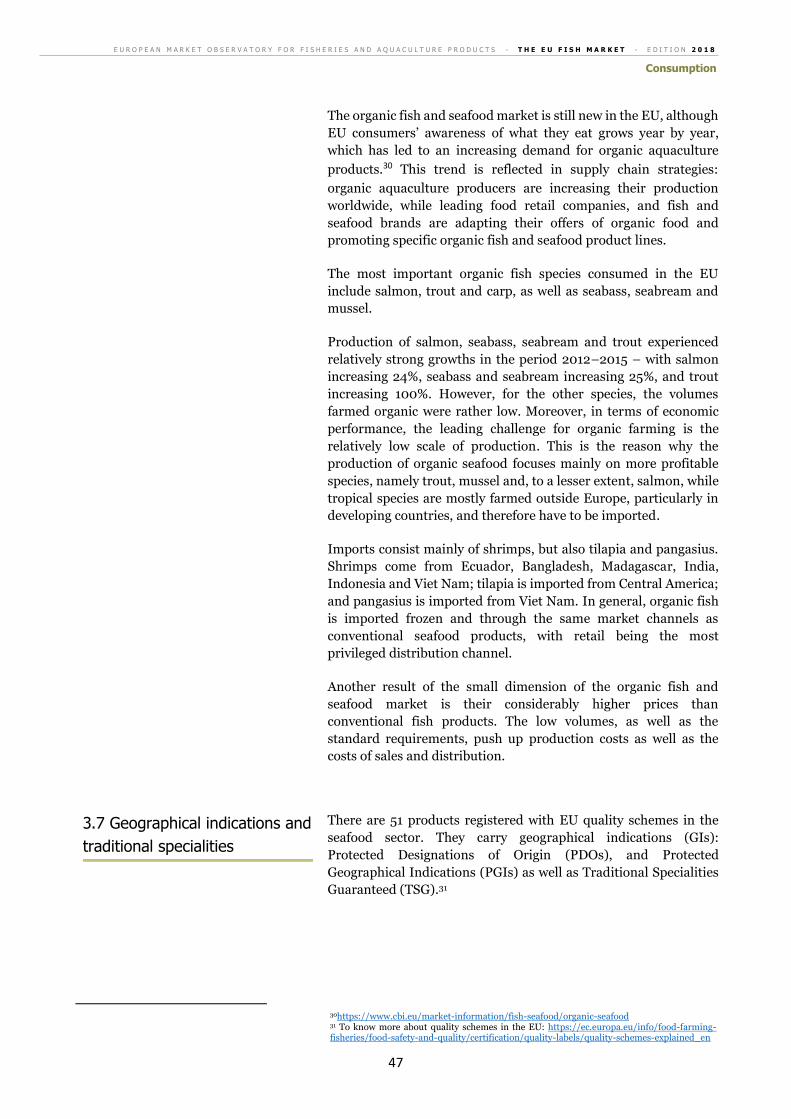
E U R O P E A N M A R K E T O B S E R V A T O R Y F O R F I S H E R I E S A N D A Q U A C U L T U R E P R O D U C T S - T H E E U F I S H M A R K E T - E D I T I O N 2 0 1 8
Consumption
47
The organic fish and seafood market is still new in the EU, although
EU consumers’ awareness of what they eat grows year by year,
which has led to an increasing demand for organic aquaculture
products.30 This trend is reflected in supply chain strategies:
organic aquaculture producers are increasing their production
worldwide, while leading food retail companies, and fish and
seafood brands are adapting their offers of organic food and
promoting specific organic fish and seafood product lines.
The most important organic fish species consumed in the EU
include salmon, trout and carp, as well as seabass, seabream and
mussel.
Production of salmon, seabass, seabream and trout experienced
relatively strong growths in the period 2012–2015 – with salmon
increasing 24%, seabass and seabream increasing 25%, and trout
increasing 100%. However, for the other species, the volumes
farmed organic were rather low. Moreover, in terms of economic
performance, the leading challenge for organic farming is the
relatively low scale of production. This is the reason why the
production of organic seafood focuses mainly on more profitable
species, namely trout, mussel and, to a lesser extent, salmon, while
tropical species are mostly farmed outside Europe, particularly in
developing countries, and therefore have to be imported.
Imports consist mainly of shrimps, but also tilapia and pangasius.
Shrimps come from Ecuador, Bangladesh, Madagascar, India,
Indonesia and Viet Nam; tilapia is imported from Central America;
and pangasius is imported from Viet Nam. In general, organic fish
is imported frozen and through the same market channels as
conventional seafood products, with retail being the most
privileged distribution channel.
Another result of the small dimension of the organic fish and
seafood market is their considerably higher prices than
conventional fish products. The low volumes, as well as the
standard requirements, push up production costs as well as the
costs of sales and distribution.
There are 51 products registered with EU quality schemes in the
seafood sector. They carry geographical indications (GIs):
Protected Designations of Origin (PDOs), and Protected
Geographical Indications (PGIs) as well as Traditional Specialities
Guaranteed (TSG).31
30https://www.cbi.eu/market-information/fish-seafood/organic-seafood 31 To know more about quality schemes in the EU: https://ec.europa.eu/info/food-farming-fisheries/food-safety-and-quality/certification/quality-labels/quality-schemes-explained_en
3.7 Geographical indications and
traditional specialities
guaranteed

E U R O P E A N M A R K E T O B S E R V A T O R Y F O R F I S H E R I E S A N D A Q U A C U L T U R E P R O D U C T S - T H E E U F I S H M A R K E T - E D I T I O N 2 0 1 8
Consumption
48
Country
Protected Designations of Origin (PDO)
Protected Geographical Indications (PGI)
Traditional Specialities Guaranteed
(TSG) Total
number species concerned number species concerned number species concerned
Czech Republic 1 Carp 1 Carp 2
Finland 1 Vendace 1 Vendace 2
France 1 Mussel 3 Oyster, Anchovy, Scallop 1 Mussel 5
Germany 7 Carp (5 PGIs), Herring, Trout
7
Greece 1 Grey mullet (roes) 1
Ireland 1 Salmon 1
Italy 2 Mussel, Tench 3 Trout, Arctic char, Anchovy
5
Latvia 1 Lamprey 1
Netherlands 1 Herring 1
Poland 1 Carp 1
Portugal 1 Cod 1
Romania 1 Carp 1
Spain 1 Mussel 4 Tuna (mojama) (2 PGIs), Tuna, Mackerel
5
Sweden 1 Vendace (roes) 1
United Kingdom 4 Pollan, Mussel, Oyster, Scallop
10 Salmon (4 PGIs), Seawin, Eel, Sardine, Cod and haddock, Haddock, Oyster
14
Norway 1 Cod 1
China 1 Freshwater crayfish 1
Viet Nam 1 Anchovy (sauce) 1
TOTAL 14 34 51
One product has been registered since July 2017, namely PDO
Lough Neagh Pollan (April 2018, UK), a wild fish of the species
Coregonus pollan caught only in Lough Neagh (Northern Ireland)
which may be sold whole, gutted or filleted. The fishing method is
draft netting and gill netting.
Two-thirds of the products (34) are PGIs, while more than one-
quarter (14) are PDOs, and 6% (3) are TSGs.
Among the 51 products registered, 29 are fishery products (19
different species), 21 are aquaculture products (mainly carp,
mussel, salmon and oyster) and one product (processed) may use
fishery or aquaculture product (PGI “London Cure Smoked
Salmon”).
Almost half (45%) of the GIs/TSGs covers unprocessed products,
while 35% cover processed products, and 20% cover both
unprocessed and processed products. Processing methods include
smoked, cured, dried, cooked and canned, including fish roes and
fish sauce.
Table 11 Quality schemes regarding fisheries and
aquaculture products registered up to 2018
Source:
DOOR, DG AGRI
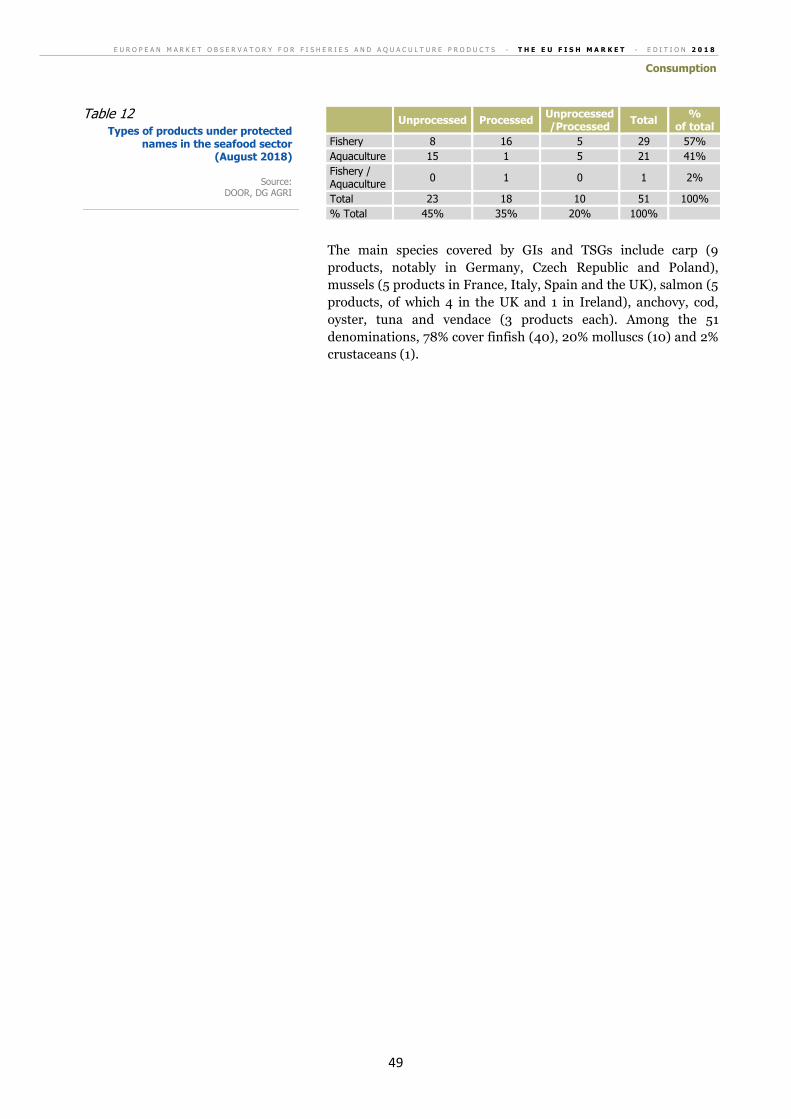
E U R O P E A N M A R K E T O B S E R V A T O R Y F O R F I S H E R I E S A N D A Q U A C U L T U R E P R O D U C T S - T H E E U F I S H M A R K E T - E D I T I O N 2 0 1 8
Consumption
49
Unprocessed Processed Unprocessed/Processed
Total %
of total
Fishery 8 16 5 29 57%
Aquaculture 15 1 5 21 41%
Fishery / Aquaculture
0 1 0 1 2%
Total 23 18 10 51 100%
% Total 45% 35% 20% 100%
The main species covered by GIs and TSGs include carp (9
products, notably in Germany, Czech Republic and Poland),
mussels (5 products in France, Italy, Spain and the UK), salmon (5
products, of which 4 in the UK and 1 in Ireland), anchovy, cod,
oyster, tuna and vendace (3 products each). Among the 51
denominations, 78% cover finfish (40), 20% molluscs (10) and 2%
crustaceans (1).
Table 12 Types of products under protected
names in the seafood sector (August 2018)
Source:
DOOR, DG AGRI
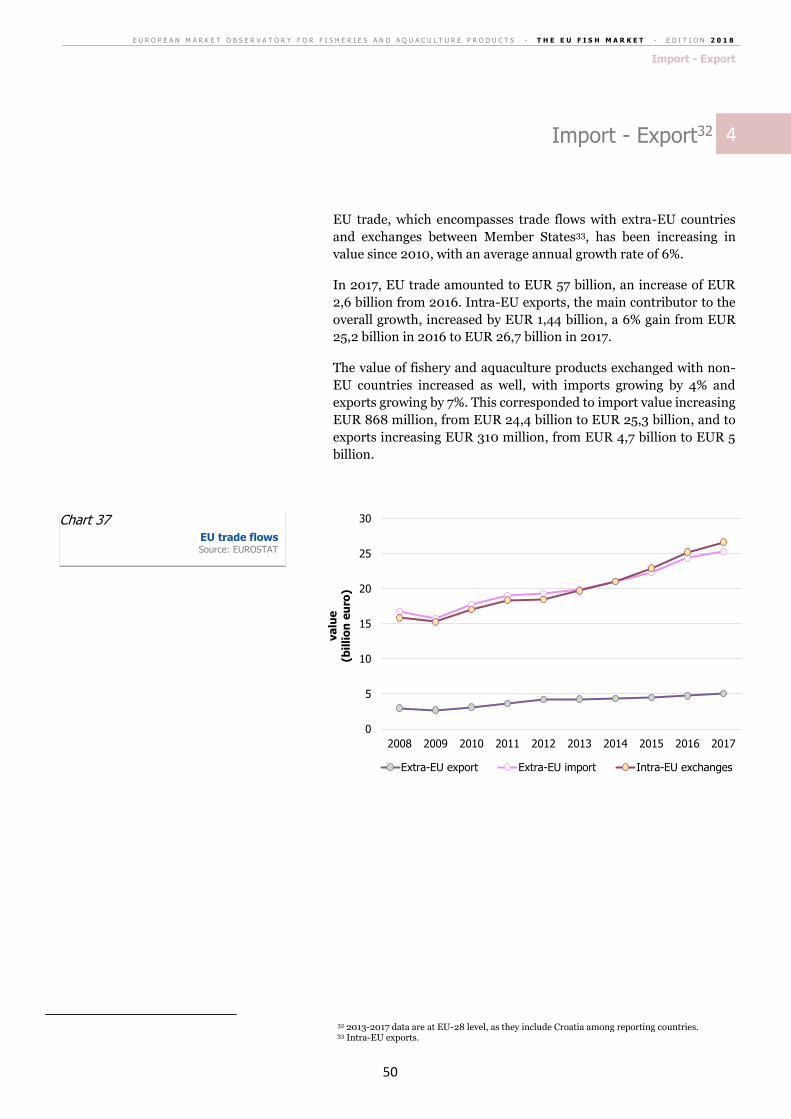
E U R O P E A N M A R K E T O B S E R V A T O R Y F O R F I S H E R I E S A N D A Q U A C U L T U R E P R O D U C T S - T H E E U F I S H M A R K E T - E D I T I O N 2 0 1 8
Import - Export
50
Import - Export32
EU trade, which encompasses trade flows with extra-EU countries
and exchanges between Member States33, has been increasing in
value since 2010, with an average annual growth rate of 6%.
In 2017, EU trade amounted to EUR 57 billion, an increase of EUR
2,6 billion from 2016. Intra-EU exports, the main contributor to the
overall growth, increased by EUR 1,44 billion, a 6% gain from EUR
25,2 billion in 2016 to EUR 26,7 billion in 2017.
The value of fishery and aquaculture products exchanged with non-
EU countries increased as well, with imports growing by 4% and
exports growing by 7%. This corresponded to import value increasing
EUR 868 million, from EUR 24,4 billion to EUR 25,3 billion, and to
exports increasing EUR 310 million, from EUR 4,7 billion to EUR 5
billion.
32 2013-2017 data are at EU-28 level, as they include Croatia among reporting countries. 33 Intra-EU exports.
0
5
10
15
20
25
30
2008 2009 2010 2011 2012 2013 2014 2015 2016 2017
va
lue
(bil
lio
n e
uro
)
Extra-EU export Extra-EU import Intra-EU exchanges
Chart 37 EU trade flows Source: EUROSTAT
4
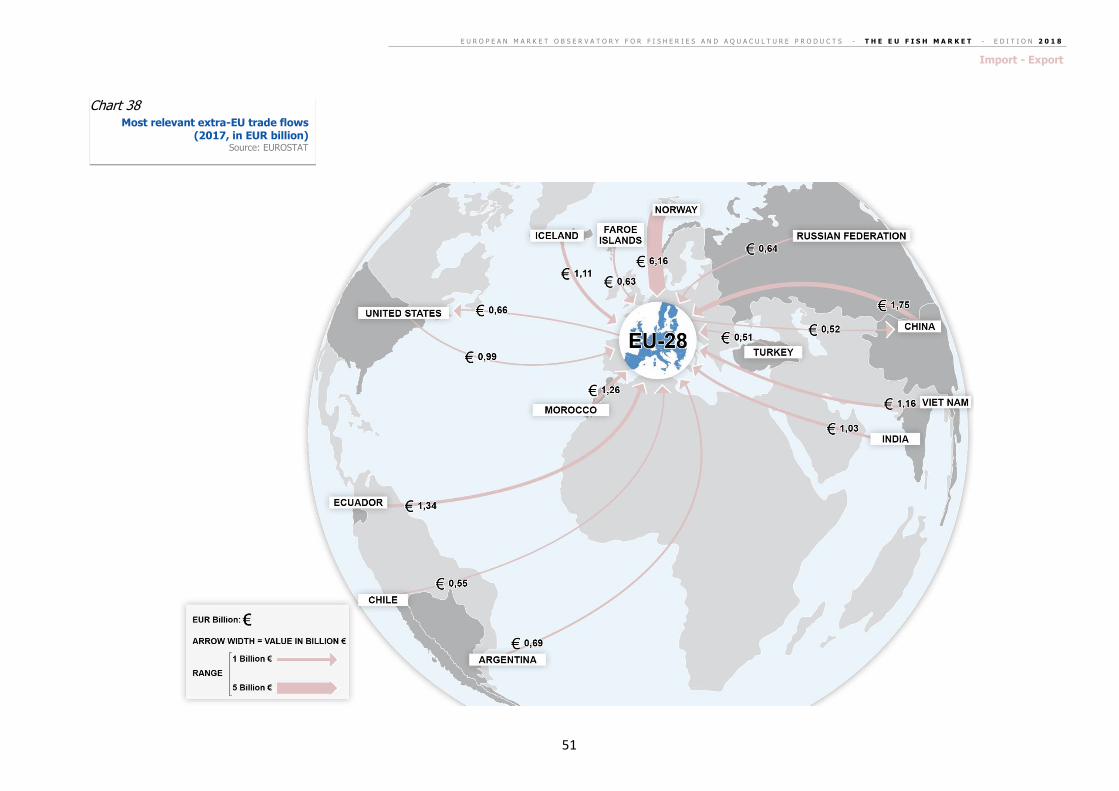
E U R O P E A N M A R K E T O B S E R V A T O R Y F O R F I S H E R I E S A N D A Q U A C U L T U R E P R O D U C T S - T H E E U F I S H M A R K E T - E D I T I O N 2 0 1 8
Import - Export
51
Chart 38 Most relevant extra-EU trade flows
(2017, in EUR billion) Source: EUROSTAT
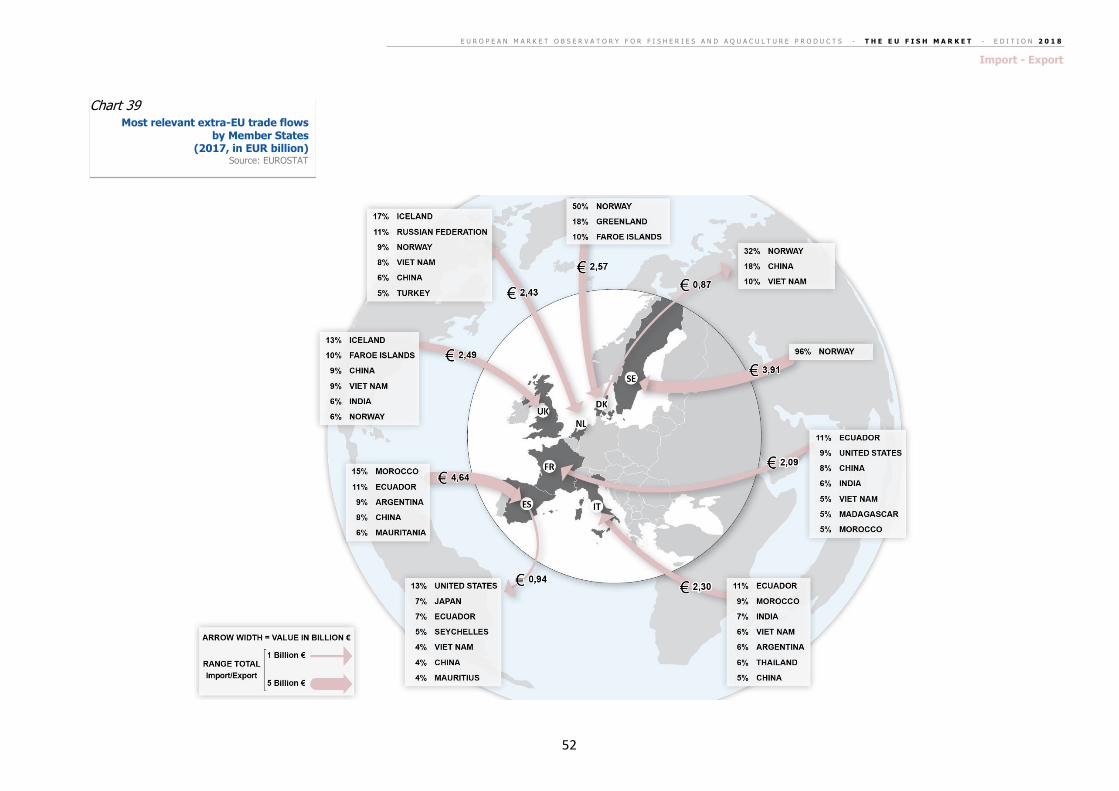
E U R O P E A N M A R K E T O B S E R V A T O R Y F O R F I S H E R I E S A N D A Q U A C U L T U R E P R O D U C T S - T H E E U F I S H M A R K E T - E D I T I O N 2 0 1 8
Import - Export
52
Chart 39 Most relevant extra-EU trade flows
by Member States (2017, in EUR billion)
Source: EUROSTAT
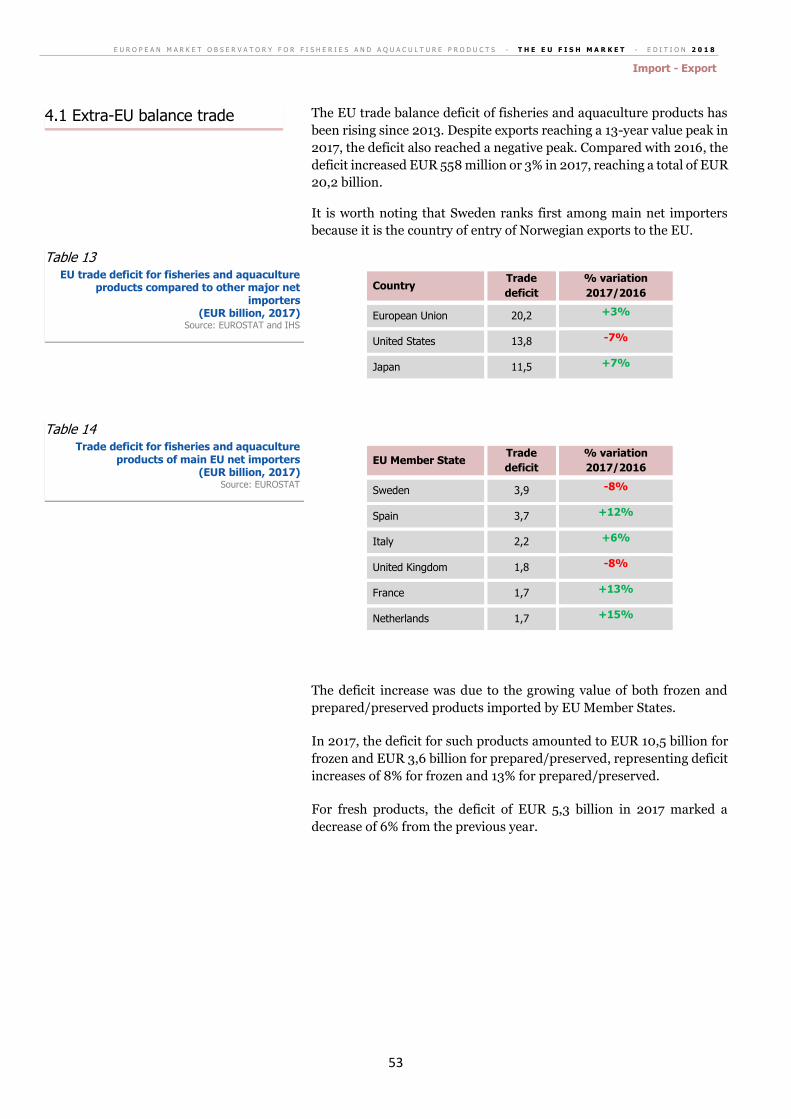
E U R O P E A N M A R K E T O B S E R V A T O R Y F O R F I S H E R I E S A N D A Q U A C U L T U R E P R O D U C T S - T H E E U F I S H M A R K E T - E D I T I O N 2 0 1 8
Import - Export
53
The EU trade balance deficit of fisheries and aquaculture products has
been rising since 2013. Despite exports reaching a 13-year value peak in
2017, the deficit also reached a negative peak. Compared with 2016, the
deficit increased EUR 558 million or 3% in 2017, reaching a total of EUR
20,2 billion.
It is worth noting that Sweden ranks first among main net importers
because it is the country of entry of Norwegian exports to the EU.
Country Trade
deficit
% variation
2017/2016
European Union 20,2 +3%
United States 13,8 -7%
Japan 11,5 +7%
EU Member State Trade
deficit
% variation
2017/2016
Sweden 3,9 -8%
Spain 3,7 +12%
Italy 2,2 +6%
United Kingdom 1,8 -8%
France 1,7 +13%
Netherlands 1,7 +15%
The deficit increase was due to the growing value of both frozen and
prepared/preserved products imported by EU Member States.
In 2017, the deficit for such products amounted to EUR 10,5 billion for
frozen and EUR 3,6 billion for prepared/preserved, representing deficit
increases of 8% for frozen and 13% for prepared/preserved.
For fresh products, the deficit of EUR 5,3 billion in 2017 marked a
decrease of 6% from the previous year.
Table 14 Trade deficit for fisheries and aquaculture
products of main EU net importers (EUR billion, 2017)
Source: EUROSTAT
Table 13 EU trade deficit for fisheries and aquaculture
products compared to other major net importers
(EUR billion, 2017) Source: EUROSTAT and IHS
4.1 Extra-EU balance trade
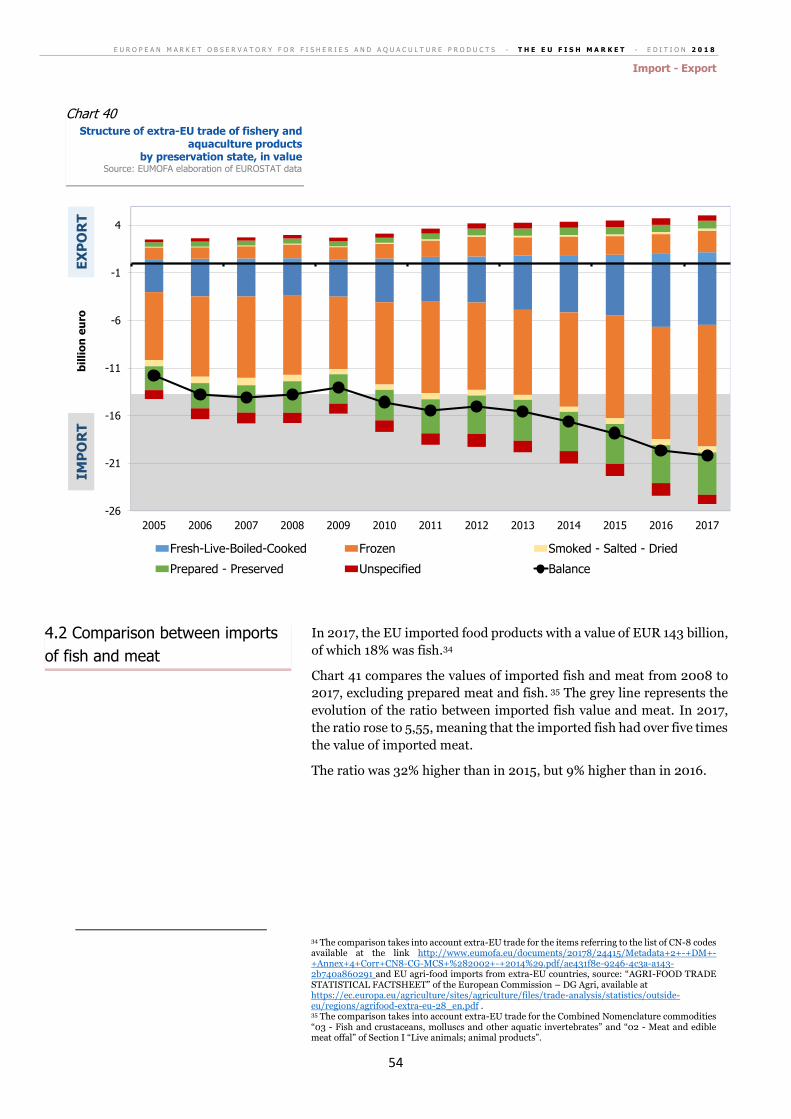
E U R O P E A N M A R K E T O B S E R V A T O R Y F O R F I S H E R I E S A N D A Q U A C U L T U R E P R O D U C T S - T H E E U F I S H M A R K E T - E D I T I O N 2 0 1 8
Import - Export
54
In 2017, the EU imported food products with a value of EUR 143 billion,
of which 18% was fish.34
Chart 41 compares the values of imported fish and meat from 2008 to
2017, excluding prepared meat and fish. 35 The grey line represents the
evolution of the ratio between imported fish value and meat. In 2017,
the ratio rose to 5,55, meaning that the imported fish had over five times
the value of imported meat.
The ratio was 32% higher than in 2015, but 9% higher than in 2016.
34 The comparison takes into account extra-EU trade for the items referring to the list of CN-8 codes available at the link http://www.eumofa.eu/documents/20178/24415/Metadata+2+-+DM+-+Annex+4+Corr+CN8-CG-MCS+%282002+-+2014%29.pdf/ae431f8e-9246-4c3a-a143-2b740a860291 and EU agri-food imports from extra-EU countries, source: “AGRI-FOOD TRADE STATISTICAL FACTSHEET” of the European Commission – DG Agri, available at https://ec.europa.eu/agriculture/sites/agriculture/files/trade-analysis/statistics/outside-eu/regions/agrifood-extra-eu-28_en.pdf . 35 The comparison takes into account extra-EU trade for the Combined Nomenclature commodities “03 - Fish and crustaceans, molluscs and other aquatic invertebrates” and “02 - Meat and edible meat offal” of Section I “Live animals; animal products”.
-26
-21
-16
-11
-6
-1
4
2005 2006 2007 2008 2009 2010 2011 2012 2013 2014 2015 2016 2017
Fresh-Live-Boiled-Cooked Frozen Smoked - Salted - Dried
Prepared - Preserved Unspecified Balance
IMP
OR
Tb
illi
on
eu
roE
XP
OR
T
Chart 40 Structure of extra-EU trade of fishery and
aquaculture products by preservation state, in value
Source: EUMOFA elaboration of EUROSTAT data
4.2 Comparison between imports
of fish and meat
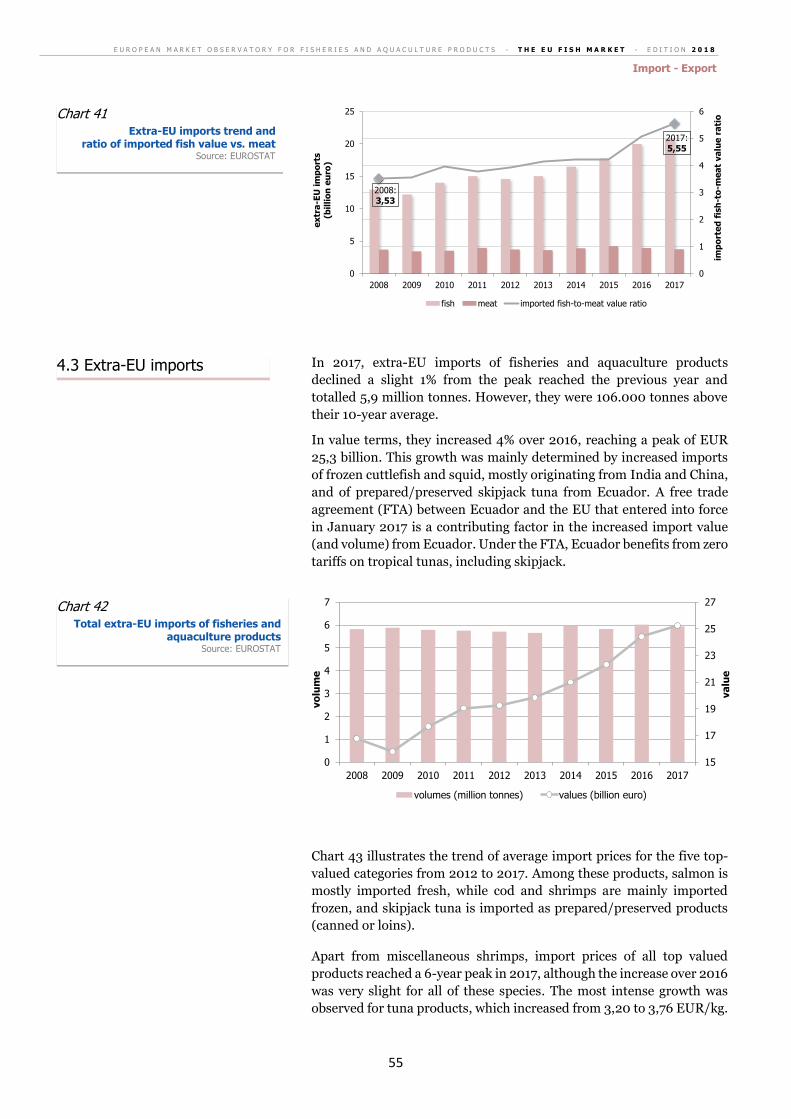
E U R O P E A N M A R K E T O B S E R V A T O R Y F O R F I S H E R I E S A N D A Q U A C U L T U R E P R O D U C T S - T H E E U F I S H M A R K E T - E D I T I O N 2 0 1 8
Import - Export
55
In 2017, extra-EU imports of fisheries and aquaculture products
declined a slight 1% from the peak reached the previous year and
totalled 5,9 million tonnes. However, they were 106.000 tonnes above
their 10-year average.
In value terms, they increased 4% over 2016, reaching a peak of EUR
25,3 billion. This growth was mainly determined by increased imports
of frozen cuttlefish and squid, mostly originating from India and China,
and of prepared/preserved skipjack tuna from Ecuador. A free trade
agreement (FTA) between Ecuador and the EU that entered into force
in January 2017 is a contributing factor in the increased import value
(and volume) from Ecuador. Under the FTA, Ecuador benefits from zero
tariffs on tropical tunas, including skipjack.
Chart 43 illustrates the trend of average import prices for the five top-
valued categories from 2012 to 2017. Among these products, salmon is
mostly imported fresh, while cod and shrimps are mainly imported
frozen, and skipjack tuna is imported as prepared/preserved products
(canned or loins).
Apart from miscellaneous shrimps, import prices of all top valued
products reached a 6-year peak in 2017, although the increase over 2016
was very slight for all of these species. The most intense growth was
observed for tuna products, which increased from 3,20 to 3,76 EUR/kg.
2008:3,53
2017:5,55
0
1
2
3
4
5
6
0
5
10
15
20
25
2008 2009 2010 2011 2012 2013 2014 2015 2016 2017
imp
ort
ed
fis
h-t
o-m
ea
t va
lue
ra
tio
ex
tra
-EU
im
po
rts
(bil
lio
n e
uro
)
fish meat imported fish-to-meat value ratio
15
17
19
21
23
25
27
0
1
2
3
4
5
6
7
2008 2009 2010 2011 2012 2013 2014 2015 2016 2017
va
lue
vo
lum
e
volumes (million tonnes) values (billion euro)
Chart 41 Extra-EU imports trend and
ratio of imported fish value vs. meat Source: EUROSTAT
4.3 Extra-EU imports
Chart 42 Total extra-EU imports of fisheries and
aquaculture products Source: EUROSTAT

E U R O P E A N M A R K E T O B S E R V A T O R Y F O R F I S H E R I E S A N D A Q U A C U L T U R E P R O D U C T S - T H E E U F I S H M A R K E T - E D I T I O N 2 0 1 8
Import - Export
56
Most of the fisheries and aquaculture products imported in the EU
originate in Norway. Denmark and Sweden are the main entry points
for Norwegian products into the internal market, allowing the imports
to reach other Member States’ markets. In 2017, Denmark reported
reduced imports of fishmeal, and Sweden reported reduced imports of
salmon with respect to 2016.
Spain, the major EU importer, is mainly supplied by Morocco, China
and, to a lesser extent, by four South-American countries, namely
Ecuador, Argentina, Peru and Chile. Imports from Ecuador and Peru
drove the overall increasing trend of 2017, mostly due to skipjack tuna
from Ecuador and cuttlefish and squid from Peru.
The Netherlands and the UK, which are among the top-5 EU importers,
reported opposite trends: an increase in the Netherlands and decline in
UK.
The Netherlands recorded increased imports of cod originating from its
main suppliers – Iceland, Norway and Russia. To some extent, the
Netherlands is also the country of entry for some seafood products, such
as frozen products from outside the EU shipped to the Netherlands
through its main ports for distribution to their final destinations.
The UK decline mostly concerned cod imported from Iceland.
6,90 EUR/kg+ 5%
4,68 EUR/kg+ 5%
7,36 EUR/kg+ 7%
7,99 EUR/kg+ 3%
3,76 EUR/kg+ 17%
1,00
2,00
3,00
4,00
5,00
6,00
7,00
8,00
2012 2013 2014 2015 2016 2017
EU
R/k
g
Salmon Cod
Warmwater shrimps Miscellaneous shrimps
Skipjack tuna (canned or loins)
Spain is the major EU importer. Imports from Ecuador (mostly due to skipjack tuna) and Peru (cuttlefish and squid) drove the
overall increasing trend of 2017.
Chart 43 Prices of top 5 valued imported “main commercial species” and % variations
2017/2016 Source: EUMOFA elaboration of EUROSTAT data
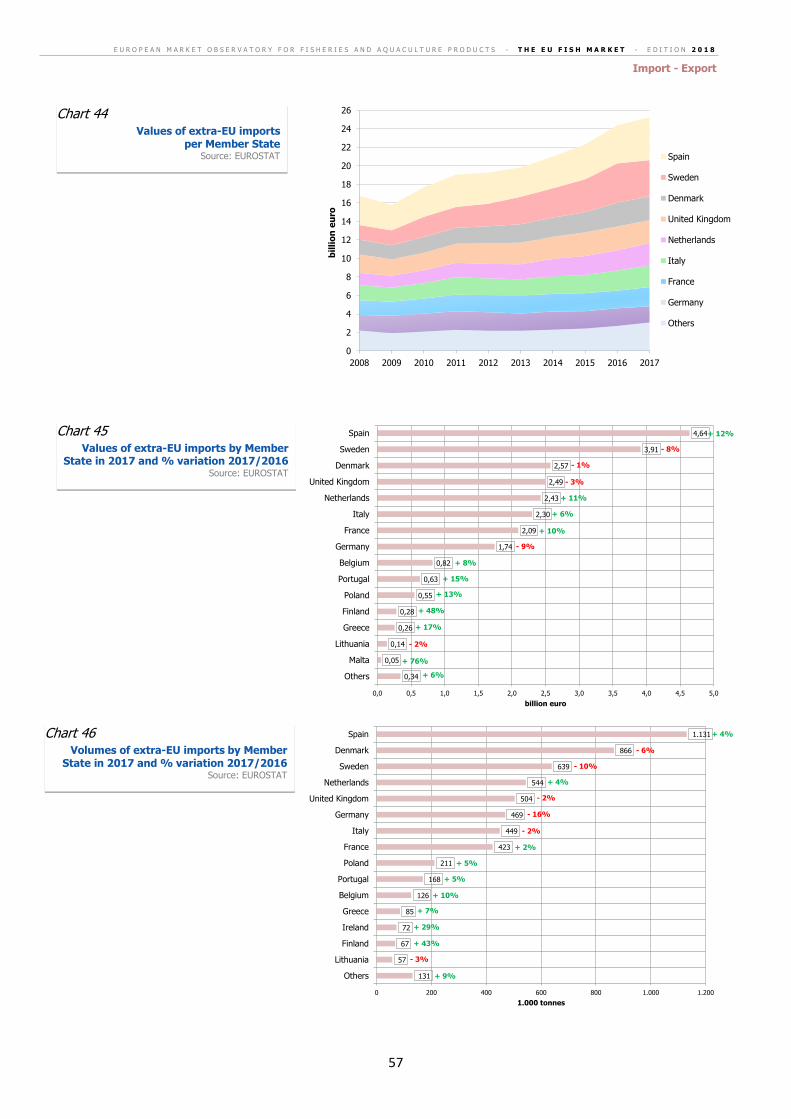
E U R O P E A N M A R K E T O B S E R V A T O R Y F O R F I S H E R I E S A N D A Q U A C U L T U R E P R O D U C T S - T H E E U F I S H M A R K E T - E D I T I O N 2 0 1 8
Import - Export
57
0
2
4
6
8
10
12
14
16
18
20
22
24
26
2008 2009 2010 2011 2012 2013 2014 2015 2016 2017
bil
lio
n e
uro
Spain
Sweden
Denmark
United Kingdom
Netherlands
Italy
France
Germany
Others
0,34
0,05
0,14
0,26
0,28
0,55
0,63
0,82
1,74
2,09
2,30
2,43
2,49
2,57
3,91
4,64
0,0 0,5 1,0 1,5 2,0 2,5 3,0 3,5 4,0 4,5 5,0
Others
Malta
Lithuania
Greece
Finland
Poland
Portugal
Belgium
Germany
France
Italy
Netherlands
United Kingdom
Denmark
Sweden
Spain
billion euro
+ 12%
- 8%
- 1%
- 3%
+ 11%
+ 6%
+ 10%
- 9%
+ 8%
+ 15%
+ 13%
+ 48%
+ 17%
- 2%
+ 76%
+ 6%
131
57
67
72
85
126
168
211
423
449
469
504
544
639
866
1.131
0 200 400 600 800 1.000 1.200
Others
Lithuania
Finland
Ireland
Greece
Belgium
Portugal
Poland
France
Italy
Germany
United Kingdom
Netherlands
Sweden
Denmark
Spain
1.000 tonnes
+ 4%
- 6%
- 10%
+ 4%
- 2%
- 16%
- 2%
+ 2%
+ 5%
+ 5%
+ 10%
+ 7%
+ 29%
+ 43%
- 3%
+ 9%
Chart 44 Values of extra-EU imports
per Member State Source: EUROSTAT
Chart 45 Values of extra-EU imports by Member
State in 2017 and % variation 2017/2016 Source: EUROSTAT
Chart 46 Volumes of extra-EU imports by Member
State in 2017 and % variation 2017/2016 Source: EUROSTAT
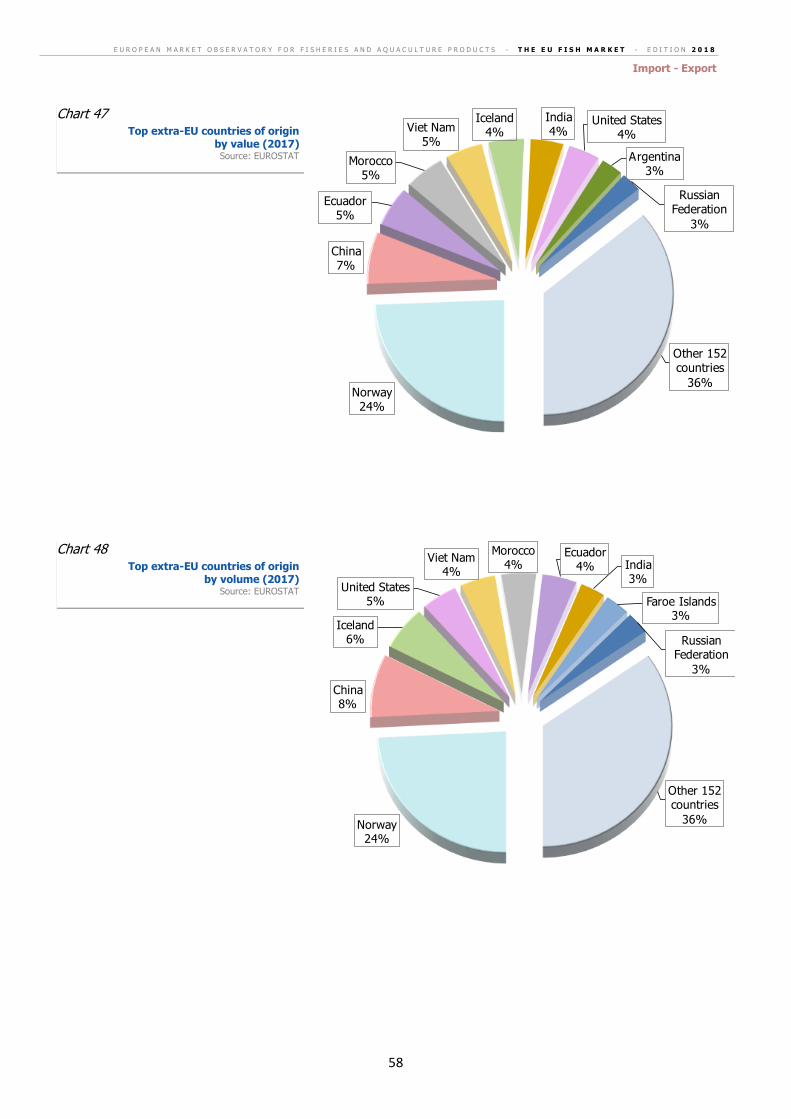
E U R O P E A N M A R K E T O B S E R V A T O R Y F O R F I S H E R I E S A N D A Q U A C U L T U R E P R O D U C T S - T H E E U F I S H M A R K E T - E D I T I O N 2 0 1 8
Import - Export
58
Norway24%
China7%
Ecuador5%
Morocco5%
Viet Nam5%
Iceland4%
India4%
United States4%
Argentina3%
Russian Federation
3%
Other 152 countries
36%
Norway24%
China8%
Iceland6%
United States5%
Viet Nam4%
Morocco4%
Ecuador4% India
3%
Faroe Islands3%
Russian Federation
3%
Other 152 countries
36%
Chart 47 Top extra-EU countries of origin
by value (2017) Source: EUROSTAT
Chart 48 Top extra-EU countries of origin
by volume (2017) Source: EUROSTAT
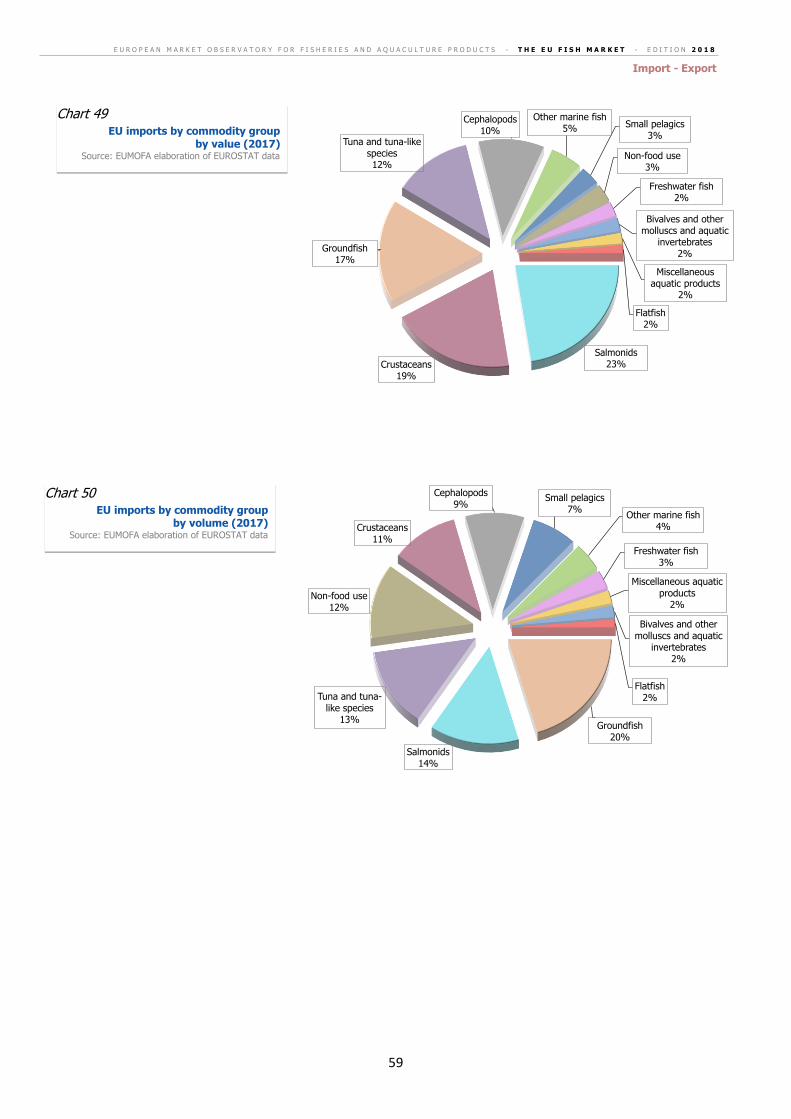
E U R O P E A N M A R K E T O B S E R V A T O R Y F O R F I S H E R I E S A N D A Q U A C U L T U R E P R O D U C T S - T H E E U F I S H M A R K E T - E D I T I O N 2 0 1 8
Import - Export
59
Salmonids23%Crustaceans
19%
Groundfish17%
Tuna and tuna-like species12%
Cephalopods10%
Other marine fish5% Small pelagics
3%
Non-food use3%
Freshwater fish2%
Bivalves and other molluscs and aquatic
invertebrates2%
Miscellaneous aquatic products
2%
Flatfish2%
Groundfish20%
Salmonids14%
Tuna and tuna-like species
13%
Non-food use12%
Crustaceans11%
Cephalopods9%
Small pelagics7%
Other marine fish4%
Freshwater fish3%
Miscellaneous aquatic products
2%
Bivalves and other molluscs and aquatic
invertebrates2%
Flatfish2%
Chart 49 EU imports by commodity group
by value (2017) Source: EUMOFA elaboration of EUROSTAT data
Chart 50 EU imports by commodity group
by volume (2017) Source: EUMOFA elaboration of EUROSTAT data
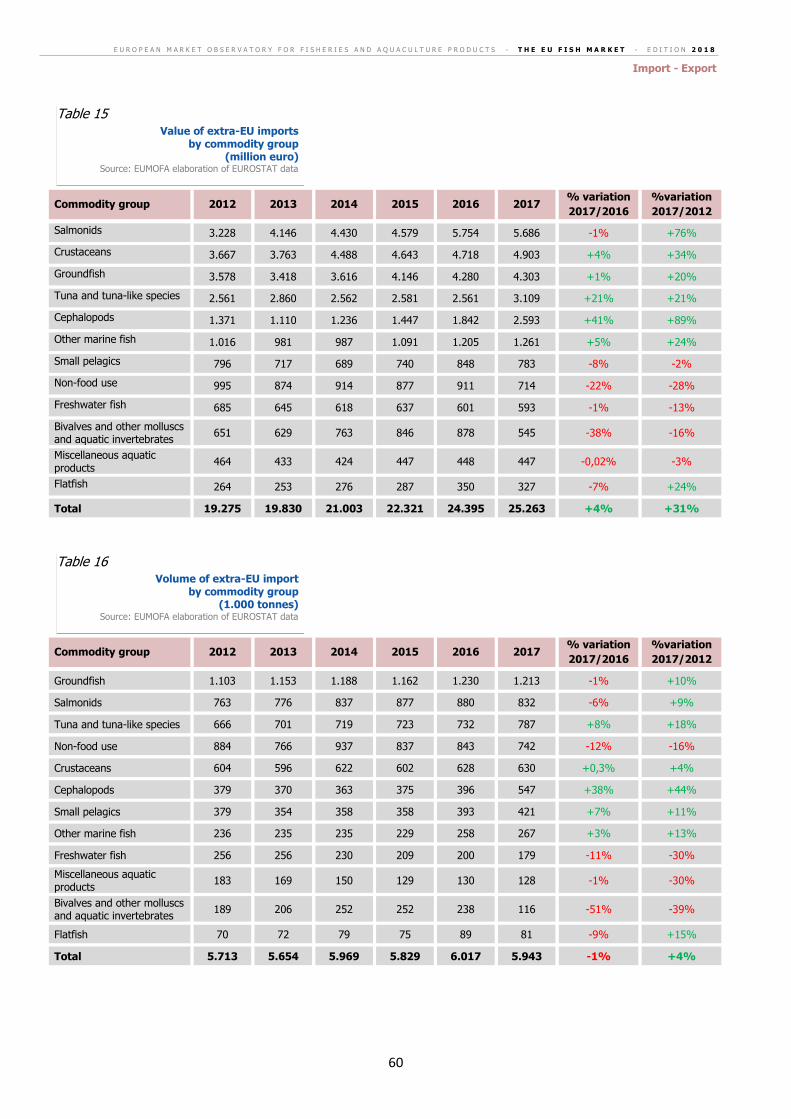
E U R O P E A N M A R K E T O B S E R V A T O R Y F O R F I S H E R I E S A N D A Q U A C U L T U R E P R O D U C T S - T H E E U F I S H M A R K E T - E D I T I O N 2 0 1 8
Import - Export
60
Commodity group 2012 2013 2014 2015 2016 2017 % variation
2017/2016
%variation
2017/2012
Salmonids 3.228 4.146 4.430 4.579 5.754 5.686 -1% +76%
Crustaceans 3.667 3.763 4.488 4.643 4.718 4.903 +4% +34%
Groundfish 3.578 3.418 3.616 4.146 4.280 4.303 +1% +20%
Tuna and tuna-like species 2.561 2.860 2.562 2.581 2.561 3.109 +21% +21%
Cephalopods 1.371 1.110 1.236 1.447 1.842 2.593 +41% +89%
Other marine fish 1.016 981 987 1.091 1.205 1.261 +5% +24%
Small pelagics 796 717 689 740 848 783 -8% -2%
Non-food use 995 874 914 877 911 714 -22% -28%
Freshwater fish 685 645 618 637 601 593 -1% -13%
Bivalves and other molluscs and aquatic invertebrates
651 629 763 846 878 545 -38% -16%
Miscellaneous aquatic products
464 433 424 447 448 447 -0,02% -3%
Flatfish 264 253 276 287 350 327 -7% +24%
Total 19.275 19.830 21.003 22.321 24.395 25.263 +4% +31%
Commodity group 2012 2013 2014 2015 2016 2017 % variation
2017/2016
%variation
2017/2012
Groundfish 1.103 1.153 1.188 1.162 1.230 1.213 -1% +10%
Salmonids 763 776 837 877 880 832 -6% +9%
Tuna and tuna-like species 666 701 719 723 732 787 +8% +18%
Non-food use 884 766 937 837 843 742 -12% -16%
Crustaceans 604 596 622 602 628 630 +0,3% +4%
Cephalopods 379 370 363 375 396 547 +38% +44%
Small pelagics 379 354 358 358 393 421 +7% +11%
Other marine fish 236 235 235 229 258 267 +3% +13%
Freshwater fish 256 256 230 209 200 179 -11% -30%
Miscellaneous aquatic products
183 169 150 129 130 128 -1% -30%
Bivalves and other molluscs and aquatic invertebrates
189 206 252 252 238 116 -51% -39%
Flatfish 70 72 79 75 89 81 -9% +15%
Total 5.713 5.654 5.969 5.829 6.017 5.943 -1% +4%
Table 15 Value of extra-EU imports
by commodity group (million euro)
Source: EUMOFA elaboration of EUROSTAT data
Table 16 Volume of extra-EU import
by commodity group (1.000 tonnes)
Source: EUMOFA elaboration of EUROSTAT data
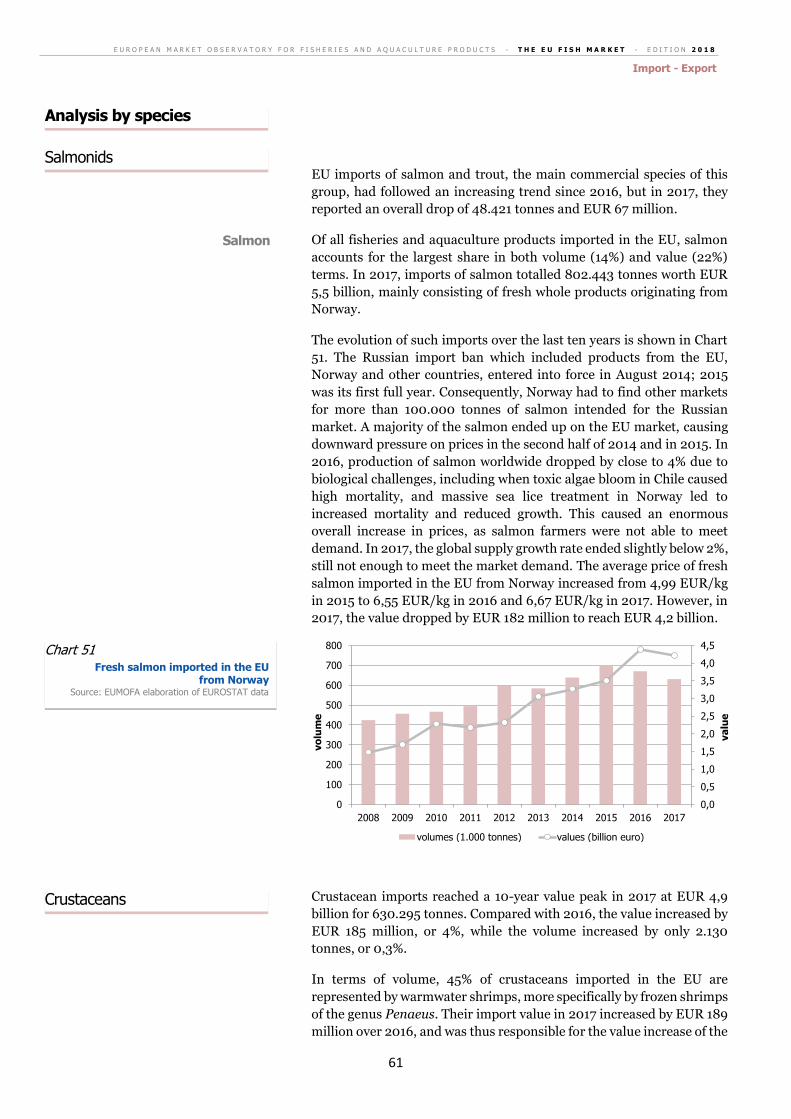
E U R O P E A N M A R K E T O B S E R V A T O R Y F O R F I S H E R I E S A N D A Q U A C U L T U R E P R O D U C T S - T H E E U F I S H M A R K E T - E D I T I O N 2 0 1 8
Import - Export
61
EU imports of salmon and trout, the main commercial species of this
group, had followed an increasing trend since 2016, but in 2017, they
reported an overall drop of 48.421 tonnes and EUR 67 million.
Of all fisheries and aquaculture products imported in the EU, salmon
accounts for the largest share in both volume (14%) and value (22%)
terms. In 2017, imports of salmon totalled 802.443 tonnes worth EUR
5,5 billion, mainly consisting of fresh whole products originating from
Norway.
The evolution of such imports over the last ten years is shown in Chart
51. The Russian import ban which included products from the EU,
Norway and other countries, entered into force in August 2014; 2015
was its first full year. Consequently, Norway had to find other markets
for more than 100.000 tonnes of salmon intended for the Russian
market. A majority of the salmon ended up on the EU market, causing
downward pressure on prices in the second half of 2014 and in 2015. In
2016, production of salmon worldwide dropped by close to 4% due to
biological challenges, including when toxic algae bloom in Chile caused
high mortality, and massive sea lice treatment in Norway led to
increased mortality and reduced growth. This caused an enormous
overall increase in prices, as salmon farmers were not able to meet
demand. In 2017, the global supply growth rate ended slightly below 2%,
still not enough to meet the market demand. The average price of fresh
salmon imported in the EU from Norway increased from 4,99 EUR/kg
in 2015 to 6,55 EUR/kg in 2016 and 6,67 EUR/kg in 2017. However, in
2017, the value dropped by EUR 182 million to reach EUR 4,2 billion.
Crustacean imports reached a 10-year value peak in 2017 at EUR 4,9
billion for 630.295 tonnes. Compared with 2016, the value increased by
EUR 185 million, or 4%, while the volume increased by only 2.130
tonnes, or 0,3%.
In terms of volume, 45% of crustaceans imported in the EU are
represented by warmwater shrimps, more specifically by frozen shrimps
of the genus Penaeus. Their import value in 2017 increased by EUR 189
million over 2016, and was thus responsible for the value increase of the
0,0
0,5
1,0
1,5
2,0
2,5
3,0
3,5
4,0
4,5
0
100
200
300
400
500
600
700
800
2008 2009 2010 2011 2012 2013 2014 2015 2016 2017
va
lue
vo
lum
e
volumes (1.000 tonnes) values (billion euro)
Salmonids
Analysis by species
Salmon
Chart 51 Fresh salmon imported in the EU
from Norway Source: EUMOFA elaboration of EUROSTAT data
Crustaceans
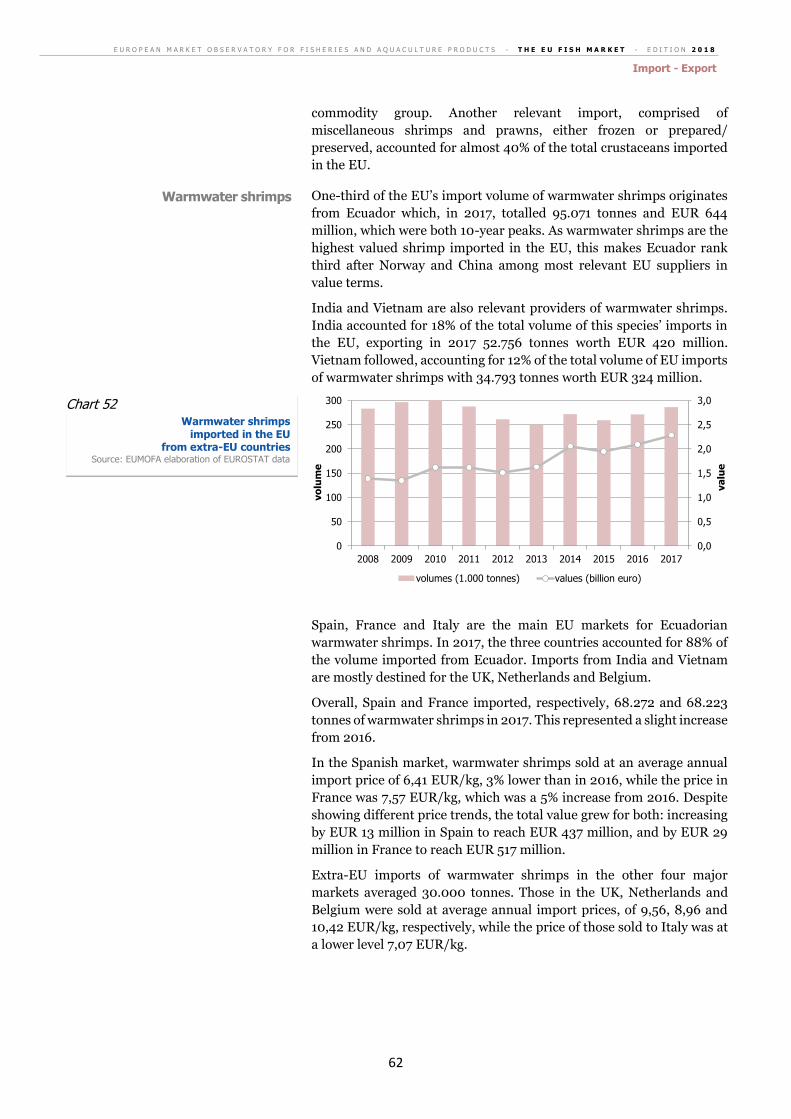
E U R O P E A N M A R K E T O B S E R V A T O R Y F O R F I S H E R I E S A N D A Q U A C U L T U R E P R O D U C T S - T H E E U F I S H M A R K E T - E D I T I O N 2 0 1 8
Import - Export
62
commodity group. Another relevant import, comprised of
miscellaneous shrimps and prawns, either frozen or prepared/
preserved, accounted for almost 40% of the total crustaceans imported
in the EU.
One-third of the EU’s import volume of warmwater shrimps originates
from Ecuador which, in 2017, totalled 95.071 tonnes and EUR 644
million, which were both 10-year peaks. As warmwater shrimps are the
highest valued shrimp imported in the EU, this makes Ecuador rank
third after Norway and China among most relevant EU suppliers in
value terms.
India and Vietnam are also relevant providers of warmwater shrimps.
India accounted for 18% of the total volume of this species’ imports in
the EU, exporting in 2017 52.756 tonnes worth EUR 420 million.
Vietnam followed, accounting for 12% of the total volume of EU imports
of warmwater shrimps with 34.793 tonnes worth EUR 324 million.
Spain, France and Italy are the main EU markets for Ecuadorian
warmwater shrimps. In 2017, the three countries accounted for 88% of
the volume imported from Ecuador. Imports from India and Vietnam
are mostly destined for the UK, Netherlands and Belgium.
Overall, Spain and France imported, respectively, 68.272 and 68.223
tonnes of warmwater shrimps in 2017. This represented a slight increase
from 2016.
In the Spanish market, warmwater shrimps sold at an average annual
import price of 6,41 EUR/kg, 3% lower than in 2016, while the price in
France was 7,57 EUR/kg, which was a 5% increase from 2016. Despite
showing different price trends, the total value grew for both: increasing
by EUR 13 million in Spain to reach EUR 437 million, and by EUR 29
million in France to reach EUR 517 million.
Extra-EU imports of warmwater shrimps in the other four major
markets averaged 30.000 tonnes. Those in the UK, Netherlands and
Belgium were sold at average annual import prices, of 9,56, 8,96 and
10,42 EUR/kg, respectively, while the price of those sold to Italy was at
a lower level 7,07 EUR/kg.
0,0
0,5
1,0
1,5
2,0
2,5
3,0
0
50
100
150
200
250
300
2008 2009 2010 2011 2012 2013 2014 2015 2016 2017
va
lue
vo
lum
e
volumes (1.000 tonnes) values (billion euro)
Warmwater shrimps
Chart 52 Warmwater shrimps
imported in the EU from extra-EU countries
Source: EUMOFA elaboration of EUROSTAT data
E U R O P E A N M A R K E T O B S E R V A T O R Y F O R F I S H E R I E S A N D A Q U A C U L T U R E P R O D U C T S - T H E E U F I S H M A R K E T - E D I T I O N 2 0 1 8
Import - Export
63
In 2017, the EU imported 243.486 tonnes of miscellaneous shrimps for
a total value of EUR 1,79 billion. This corresponded to a drop of 10.786
tonnes and a 7% price increase, which caused an overall value growth of
some EUR 50 million.
Frozen products covered 56% of the total, accounting for 135.945
tonnes, while prepared/preserved products accounted for the
remaining 44%, or 107.295 tonnes. As for value, frozen products
reached a value of EUR 854 million or 48%, and prepared/preserved
products were valued at EUR 931 million, or 52%.
Argentina, the main country of origin of miscellaneous shrimps, covers
one-third of EU supplies, mostly wild-caught red shrimp Pleoticus
muelleri. In 2017, Argentine imports reached a 10-year peak of 80.300
tonnes worth EUR 481 million, all consisting of frozen products.
Vietnam is another relevant supplier, mainly of farmed Giant tiger
prawn Penaeus monodon and white-leg shrimp Penaeus vannamei. It
mainly exports prepared/preserved products which, in 2017, also
reached a decade peak of 28.287 tonnes worth EUR 266 million.
Spain, the major importer of miscellaneous shrimps, accounted for 31%
of the total volume in 2017. Its import consists almost entirely of frozen
products originating from Argentina and China. In 2017, Argentina
imports reached 57.949 tonnes sold at 5,82 EUR/kg, and imports from
China reached 11.592 tonnes at a cost of 5,68 EUR/kg.
The other major importers – the UK, Denmark, the Netherlands and
Italy – together accounted for 49% of the total volume in 2017. While
the three northern countries mostly import prepared/preserved
products, miscellaneous shrimps sold to Italy are mainly frozen.
In 2017, groundfish accounted for 20% of EU imports from third
countries, covering 17% in value terms.
This amounted to 1,2 million tonnes, 17.147 tonnes less than in 2016,
and EUR 4,3 billion, which was a EUR 22 million increase from 2016
and represented a 10-year peak.
With 512.640 tonnes imported, cod’s volume share of this commodity
group was 43% in 2017. In value terms, it had a 56% share, reaching
EUR 2,4 billion. A large share of the cod originating from extra-EU
countries enters the EU through the Netherlands, which in 2017
received 28% of the total. Other relevant EU markets – Denmark, the
UK and Sweden – each covered around 15% of the 2017 total.
Norway was the main supplier, providing 182.404 tonnes valued at EUR
864 million to EU Member States. This represented 36% of cod
imported by third countries in both volume and value terms. A 4% price
increase from 4,57 to 4,74 EUR/kg caused a value growth of EUR 43
million, 5% more than 2016. Cod imports from Norway are quite
diversified: equal shares of frozen and fresh/chilled products (around
35% each), 16% dried, 12% salted, almost all sold as whole products.
Russia and Iceland are also relevant suppliers of cod, responsible for,
respectively, 22% and 18% of total extra-EU imports of this species in
volume terms.
Miscellaneous shrimps
Groundfish
Cod
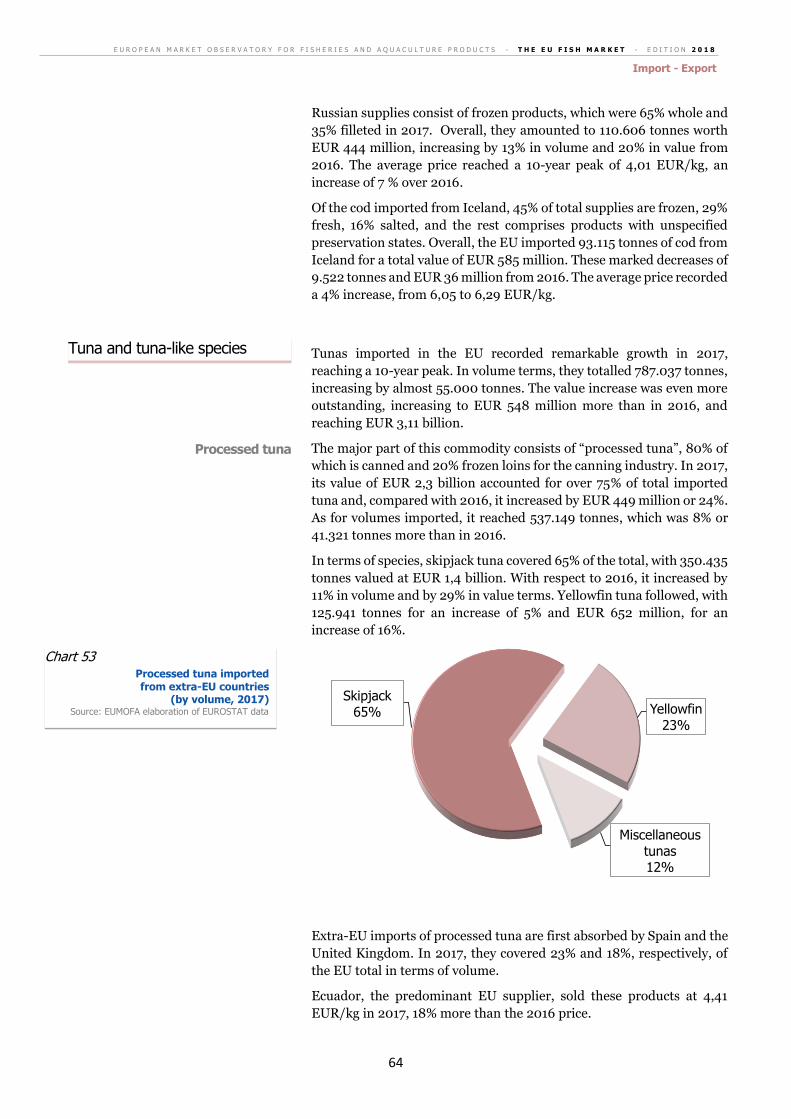
E U R O P E A N M A R K E T O B S E R V A T O R Y F O R F I S H E R I E S A N D A Q U A C U L T U R E P R O D U C T S - T H E E U F I S H M A R K E T - E D I T I O N 2 0 1 8
Import - Export
64
Russian supplies consist of frozen products, which were 65% whole and
35% filleted in 2017. Overall, they amounted to 110.606 tonnes worth
EUR 444 million, increasing by 13% in volume and 20% in value from
2016. The average price reached a 10-year peak of 4,01 EUR/kg, an
increase of 7 % over 2016.
Of the cod imported from Iceland, 45% of total supplies are frozen, 29%
fresh, 16% salted, and the rest comprises products with unspecified
preservation states. Overall, the EU imported 93.115 tonnes of cod from
Iceland for a total value of EUR 585 million. These marked decreases of
9.522 tonnes and EUR 36 million from 2016. The average price recorded
a 4% increase, from 6,05 to 6,29 EUR/kg.
Tunas imported in the EU recorded remarkable growth in 2017,
reaching a 10-year peak. In volume terms, they totalled 787.037 tonnes,
increasing by almost 55.000 tonnes. The value increase was even more
outstanding, increasing to EUR 548 million more than in 2016, and
reaching EUR 3,11 billion.
The major part of this commodity consists of “processed tuna”, 80% of
which is canned and 20% frozen loins for the canning industry. In 2017,
its value of EUR 2,3 billion accounted for over 75% of total imported
tuna and, compared with 2016, it increased by EUR 449 million or 24%.
As for volumes imported, it reached 537.149 tonnes, which was 8% or
41.321 tonnes more than in 2016.
In terms of species, skipjack tuna covered 65% of the total, with 350.435
tonnes valued at EUR 1,4 billion. With respect to 2016, it increased by
11% in volume and by 29% in value terms. Yellowfin tuna followed, with
125.941 tonnes for an increase of 5% and EUR 652 million, for an
increase of 16%.
Extra-EU imports of processed tuna are first absorbed by Spain and the
United Kingdom. In 2017, they covered 23% and 18%, respectively, of
the EU total in terms of volume.
Ecuador, the predominant EU supplier, sold these products at 4,41
EUR/kg in 2017, 18% more than the 2016 price.
Skipjack65% Yellowfin
23%
Miscellaneous tunas12%
Tuna and tuna-like species
Processed tuna
Chart 53 Processed tuna imported from extra-EU countries
(by volume, 2017) Source: EUMOFA elaboration of EUROSTAT data
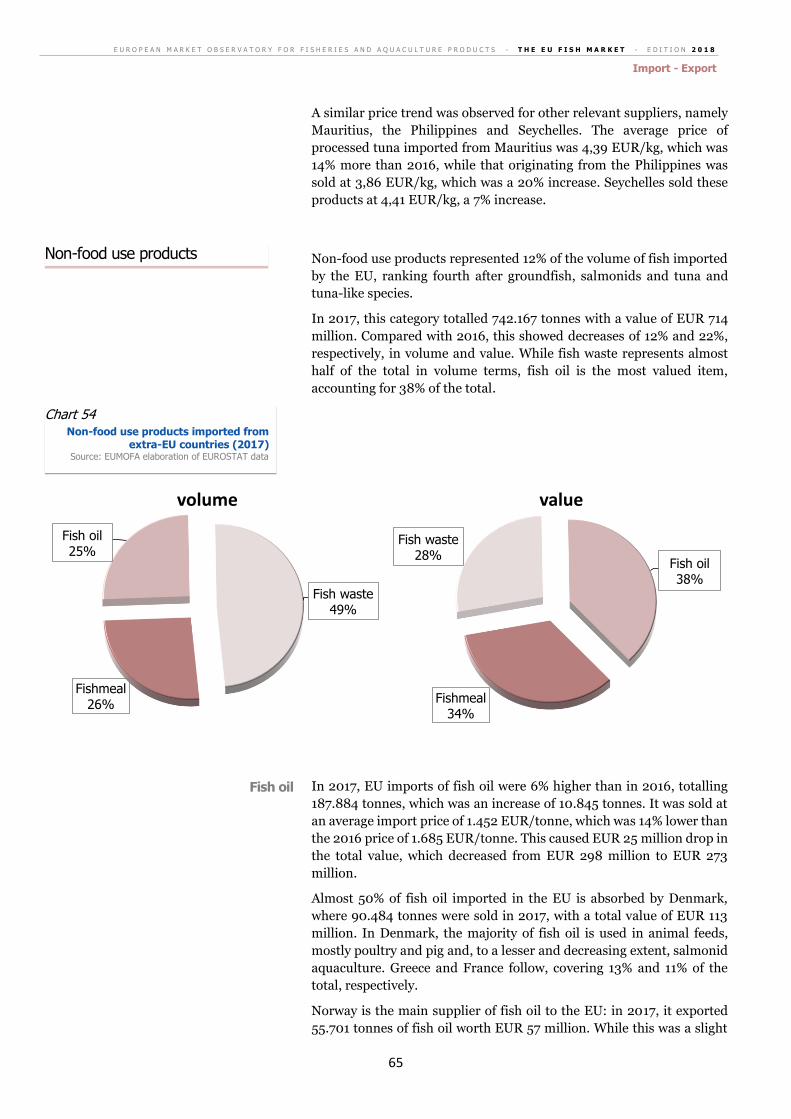
E U R O P E A N M A R K E T O B S E R V A T O R Y F O R F I S H E R I E S A N D A Q U A C U L T U R E P R O D U C T S - T H E E U F I S H M A R K E T - E D I T I O N 2 0 1 8
Import - Export
65
A similar price trend was observed for other relevant suppliers, namely
Mauritius, the Philippines and Seychelles. The average price of
processed tuna imported from Mauritius was 4,39 EUR/kg, which was
14% more than 2016, while that originating from the Philippines was
sold at 3,86 EUR/kg, which was a 20% increase. Seychelles sold these
products at 4,41 EUR/kg, a 7% increase.
Non-food use products represented 12% of the volume of fish imported
by the EU, ranking fourth after groundfish, salmonids and tuna and
tuna-like species.
In 2017, this category totalled 742.167 tonnes with a value of EUR 714
million. Compared with 2016, this showed decreases of 12% and 22%,
respectively, in volume and value. While fish waste represents almost
half of the total in volume terms, fish oil is the most valued item,
accounting for 38% of the total.
In 2017, EU imports of fish oil were 6% higher than in 2016, totalling
187.884 tonnes, which was an increase of 10.845 tonnes. It was sold at
an average import price of 1.452 EUR/tonne, which was 14% lower than
the 2016 price of 1.685 EUR/tonne. This caused EUR 25 million drop in
the total value, which decreased from EUR 298 million to EUR 273
million.
Almost 50% of fish oil imported in the EU is absorbed by Denmark,
where 90.484 tonnes were sold in 2017, with a total value of EUR 113
million. In Denmark, the majority of fish oil is used in animal feeds,
mostly poultry and pig and, to a lesser and decreasing extent, salmonid
aquaculture. Greece and France follow, covering 13% and 11% of the
total, respectively.
Norway is the main supplier of fish oil to the EU: in 2017, it exported
55.701 tonnes of fish oil worth EUR 57 million. While this was a slight
Fish waste49%
Fishmeal26%
Fish oil25%
volume
Fish oil38%
Fishmeal34%
Fish waste28%
value
Non-food use products
Chart 54 Non-food use products imported from
extra-EU countries (2017) Source: EUMOFA elaboration of EUROSTAT data
Fish oil
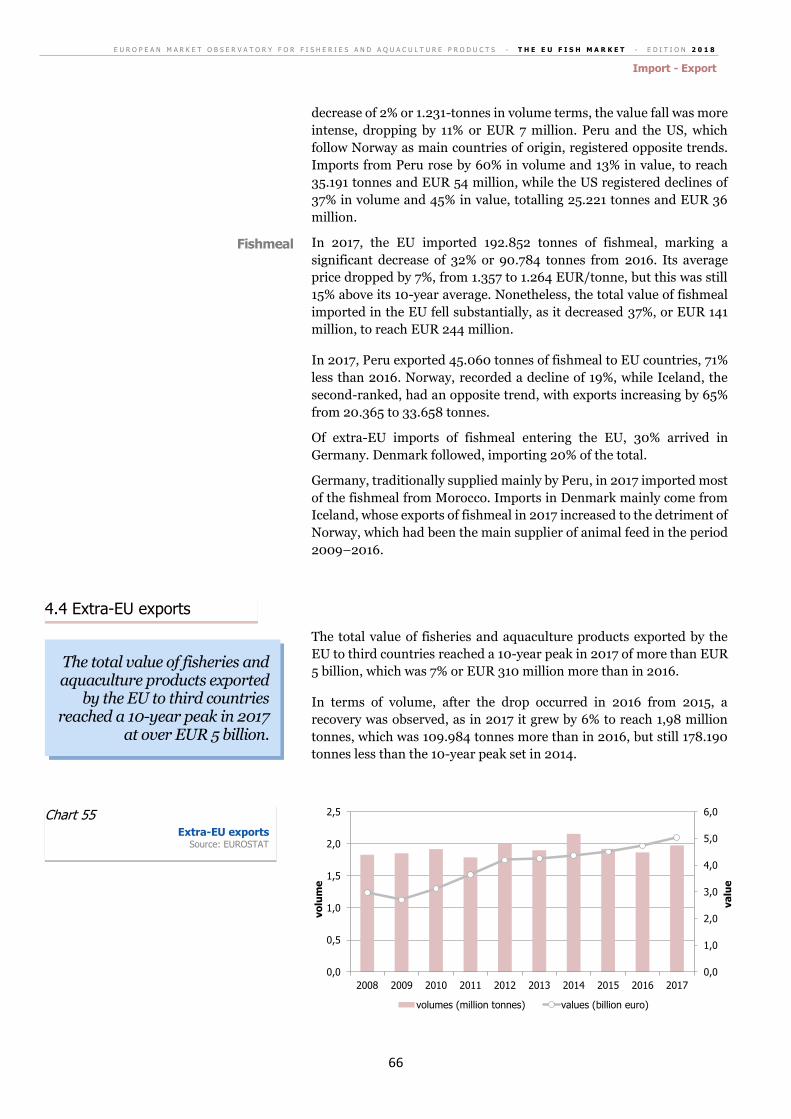
E U R O P E A N M A R K E T O B S E R V A T O R Y F O R F I S H E R I E S A N D A Q U A C U L T U R E P R O D U C T S - T H E E U F I S H M A R K E T - E D I T I O N 2 0 1 8
Import - Export
66
decrease of 2% or 1.231-tonnes in volume terms, the value fall was more
intense, dropping by 11% or EUR 7 million. Peru and the US, which
follow Norway as main countries of origin, registered opposite trends.
Imports from Peru rose by 60% in volume and 13% in value, to reach
35.191 tonnes and EUR 54 million, while the US registered declines of
37% in volume and 45% in value, totalling 25.221 tonnes and EUR 36
million.
In 2017, the EU imported 192.852 tonnes of fishmeal, marking a
significant decrease of 32% or 90.784 tonnes from 2016. Its average
price dropped by 7%, from 1.357 to 1.264 EUR/tonne, but this was still
15% above its 10-year average. Nonetheless, the total value of fishmeal
imported in the EU fell substantially, as it decreased 37%, or EUR 141
million, to reach EUR 244 million.
In 2017, Peru exported 45.060 tonnes of fishmeal to EU countries, 71%
less than 2016. Norway, recorded a decline of 19%, while Iceland, the
second-ranked, had an opposite trend, with exports increasing by 65%
from 20.365 to 33.658 tonnes.
Of extra-EU imports of fishmeal entering the EU, 30% arrived in
Germany. Denmark followed, importing 20% of the total.
Germany, traditionally supplied mainly by Peru, in 2017 imported most
of the fishmeal from Morocco. Imports in Denmark mainly come from
Iceland, whose exports of fishmeal in 2017 increased to the detriment of
Norway, which had been the main supplier of animal feed in the period
2009–2016.
The total value of fisheries and aquaculture products exported by the
EU to third countries reached a 10-year peak in 2017 of more than EUR
5 billion, which was 7% or EUR 310 million more than in 2016.
In terms of volume, after the drop occurred in 2016 from 2015, a
recovery was observed, as in 2017 it grew by 6% to reach 1,98 million
tonnes, which was 109.984 tonnes more than in 2016, but still 178.190
tonnes less than the 10-year peak set in 2014.
0,0
1,0
2,0
3,0
4,0
5,0
6,0
0,0
0,5
1,0
1,5
2,0
2,5
2008 2009 2010 2011 2012 2013 2014 2015 2016 2017
va
lue
vo
lum
e
volumes (million tonnes) values (billion euro)
Fishmeal
The total value of fisheries and aquaculture products exported
by the EU to third countries reached a 10-year peak in 2017
at over EUR 5 billion.
4.4 Extra-EU exports
Chart 55 Extra-EU exports
Source: EUROSTAT
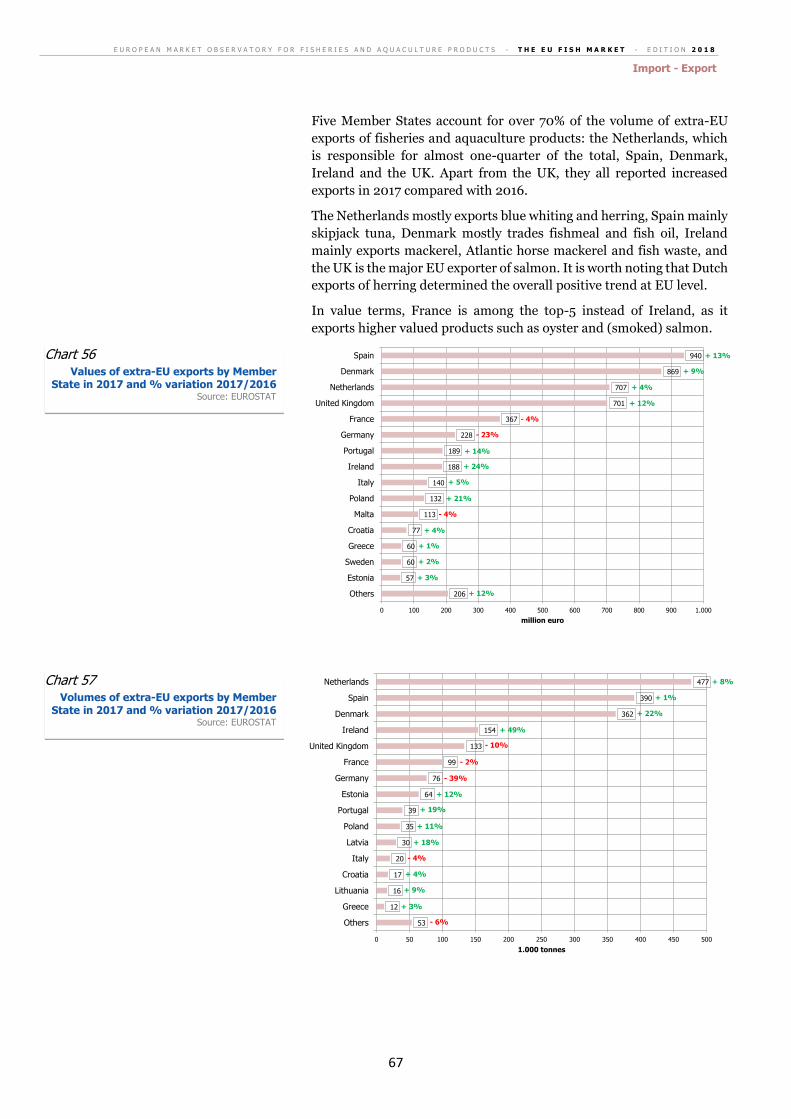
E U R O P E A N M A R K E T O B S E R V A T O R Y F O R F I S H E R I E S A N D A Q U A C U L T U R E P R O D U C T S - T H E E U F I S H M A R K E T - E D I T I O N 2 0 1 8
Import - Export
67
Five Member States account for over 70% of the volume of extra-EU
exports of fisheries and aquaculture products: the Netherlands, which
is responsible for almost one-quarter of the total, Spain, Denmark,
Ireland and the UK. Apart from the UK, they all reported increased
exports in 2017 compared with 2016.
The Netherlands mostly exports blue whiting and herring, Spain mainly
skipjack tuna, Denmark mostly trades fishmeal and fish oil, Ireland
mainly exports mackerel, Atlantic horse mackerel and fish waste, and
the UK is the major EU exporter of salmon. It is worth noting that Dutch
exports of herring determined the overall positive trend at EU level.
In value terms, France is among the top-5 instead of Ireland, as it
exports higher valued products such as oyster and (smoked) salmon.
206
57
60
60
77
113
132
140
188
189
228
367
701
707
869
940
0 100 200 300 400 500 600 700 800 900 1.000
Others
Estonia
Sweden
Greece
Croatia
Malta
Poland
Italy
Ireland
Portugal
Germany
France
United Kingdom
Netherlands
Denmark
Spain
million euro
+ 13%
+ 9%
+ 4%
+ 12%
- 4%
- 23%
+ 14%
+ 24%
+ 5%
+ 21%
- 4%
+ 4%
+ 1%
+ 2%
+ 3%
+ 12%
53
12
16
17
20
30
35
39
64
76
99
133
154
362
390
477
0 50 100 150 200 250 300 350 400 450 500
Others
Greece
Lithuania
Croatia
Italy
Latvia
Poland
Portugal
Estonia
Germany
France
United Kingdom
Ireland
Denmark
Spain
Netherlands
1.000 tonnes
+ 8%
+ 1%
+ 22%
+ 49%
- 10%
- 2%
- 39%
+ 12%
+ 19%
+ 11%
+ 18%
- 4%
+ 4%
+ 9%
+ 3%
- 6%
Chart 56 Values of extra-EU exports by Member
State in 2017 and % variation 2017/2016 Source: EUROSTAT
Chart 57 Volumes of extra-EU exports by Member
State in 2017 and % variation 2017/2016 Source: EUROSTAT
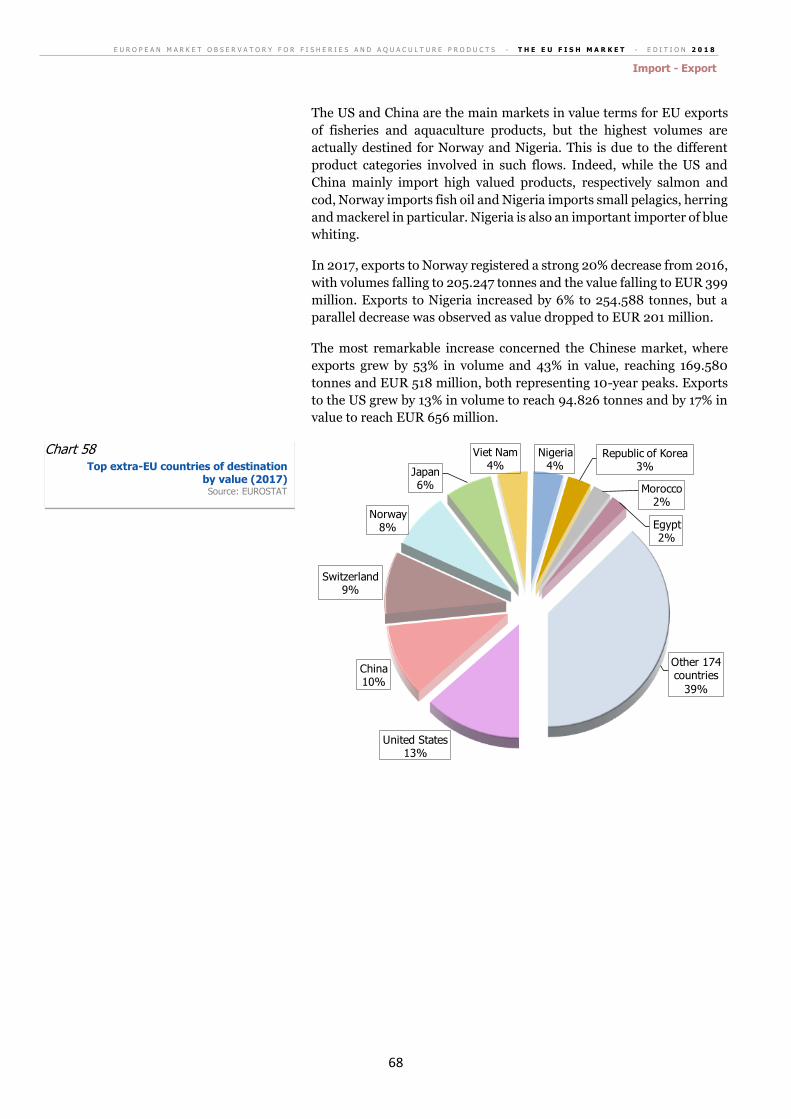
E U R O P E A N M A R K E T O B S E R V A T O R Y F O R F I S H E R I E S A N D A Q U A C U L T U R E P R O D U C T S - T H E E U F I S H M A R K E T - E D I T I O N 2 0 1 8
Import - Export
68
The US and China are the main markets in value terms for EU exports
of fisheries and aquaculture products, but the highest volumes are
actually destined for Norway and Nigeria. This is due to the different
product categories involved in such flows. Indeed, while the US and
China mainly import high valued products, respectively salmon and
cod, Norway imports fish oil and Nigeria imports small pelagics, herring
and mackerel in particular. Nigeria is also an important importer of blue
whiting.
In 2017, exports to Norway registered a strong 20% decrease from 2016,
with volumes falling to 205.247 tonnes and the value falling to EUR 399
million. Exports to Nigeria increased by 6% to 254.588 tonnes, but a
parallel decrease was observed as value dropped to EUR 201 million.
The most remarkable increase concerned the Chinese market, where
exports grew by 53% in volume and 43% in value, reaching 169.580
tonnes and EUR 518 million, both representing 10-year peaks. Exports
to the US grew by 13% in volume to reach 94.826 tonnes and by 17% in
value to reach EUR 656 million.
United States13%
China10%
Switzerland9%
Norway8%
Japan6%
Viet Nam4%
Nigeria4%
Republic of Korea3%
Morocco2%
Egypt2%
Other 174 countries
39%
Chart 58 Top extra-EU countries of destination
by value (2017) Source: EUROSTAT
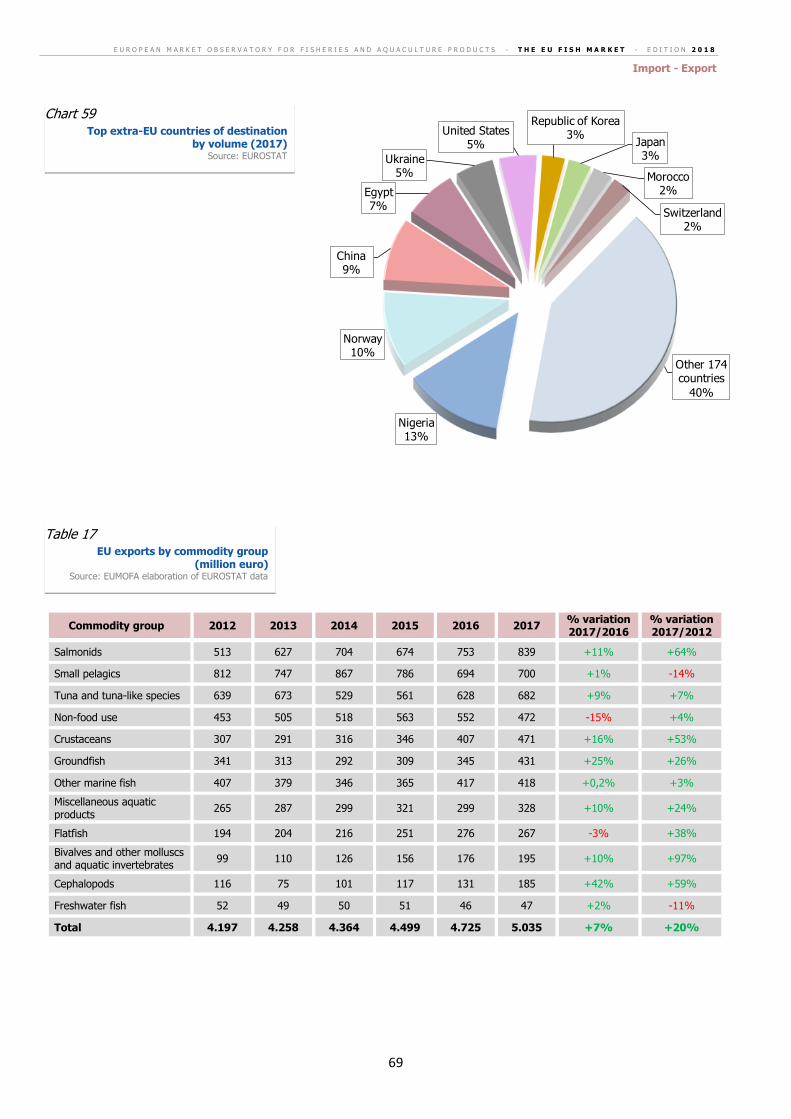
E U R O P E A N M A R K E T O B S E R V A T O R Y F O R F I S H E R I E S A N D A Q U A C U L T U R E P R O D U C T S - T H E E U F I S H M A R K E T - E D I T I O N 2 0 1 8
Import - Export
69
Commodity group 2012 2013 2014 2015 2016 2017 % variation 2017/2016
% variation 2017/2012
Salmonids 513 627 704 674 753 839 +11% +64%
Small pelagics 812 747 867 786 694 700 +1% -14%
Tuna and tuna-like species 639 673 529 561 628 682 +9% +7%
Non-food use 453 505 518 563 552 472 -15% +4%
Crustaceans 307 291 316 346 407 471 +16% +53%
Groundfish 341 313 292 309 345 431 +25% +26%
Other marine fish 407 379 346 365 417 418 +0,2% +3%
Miscellaneous aquatic products
265 287 299 321 299 328 +10% +24%
Flatfish 194 204 216 251 276 267 -3% +38%
Bivalves and other molluscs and aquatic invertebrates
99 110 126 156 176 195 +10% +97%
Cephalopods 116 75 101 117 131 185 +42% +59%
Freshwater fish 52 49 50 51 46 47 +2% -11%
Total 4.197 4.258 4.364 4.499 4.725 5.035 +7% +20%
Nigeria13%
Norway10%
China9%
Egypt7%
Ukraine5%
United States5%
Republic of Korea3%
Japan3%
Morocco2%
Switzerland2%
Other 174 countries
40%
Chart 59 Top extra-EU countries of destination
by volume (2017) Source: EUROSTAT
Table 17 EU exports by commodity group
(million euro) Source: EUMOFA elaboration of EUROSTAT data
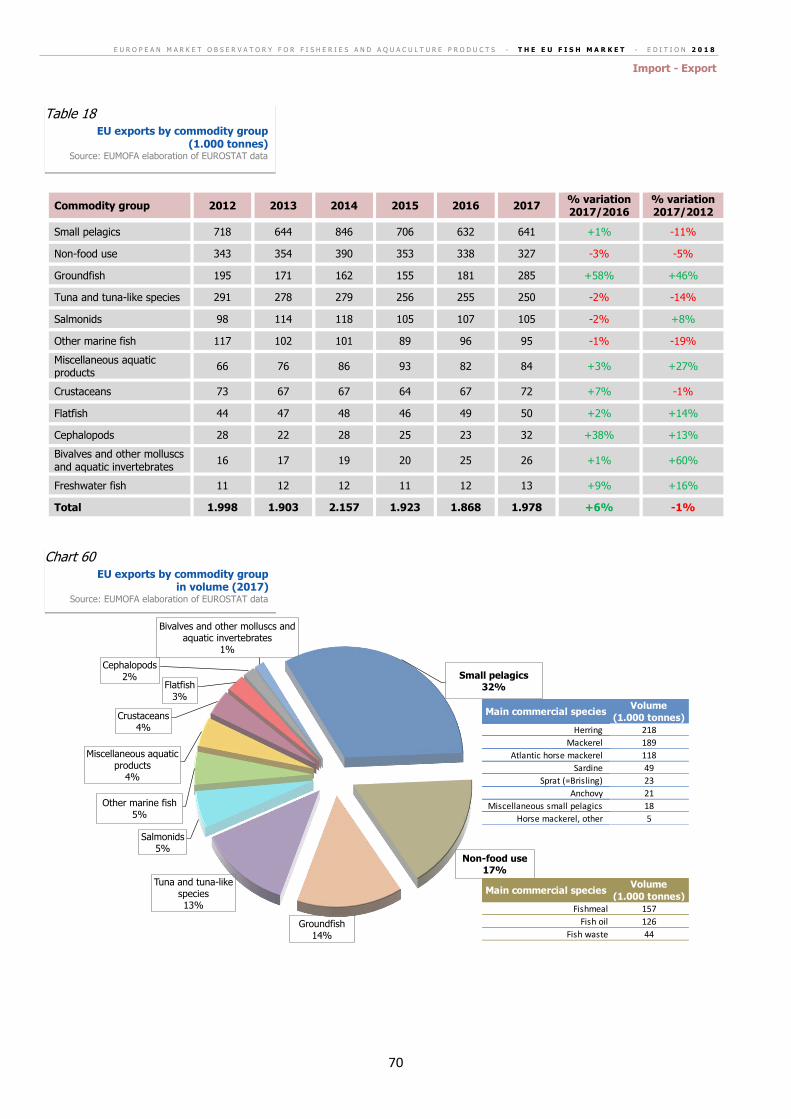
E U R O P E A N M A R K E T O B S E R V A T O R Y F O R F I S H E R I E S A N D A Q U A C U L T U R E P R O D U C T S - T H E E U F I S H M A R K E T - E D I T I O N 2 0 1 8
Import - Export
70
Commodity group 2012 2013 2014 2015 2016 2017 % variation 2017/2016
% variation 2017/2012
Small pelagics 718 644 846 706 632 641 +1% -11%
Non-food use 343 354 390 353 338 327 -3% -5%
Groundfish 195 171 162 155 181 285 +58% +46%
Tuna and tuna-like species 291 278 279 256 255 250 -2% -14%
Salmonids 98 114 118 105 107 105 -2% +8%
Other marine fish 117 102 101 89 96 95 -1% -19%
Miscellaneous aquatic products
66 76 86 93 82 84 +3% +27%
Crustaceans 73 67 67 64 67 72 +7% -1%
Flatfish 44 47 48 46 49 50 +2% +14%
Cephalopods 28 22 28 25 23 32 +38% +13%
Bivalves and other molluscs and aquatic invertebrates
16 17 19 20 25 26 +1% +60%
Freshwater fish 11 12 12 11 12 13 +9% +16%
Total 1.998 1.903 2.157 1.923 1.868 1.978 +6% -1%
Small pelagics32%
Non-food use17%
Groundfish14%
Tuna and tuna-like species13%
Salmonids5%
Other marine fish5%
Miscellaneous aquatic products
4%
Crustaceans4%
Flatfish3%
Cephalopods2%
Bivalves and other molluscs and aquatic invertebrates
1%
Main commercial speciesVolume
(1.000 tonnes)
Fishmeal 157
Fish oil 126
Fish waste 44
Main commercial speciesVolume
(1.000 tonnes)
Herring 218
Mackerel 189
Atlantic horse mackerel 118
Sardine 49
Sprat (=Brisling) 23
Anchovy 21
Miscellaneous small pelagics 18
Horse mackerel, other 5
Table 18 EU exports by commodity group
(1.000 tonnes) Source: EUMOFA elaboration of EUROSTAT data
Chart 60 EU exports by commodity group
in volume (2017) Source: EUMOFA elaboration of EUROSTAT data
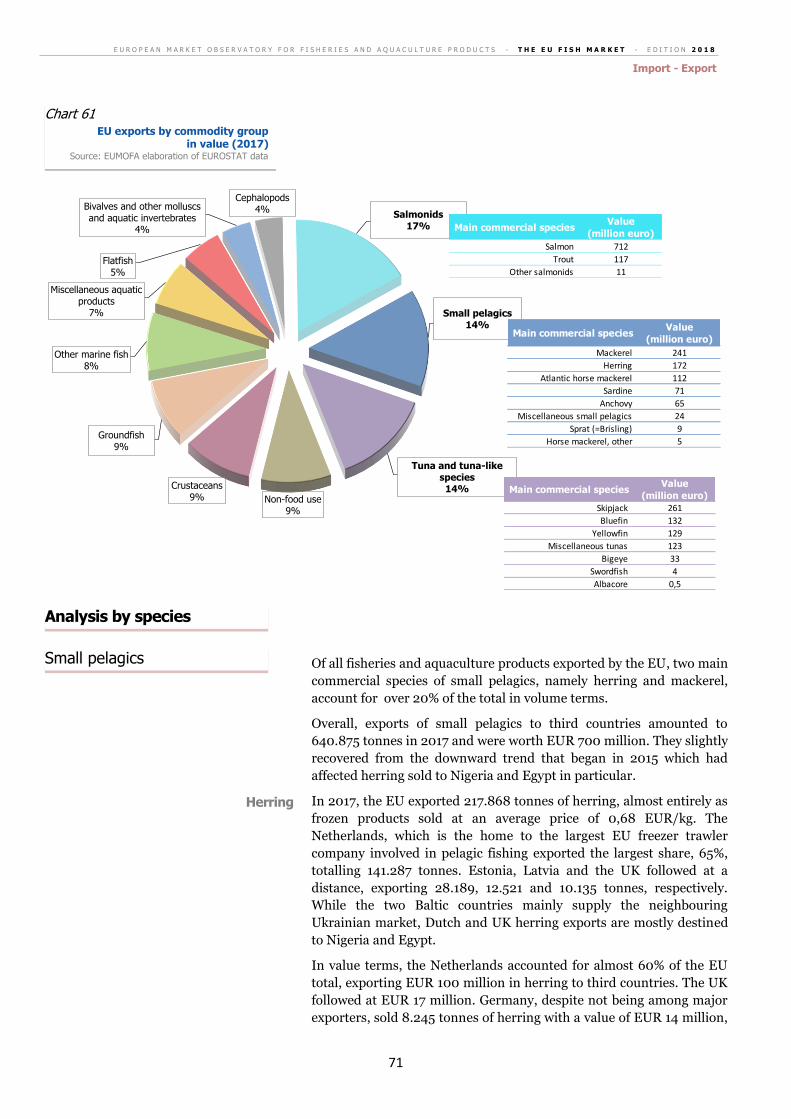
E U R O P E A N M A R K E T O B S E R V A T O R Y F O R F I S H E R I E S A N D A Q U A C U L T U R E P R O D U C T S - T H E E U F I S H M A R K E T - E D I T I O N 2 0 1 8
Import - Export
71
Of all fisheries and aquaculture products exported by the EU, two main
commercial species of small pelagics, namely herring and mackerel,
account for over 20% of the total in volume terms.
Overall, exports of small pelagics to third countries amounted to
640.875 tonnes in 2017 and were worth EUR 700 million. They slightly
recovered from the downward trend that began in 2015 which had
affected herring sold to Nigeria and Egypt in particular.
In 2017, the EU exported 217.868 tonnes of herring, almost entirely as
frozen products sold at an average price of 0,68 EUR/kg. The
Netherlands, which is the home to the largest EU freezer trawler
company involved in pelagic fishing exported the largest share, 65%,
totalling 141.287 tonnes. Estonia, Latvia and the UK followed at a
distance, exporting 28.189, 12.521 and 10.135 tonnes, respectively.
While the two Baltic countries mainly supply the neighbouring
Ukrainian market, Dutch and UK herring exports are mostly destined
to Nigeria and Egypt.
In value terms, the Netherlands accounted for almost 60% of the EU
total, exporting EUR 100 million in herring to third countries. The UK
followed at EUR 17 million. Germany, despite not being among major
exporters, sold 8.245 tonnes of herring with a value of EUR 14 million,
Salmonids17%
Small pelagics14%
Tuna and tuna-like species
14%Non-food use
9%
Crustaceans9%
Groundfish9%
Other marine fish8%
Miscellaneous aquatic products
7%
Flatfish5%
Bivalves and other molluscs and aquatic invertebrates
4%
Cephalopods4%
Main commercial speciesValue
(million euro)
Salmon 712
Trout 117
Other salmonids 11
Main commercial speciesValue
(million euro)
Mackerel 241
Herring 172
Atlantic horse mackerel 112
Sardine 71
Anchovy 65
Miscellaneous small pelagics 24
Sprat (=Brisling) 9
Horse mackerel, other 5
Main commercial speciesValue
(million euro)
Skipjack 261
Bluefin 132
Yellowfin 129
Miscellaneous tunas 123
Bigeye 33
Swordfish 4
Albacore 0,5
Analysis by species
Chart 61 EU exports by commodity group
in value (2017) Source: EUMOFA elaboration of EUROSTAT data
Small pelagics
Herring
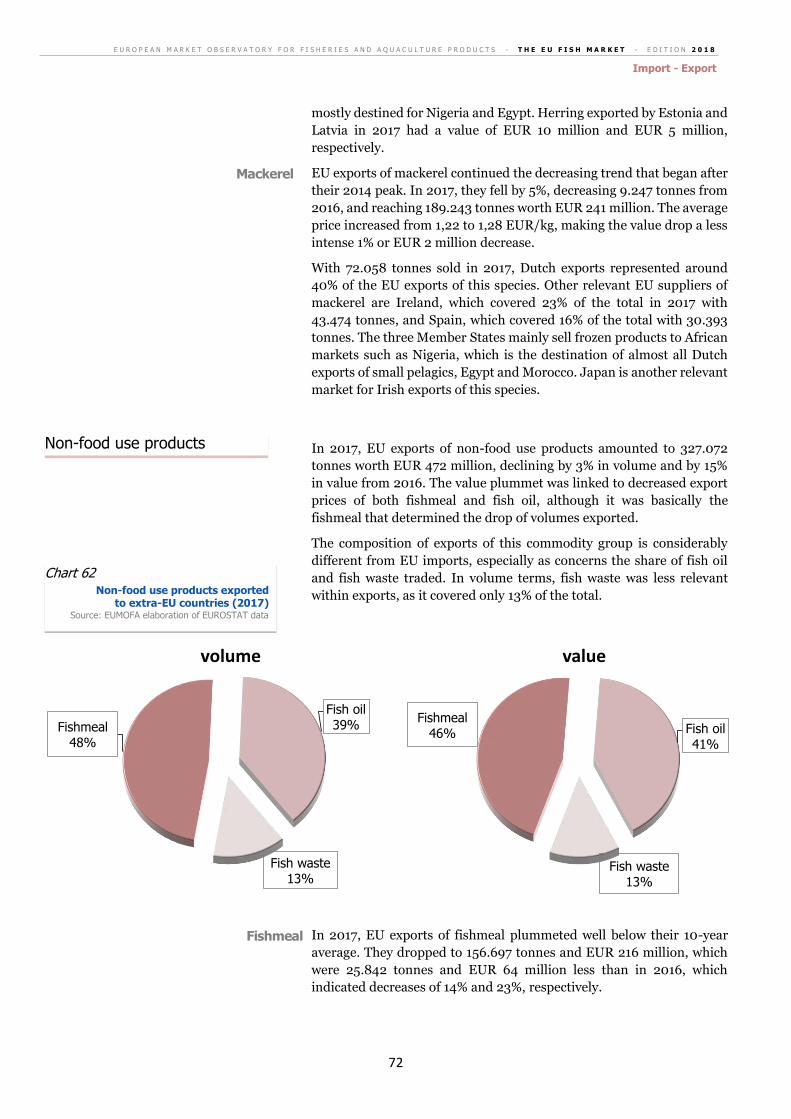
E U R O P E A N M A R K E T O B S E R V A T O R Y F O R F I S H E R I E S A N D A Q U A C U L T U R E P R O D U C T S - T H E E U F I S H M A R K E T - E D I T I O N 2 0 1 8
Import - Export
72
mostly destined for Nigeria and Egypt. Herring exported by Estonia and
Latvia in 2017 had a value of EUR 10 million and EUR 5 million,
respectively.
EU exports of mackerel continued the decreasing trend that began after
their 2014 peak. In 2017, they fell by 5%, decreasing 9.247 tonnes from
2016, and reaching 189.243 tonnes worth EUR 241 million. The average
price increased from 1,22 to 1,28 EUR/kg, making the value drop a less
intense 1% or EUR 2 million decrease.
With 72.058 tonnes sold in 2017, Dutch exports represented around
40% of the EU exports of this species. Other relevant EU suppliers of
mackerel are Ireland, which covered 23% of the total in 2017 with
43.474 tonnes, and Spain, which covered 16% of the total with 30.393
tonnes. The three Member States mainly sell frozen products to African
markets such as Nigeria, which is the destination of almost all Dutch
exports of small pelagics, Egypt and Morocco. Japan is another relevant
market for Irish exports of this species.
In 2017, EU exports of non-food use products amounted to 327.072
tonnes worth EUR 472 million, declining by 3% in volume and by 15%
in value from 2016. The value plummet was linked to decreased export
prices of both fishmeal and fish oil, although it was basically the
fishmeal that determined the drop of volumes exported.
The composition of exports of this commodity group is considerably
different from EU imports, especially as concerns the share of fish oil
and fish waste traded. In volume terms, fish waste was less relevant
within exports, as it covered only 13% of the total.
In 2017, EU exports of fishmeal plummeted well below their 10-year
average. They dropped to 156.697 tonnes and EUR 216 million, which
were 25.842 tonnes and EUR 64 million less than in 2016, which
indicated decreases of 14% and 23%, respectively.
Fishmeal48%
Fish oil39%
Fish waste13%
volume
Fishmeal46% Fish oil
41%
Fish waste13%
value
Mackerel
Chart 62 Non-food use products exported
to extra-EU countries (2017) Source: EUMOFA elaboration of EUROSTAT data
Non-food use products
Fishmeal
E U R O P E A N M A R K E T O B S E R V A T O R Y F O R F I S H E R I E S A N D A Q U A C U L T U R E P R O D U C T S - T H E E U F I S H M A R K E T - E D I T I O N 2 0 1 8
Import - Export
73
The decline was driven by Germany and the UK, two of the main EU
exporters.
Germany totalled 5.177 tonnes and EUR 8 million in 2017, down from
57.785 tonnes worth EUR 81 million exported in 2016. This negative
trend was most likely due to a decline in supplies of fishmeal coming
into the country from Peru and Morocco, as Germany mainly acts as
“trade hub” for fishmeal rather than producing it internally. As for the
UK, 2017 extra-EU exports of fishmeal were worth EUR 13 million for
9.063 tonnes, while one year before they had totalled EUR 40 million
for 26.675 tonnes.
On the other hand, a strong increase was observed for the major EU
supplier of fishmeal, namely Denmark, mainly due to exports to the
Chinese market increasing by 51% and reaching a volume peak of
132.669 tonnes. Their value increased by 27%, totalling EUR 178
million.
Norway remained the main destination for these products, despite
declined exports from Germany and the UK.
EU Member States exported 125.964 tonnes of fish oil in 2017, slightly
less than in 2016 when the 10-year peak was reached. Their total value
amounted to EUR 194 million, representing a 18% drop from 2016.
Nonetheless, this amount was EUR 31 million higher than the 10-year
average.
Close to 90% of EU exports of fish oil, which are almost entirely destined
for Norway, originate from Denmark. In 2017, fish oil was sold to
Norway at 1.394 EUR/tonne, marking a 15% price drop from 2016.
Extra-EU exports of tunas to third countries amounted to 249.871
tonnes and EUR 682 million in 2017. Volumes were a slight 2% lower
than in 2016, while a 9% growth of their value led to a 10-year high.
They mostly consist of catches by the French and Spanish fleets, landed
and registereded as exports in African countries (Atlantic and Indian
Oceans) and Ecuador. Such catches are either subject for transhipment
(frozen whole from these third countries to the EU) or for processing of
frozen loins and canned products destined to the EU market. At a later
stage, France and Spain process the tuna and export it, as loins or
canned tuna, to other EU Member States as well as to third countries.
As a matter of fact, almost all extra-EU exports of this commodity group
(swordfish excluded) come from Spain and France. Spain sold 171.465
tonnes and France sold 57.258 tonnes to third countries, for total values
of EUR 389 million and EUR 92 million, respectively.
Frozen products represent more than 90% of the volumes of their
exports of tuna and 77% of their value. Relevant shares in terms of value
include prepared/preserved tuna which accounts for 13% and fresh tuna
for 10%.
In 2017, EU exports of fishmeal plummeted well below their 10-
year average. The decline was determined by Germany and the
UK, two of the main EU exporters.
Fish oil
Tuna and tuna-like species
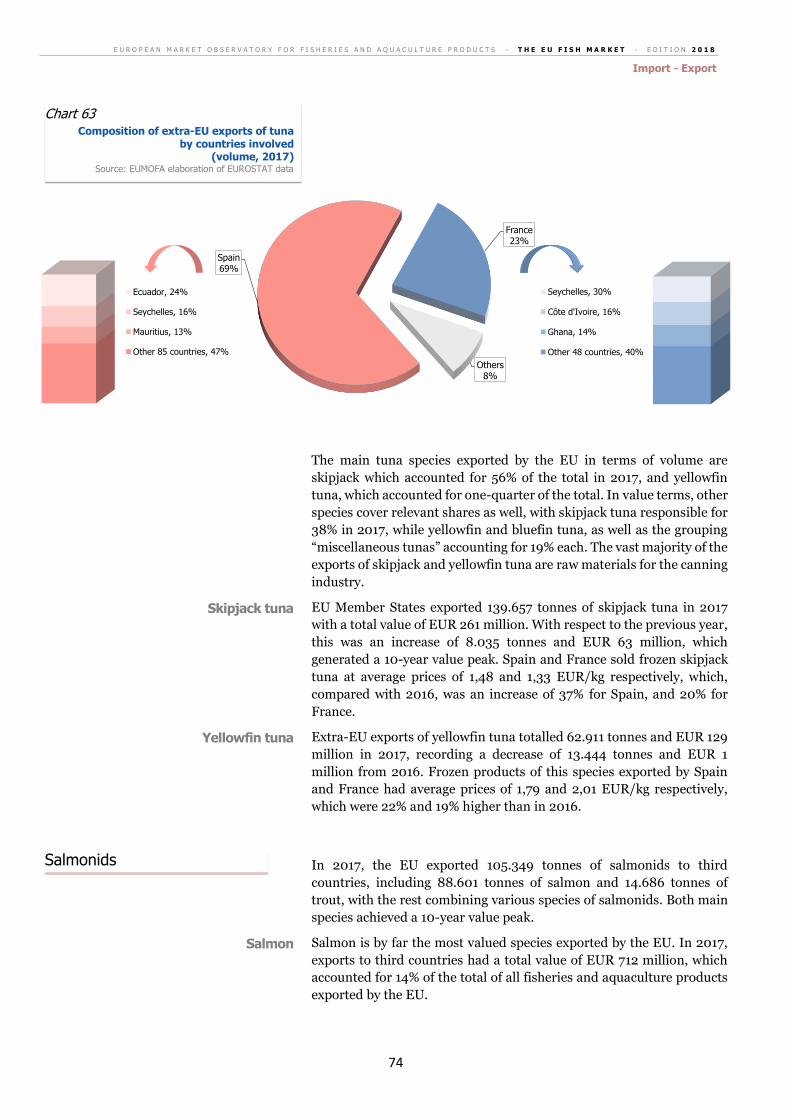
E U R O P E A N M A R K E T O B S E R V A T O R Y F O R F I S H E R I E S A N D A Q U A C U L T U R E P R O D U C T S - T H E E U F I S H M A R K E T - E D I T I O N 2 0 1 8
Import - Export
74
The main tuna species exported by the EU in terms of volume are
skipjack which accounted for 56% of the total in 2017, and yellowfin
tuna, which accounted for one-quarter of the total. In value terms, other
species cover relevant shares as well, with skipjack tuna responsible for
38% in 2017, while yellowfin and bluefin tuna, as well as the grouping
“miscellaneous tunas” accounting for 19% each. The vast majority of the
exports of skipjack and yellowfin tuna are raw materials for the canning
industry.
EU Member States exported 139.657 tonnes of skipjack tuna in 2017
with a total value of EUR 261 million. With respect to the previous year,
this was an increase of 8.035 tonnes and EUR 63 million, which
generated a 10-year value peak. Spain and France sold frozen skipjack
tuna at average prices of 1,48 and 1,33 EUR/kg respectively, which,
compared with 2016, was an increase of 37% for Spain, and 20% for
France.
Extra-EU exports of yellowfin tuna totalled 62.911 tonnes and EUR 129
million in 2017, recording a decrease of 13.444 tonnes and EUR 1
million from 2016. Frozen products of this species exported by Spain
and France had average prices of 1,79 and 2,01 EUR/kg respectively,
which were 22% and 19% higher than in 2016.
In 2017, the EU exported 105.349 tonnes of salmonids to third
countries, including 88.601 tonnes of salmon and 14.686 tonnes of
trout, with the rest combining various species of salmonids. Both main
species achieved a 10-year value peak.
Salmon is by far the most valued species exported by the EU. In 2017,
exports to third countries had a total value of EUR 712 million, which
accounted for 14% of the total of all fisheries and aquaculture products
exported by the EU.
0
20000000
40000000
60000000
80000000
100000000
120000000
140000000
160000000
180000000
1
Ecuador, 24%
Seychelles, 16%
Mauritius, 13%
Other 85 countries, 47%
Spain69%
France23%
Others8%
Seychelles, 30%
Côte d'Ivoire, 16%
Ghana, 14%
Other 48 countries, 40%
Chart 63 Composition of extra-EU exports of tuna
by countries involved (volume, 2017)
Source: EUMOFA elaboration of EUROSTAT data
Skipjack tuna
Yellowfin tuna
Salmonids
Salmon
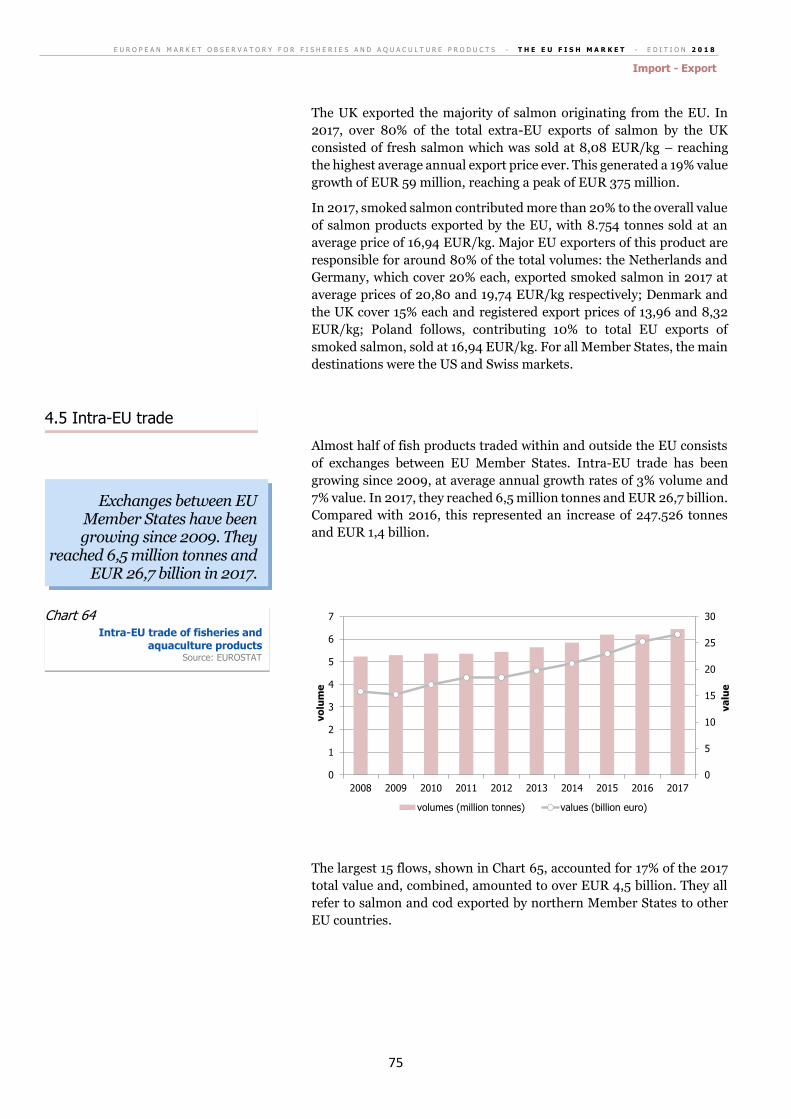
E U R O P E A N M A R K E T O B S E R V A T O R Y F O R F I S H E R I E S A N D A Q U A C U L T U R E P R O D U C T S - T H E E U F I S H M A R K E T - E D I T I O N 2 0 1 8
Import - Export
75
The UK exported the majority of salmon originating from the EU. In
2017, over 80% of the total extra-EU exports of salmon by the UK
consisted of fresh salmon which was sold at 8,08 EUR/kg – reaching
the highest average annual export price ever. This generated a 19% value
growth of EUR 59 million, reaching a peak of EUR 375 million.
In 2017, smoked salmon contributed more than 20% to the overall value
of salmon products exported by the EU, with 8.754 tonnes sold at an
average price of 16,94 EUR/kg. Major EU exporters of this product are
responsible for around 80% of the total volumes: the Netherlands and
Germany, which cover 20% each, exported smoked salmon in 2017 at
average prices of 20,80 and 19,74 EUR/kg respectively; Denmark and
the UK cover 15% each and registered export prices of 13,96 and 8,32
EUR/kg; Poland follows, contributing 10% to total EU exports of
smoked salmon, sold at 16,94 EUR/kg. For all Member States, the main
destinations were the US and Swiss markets.
Almost half of fish products traded within and outside the EU consists
of exchanges between EU Member States. Intra-EU trade has been
growing since 2009, at average annual growth rates of 3% volume and
7% value. In 2017, they reached 6,5 million tonnes and EUR 26,7 billion.
Compared with 2016, this represented an increase of 247.526 tonnes
and EUR 1,4 billion.
The largest 15 flows, shown in Chart 65, accounted for 17% of the 2017
total value and, combined, amounted to over EUR 4,5 billion. They all
refer to salmon and cod exported by northern Member States to other
EU countries.
0
5
10
15
20
25
30
0
1
2
3
4
5
6
7
2008 2009 2010 2011 2012 2013 2014 2015 2016 2017
va
lue
vo
lum
e
volumes (million tonnes) values (billion euro)
Exchanges between EU Member States have been growing since 2009. They
reached 6,5 million tonnes and EUR 26,7 billion in 2017.
4.5 Intra-EU trade
Chart 64 Intra-EU trade of fisheries and
aquaculture products Source: EUROSTAT
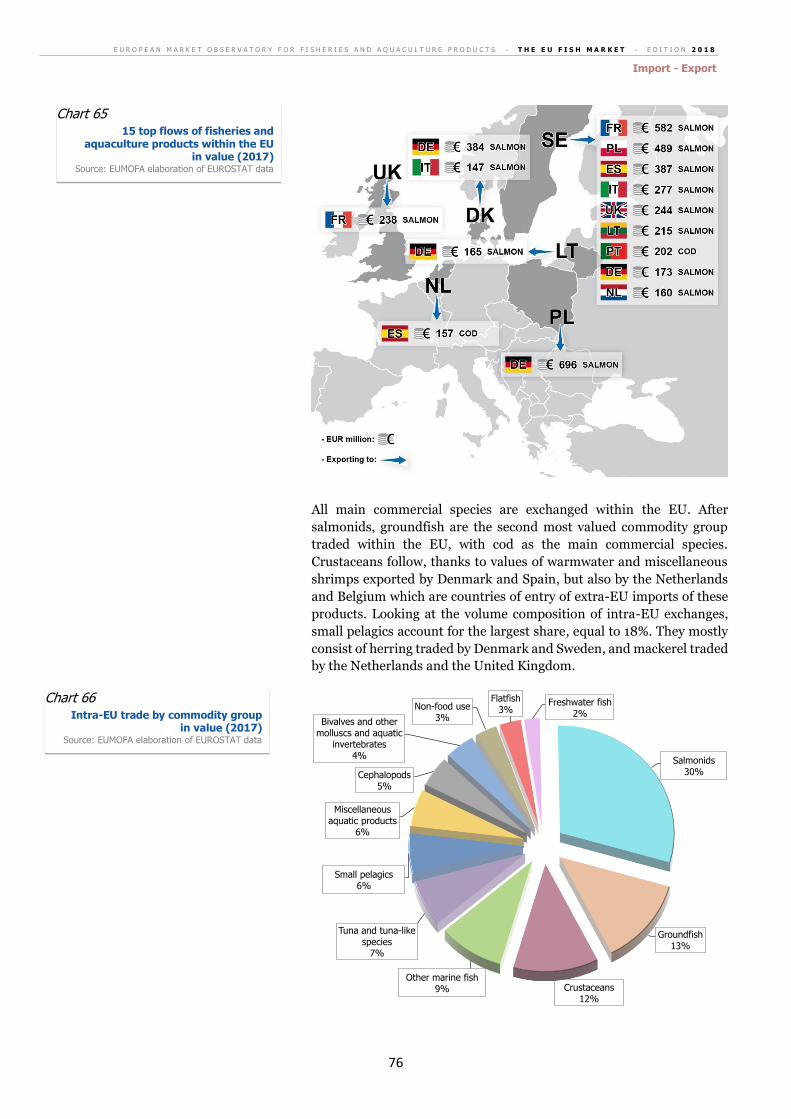
E U R O P E A N M A R K E T O B S E R V A T O R Y F O R F I S H E R I E S A N D A Q U A C U L T U R E P R O D U C T S - T H E E U F I S H M A R K E T - E D I T I O N 2 0 1 8
Import - Export
76
All main commercial species are exchanged within the EU. After
salmonids, groundfish are the second most valued commodity group
traded within the EU, with cod as the main commercial species.
Crustaceans follow, thanks to values of warmwater and miscellaneous
shrimps exported by Denmark and Spain, but also by the Netherlands
and Belgium which are countries of entry of extra-EU imports of these
products. Looking at the volume composition of intra-EU exchanges,
small pelagics account for the largest share, equal to 18%. They mostly
consist of herring traded by Denmark and Sweden, and mackerel traded
by the Netherlands and the United Kingdom.
Salmonids30%
Groundfish13%
Crustaceans12%
Other marine fish9%
Tuna and tuna-like species
7%
Small pelagics6%
Miscellaneous aquatic products
6%
Cephalopods5%
Bivalves and other molluscs and aquatic
invertebrates4%
Non-food use3%
Flatfish3%
Freshwater fish2%
Chart 65 15 top flows of fisheries and
aquaculture products within the EU in value (2017)
Source: EUMOFA elaboration of EUROSTAT data
Chart 66 Intra-EU trade by commodity group
in value (2017) Source: EUMOFA elaboration of EUROSTAT data
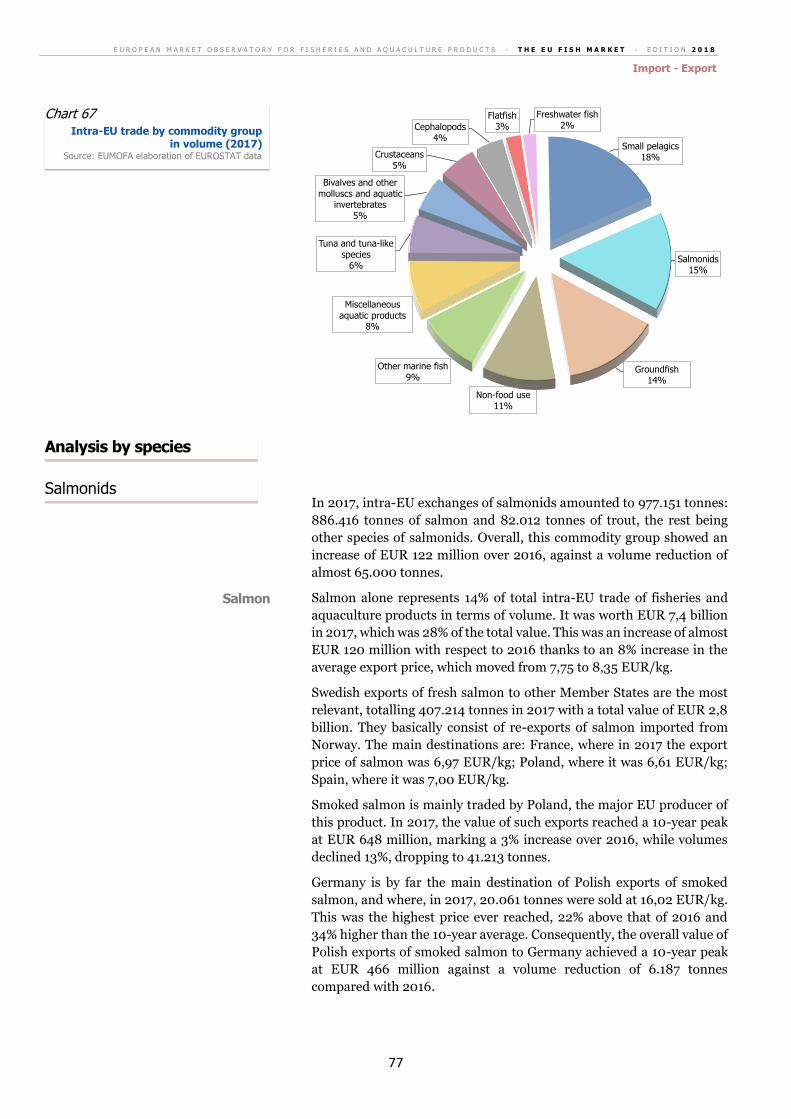
E U R O P E A N M A R K E T O B S E R V A T O R Y F O R F I S H E R I E S A N D A Q U A C U L T U R E P R O D U C T S - T H E E U F I S H M A R K E T - E D I T I O N 2 0 1 8
Import - Export
77
In 2017, intra-EU exchanges of salmonids amounted to 977.151 tonnes:
886.416 tonnes of salmon and 82.012 tonnes of trout, the rest being
other species of salmonids. Overall, this commodity group showed an
increase of EUR 122 million over 2016, against a volume reduction of
almost 65.000 tonnes.
Salmon alone represents 14% of total intra-EU trade of fisheries and
aquaculture products in terms of volume. It was worth EUR 7,4 billion
in 2017, which was 28% of the total value. This was an increase of almost
EUR 120 million with respect to 2016 thanks to an 8% increase in the
average export price, which moved from 7,75 to 8,35 EUR/kg.
Swedish exports of fresh salmon to other Member States are the most
relevant, totalling 407.214 tonnes in 2017 with a total value of EUR 2,8
billion. They basically consist of re-exports of salmon imported from
Norway. The main destinations are: France, where in 2017 the export
price of salmon was 6,97 EUR/kg; Poland, where it was 6,61 EUR/kg;
Spain, where it was 7,00 EUR/kg.
Smoked salmon is mainly traded by Poland, the major EU producer of
this product. In 2017, the value of such exports reached a 10-year peak
at EUR 648 million, marking a 3% increase over 2016, while volumes
declined 13%, dropping to 41.213 tonnes.
Germany is by far the main destination of Polish exports of smoked
salmon, and where, in 2017, 20.061 tonnes were sold at 16,02 EUR/kg.
This was the highest price ever reached, 22% above that of 2016 and
34% higher than the 10-year average. Consequently, the overall value of
Polish exports of smoked salmon to Germany achieved a 10-year peak
at EUR 466 million against a volume reduction of 6.187 tonnes
compared with 2016.
Small pelagics18%
Salmonids15%
Groundfish14%
Non-food use11%
Other marine fish9%
Miscellaneous aquatic products
8%
Tuna and tuna-like species
6%
Bivalves and other molluscs and aquatic
invertebrates5%
Crustaceans5%
Cephalopods4%
Flatfish3%
Freshwater fish2%
Chart 67 Intra-EU trade by commodity group
in volume (2017) Source: EUMOFA elaboration of EUROSTAT data
Salmonids
Analysis by species
Salmon
E U R O P E A N M A R K E T O B S E R V A T O R Y F O R F I S H E R I E S A N D A Q U A C U L T U R E P R O D U C T S - T H E E U F I S H M A R K E T - E D I T I O N 2 0 1 8
Import - Export
78
Groundfish traded in the EU continued the upward trend started in
2013, reaching 911.792 tonnes and EUR 3,5 billion in 2017, which was
the highest amount of the last ten years. Compared with 2016, this was
an increase of almost 70.000 tonnes and EUR 220 million.
Cod is by far the main groundfish species, and the second most valued
species in general, traded within the EU. In 2017, 425.646 tonnes of cod
were exchanged for a total value of EUR 2,1 billion.
Most of these exports originate from the Netherlands which exported
133.788 tonnes in 2017, Denmark which exported 84.066 tonnes, and
Sweden which exported 74.890 tonnes.
Cod exported by Denmark mostly consists of fresh cod, covering almost
70% of the total, sold to France and the Netherlands at average prices of
7,89 and 4,23 EUR/kg, respectively.
Dutch exports mainly include frozen products which account for 70% of
the total. They were sold to Portugal and Spain, at 3,31 and 3,49
EUR/kg.
As for Sweden, exports are more diversified. 37% of cod is exported
fresh, mainly to Denmark and Poland where it was exported at average
prices of 3,27 and 2,78 EUR/kg, respectively. Salted cod and dried
(unsalted) cod each account for one quarter of the total, and are mainly
destined for Portugal, where they were exported at average prices of
5,26 and 7,54 EUR/kg, respectively.
Intra-EU trade of small pelagics species reached a 10-year peak in 2017
at EUR 1,6 billion, for an increase of EUR 51 million over 2016. Volumes
increased by 51.780 tonnes reaching to 1,2 million tonnes.
Herring is the second most traded main commercial species in the EU,
after salmon. In 2017, flows of herring between EU Member States
totalled 463.728 tonnes worth EUR 575 million. Volumes augmented by
1% compared with 2016, increasing by 3.956 tonnes; the average price
dropped by 5% to 1,24 EUR/kg, which meant total value recorded a
decrease of EUR 26 million.
In 2017, 44% of herring was sold frozen and 30% fresh.
Prepared/preserved product accounted for almost one quarter of the
total but was responsible for the highest value share (55%). The rest was
sold as salted and smoked products.
Intra-EU exchanges of herring almost entirely originate from Denmark,
but Polish exports are the highest valued, as they mainly consist of
prepared/preserved products. For both countries, Germany is by far the
main market of destination.
Groundfish
Cod
Small pelagics
Herring
E U R O P E A N M A R K E T O B S E R V A T O R Y F O R F I S H E R I E S A N D A Q U A C U L T U R E P R O D U C T S - T H E E U F I S H M A R K E T - E D I T I O N 2 0 1 8
Import - Export
79
Despite a decline registered with respect to 2016, flows of non-food use
products between Member States in 2017 were above their 10-year
average, totalling 685.132 tonnes and EUR 833 million.
Denmark and Germany are by far the main dealers of non-food use
products in the EU. In 2017, they covered 23% and 19%, respectively, of
the total in volume terms. Both countries mostly export fishmeal to the
main markets listed in Tables 19 and 20.
Importing Member State Volume (tonnes)
Price (EUR/tonne)
% price variation
2017/2016
Greece 30.031 1.217 -13%
Italy 14.216 1.315 -13%
United Kingdom 12.792 1.254 -19%
Spain 12.049 1.330 -17%
Germany 11.228 1.335 -14%
Other EU Member States 31.766 1.386 -10%
Total 112.082 1.306 -13%
Importing Member State Volume (tonnes)
Price (EUR/tonne)
% price variation
2017/2016
Greece 15.503 1.225 -6%
France 14.220 1.340 -9%
Italy 10.180 1.268 -8%
Denmark 7.673 1.359 -5%
Czech Republic 5.836 1.157 +47%
Other EU Member States 20.136 1.373 -7%
Total 73.548 1.302 -5%
Fishmeal42%
Fish waste40%
Fish oil18%
volume
Fishmeal45%
Fish waste29%
Fish oil26%
value
Non-food use products
Chart 68 Non-food use products traded
within the EU (2017) Source: EUMOFA elaboration of EUROSTAT data
Fishmeal
Table 19 Most relevant countries of destination
of intra-EU exports of fishmeal from Denmark in 2017
Source: EUMOFA elaboration of EUROSTAT data
Table 20 Most relevant countries of destination
of intra-EU exports of fishmeal from Germany in 2017
Source: EUMOFA elaboration of EUROSTAT data
E U R O P E A N M A R K E T O B S E R V A T O R Y F O R F I S H E R I E S A N D A Q U A C U L T U R E P R O D U C T S - T H E E U F I S H M A R K E T - E D I T I O N 2 0 1 8
Import - Export
80
The value of crustaceans traded within the EU achieved a 10-year peak
in 2017 at EUR 3,2 billion, which was an increase of EUR 179 million
over 2016. In volume terms, crustaceans registered a growth of 27.373
tonnes, which led to a total of 348.551 tonnes, the highest since 2011.
While miscellaneous shrimps were mainly responsible for the upward
trend of volumes, warmwater shrimps (frozen shrimps of the species
Penaeus) generated the value rise.
Warmwater shrimps account for almost one-quarter of the value of
intra-EU trade of crustaceans. In 2017, their exchanges were the highest
ever recorded, totalling 83.931 tonnes worth EUR 775 million. This was
an increase of EUR 120 million and over 10.000 tonnes with respect to
the previous year.
They are mainly traded by the Netherlands, Belgium and Spain, which
exported 73% of the total to other EU Member States in 2017. The three
countries sold them at average prices of 8,96, 9,72 and 7,94 EUR/kg,
respectively.
Miscellaneous shrimps account for 38% of the value of crustaceans
traded within the EU, mostly comprising prepared/preserved and
frozen products. While the prepared/preserved products registered a
decrease in 2017 compared with 2016, declining by EUR 2 million to
reach EUR 779 million for 76.221 tonnes, the frozen products rose by
EUR 64 million to EUR 389 million for 49.263 tonnes.
The main traders of warmwater shrimps, Netherlands, Belgium, Spain
and Denmark, are the major traders for miscellaneous shrimps.
Crustaceans
Warmwater shrimps
Miscellaneous shrimps
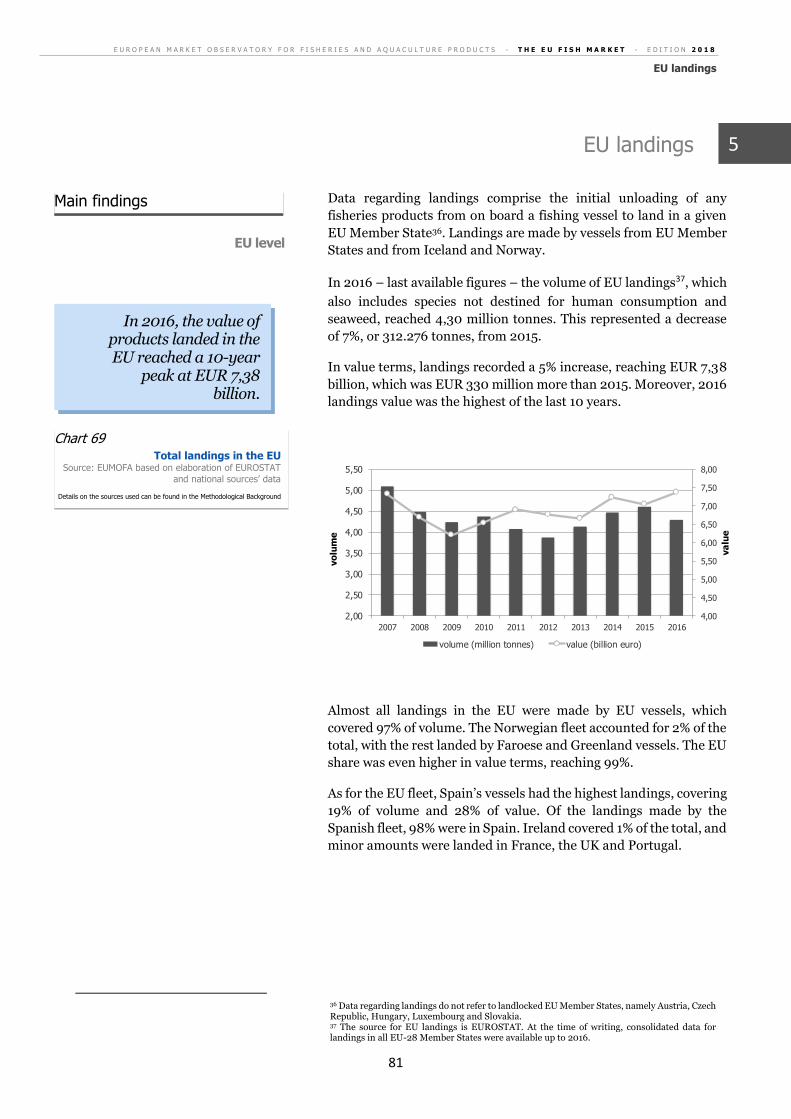
E U R O P E A N M A R K E T O B S E R V A T O R Y F O R F I S H E R I E S A N D A Q U A C U L T U R E P R O D U C T S - T H E E U F I S H M A R K E T - E D I T I O N 2 0 1 8
EU landings
81
EU landings
Data regarding landings comprise the initial unloading of any
fisheries products from on board a fishing vessel to land in a given
EU Member State36. Landings are made by vessels from EU Member
States and from Iceland and Norway.
In 2016 – last available figures – the volume of EU landings37, which
also includes species not destined for human consumption and
seaweed, reached 4,30 million tonnes. This represented a decrease
of 7%, or 312.276 tonnes, from 2015.
In value terms, landings recorded a 5% increase, reaching EUR 7,38
billion, which was EUR 330 million more than 2015. Moreover, 2016
landings value was the highest of the last 10 years.
Almost all landings in the EU were made by EU vessels, which
covered 97% of volume. The Norwegian fleet accounted for 2% of the
total, with the rest landed by Faroese and Greenland vessels. The EU
share was even higher in value terms, reaching 99%.
As for the EU fleet, Spain’s vessels had the highest landings, covering
19% of volume and 28% of value. Of the landings made by the
Spanish fleet, 98% were in Spain. Ireland covered 1% of the total, and
minor amounts were landed in France, the UK and Portugal.
36 Data regarding landings do not refer to landlocked EU Member States, namely Austria, Czech Republic, Hungary, Luxembourg and Slovakia. 37 The source for EU landings is EUROSTAT. At the time of writing, consolidated data for landings in all EU-28 Member States were available up to 2016.
4,00
4,50
5,00
5,50
6,00
6,50
7,00
7,50
8,00
2,00
2,50
3,00
3,50
4,00
4,50
5,00
5,50
2007 2008 2009 2010 2011 2012 2013 2014 2015 2016
va
lue
vo
lum
e
volume (million tonnes) value (billion euro)
In 2016, the value of products landed in the EU reached a 10-year
peak at EUR 7,38 billion.
EU level
Main findings
Chart 69 Total landings in the EU
Source: EUMOFA based on elaboration of EUROSTAT
and national sources’ data
Details on the sources used can be found in the Methodological Background
5

E U R O P E A N M A R K E T O B S E R V A T O R Y F O R F I S H E R I E S A N D A Q U A C U L T U R E P R O D U C T S - T H E E U F I S H M A R K E T - E D I T I O N 2 0 1 8
EU landings
82
* Of the 21 “other countries”, the top-3 in value terms are Denmark (6% of the total), Ireland (5%) and Portugal (3%); the top-3 in volume
terms, are Ireland (5%), Italy (4%) and Sweden (4%).
The most landed species in the EU belong to four commodity groups,
namely small pelagics, groundfish, tuna and tuna-like species,38 and
the grouping “other marine fish.”39 Together, they represent over
80% of the EU landings in volume terms.
The evolution of their volumes landed during the last ten years is
shown in Chart 71.
38This group includes swordfish and all species of tuna (albacore, bigeye, bluefin, yellowfin, skipjack and miscellaneous tunas). 39 This group includes monk, seabream, red mullet, seabass, ray, ray’s bream, cobia, cusk-eel, john dory, scabbardfish, gurnard, picarel, smelt, dogfish, weever and other sharks.
Spain28%
France14%
Italy12%
United Kingdom
12%
Netherlands7%
Other 21* countries
27%
value
Spain19%
Denmark14%
United Kingdom11%
France10%
Netherlands8%
Other 21* countries
38%
volume
2,03 mln t- 7%
0,79 mln t- 25%
0,41 mln t+ 28%
0,31 mln t- 3%0,00
0,40
0,80
1,20
1,60
2,00
2,40
2,80
2007 2008 2009 2010 2011 2012 2013 2014 2015 2016
mil
lio
n t
on
nes
Small pelagics Groundfish Tuna and tuna-like species Other marine fish
Chart 70 EU landings by vessel nationality in 2016
Source: EUROSTAT
Chart 71 Volumes of landings of most important
commodity groups and % variations 2016/2015
Source: EUMOFA based on elaboration of EUROSTAT and national sources’ data
Details on the sources used can be found in the Methodological Background
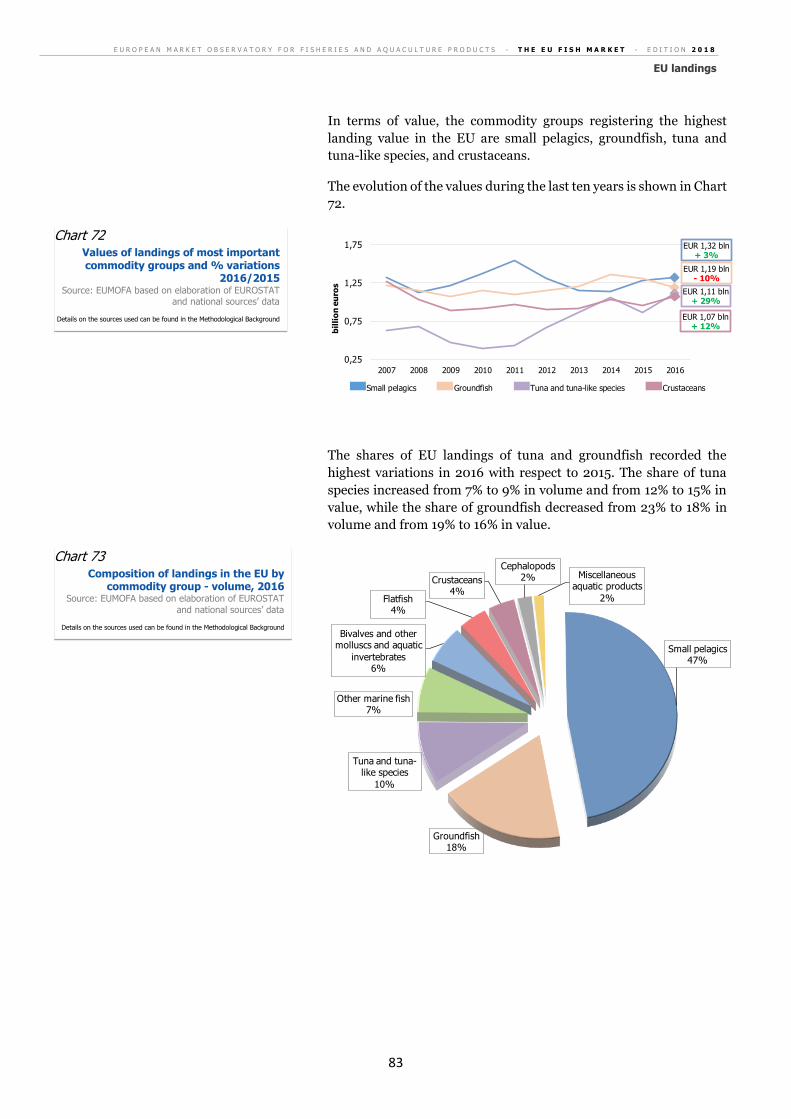
E U R O P E A N M A R K E T O B S E R V A T O R Y F O R F I S H E R I E S A N D A Q U A C U L T U R E P R O D U C T S - T H E E U F I S H M A R K E T - E D I T I O N 2 0 1 8
EU landings
83
In terms of value, the commodity groups registering the highest
landing value in the EU are small pelagics, groundfish, tuna and
tuna-like species, and crustaceans.
The evolution of the values during the last ten years is shown in Chart
72.
The shares of EU landings of tuna and groundfish recorded the
highest variations in 2016 with respect to 2015. The share of tuna
species increased from 7% to 9% in volume and from 12% to 15% in
value, while the share of groundfish decreased from 23% to 18% in
volume and from 19% to 16% in value.
EUR 1,32 bln+ 3%
EUR 1,19 bln- 10%
EUR 1,11 bln+ 29%
EUR 1,07 bln+ 12%
0,25
0,75
1,25
1,75
2007 2008 2009 2010 2011 2012 2013 2014 2015 2016
bil
lio
n e
uro
s
Small pelagics Groundfish Tuna and tuna-like species Crustaceans
Small pelagics47%
Groundfish18%
Tuna and tuna-like species
10%
Other marine fish7%
Bivalves and other molluscs and aquatic
invertebrates6%
Flatfish4%
Crustaceans4%
Cephalopods2% Miscellaneous
aquatic products
2%
Chart 72 Values of landings of most important commodity groups and % variations
2016/2015 Source: EUMOFA based on elaboration of EUROSTAT
and national sources’ data
Details on the sources used can be found in the Methodological Background
Chart 73 Composition of landings in the EU by
commodity group - volume, 2016 Source: EUMOFA based on elaboration of EUROSTAT
and national sources’ data
Details on the sources used can be found in the Methodological Background
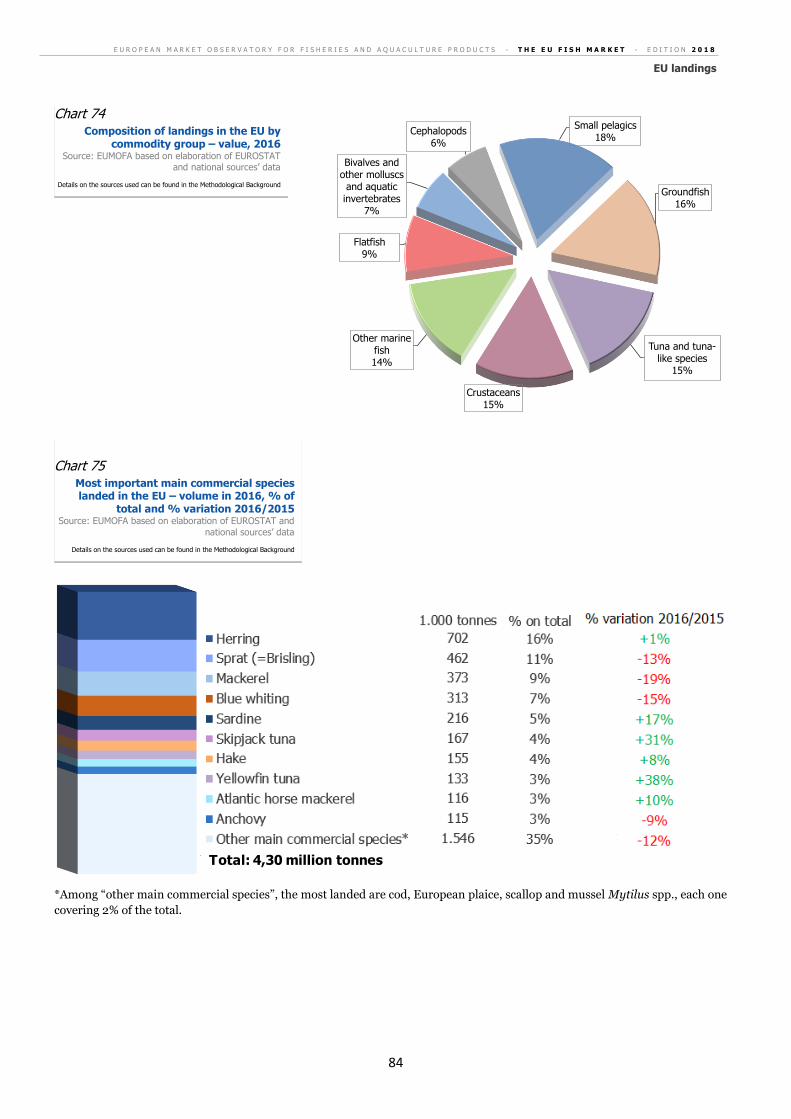
E U R O P E A N M A R K E T O B S E R V A T O R Y F O R F I S H E R I E S A N D A Q U A C U L T U R E P R O D U C T S - T H E E U F I S H M A R K E T - E D I T I O N 2 0 1 8
EU landings
84
*Among “other main commercial species”, the most landed are cod, European plaice, scallop and mussel Mytilus spp., each one
covering 2% of the total.
Small pelagics18%
Groundfish16%
Tuna and tuna-like species
15%
Crustaceans15%
Other marine fish14%
Flatfish9%
Bivalves and other molluscs
and aquatic invertebrates
7%
Cephalopods6%
0%
10%
20%
30%
40%
50%
60%
70%
80%
90%
100%
1.000 tonnes % on total
Herring 743 17%
Sprat (=Brisling) 492 11%
Mackerel 374 9%
Blue whiting 313 7%
Sardine 216 5%
Tuna, skipjack 167 4%
Hake 155 4%
Tuna, yellowfin 133 3%
Horse mackerel, Atlantic 116 3%
Anchovy 115 3%
Other main commercial species 1.552 34%
Total: 4,30 million tonnes
Chart 74 Composition of landings in the EU by
commodity group – value, 2016 Source: EUMOFA based on elaboration of EUROSTAT
and national sources’ data
Details on the sources used can be found in the Methodological Background
Chart 75 Most important main commercial species landed in the EU – volume in 2016, % of
total and % variation 2016/2015 Source: EUMOFA based on elaboration of EUROSTAT and
national sources’ data
Details on the sources used can be found in the Methodological Background
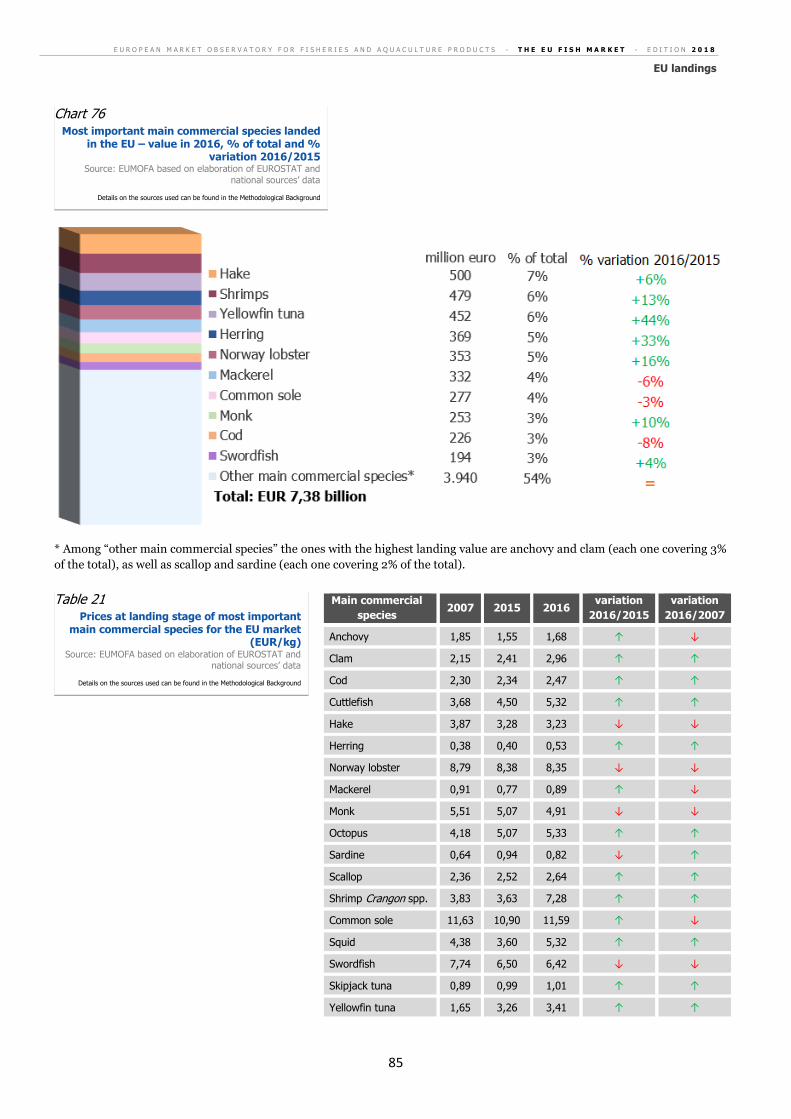
E U R O P E A N M A R K E T O B S E R V A T O R Y F O R F I S H E R I E S A N D A Q U A C U L T U R E P R O D U C T S - T H E E U F I S H M A R K E T - E D I T I O N 2 0 1 8
EU landings
85
* Among “other main commercial species” the ones with the highest landing value are anchovy and clam (each one covering 3%
of the total), as well as scallop and sardine (each one covering 2% of the total).
Main commercial
species 2007 2015 2016
variation
2016/2015
variation
2016/2007
Anchovy 1,85 1,55 1,68 ↑ ↓
Clam 2,15 2,41 2,96 ↑ ↑
Cod 2,30 2,34 2,47 ↑ ↑
Cuttlefish 3,68 4,50 5,32 ↑ ↑
Hake 3,87 3,28 3,23 ↓ ↓
Herring 0,38 0,40 0,53 ↑ ↑
Norway lobster 8,79 8,38 8,35 ↓ ↓
Mackerel 0,91 0,77 0,89 ↑ ↓
Monk 5,51 5,07 4,91 ↓ ↓
Octopus 4,18 5,07 5,33 ↑ ↑
Sardine 0,64 0,94 0,82 ↓ ↑
Scallop 2,36 2,52 2,64 ↑ ↑
Shrimp Crangon spp. 3,83 3,63 7,28 ↑ ↑
Common sole 11,63 10,90 11,59 ↑ ↓
Squid 4,38 3,60 5,32 ↑ ↑
Swordfish 7,74 6,50 6,42 ↓ ↓
Skipjack tuna 0,89 0,99 1,01 ↑ ↑
Yellowfin tuna 1,65 3,26 3,41 ↑ ↑
Chart 76 Most important main commercial species landed
in the EU – value in 2016, % of total and % variation 2016/2015
Source: EUMOFA based on elaboration of EUROSTAT and
national sources’ data
Details on the sources used can be found in the Methodological Background
Table 21 Prices at landing stage of most important
main commercial species for the EU market (EUR/kg)
Source: EUMOFA based on elaboration of EUROSTAT and national sources’ data
Details on the sources used can be found in the Methodological Background
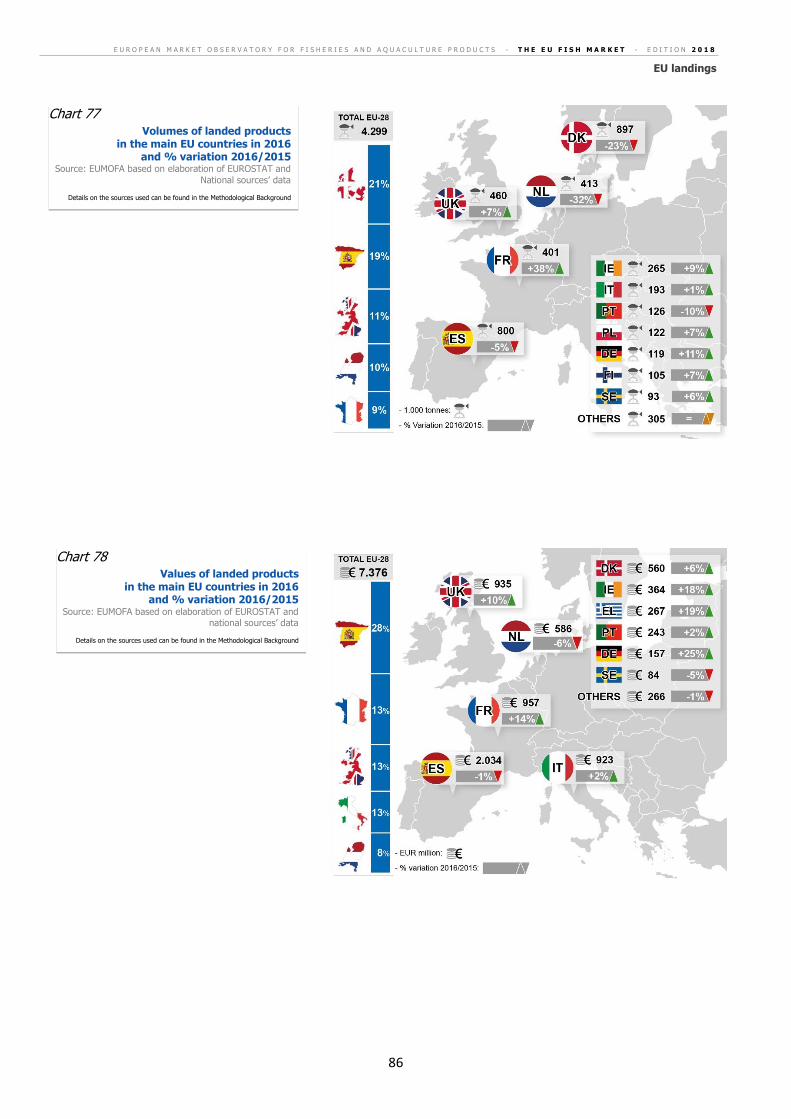
E U R O P E A N M A R K E T O B S E R V A T O R Y F O R F I S H E R I E S A N D A Q U A C U L T U R E P R O D U C T S - T H E E U F I S H M A R K E T - E D I T I O N 2 0 1 8
EU landings
86
Chart 77 Volumes of landed products
in the main EU countries in 2016 and % variation 2016/2015
Source: EUMOFA based on elaboration of EUROSTAT and
National sources’ data
Details on the sources used can be found in the Methodological Background
Chart 78 Values of landed products
in the main EU countries in 2016 and % variation 2016/2015
Source: EUMOFA based on elaboration of EUROSTAT and national sources’ data
Details on the sources used can be found in the Methodological Background
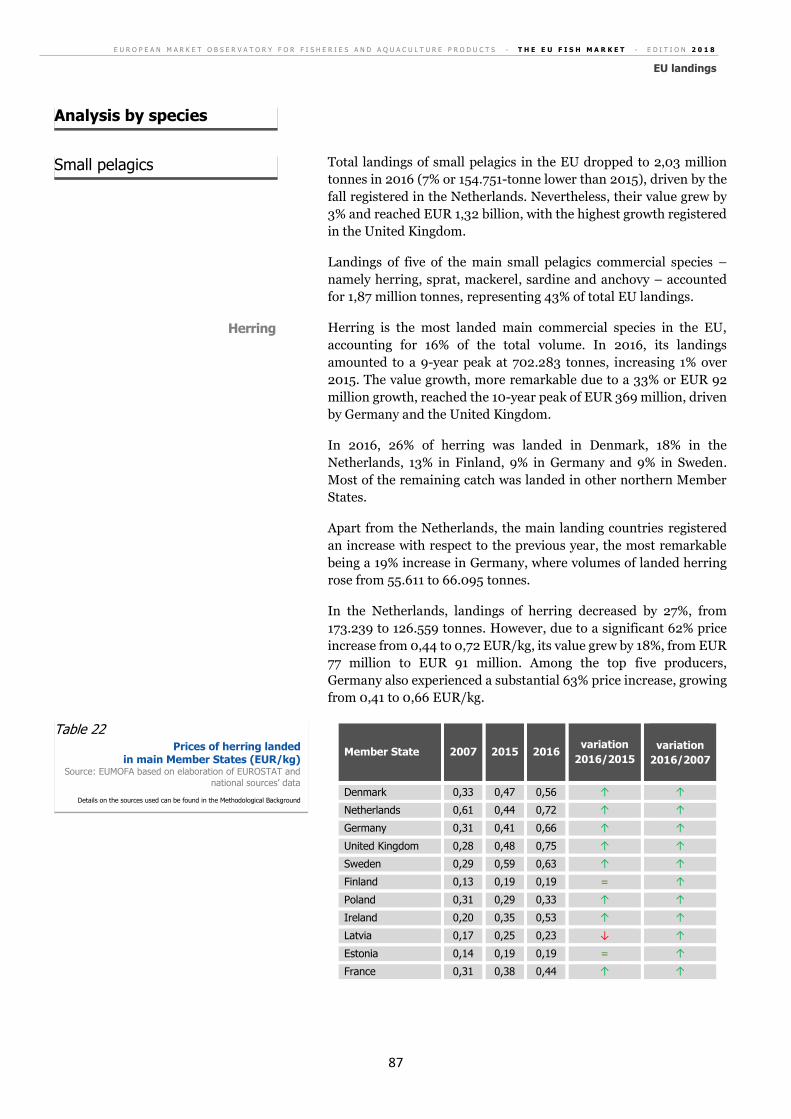
E U R O P E A N M A R K E T O B S E R V A T O R Y F O R F I S H E R I E S A N D A Q U A C U L T U R E P R O D U C T S - T H E E U F I S H M A R K E T - E D I T I O N 2 0 1 8
EU landings
87
Total landings of small pelagics in the EU dropped to 2,03 million
tonnes in 2016 (7% or 154.751-tonne lower than 2015), driven by the
fall registered in the Netherlands. Nevertheless, their value grew by
3% and reached EUR 1,32 billion, with the highest growth registered
in the United Kingdom.
Landings of five of the main small pelagics commercial species –
namely herring, sprat, mackerel, sardine and anchovy – accounted
for 1,87 million tonnes, representing 43% of total EU landings.
Herring is the most landed main commercial species in the EU,
accounting for 16% of the total volume. In 2016, its landings
amounted to a 9-year peak at 702.283 tonnes, increasing 1% over
2015. The value growth, more remarkable due to a 33% or EUR 92
million growth, reached the 10-year peak of EUR 369 million, driven
by Germany and the United Kingdom.
In 2016, 26% of herring was landed in Denmark, 18% in the
Netherlands, 13% in Finland, 9% in Germany and 9% in Sweden.
Most of the remaining catch was landed in other northern Member
States.
Apart from the Netherlands, the main landing countries registered
an increase with respect to the previous year, the most remarkable
being a 19% increase in Germany, where volumes of landed herring
rose from 55.611 to 66.095 tonnes.
In the Netherlands, landings of herring decreased by 27%, from
173.239 to 126.559 tonnes. However, due to a significant 62% price
increase from 0,44 to 0,72 EUR/kg, its value grew by 18%, from EUR
77 million to EUR 91 million. Among the top five producers,
Germany also experienced a substantial 63% price increase, growing
from 0,41 to 0,66 EUR/kg.
Member State 2007 2015 2016 variation
2016/2015
variation
2016/2007
Denmark 0,33 0,47 0,56 ↑ ↑
Netherlands 0,61 0,44 0,72 ↑ ↑
Germany 0,31 0,41 0,66 ↑ ↑
United Kingdom 0,28 0,48 0,75 ↑ ↑
Sweden 0,29 0,59 0,63 ↑ ↑
Finland 0,13 0,19 0,19 = ↑
Poland 0,31 0,29 0,33 ↑ ↑
Ireland 0,20 0,35 0,53 ↑ ↑
Latvia 0,17 0,25 0,23 ↓ ↑
Estonia 0,14 0,19 0,19 = ↑
France 0,31 0,38 0,44 ↑ ↑
Analysis by species
Small pelagics
Herring
Table 22 Prices of herring landed
in main Member States (EUR/kg) Source: EUMOFA based on elaboration of EUROSTAT and
national sources’ data
Details on the sources used can be found in the Methodological Background
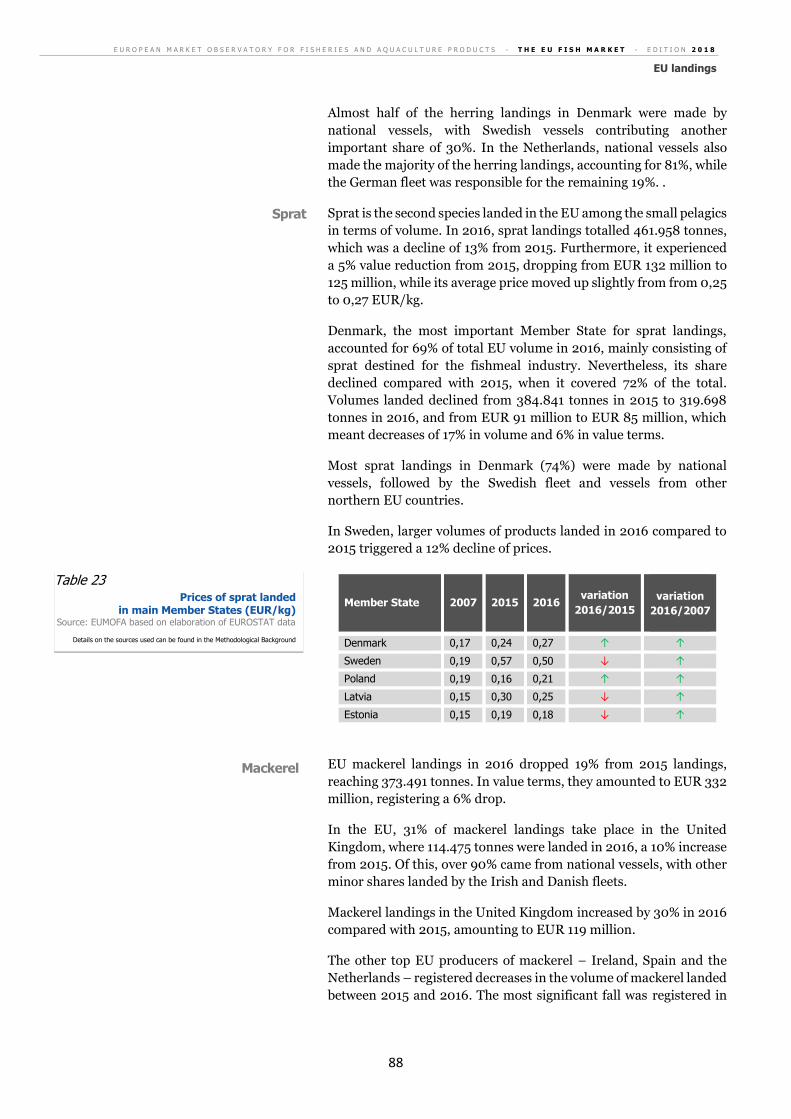
E U R O P E A N M A R K E T O B S E R V A T O R Y F O R F I S H E R I E S A N D A Q U A C U L T U R E P R O D U C T S - T H E E U F I S H M A R K E T - E D I T I O N 2 0 1 8
EU landings
88
Almost half of the herring landings in Denmark were made by
national vessels, with Swedish vessels contributing another
important share of 30%. In the Netherlands, national vessels also
made the majority of the herring landings, accounting for 81%, while
the German fleet was responsible for the remaining 19%. .
Sprat is the second species landed in the EU among the small pelagics
in terms of volume. In 2016, sprat landings totalled 461.958 tonnes,
which was a decline of 13% from 2015. Furthermore, it experienced
a 5% value reduction from 2015, dropping from EUR 132 million to
125 million, while its average price moved up slightly from from 0,25
to 0,27 EUR/kg.
Denmark, the most important Member State for sprat landings,
accounted for 69% of total EU volume in 2016, mainly consisting of
sprat destined for the fishmeal industry. Nevertheless, its share
declined compared with 2015, when it covered 72% of the total.
Volumes landed declined from 384.841 tonnes in 2015 to 319.698
tonnes in 2016, and from EUR 91 million to EUR 85 million, which
meant decreases of 17% in volume and 6% in value terms.
Most sprat landings in Denmark (74%) were made by national
vessels, followed by the Swedish fleet and vessels from other
northern EU countries.
In Sweden, larger volumes of products landed in 2016 compared to
2015 triggered a 12% decline of prices.
Member State 2007 2015 2016 variation
2016/2015
variation
2016/2007
Denmark 0,17 0,24 0,27 ↑ ↑
Sweden 0,19 0,57 0,50 ↓ ↑
Poland 0,19 0,16 0,21 ↑ ↑
Latvia 0,15 0,30 0,25 ↓ ↑
Estonia 0,15 0,19 0,18 ↓ ↑
EU mackerel landings in 2016 dropped 19% from 2015 landings,
reaching 373.491 tonnes. In value terms, they amounted to EUR 332
million, registering a 6% drop.
In the EU, 31% of mackerel landings take place in the United
Kingdom, where 114.475 tonnes were landed in 2016, a 10% increase
from 2015. Of this, over 90% came from national vessels, with other
minor shares landed by the Irish and Danish fleets.
Mackerel landings in the United Kingdom increased by 30% in 2016
compared with 2015, amounting to EUR 119 million.
The other top EU producers of mackerel – Ireland, Spain and the
Netherlands – registered decreases in the volume of mackerel landed
between 2015 and 2016. The most significant fall was registered in
Sprat
Table 23 Prices of sprat landed
in main Member States (EUR/kg) Source: EUMOFA based on elaboration of EUROSTAT data
Details on the sources used can be found in the Methodological Background
Mackerel
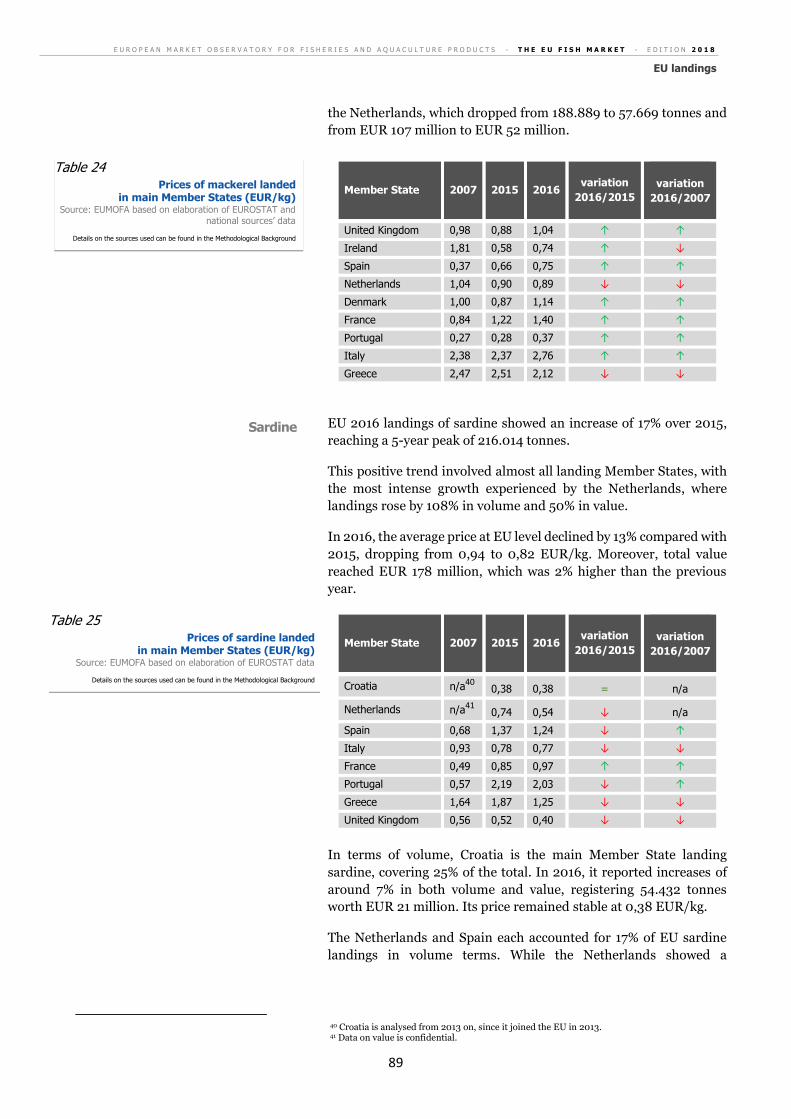
E U R O P E A N M A R K E T O B S E R V A T O R Y F O R F I S H E R I E S A N D A Q U A C U L T U R E P R O D U C T S - T H E E U F I S H M A R K E T - E D I T I O N 2 0 1 8
EU landings
89
the Netherlands, which dropped from 188.889 to 57.669 tonnes and
from EUR 107 million to EUR 52 million.
Member State 2007 2015 2016 variation
2016/2015
variation
2016/2007
United Kingdom 0,98 0,88 1,04 ↑ ↑
Ireland 1,81 0,58 0,74 ↑ ↓
Spain 0,37 0,66 0,75 ↑ ↑
Netherlands 1,04 0,90 0,89 ↓ ↓
Denmark 1,00 0,87 1,14 ↑ ↑
France 0,84 1,22 1,40 ↑ ↑
Portugal 0,27 0,28 0,37 ↑ ↑
Italy 2,38 2,37 2,76 ↑ ↑
Greece 2,47 2,51 2,12 ↓ ↓
EU 2016 landings of sardine showed an increase of 17% over 2015,
reaching a 5-year peak of 216.014 tonnes.
This positive trend involved almost all landing Member States, with
the most intense growth experienced by the Netherlands, where
landings rose by 108% in volume and 50% in value.
In 2016, the average price at EU level declined by 13% compared with
2015, dropping from 0,94 to 0,82 EUR/kg. Moreover, total value
reached EUR 178 million, which was 2% higher than the previous
year.
Member State 2007 2015 2016 variation
2016/2015
variation
2016/2007
Croatia n/a40
0,38 0,38 = n/a
Netherlands n/a41
0,74 0,54 ↓ n/a
Spain 0,68 1,37 1,24 ↓ ↑
Italy 0,93 0,78 0,77 ↓ ↓
France 0,49 0,85 0,97 ↑ ↑
Portugal 0,57 2,19 2,03 ↓ ↑
Greece 1,64 1,87 1,25 ↓ ↓
United Kingdom 0,56 0,52 0,40 ↓ ↓
In terms of volume, Croatia is the main Member State landing
sardine, covering 25% of the total. In 2016, it reported increases of
around 7% in both volume and value, registering 54.432 tonnes
worth EUR 21 million. Its price remained stable at 0,38 EUR/kg.
The Netherlands and Spain each accounted for 17% of EU sardine
landings in volume terms. While the Netherlands showed a
40 Croatia is analysed from 2013 on, since it joined the EU in 2013. 41 Data on value is confidential.
Table 24 Prices of mackerel landed
in main Member States (EUR/kg) Source: EUMOFA based on elaboration of EUROSTAT and
national sources’ data
Details on the sources used can be found in the Methodological Background
Sardine
Table 25 Prices of sardine landed
in main Member States (EUR/kg) Source: EUMOFA based on elaboration of EUROSTAT data
Details on the sources used can be found in the Methodological Background

E U R O P E A N M A R K E T O B S E R V A T O R Y F O R F I S H E R I E S A N D A Q U A C U L T U R E P R O D U C T S - T H E E U F I S H M A R K E T - E D I T I O N 2 0 1 8
EU landings
90
skyrocketing growth in 2016 compared with 2015, Spain maintained
a flat trend.
After the peaks reached in 2015 in both volume and value terms, EU
landings of anchovy decreased 9% in 2016, dropping to 115.052
tonnes. The average price increased by 9%, moving from 1,55 to 1,68
EUR/kg, thus determining an overall value of EUR 193 million,
which was 2% lower than in 2015.
Spain, the main EU landing country, accounted for 40% of the total.
However, this marked a decrease in its share, as landings of anchovy
decreased from 49.922 in 2015 to 46.192 tonnes in 2016, and from
EUR 86 million to EUR 82 million. The price slightly augmented,
reaching 1,77 EUR/kg, 3% more than 2015 and 6% above the EU
average price.
Italy, another important landing country for anchovy, contributed
33% of EU landings. Here, a 3% price increase led to a total value of
EUR 66 million, the highest since 2013.
Member State 2007 2015 2016 variation
2016/2015
variation
2016/2007
Spain 2,27 1,72 1,77 ↑ ↓
Italy 1,70 1,68 1,73 ↑ ↑
Greece 2,08 1,50 1,58 ↑ ↓
Portugal 3,32 1,90 1,70 ↓ ↓
Croatia n/a42
0,85 0,94 ↑ n/a
France 2,17 1,85 1,96 ↑ ↓
In 2016, landings of groundfish in the EU decreased by 25% from
2015, reaching 789.753 tonnes, the lowest total of the last 4 years. In
value terms, landings dropped to EUR 1,19 billion, a 10% decrease
from 2015.
The most landed groundfish species in the EU are blue whiting, hake,
and cod. In 2016, landings of the three totalled 559.167 tonnes, which
amounted to 13% of total landings.
Of all finfish landed, hake has the highest value, with European hake
(Merluccius merluccius) representing 76% of the total hake in the
EU.
In 2016, the volume of hake landings increased by 8% over 2015,
reaching 154.877 tonnes, a 10-year peak resulting from a fluctuating
but generally upward trend. Moreover, despite a slight 2% price
reduction, total value increased by 6%, from EUR 470 million to EUR
500 million.
Hake landed in Spain had the highest value, covering 45% of the
total. Italy followed at 13% while Ireland and the UK each accounted
42 Croatia is analysed from 2013 on, since it joined the EU in 2013.
Anchovy
Table 26 Prices of anchovy landed
in main Member States (EUR/kg) Source: EUMOFA based on elaboration of EUROSTAT data
Details on the sources used can be found in the Methodological Background
Groundfish
Hake
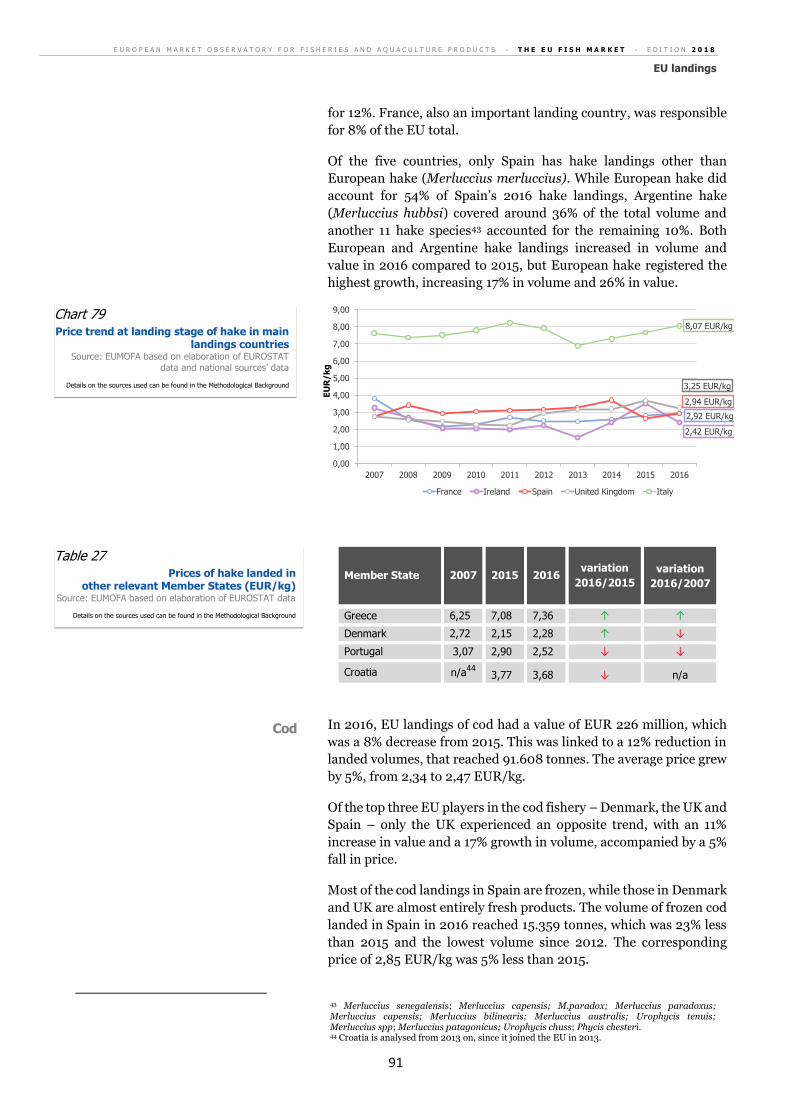
E U R O P E A N M A R K E T O B S E R V A T O R Y F O R F I S H E R I E S A N D A Q U A C U L T U R E P R O D U C T S - T H E E U F I S H M A R K E T - E D I T I O N 2 0 1 8
EU landings
91
for 12%. France, also an important landing country, was responsible
for 8% of the EU total.
Of the five countries, only Spain has hake landings other than
European hake (Merluccius merluccius). While European hake did
account for 54% of Spain’s 2016 hake landings, Argentine hake
(Merluccius hubbsi) covered around 36% of the total volume and
another 11 hake species43 accounted for the remaining 10%. Both
European and Argentine hake landings increased in volume and
value in 2016 compared to 2015, but European hake registered the
highest growth, increasing 17% in volume and 26% in value.
Member State 2007 2015 2016 variation
2016/2015
variation
2016/2007
Greece 6,25 7,08 7,36 ↑ ↑
Denmark 2,72 2,15 2,28 ↑ ↓
Portugal 3,07 2,90 2,52 ↓ ↓
Croatia n/a44
3,77 3,68 ↓ n/a
In 2016, EU landings of cod had a value of EUR 226 million, which
was a 8% decrease from 2015. This was linked to a 12% reduction in
landed volumes, that reached 91.608 tonnes. The average price grew
by 5%, from 2,34 to 2,47 EUR/kg.
Of the top three EU players in the cod fishery – Denmark, the UK and
Spain – only the UK experienced an opposite trend, with an 11%
increase in value and a 17% growth in volume, accompanied by a 5%
fall in price.
Most of the cod landings in Spain are frozen, while those in Denmark
and UK are almost entirely fresh products. The volume of frozen cod
landed in Spain in 2016 reached 15.359 tonnes, which was 23% less
than 2015 and the lowest volume since 2012. The corresponding
price of 2,85 EUR/kg was 5% less than 2015.
43 Merluccius senegalensis; Merluccius capensis; M.paradox; Merluccius paradoxus; Merluccius capensis; Merluccius bilinearis; Merluccius australis; Urophycis tenuis; Merluccius spp; Merluccius patagonicus; Urophycis chuss; Phycis chesteri. 44 Croatia is analysed from 2013 on, since it joined the EU in 2013.
2,92 EUR/kg
2,42 EUR/kg
2,94 EUR/kg
3,25 EUR/kg
8,07 EUR/kg
0,00
1,00
2,00
3,00
4,00
5,00
6,00
7,00
8,00
9,00
2007 2008 2009 2010 2011 2012 2013 2014 2015 2016
EU
R/k
g
France Ireland Spain United Kingdom Italy
Chart 79 Price trend at landing stage of hake in main
landings countries Source: EUMOFA based on elaboration of EUROSTAT
data and national sources’ data
Details on the sources used can be found in the Methodological Background
Table 27 Prices of hake landed in
other relevant Member States (EUR/kg) Source: EUMOFA based on elaboration of EUROSTAT data
Details on the sources used can be found in the Methodological Background
Cod

E U R O P E A N M A R K E T O B S E R V A T O R Y F O R F I S H E R I E S A N D A Q U A C U L T U R E P R O D U C T S - T H E E U F I S H M A R K E T - E D I T I O N 2 0 1 8
EU landings
92
Fresh cod landed in the UK reached a 10-year peak at 15.471 tonnes.
Moreover, despite a 3% decrease in fixed cod price at 2,97 EUR/kg,
its total value touched a new decade peak.
The 20.188 tonnes of fresh cod landed in Denmark were sold at 2,78
EUR/kg. This was a 10% price increase from 2015, while volume
remained steady.
Member State 2007 2015 2016 variation
2016/2015
variation
2016/2007
Denmark 2,78 2,49 2,78 ↑ =
United Kingdom 3,04 3,07 2,90 ↓ ↓
Spain 0,63 3,02 2,85 ↓ ↑
France 3,15 3,25 3,65 ↑ ↑
Poland 1,60 1,11 1,26 ↑ ↓
Germany 2,33 2,84 2,94 ↑ ↑
Sweden 1,92 1,36 1,45 ↑ ↓
EU landings of blue whiting in 2016 recorded a significant fall,
dropping to 312.682 tonnes and EUR 107 million, which were,
respectively, 15% and 16% less than 2015.
Landings of this species mainly consist of fresh products, of which
half were landed in Denmark. This country recorded a downward
trend, as blue whiting landings diminished by 16% to 155.262 tonnes.
However, due to a 26% price increase, from 0,25 to 0,31 EUR/kg, its
value grew by 6% and reached the 10-years peak of EUR 48 million.
It has to be underlined that, while other EU Member States use blue
whiting for human consumption, Denmark uses it almost entirely for
fishmeal production.
The Netherlands accounted for 20% of EU landings of blue whiting,
mainly dealing with frozen products. They experienced the strongest
reduction compared with 2015, as volumes decreased by 37%,
reaching 63.763 tonnes. However, except for the 2015 peak, total
volumes were the highest of the last 8 years. Nonetheless, a 46%
value fall dropped the total to EUR 12 million.
Member State 2007 2015 2016 variation
2016/2015
variation
2016/2007
Denmark 0,20 0,25 0,31 ↑ ↑
Netherlands 0,40 0,22 0,18 ↓ ↓
Ireland 0,14 0,47 0,20 ↓ ↑
Spain 0,88 0,98 1,05 ↑ ↑
United Kingdom 0,22 0,23 0,24 ↑ ↑
Germany 0,30 0,31 0,34 ↑ ↑
France 0,10 1,55 0,60 ↓ ↑
Table 28 Prices of cod landed
in main Member States (EUR/kg) Source: EUMOFA based on elaboration of EUROSTAT data
Details on the sources used can be found in the Methodological Background
Blue whiting
Table 29 Prices of blue whiting landed
in main Member States (EUR/kg) Source: EUMOFA based on elaboration of EUROSTAT data
Details on the sources used can be found in the Methodological Background

E U R O P E A N M A R K E T O B S E R V A T O R Y F O R F I S H E R I E S A N D A Q U A C U L T U R E P R O D U C T S - T H E E U F I S H M A R K E T - E D I T I O N 2 0 1 8
EU landings
93
Crustacean landings increased by 13% in value and by a slight 2% in
volume from 2015. With 164.924 tonnes landed, they occupied the
seventh position in volume terms among all commodity groups, but
ranked fourth in value, with a total of EUR 1,07 billion.
With 54.517 tonnes worth EUR 479 million, shrimps ranked second
after hake among most valued products landed in the EU in 2016.
The main EU countries where they are landed vary, because they land
different species.
Deep-water rose shrimps are mainly landed in Italy, where in 2016,
their landings amounted to 8.833 tonnes worth EUR 56 million,
marking a 3% decrease from 2015. Spain, the second largest market,
landed 2.278 tonnes valued at EUR 24 million which represented
decreases of 31% and 48%, respectively, in volume and value.
Italy is also an important landing country for warmwater shrimps,
represented exclusively by Caramote prawns (Penaeus kerathurus).
Its 2016 Caramote landings reached 1.126 tonnes and EUR 20
million, which were increases of 5% and 12%, respectively, from
2015.
The Netherlands accounts for more than 60% of the Crangon shrimp
landed in the EU. In 2016, the species landings in this country
amounted to 16.157 tonnes, 3% less than 2015. However, a 92% price
increase gave the landings a value of EUR 113 million, which
represented a significant 85% increase from 2015. Germany followed
with 5.880 tonnes and EUR 45 million, which meant a 46% decrease
in volume and, at the same time, a 121% price growth and, in turn, a
19% increase in value terms. The remarkable price increases of
Crangon shrimp registered in almost all EU Member States were due
to a deficit suffered by the overall EU production.
Other types of cold-water shrimps landed in the EU are mainly
northern prawn, almost entirely landed in Sweden, which accounted
for 1.954 tonnes worth EUR 17 million, and Denmark, which landed
1.719 tonnes worth EUR 8 million. Compared with 2015, Sweden
registered a growth of 14% in volume and 6% in value, while
Denmark recorded a drop of 17% in volume and a slight 1% increase
in value.
When it comes to the “miscellaneous shrimps” grouping, Italy
registered landings for 3.350 tonnes worth EUR 72 million, mostly
of giant red shrimp (Aristaeomorpha foliacea). This represented a
4% increase in volume and a value steadiness with respect to 2015.
In Spain, landings of miscellaneous shrimps consisted mainly of
striped red shrimps (Aristeus varidens) and blue and red shrimps
(Aristeus antennatus), the first being responsible for the overall 6%
value growth of this grouping’s landings in the country. Overall, their
landings totalled 3.164 tonnes with a value of EUR 54 million.
Crustaceans
Shrimps
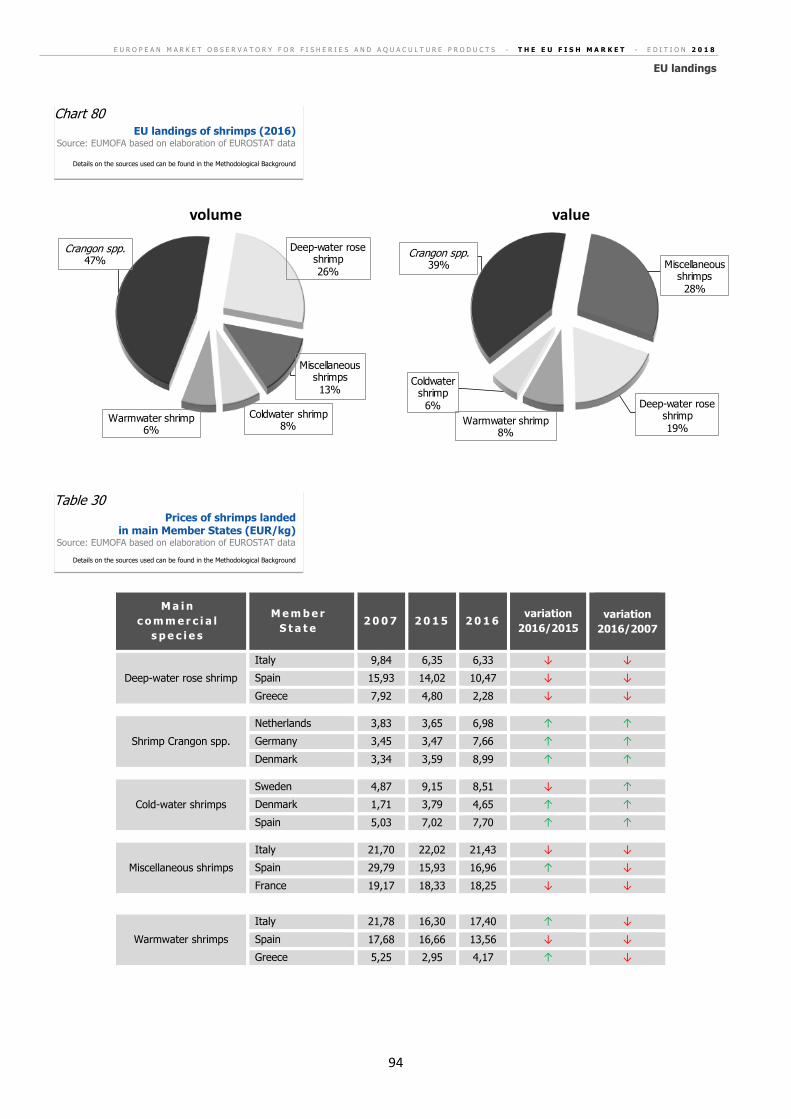
E U R O P E A N M A R K E T O B S E R V A T O R Y F O R F I S H E R I E S A N D A Q U A C U L T U R E P R O D U C T S - T H E E U F I S H M A R K E T - E D I T I O N 2 0 1 8
EU landings
94
M a i n
c o m m e r c i a l
s p e c i e s
M e m b e r
S t a t e 2 0 0 7 2 0 1 5 2 0 1 6
variation
2016/2015
variation
2016/2007
Deep-water rose shrimp
Italy 9,84 6,35 6,33 ↓ ↓
Spain 15,93 14,02 10,47 ↓ ↓
Greece 7,92 4,80 2,28 ↓ ↓
Shrimp Crangon spp.
Netherlands 3,83 3,65 6,98 ↑ ↑
Germany 3,45 3,47 7,66 ↑ ↑
Denmark 3,34 3,59 8,99 ↑ ↑
Cold-water shrimps
Sweden 4,87 9,15 8,51 ↓ ↑
Denmark 1,71 3,79 4,65 ↑ ↑
Spain 5,03 7,02 7,70 ↑ ↑
Miscellaneous shrimps
Italy 21,70 22,02 21,43 ↓ ↓
Spain 29,79 15,93 16,96 ↑ ↓
France 19,17 18,33 18,25 ↓ ↓
Warmwater shrimps
Italy 21,78 16,30 17,40 ↑ ↓
Spain 17,68 16,66 13,56 ↓ ↓
Greece 5,25 2,95 4,17 ↑ ↓
Crangon spp.47%
Deep-water rose shrimp26%
Miscellaneous shrimps13%
Coldwater shrimp8%
Warmwater shrimp6%
volume
Crangon spp.39% Miscellaneous
shrimps28%
Deep-water rose shrimp19%
Warmwater shrimp8%
Coldwater shrimp
6%
value
Chart 80 EU landings of shrimps (2016)
Source: EUMOFA based on elaboration of EUROSTAT data
Details on the sources used can be found in the Methodological Background
Table 30 Prices of shrimps landed
in main Member States (EUR/kg) Source: EUMOFA based on elaboration of EUROSTAT data
Details on the sources used can be found in the Methodological Background
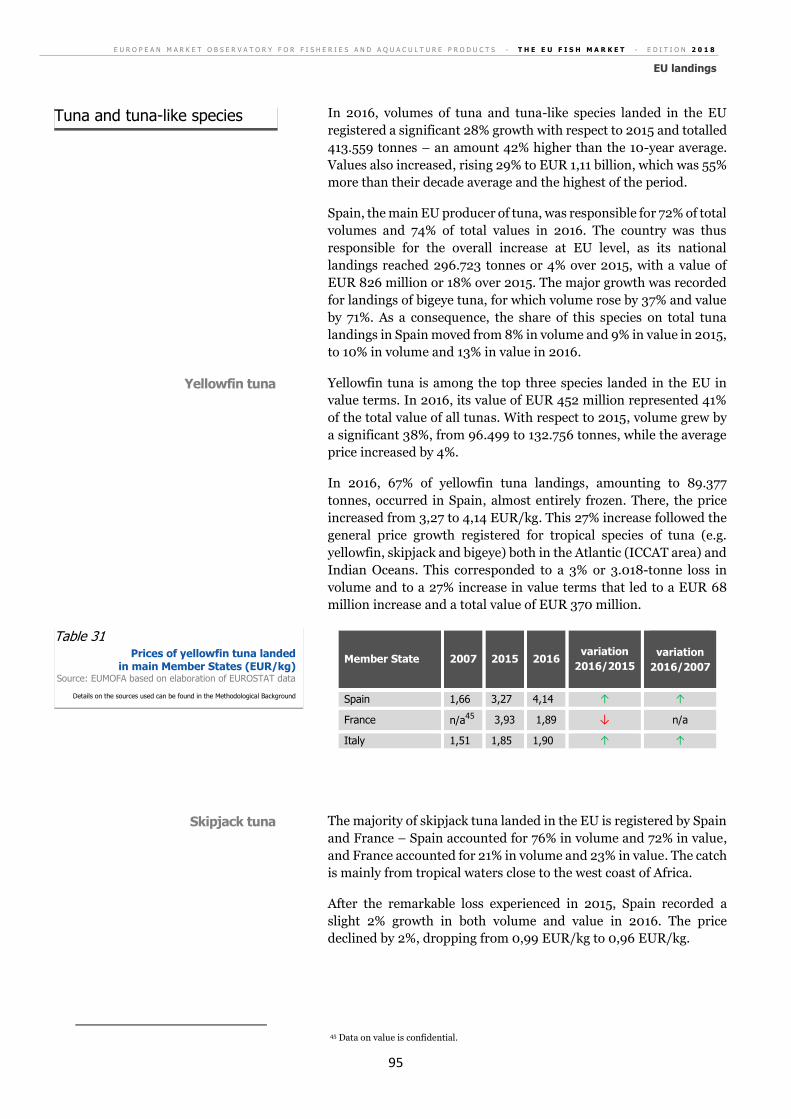
E U R O P E A N M A R K E T O B S E R V A T O R Y F O R F I S H E R I E S A N D A Q U A C U L T U R E P R O D U C T S - T H E E U F I S H M A R K E T - E D I T I O N 2 0 1 8
EU landings
95
In 2016, volumes of tuna and tuna-like species landed in the EU
registered a significant 28% growth with respect to 2015 and totalled
413.559 tonnes – an amount 42% higher than the 10-year average.
Values also increased, rising 29% to EUR 1,11 billion, which was 55%
more than their decade average and the highest of the period.
Spain, the main EU producer of tuna, was responsible for 72% of total
volumes and 74% of total values in 2016. The country was thus
responsible for the overall increase at EU level, as its national
landings reached 296.723 tonnes or 4% over 2015, with a value of
EUR 826 million or 18% over 2015. The major growth was recorded
for landings of bigeye tuna, for which volume rose by 37% and value
by 71%. As a consequence, the share of this species on total tuna
landings in Spain moved from 8% in volume and 9% in value in 2015,
to 10% in volume and 13% in value in 2016.
Yellowfin tuna is among the top three species landed in the EU in
value terms. In 2016, its value of EUR 452 million represented 41%
of the total value of all tunas. With respect to 2015, volume grew by
a significant 38%, from 96.499 to 132.756 tonnes, while the average
price increased by 4%.
In 2016, 67% of yellowfin tuna landings, amounting to 89.377
tonnes, occurred in Spain, almost entirely frozen. There, the price
increased from 3,27 to 4,14 EUR/kg. This 27% increase followed the
general price growth registered for tropical species of tuna (e.g.
yellowfin, skipjack and bigeye) both in the Atlantic (ICCAT area) and
Indian Oceans. This corresponded to a 3% or 3.018-tonne loss in
volume and to a 27% increase in value terms that led to a EUR 68
million increase and a total value of EUR 370 million.
Member State 2007 2015 2016 variation
2016/2015
variation
2016/2007
Spain 1,66 3,27 4,14 ↑ ↑
France n/a45
3,93 1,89 ↓ n/a
Italy 1,51 1,85 1,90 ↑ ↑
The majority of skipjack tuna landed in the EU is registered by Spain
and France – Spain accounted for 76% in volume and 72% in value,
and France accounted for 21% in volume and 23% in value. The catch
is mainly from tropical waters close to the west coast of Africa.
After the remarkable loss experienced in 2015, Spain recorded a
slight 2% growth in both volume and value in 2016. The price
declined by 2%, dropping from 0,99 EUR/kg to 0,96 EUR/kg.
45 Data on value is confidential.
Tuna and tuna-like species
Yellowfin tuna
Table 31 Prices of yellowfin tuna landed
in main Member States (EUR/kg) Source: EUMOFA based on elaboration of EUROSTAT data
Details on the sources used can be found in the Methodological Background
Skipjack tuna

E U R O P E A N M A R K E T O B S E R V A T O R Y F O R F I S H E R I E S A N D A Q U A C U L T U R E P R O D U C T S - T H E E U F I S H M A R K E T - E D I T I O N 2 0 1 8
EU landings
96
Member State 2007 2015 2016 variation
2016/2015
variation
2016/2007
Spain 0,90 0,99 0,96 ↓ ↑
France 5,19 0,58 0,95 ↑ ↓
Italy 0,93 1,87 4,74 ↑ ↑
The EU swordfish fisheries stretch from the Meditteranean and the
Atlantic, to the Indian Ocean and the Pacific. This species is among
the top ten landed in the EU in value terms. In 2016, it grew by 4%
in value and 5% in volume, reaching EUR 194 million and 30.232
tonnes.
Of this, Spain landed 78%, which totalled 23.585 tonnes worth EUR
137 million, recording increases of 7% in value and 9% in volume
against 2015. Its price was 5,85 EUR/kg, 2% lower than the previous
year and 9% less than the EU average.
Member State 2007 2015 2016 variation
2016/2015
variation
2016/2007
Spain 6,84 5,92 5,81 ↓ ↓
Italy 12,52 9,23 9,27 ↑ ↓
France 10,51 6,12 9,11 ↑ ↓
In 2016, EU landings of the commodity group “Other marine fish”
decreased by 3% in both volume and value terms from 2015, reaching
307.129 tonnes and EUR 1,03 billion. On the other hand, monk, one
of the main species of this group, registered both volume and value
increases.
* The grouping “Other seabreams” includes bogue (48% of the total), common
pandora and black seabream (8% each), large-eye dentex (7%), white seabream and
axillary seabream (5% each), red porgy (4%), blackspot seabream (3%), sand
steenbras, saddled seabream, common two-banded seabream, common dentex and
dentex nei (2% each) and annular seabream and red pandora (1% each).
** The grouping “Other sharks” includes blue shark (59%), small-spotted catshark
(19%), shortfin mako and smooth-hounds nei (7% each) and smooth-hound,
catsharks, nursehounds nei, tope shark, catsharks nei and blackspotted smooth-
hound (1% each).
17.427
20.558
40.653
41.532
51.541
- 10.000 20.000 30.000 40.000 50.000 60.000
Ray
Red mullet
Othersharks**
Seabream,other*
Monk
tonnes
4,91 EUR/kg ↘
3,17 EUR/kg ↗
1,60 EUR/kg ↓
6,32 EUR/kg ↑
2,33 EUR/kg ↗
+ 14%
+ 5%
- 4%
- 9%
- 5%
Table 32 Prices of skipjack tuna landed
in main Member States (EUR/kg) Source: EUMOFA based on elaboration of EUROSTAT data
Details on the sources used can be found in the Methodological Background
Swordfish
Table 33 Prices of swordfish landed
in main Member States (EUR/kg) Source: EUMOFA based on elaboration of EUROSTAT data
Details on the sources used can be found in the Methodological Background
Other marine fish
Chart 81 Main species of “Other marine fish” in 2016:
volume, % variation 2016/2015 and prices at landing stage
Source: EUMOFA based on elaboration of EUROSTAT data
Details on the sources used can be found in the Methodological Background
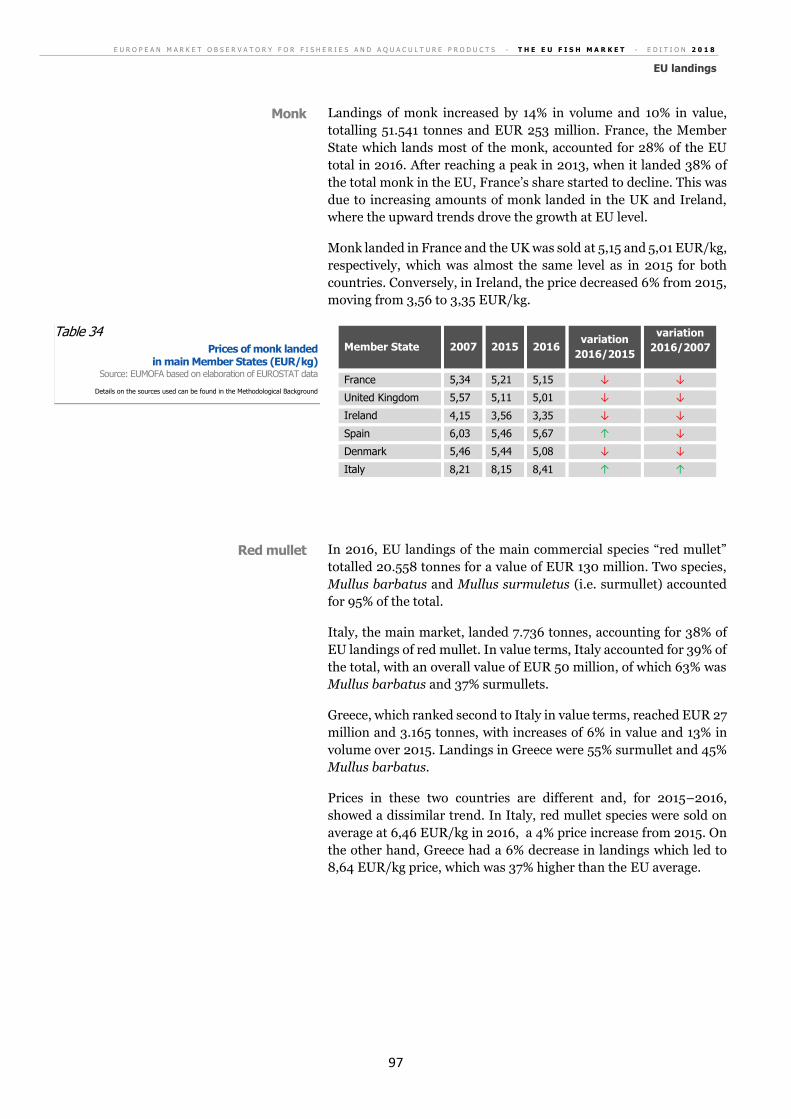
E U R O P E A N M A R K E T O B S E R V A T O R Y F O R F I S H E R I E S A N D A Q U A C U L T U R E P R O D U C T S - T H E E U F I S H M A R K E T - E D I T I O N 2 0 1 8
EU landings
97
Landings of monk increased by 14% in volume and 10% in value,
totalling 51.541 tonnes and EUR 253 million. France, the Member
State which lands most of the monk, accounted for 28% of the EU
total in 2016. After reaching a peak in 2013, when it landed 38% of
the total monk in the EU, France’s share started to decline. This was
due to increasing amounts of monk landed in the UK and Ireland,
where the upward trends drove the growth at EU level.
Monk landed in France and the UK was sold at 5,15 and 5,01 EUR/kg,
respectively, which was almost the same level as in 2015 for both
countries. Conversely, in Ireland, the price decreased 6% from 2015,
moving from 3,56 to 3,35 EUR/kg.
Member State 2007 2015 2016 variation
2016/2015
variation
2016/2007
France 5,34 5,21 5,15 ↓ ↓
United Kingdom 5,57 5,11 5,01 ↓ ↓
Ireland 4,15 3,56 3,35 ↓ ↓
Spain 6,03 5,46 5,67 ↑ ↓
Denmark 5,46 5,44 5,08 ↓ ↓
Italy 8,21 8,15 8,41 ↑ ↑
In 2016, EU landings of the main commercial species “red mullet”
totalled 20.558 tonnes for a value of EUR 130 million. Two species,
Mullus barbatus and Mullus surmuletus (i.e. surmullet) accounted
for 95% of the total.
Italy, the main market, landed 7.736 tonnes, accounting for 38% of
EU landings of red mullet. In value terms, Italy accounted for 39% of
the total, with an overall value of EUR 50 million, of which 63% was
Mullus barbatus and 37% surmullets.
Greece, which ranked second to Italy in value terms, reached EUR 27
million and 3.165 tonnes, with increases of 6% in value and 13% in
volume over 2015. Landings in Greece were 55% surmullet and 45%
Mullus barbatus.
Prices in these two countries are different and, for 2015–2016,
showed a dissimilar trend. In Italy, red mullet species were sold on
average at 6,46 EUR/kg in 2016, a 4% price increase from 2015. On
the other hand, Greece had a 6% decrease in landings which led to
8,64 EUR/kg price, which was 37% higher than the EU average.
Monk
Table 34 Prices of monk landed
in main Member States (EUR/kg) Source: EUMOFA based on elaboration of EUROSTAT data
Details on the sources used can be found in the Methodological Background
Red mullet
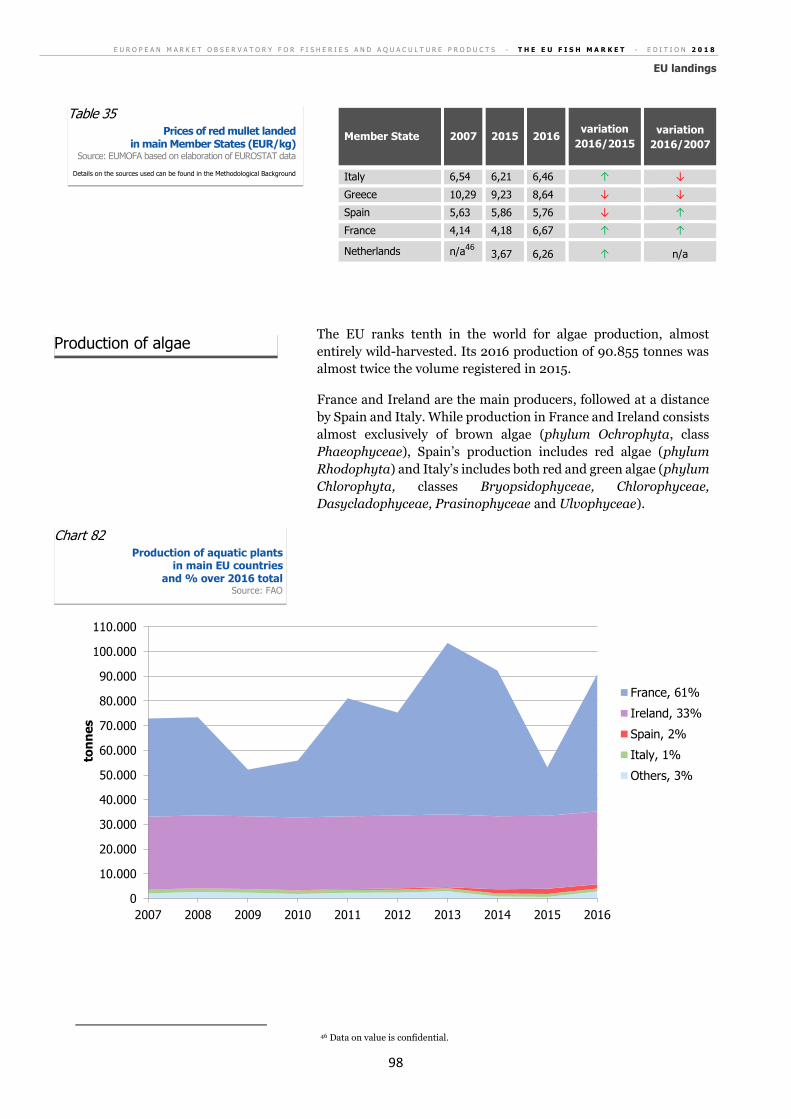
E U R O P E A N M A R K E T O B S E R V A T O R Y F O R F I S H E R I E S A N D A Q U A C U L T U R E P R O D U C T S - T H E E U F I S H M A R K E T - E D I T I O N 2 0 1 8
EU landings
98
Member State 2007 2015 2016 variation
2016/2015
variation
2016/2007
Italy 6,54 6,21 6,46 ↑ ↓
Greece 10,29 9,23 8,64 ↓ ↓
Spain 5,63 5,86 5,76 ↓ ↑
France 4,14 4,18 6,67 ↑ ↑
Netherlands n/a46
3,67 6,26 ↑ n/a
The EU ranks tenth in the world for algae production, almost
entirely wild-harvested. Its 2016 production of 90.855 tonnes was
almost twice the volume registered in 2015.
France and Ireland are the main producers, followed at a distance
by Spain and Italy. While production in France and Ireland consists
almost exclusively of brown algae (phylum Ochrophyta, class
Phaeophyceae), Spain’s production includes red algae (phylum
Rhodophyta) and Italy’s includes both red and green algae (phylum
Chlorophyta, classes Bryopsidophyceae, Chlorophyceae,
Dasycladophyceae, Prasinophyceae and Ulvophyceae).
46 Data on value is confidential.
0
10.000
20.000
30.000
40.000
50.000
60.000
70.000
80.000
90.000
100.000
110.000
2007 2008 2009 2010 2011 2012 2013 2014 2015 2016
ton
ne
s
France, 61%
Ireland, 33%
Spain, 2%
Italy, 1%
Others, 3%
Table 35 Prices of red mullet landed
in main Member States (EUR/kg) Source: EUMOFA based on elaboration of EUROSTAT data
Details on the sources used can be found in the Methodological Background
Production of algae
Chart 82 Production of aquatic plants
in main EU countries and % over 2016 total
Source: FAO
E U R O P E A N M A R K E T O B S E R V A T O R Y F O R F I S H E R I E S A N D A Q U A C U L T U R E P R O D U C T S - T H E E U F I S H M A R K E T - E D I T I O N 2 0 1 8
EU landings
99
The evolution of production over the decade has been dissimilar in
the four countries: increasing a significant 189% in France and
248% in Spain, but staying stable in Ireland with a minimal 0,2%
increase, and decreasing 14% in Italy.
In the EU, seaweed is primarily used for the commercial production
of additives for food and for non-food applications, with Laminaria
hyperborea, Laminaria digitata and Ascophyllum nodosum as the
main exploited species. The European seaweed processing industry
is traditionally divided into two main categories: those producing
alginic acid (alginate) and those producing products for agriculture
(fertilizer, animal feed). Both require large quantities of raw
material.
Local seaweed production is not fully sufficient to satisfy the high
demand of the processing industries, especially for those extracting
alginates. Those industries that have access to the raw material
locally also import dried seaweed when local supplies are out of
season or not sufficient. For example, in France, seaweed and other
algae are mainly supplied by Chile and China. In order to limit
transportation costs of wet material and to remain competitive with
the importation of dried material, industries often decide to settle
close to seaweed harvesting areas.
Some processors can also choose to relocate their processing plants
to non-EU countries, where they can access cheaper raw materials
and labour, such as in Chile, the Philippines or China.
Nonetheless, the potential for algae market development in Europe
is strong. There is an increase of public concern about the use of
“chemicals” and about finding alternative ones, which indicates
there is significant potential for seaweed extracts market. Moreover,
the EU is passing legislation to limit the use of synthetic additives
and antibiotics in feed ingredients. This is a powerful market driver
for sustainable feed ingredients and a good opportunity for algae
extracts.
In addition, several growing niche markets, such as “algotherapy”,
are providing new opportunities for algae products. For instance, in
Ireland, seaweed baths are becoming increasingly popular. The
market for algotherapy, which is expected to expand, could
represent a very attractive area for niche companies to exploit.
E U R O P E A N M A R K E T O B S E R V A T O R Y F O R F I S H E R I E S A N D A Q U A C U L T U R E P R O D U C T S - T H E E U F I S H M A R K E T - E D I T I O N 2 0 1 8
Aquaculture production
100
Aquaculture production47
In 2016, the value of aquaculture products farmed in the EU48
reached an all-time high of EUR 4,25 billion. This represented a 4%
increase over 2015, when the value was EUR 4,10 billion.
In terms of volume, aquaculture production continued the recovery
started in 2014 and reached 1,29 million tonnes in 2016, increasing
26.681 tonnes or 2% from 2015. The 2016 production level remains
a slight 1% below the 1,31 million tonnes registered in 2007.
The main groups of species farmed are bivalves, salmonids49,
freshwater fish50 and other marine fish. However, it is worth
mentioning that, despite its minor role in terms of volumes
produced, the value of bluefin tuna has been rising since 2010 at a
remarkable average annual growth rate of 21%.
European seabass production had a record year in 2016, in both
volume and value terms, especially due to increased production in
Greece and Spain.
The value of farmed salmon has continued to grow as well, driven by
production in both the UK and Ireland.
Bivalve value, which in 2015 recovered from a drop that occurred in
2014, decreased again in 2016, mostly due to the decrease registered
for clam (see species analyses for details). Its negative trend did not
offset the increased value of mussel Mytilus spp., the main species
among bivalves.
Production of freshwater fish declined slightly in 2016 and its value
achieved a 10-year peak. Carp and eel were the main contributors to
this upward trend, with carp’s production decline pushing prices up,
and both production and price increasing for eel.
47 The main source of data for EU aquaculture production is EUROSTAT. Data were integrated using FAO, FEAP and national sources for the following Member States: Austria, Belgium, Bulgaria, Denmark, Estonia, France, Germany, Greece, Hungary, Ireland, Italy, Latvia, the Netherlands, Poland, Portugal, Romania, Slovenia and the United Kingdom. More details can be found in the Methodological Background. 48 2013-2016 data are for EU-28. 49 Salmonids includes salmon and trout. 50 Freshwater fish excludes trout.
2,00
2,50
3,00
3,50
4,00
4,50
0,00
0,25
0,50
0,75
1,00
1,25
1,50
2007 2008 2009 2010 2011 2012 2013 2014 2015 2016
va
lue
vo
lum
e
volumes (million tonnes) values (billion euro)
In 2016, the value of EU aquaculture
production rose by over EUR 155 million compared with 2015.
Chart 83 Total aquaculture production in the EU
Source: EUMOFA elaboration of EUROSTAT, national sources, FEAP and FAO data
Details on the sources used can be found in the Methodological Background
EU level
Main findings
6
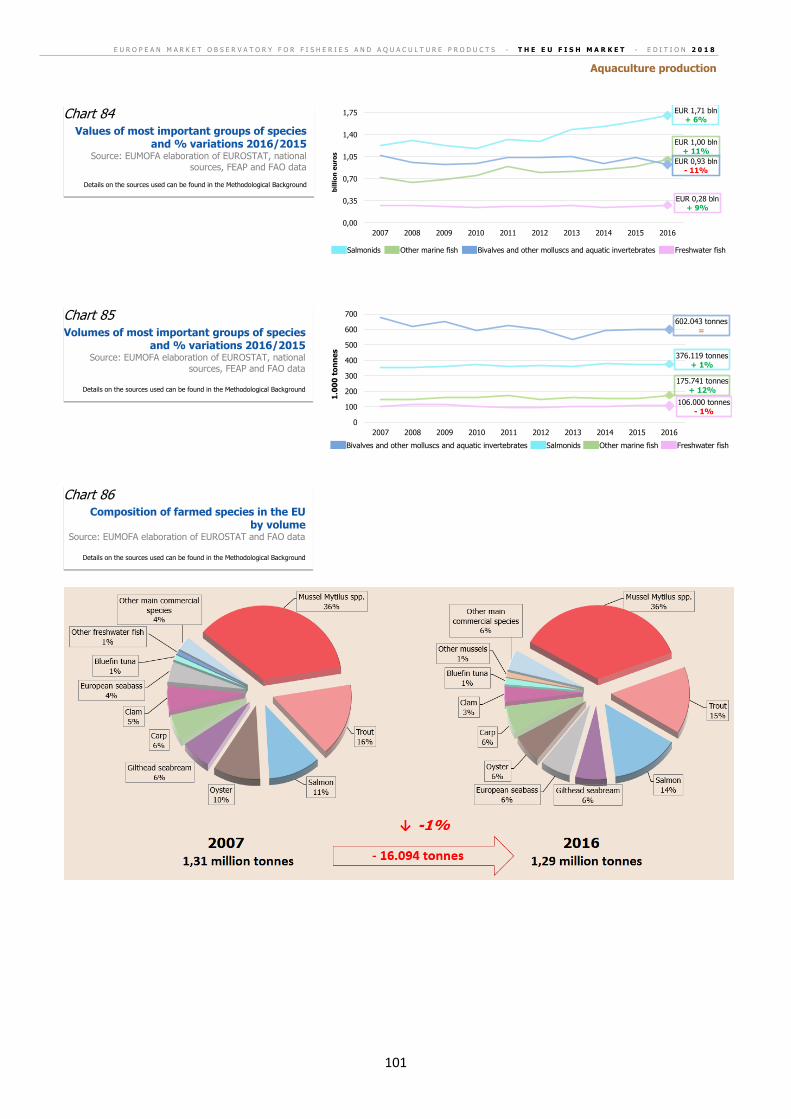
E U R O P E A N M A R K E T O B S E R V A T O R Y F O R F I S H E R I E S A N D A Q U A C U L T U R E P R O D U C T S - T H E E U F I S H M A R K E T - E D I T I O N 2 0 1 8
Aquaculture production
101
EUR 1,71 bln+ 6%
EUR 1,00 bln+ 11%
EUR 0,93 bln- 11%
EUR 0,28 bln+ 9%
0,00
0,35
0,70
1,05
1,40
1,75
2007 2008 2009 2010 2011 2012 2013 2014 2015 2016
bil
lio
n e
uro
s
Salmonids Other marine fish Bivalves and other molluscs and aquatic invertebrates Freshwater fish
602.043 tonnes =
376.119 tonnes+ 1%
175.741 tonnes+ 12%
106.000 tonnes- 1%
0
100
200
300
400
500
600
700
2007 2008 2009 2010 2011 2012 2013 2014 2015 2016
1.0
00
to
nn
es
Bivalves and other molluscs and aquatic invertebrates Salmonids Other marine fish Freshwater fish
Chart 84 Values of most important groups of species
and % variations 2016/2015 Source: EUMOFA elaboration of EUROSTAT, national
sources, FEAP and FAO data
Details on the sources used can be found in the Methodological Background
Chart 85 Volumes of most important groups of species
and % variations 2016/2015 Source: EUMOFA elaboration of EUROSTAT, national
sources, FEAP and FAO data
Details on the sources used can be found in the Methodological Background
Chart 86 Composition of farmed species in the EU
by volume Source: EUMOFA elaboration of EUROSTAT and FAO data
Details on the sources used can be found in the Methodological Background
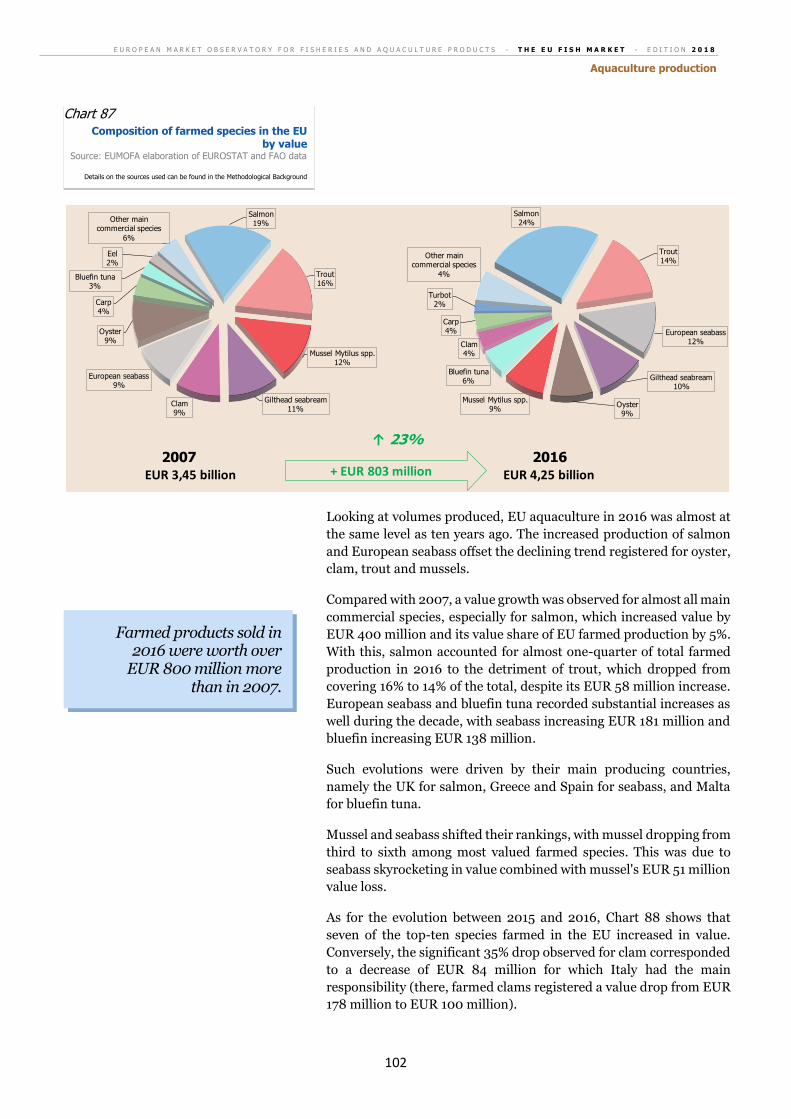
E U R O P E A N M A R K E T O B S E R V A T O R Y F O R F I S H E R I E S A N D A Q U A C U L T U R E P R O D U C T S - T H E E U F I S H M A R K E T - E D I T I O N 2 0 1 8
Aquaculture production
102
Looking at volumes produced, EU aquaculture in 2016 was almost at
the same level as ten years ago. The increased production of salmon
and European seabass offset the declining trend registered for oyster,
clam, trout and mussels.
Compared with 2007, a value growth was observed for almost all main
commercial species, especially for salmon, which increased value by
EUR 400 million and its value share of EU farmed production by 5%.
With this, salmon accounted for almost one-quarter of total farmed
production in 2016 to the detriment of trout, which dropped from
covering 16% to 14% of the total, despite its EUR 58 million increase.
European seabass and bluefin tuna recorded substantial increases as
well during the decade, with seabass increasing EUR 181 million and
bluefin increasing EUR 138 million.
Such evolutions were driven by their main producing countries,
namely the UK for salmon, Greece and Spain for seabass, and Malta
for bluefin tuna.
Mussel and seabass shifted their rankings, with mussel dropping from
third to sixth among most valued farmed species. This was due to
seabass skyrocketing in value combined with mussel's EUR 51 million
value loss.
As for the evolution between 2015 and 2016, Chart 88 shows that
seven of the top-ten species farmed in the EU increased in value.
Conversely, the significant 35% drop observed for clam corresponded
to a decrease of EUR 84 million for which Italy had the main
responsibility (there, farmed clams registered a value drop from EUR
178 million to EUR 100 million).
↑ 23%2007 2016
EUR 3,45 billion EUR 4,25 billion
Salmon24%
Trout14%
European seabass12%
Gilthead seabream10%
Oyster9%
Mussel Mytilus spp.9%
Bluefin tuna6%
Clam4%
Carp4%
Turbot2%
Other main commercial species
4%
Salmon19%
Trout16%
Mussel Mytilus spp.12%
Gilthead seabream11%
Clam9%
European seabass9%
Oyster9%
Carp4%
Bluefin tuna3%
Eel2%
Other main commercial species
6%
+ EUR 803 million
Chart 87 Composition of farmed species in the EU
by value Source: EUMOFA elaboration of EUROSTAT and FAO data
Details on the sources used can be found in the Methodological Background
Farmed products sold in 2016 were worth over
EUR 800 million more than in 2007.
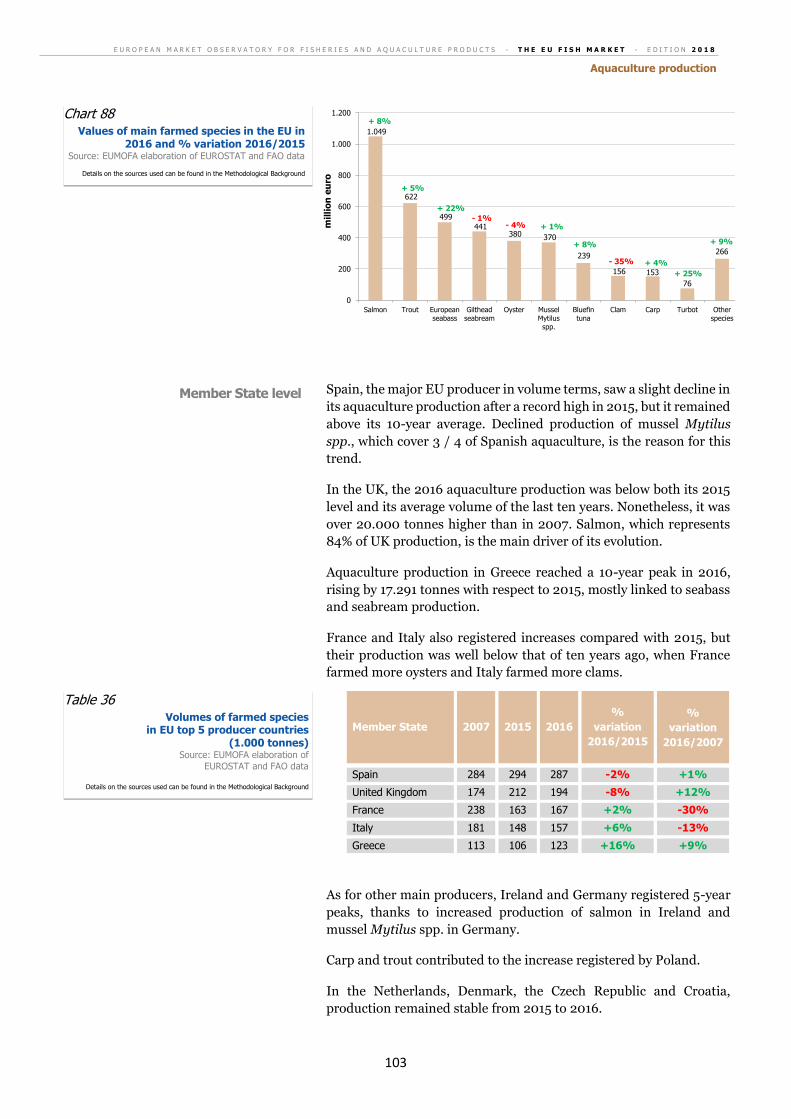
E U R O P E A N M A R K E T O B S E R V A T O R Y F O R F I S H E R I E S A N D A Q U A C U L T U R E P R O D U C T S - T H E E U F I S H M A R K E T - E D I T I O N 2 0 1 8
Aquaculture production
103
Spain, the major EU producer in volume terms, saw a slight decline in
its aquaculture production after a record high in 2015, but it remained
above its 10-year average. Declined production of mussel Mytilus
spp., which cover 3 / 4 of Spanish aquaculture, is the reason for this
trend.
In the UK, the 2016 aquaculture production was below both its 2015
level and its average volume of the last ten years. Nonetheless, it was
over 20.000 tonnes higher than in 2007. Salmon, which represents
84% of UK production, is the main driver of its evolution.
Aquaculture production in Greece reached a 10-year peak in 2016,
rising by 17.291 tonnes with respect to 2015, mostly linked to seabass
and seabream production.
France and Italy also registered increases compared with 2015, but
their production was well below that of ten years ago, when France
farmed more oysters and Italy farmed more clams.
As for other main producers, Ireland and Germany registered 5-year
peaks, thanks to increased production of salmon in Ireland and
mussel Mytilus spp. in Germany.
Carp and trout contributed to the increase registered by Poland.
In the Netherlands, Denmark, the Czech Republic and Croatia,
production remained stable from 2015 to 2016.
Member State 2007 2015 2016
%
variation
2016/2015
%
variation
2016/2007
Spain 284 294 287 -2% +1%
United Kingdom 174 212 194 -8% +12%
France 238 163 167 +2% -30%
Italy 181 148 157 +6% -13%
Greece 113 106 123 +16% +9%
1.049
622
499
441 380 370
239
156 153
76
266
0
200
400
600
800
1.000
1.200
Salmon Trout Europeanseabass
Giltheadseabream
Oyster MusselMytilusspp.
Bluefintuna
Clam Carp Turbot Otherspecies
mil
lio
n e
uro
+ 8%
+ 5%
- 1%- 4%
+ 8%
- 35% + 4%
+ 22%
+ 1%
+ 25%
+ 9%
Chart 88 Values of main farmed species in the EU in
2016 and % variation 2016/2015 Source: EUMOFA elaboration of EUROSTAT and FAO data
Details on the sources used can be found in the Methodological Background
Table 36 Volumes of farmed species
in EU top 5 producer countries (1.000 tonnes)
Source: EUMOFA elaboration of
EUROSTAT and FAO data
Details on the sources used can be found in the Methodological Background
Member State level
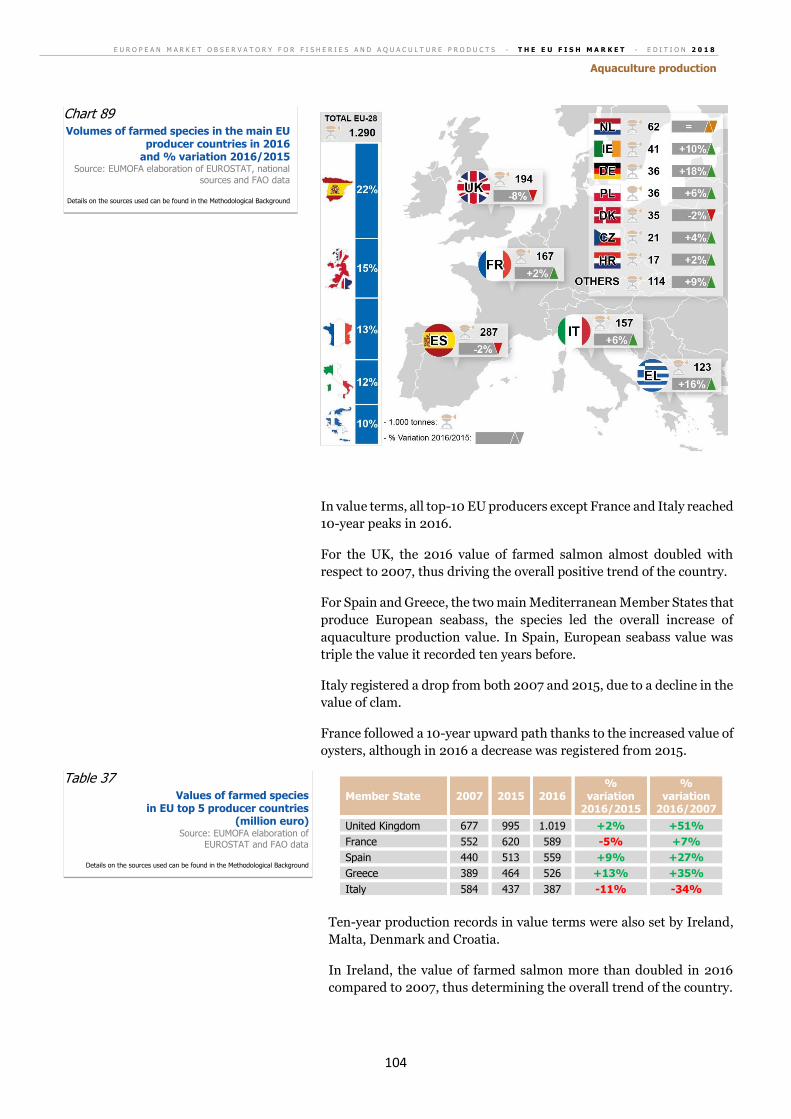
E U R O P E A N M A R K E T O B S E R V A T O R Y F O R F I S H E R I E S A N D A Q U A C U L T U R E P R O D U C T S - T H E E U F I S H M A R K E T - E D I T I O N 2 0 1 8
Aquaculture production
104
In value terms, all top-10 EU producers except France and Italy reached
10-year peaks in 2016.
For the UK, the 2016 value of farmed salmon almost doubled with
respect to 2007, thus driving the overall positive trend of the country.
For Spain and Greece, the two main Mediterranean Member States that
produce European seabass, the species led the overall increase of
aquaculture production value. In Spain, European seabass value was
triple the value it recorded ten years before.
Italy registered a drop from both 2007 and 2015, due to a decline in the
value of clam.
France followed a 10-year upward path thanks to the increased value of
oysters, although in 2016 a decrease was registered from 2015.
Member State 2007 2015 2016 %
variation 2016/2015
% variation
2016/2007
United Kingdom 677 995 1.019 +2% +51%
France 552 620 589 -5% +7%
Spain 440 513 559 +9% +27%
Greece 389 464 526 +13% +35%
Italy 584 437 387 -11% -34%
Ten-year production records in value terms were also set by Ireland,
Malta, Denmark and Croatia.
In Ireland, the value of farmed salmon more than doubled in 2016
compared to 2007, thus determining the overall trend of the country.
Chart 89 Volumes of farmed species in the main EU
producer countries in 2016 and % variation 2016/2015
Source: EUMOFA elaboration of EUROSTAT, national
sources and FAO data
Details on the sources used can be found in the Methodological Background
Table 37 Values of farmed species
in EU top 5 producer countries (million euro)
Source: EUMOFA elaboration of EUROSTAT and FAO data
Details on the sources used can be found in the Methodological Background
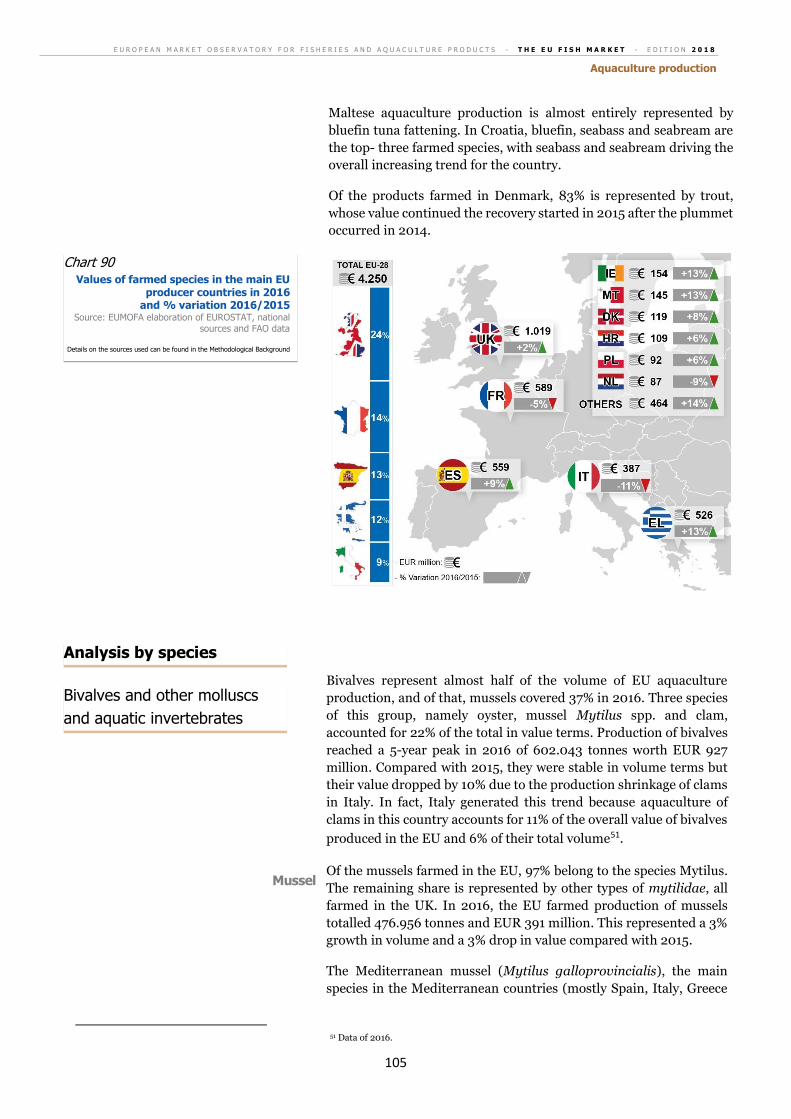
E U R O P E A N M A R K E T O B S E R V A T O R Y F O R F I S H E R I E S A N D A Q U A C U L T U R E P R O D U C T S - T H E E U F I S H M A R K E T - E D I T I O N 2 0 1 8
Aquaculture production
105
Maltese aquaculture production is almost entirely represented by
bluefin tuna fattening. In Croatia, bluefin, seabass and seabream are
the top- three farmed species, with seabass and seabream driving the
overall increasing trend for the country.
Of the products farmed in Denmark, 83% is represented by trout,
whose value continued the recovery started in 2015 after the plummet
occurred in 2014.
Bivalves represent almost half of the volume of EU aquaculture
production, and of that, mussels covered 37% in 2016. Three species
of this group, namely oyster, mussel Mytilus spp. and clam,
accounted for 22% of the total in value terms. Production of bivalves
reached a 5-year peak in 2016 of 602.043 tonnes worth EUR 927
million. Compared with 2015, they were stable in volume terms but
their value dropped by 10% due to the production shrinkage of clams
in Italy. In fact, Italy generated this trend because aquaculture of
clams in this country accounts for 11% of the overall value of bivalves
produced in the EU and 6% of their total volume51.
Of the mussels farmed in the EU, 97% belong to the species Mytilus.
The remaining share is represented by other types of mytilidae, all
farmed in the UK. In 2016, the EU farmed production of mussels
totalled 476.956 tonnes and EUR 391 million. This represented a 3%
growth in volume and a 3% drop in value compared with 2015.
The Mediterranean mussel (Mytilus galloprovincialis), the main
species in the Mediterranean countries (mostly Spain, Italy, Greece
51 Data of 2016.
Chart 90 Values of farmed species in the main EU
producer countries in 2016 and % variation 2016/2015
Source: EUMOFA elaboration of EUROSTAT, national sources and FAO data
Details on the sources used can be found in the Methodological Background
Mussel
Bivalves and other molluscs
and aquatic invertebrates
Analysis by species

E U R O P E A N M A R K E T O B S E R V A T O R Y F O R F I S H E R I E S A N D A Q U A C U L T U R E P R O D U C T S - T H E E U F I S H M A R K E T - E D I T I O N 2 0 1 8
Aquaculture production
106
and France), reached a volume of 317.951 tonnes in 2016. The blue
mussel (Mytilus edulis), with a production level of 142.845 tonnes, is
farmed in the northern Member States bordering the Atlantic Ocean
and the North Sea – mainly the Netherlands, France, Germany and
Ireland.
Spain, by far the main EU producer of Mediterranean mussel,
accounted for over half of total mussel production in 2015. Its share
declined by 4% in 2016 dropping to 215.855 tonnes, but it
represented 47% of EU production. Increased mussel production in
Italy, where it grew by 21% to 63.700 tonnes, and in Germany, where
it doubled to 22.264 tonnes, contributed to the relative reduction of
the Spanish share.
In value terms, Spain and France respectively accounted for 32% and
29% of the total: Spain registered a slight increase over 2015,
reaching EUR 118 million, while France reported a 5% decrease,
dropping to EUR 106 million.
Italian and Dutch production follow at distance – Italy with 13% of
the total at EUR 47 million, and the Netherlands with 12% of the total,
at EUR 45 million.
Mussel price dropped in all main producing countries except Spain,
where the increase was quite slight, and Germany, where the price
remained stable despite a huge increase in production, more than
doubling from 10.875 tonnes in 2015 to 22.264 tonnes in 2016.
Member State 2015 2016 % variation 2016/2015
Spain 0,51 0,55 +7%
Italy 0,82 0,74 -10%
France 1,98 1,85 -6%
Netherlands 1,06 0,84 -20%
Greece 0,37 0,36 -1%
Germany 1,09 1,09 =
EU production of clam suffered a significant collapse with 2016,
volumes dropping by almost one-quarter compared with 2015,
moving from 58.327 to 44.350 tonnes. The average price at EU level
decreased by 15%, from 4,12 to 3,51 EUR/kg, generating a 35% fall
in value from EUR 240 million to EUR 156 million. This negative
trend was driven by Italy, which farmed 36.500 tonnes in 2016,
accounting for 82% of EU production of clams. Italy was followed
at distance by Spain, with 2.608 tonnes, and Portugal, with 2.452
tonnes.
Italy’s clam production fell by more than 12.000 tonnes from 2015
to 2016, although it remained within the average of the last years.
The production decline could be linked to an infection by the
Perkinsus olseni parasite and Italy’s intensive farming conditions.52
Its Venetian lagoon area is quite conducive to the development of
this parasite, which produces an inflammation of the molluscum
52 Source: Istituto Zooprofilattico Sperimentale delle Venezie.
Table 38 Prices of mussel
in main producer countries (EUR/kg) Source: EUMOFA elaboration of EUROSTAT and
national sources data
Details on the sources used can be found in the Methodological Background
Clam
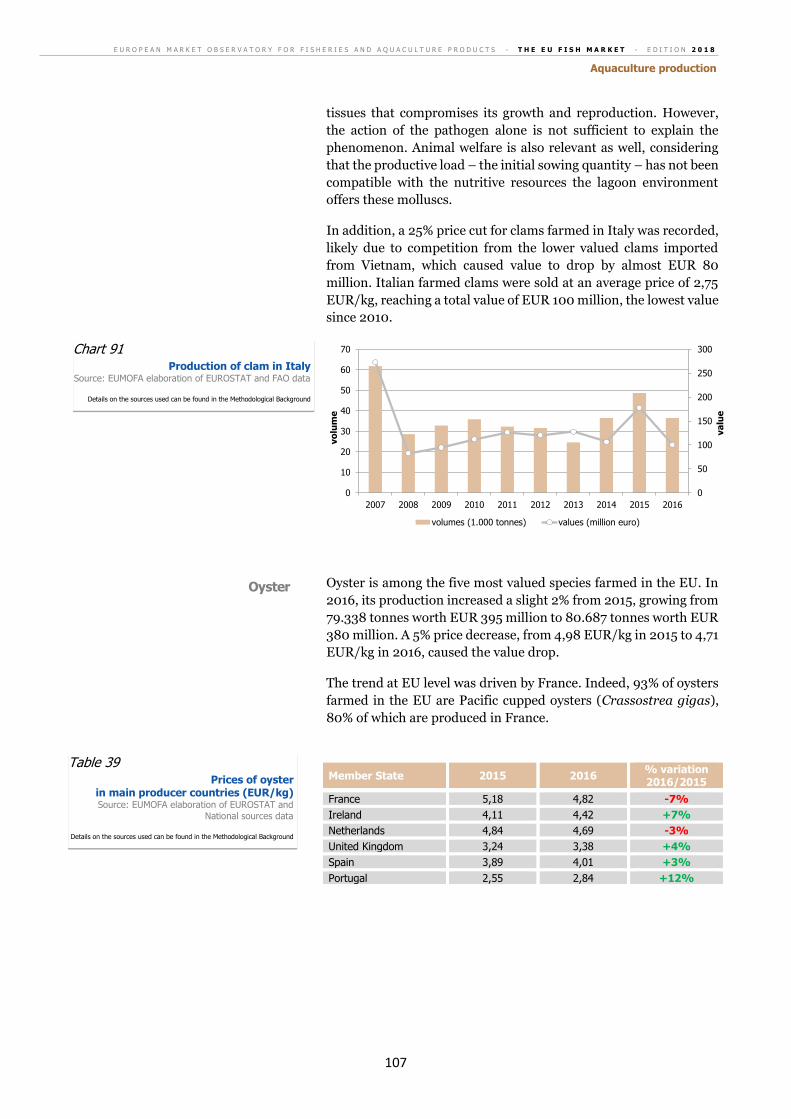
E U R O P E A N M A R K E T O B S E R V A T O R Y F O R F I S H E R I E S A N D A Q U A C U L T U R E P R O D U C T S - T H E E U F I S H M A R K E T - E D I T I O N 2 0 1 8
Aquaculture production
107
tissues that compromises its growth and reproduction. However,
the action of the pathogen alone is not sufficient to explain the
phenomenon. Animal welfare is also relevant as well, considering
that the productive load – the initial sowing quantity – has not been
compatible with the nutritive resources the lagoon environment
offers these molluscs.
In addition, a 25% price cut for clams farmed in Italy was recorded,
likely due to competition from the lower valued clams imported
from Vietnam, which caused value to drop by almost EUR 80
million. Italian farmed clams were sold at an average price of 2,75
EUR/kg, reaching a total value of EUR 100 million, the lowest value
since 2010.
Oyster is among the five most valued species farmed in the EU. In
2016, its production increased a slight 2% from 2015, growing from
79.338 tonnes worth EUR 395 million to 80.687 tonnes worth EUR
380 million. A 5% price decrease, from 4,98 EUR/kg in 2015 to 4,71
EUR/kg in 2016, caused the value drop.
The trend at EU level was driven by France. Indeed, 93% of oysters
farmed in the EU are Pacific cupped oysters (Crassostrea gigas),
80% of which are produced in France.
Member State 2015 2016 % variation 2016/2015
France 5,18 4,82 -7%
Ireland 4,11 4,42 +7%
Netherlands 4,84 4,69 -3%
United Kingdom 3,24 3,38 +4%
Spain 3,89 4,01 +3%
Portugal 2,55 2,84 +12%
0
50
100
150
200
250
300
0
10
20
30
40
50
60
70
2007 2008 2009 2010 2011 2012 2013 2014 2015 2016
va
lue
vo
lum
e
volumes (1.000 tonnes) values (million euro)
Chart 91 Production of clam in Italy
Source: EUMOFA elaboration of EUROSTAT and FAO data
Details on the sources used can be found in the Methodological Background
Table 39 Prices of oyster
in main producer countries (EUR/kg) Source: EUMOFA elaboration of EUROSTAT and
National sources data
Details on the sources used can be found in the Methodological Background
Oyster
E U R O P E A N M A R K E T O B S E R V A T O R Y F O R F I S H E R I E S A N D A Q U A C U L T U R E P R O D U C T S - T H E E U F I S H M A R K E T - E D I T I O N 2 0 1 8
Aquaculture production
108
Farmed production of salmonids in the EU hit a 10-year peak in
2016, totalling 376.119 tonnes with a value of EUR 1,71 billion.
While in volume terms, the shares of salmon and trout production
in the total of this commodity group are similar – salmon with 48%
and trout with 50% – salmon value represents 62% of the total while
trout value is 36%.
Aquaculture of salmon declined by 2%, reaching 181.302 tonnes,
but production remained above the average of the last decade. In
value terms, it reached the 10-year peak of EUR 1,05 billion, rising
by 8% from 2015.
UK salmon production covers 90% of the EU total in volume terms,
followed at a distance by Ireland, which covers 9%.
In the UK, the downward production trend that emerged in 2015
continued, as production dropped another 5% in 2016, reaching
163.135 tonnes. However, its price of 5,74 EUR/kg reached a 10-
year peak, 12% higher than in 2015, contributing to a record value
of EUR 936 million.
Ireland, which focuses on organic farming, experienced both
volume and value peaks. Total volumes of salmon production in this
country increased by 24% to 16.300 tonnes, sold at 6,41 EUR/kg.
This generated a 16% increase in value for a total of EUR 104
million.
EU trout production, which mostly consists of rainbow trout
(Oncorhynchus mykiss), has been rising since 2011. In 2016, it
totalled 188.437 tonnes worth EUR 622 million, which represented
a 5% increase from 2015 in both volume and value terms.
Italy, Denmark and France, the main producers, accounted for
36.800, 30.424 and 27.100 tonnes, respectively. Denmark saw a 6%
decrease in production from 2015, accompanied by a 9% price
increase which reached 3,25 EUR/kg in 2016. In Italy and France,
volumes of farmed trout rose by 14% and 10%, respectively. Italy
had a more intense price drop of 14%, with the price falling to 2,71
EUR/kg, the lowest since 2013. Trout farmed in France was sold at
3,61 EUR/kg in 2016, marking a 5% price decrease from the
previous year.
Two species of this group, namely gilt-head seabream and European
seabass, together account for over 20% of the total value of EU
aquaculture production. They are normally farmed together in the
Mediterranean even though they are different species. Greece is the
major EU producer of both, followed by Spain. Greece had been the
Mediterranean’s largest producing country, but it was bypassed in
2016-2017 by the fast-growing production in Turkey.
Salmonids
Salmon
Trout
Other marine fish
E U R O P E A N M A R K E T O B S E R V A T O R Y F O R F I S H E R I E S A N D A Q U A C U L T U R E P R O D U C T S - T H E E U F I S H M A R K E T - E D I T I O N 2 0 1 8
Aquaculture production
109
In 2016, 83.185 tonnes of gilthead seabream were produced in the
EU, which was 1.676 tonnes or 2% more than in 2015. A 3% price
decrease from 5,46 to 5,30 EUR/kg led to a 1% reduction in the
overall value, bringing it to EUR 441 million.
The same trend was observed in Greece, where production rose
from 47.008 tonnes (sold at 5,14 EUR/kg) to 49.265 tonnes (sold at
4,88 EUR/kg), causing a slight value decrease.
In Spain, production collapsed in 2016, dropping to the lowest
volume of the decade, with farmed gilthead seabream falling by 23%
to 12.396 tonnes. The drop was most likely related to a strategic
switch from seabream to seabass production. Even though its
average price, 5,60 EUR/kg, was 5% higher than the previous year
and the second highest of the period, there still was a 19% decrease
in the overall value, which dropped from EUR 85 million to EUR 69
million.
Cyprus experienced a noteworthy 38% increase of gilthead
seabream production in 2016 with respect to 2015. Farmed volumes
rose from 3.656 to 5.039 tonnes, and a 30% value increase of EUR
6 million brought the total value to EUR 26 million. Price, however,
dropped from 5,40 to 5,08 EUR/kg, for a 6% decrease.
European seabass saw increases in both volume and value terms for
all main producing countries which meant 10-year highs at EU level
as well, reaching 81.852 tonnes with a value of close to half a billion
euro.
In Greece and Spain, 2016 production rose to 42.557 and 22.956
tonnes respectively, which were 20% and 23% higher than in 2015.
Greek seabass was sold at 5,52 EUR/kg, a 2% increase and the
highest price of the last decade. This led to a 23% increase of the
overall value, which reached EUR 235 million. Similarly, the price
in Spain was 6,55 EUR/kg, which represented an 8% increase. This
was also a decade peak and led to a 33% boost of production value
which reached EUR 150 million.
0
50
100
150
200
250
300
0
10
20
30
40
50
60
70
2007 2008 2009 2010 2011 2012 2013 2014 2015 2016
va
lue
vo
lum
e
Greece
volume (1.000 tonnes) value (million euro)
0
50
100
150
200
250
300
0
10
20
30
40
50
60
70
2007 2008 2009 2010 2011 2012 2013 2014 2015 2016
va
lue
vo
lum
e
Spain
volume (1.000 tonnes) value (million euro)
Chart 92 Production of gilt-head seabream
in the main EU producers Source: EUMOFA elaboration of EUROSTAT and FAO data
Details on the sources used can be found in the Methodological Background
Gilthead seabream
European seabass
E U R O P E A N M A R K E T O B S E R V A T O R Y F O R F I S H E R I E S A N D A Q U A C U L T U R E P R O D U C T S - T H E E U F I S H M A R K E T - E D I T I O N 2 0 1 8
Aquaculture production
110
In Croatia, production continued its upward trend and totalled
5.310 tonnes in 2016, an 18% increase from 2015. It also had a 19%
increase in value, reaching EUR 34 million.
With 17.599 tonnes farmed, mostly in Malta, Spain and Croatia,
2016 was a record year for bluefin tuna “production”, which consists
of fattening of small fish caught by purse seiners. With total
production of EUR 239 million, bluefin ranked seventh among most
valued species being farmed in the EU.
The growth at EU level was driven by Malta’s production, which
totalled 10.103 tonnes and EUR 133 million. Although these were
increases of 25% in volume and 20% in value terms, and were 10-
year highs, they were accompanied by a price decrease, dropping
4% from 13,80 to 13,20 EUR/kg.
Croatia observed a 331-tonne volume increase in 2016, producing a
total of 2.934 tonnes. The price drop from 14,54 to 12,70 EUR/kg
caused an overall 2% value shrinkage.
Spanish production declined by 3% in volume and 4% in value,
reaching 4.562 tonnes and EUR 68 million. However, it has to be
noted that these amounts were 40% higher than their 10-year
averages. The price decreased slightly, from 15,18 EUR/kg in 2015
to 15,00 EUR/kg in 2016.
0
25
50
75
100
125
150
175
200
225
250
0
5
10
15
20
25
30
35
40
45
2007 2008 2009 2010 2011 2012 2013 2014 2015 2016
va
lue
vo
lum
e
Greece
volume (1.000 tonnes) value (million euro)
0
25
50
75
100
125
150
175
200
225
250
0
5
10
15
20
25
30
35
40
45
2007 2008 2009 2010 2011 2012 2013 2014 2015 2016
va
lue
vo
lum
e
Spain
volume (1.000 tonnes) value (million euro)
Chart 93 Production of European seabass
in the main EU producers Source: EUMOFA elaboration of EUROSTAT and FAO data
Details on the sources used can be found in the Methodological Background
Bluefin tuna
Tuna and tuna-like species
E U R O P E A N M A R K E T O B S E R V A T O R Y F O R F I S H E R I E S A N D A Q U A C U L T U R E P R O D U C T S - T H E E U F I S H M A R K E T - E D I T I O N 2 0 1 8
Aquaculture production
111
*Freshwater fish excludes trout.
Trout is included with salmonids.
In 2016, EU-farmed production of freshwater fish amounted to
106.000 tonnes and EUR 285 million. This represented a 1%
decrease from 2015 volume and a decade-high value, thanks to a 9%
or EUR 24 million growth. Both carp and eel contributed to this
upward trend.
Carp production of 77.932 tonnes in 2016 accounted for 74% of
freshwater species volume. This represented 4% decrease from
2015, complemented with a parallel value growth to EUR 153
million. The upward value trend was caused by a price increase,
which rose 8% from 1,80 to 1,96 EUR/kg, the highest since 2012.
The same trend was observed in the two major producer countries,
namely Poland and Czech Republic. In the latter, carp production
reached a 10-year high of 19.418 tonnes with an overall value of
EUR 41 million, which was 33% or EUR 10 million more than in
2015, thanks to a price increase from 1,64 to 2,09 EUR/kg.
Polish production totalled 18.330 tonnes and EUR 41 million, which
were a 7% increase in volume and 9% increase in value. The price of
2,24 EUR/kg was 2% higher than in 2015.
Eel accounts for over 20% of the value of freshwater fish
aquaculture. In 2016, production amounted to 6.356 tonnes worth
EUR 61 million, a 10-year high in value terms and a 24% increase
over 2015.
Eel production mostly takes place in the Netherlands, Italy,
Germany, Denmark and, to a lesser extent, in Greece, Spain,
Sweden and Romania. All countries reported increased value of
farmed eel, but the growth at EU level was driven by Italy, where
production more than doubled from 2015 to 2016, reaching 1.250
tonnes and EUR 13 million. This was accompanied by a 6% price
drop from 11,02 to 10,40 EUR/kg.
0
20
40
60
80
100
120
2007 2008 2009 2010 2011 2012 2013 2014 2015 2016
mil
lio
n e
uro
s
Croatia Spain Malta
Chart 94 Value of farmed bluefin tuna
in the main producers Source: EUMOFA elaboration of EUROSTAT data
Freshwater fish*
Carp
Eel
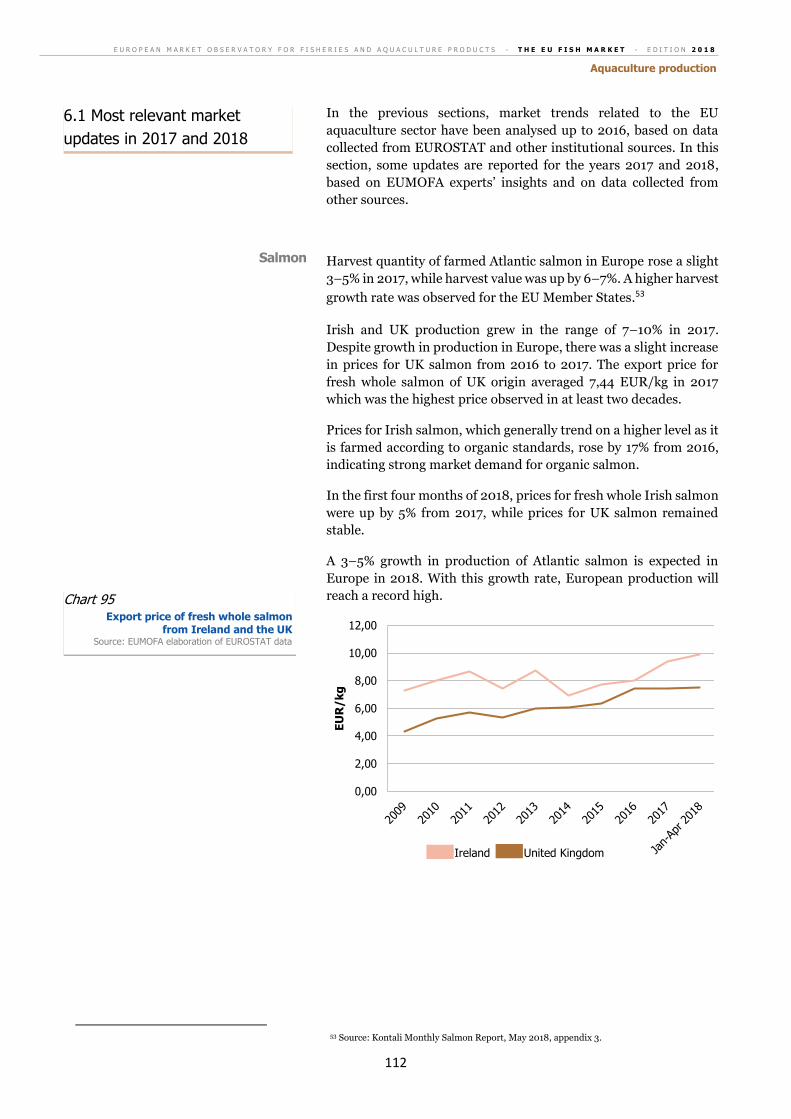
E U R O P E A N M A R K E T O B S E R V A T O R Y F O R F I S H E R I E S A N D A Q U A C U L T U R E P R O D U C T S - T H E E U F I S H M A R K E T - E D I T I O N 2 0 1 8
Aquaculture production
112
In the previous sections, market trends related to the EU
aquaculture sector have been analysed up to 2016, based on data
collected from EUROSTAT and other institutional sources. In this
section, some updates are reported for the years 2017 and 2018,
based on EUMOFA experts’ insights and on data collected from
other sources.
Harvest quantity of farmed Atlantic salmon in Europe rose a slight
3–5% in 2017, while harvest value was up by 6–7%. A higher harvest
growth rate was observed for the EU Member States.53
Irish and UK production grew in the range of 7–10% in 2017.
Despite growth in production in Europe, there was a slight increase
in prices for UK salmon from 2016 to 2017. The export price for
fresh whole salmon of UK origin averaged 7,44 EUR/kg in 2017
which was the highest price observed in at least two decades.
Prices for Irish salmon, which generally trend on a higher level as it
is farmed according to organic standards, rose by 17% from 2016,
indicating strong market demand for organic salmon.
In the first four months of 2018, prices for fresh whole Irish salmon
were up by 5% from 2017, while prices for UK salmon remained
stable.
A 3–5% growth in production of Atlantic salmon is expected in
Europe in 2018. With this growth rate, European production will
reach a record high.
53 Source: Kontali Monthly Salmon Report, May 2018, appendix 3.
0,00
2,00
4,00
6,00
8,00
10,00
12,00
EU
R/k
g
Ireland United Kingdom
Chart 95 Export price of fresh whole salmon
from Ireland and the UK Source: EUMOFA elaboration of EUROSTAT data
Salmon
6.1 Most relevant market
updates in 2017 and 2018
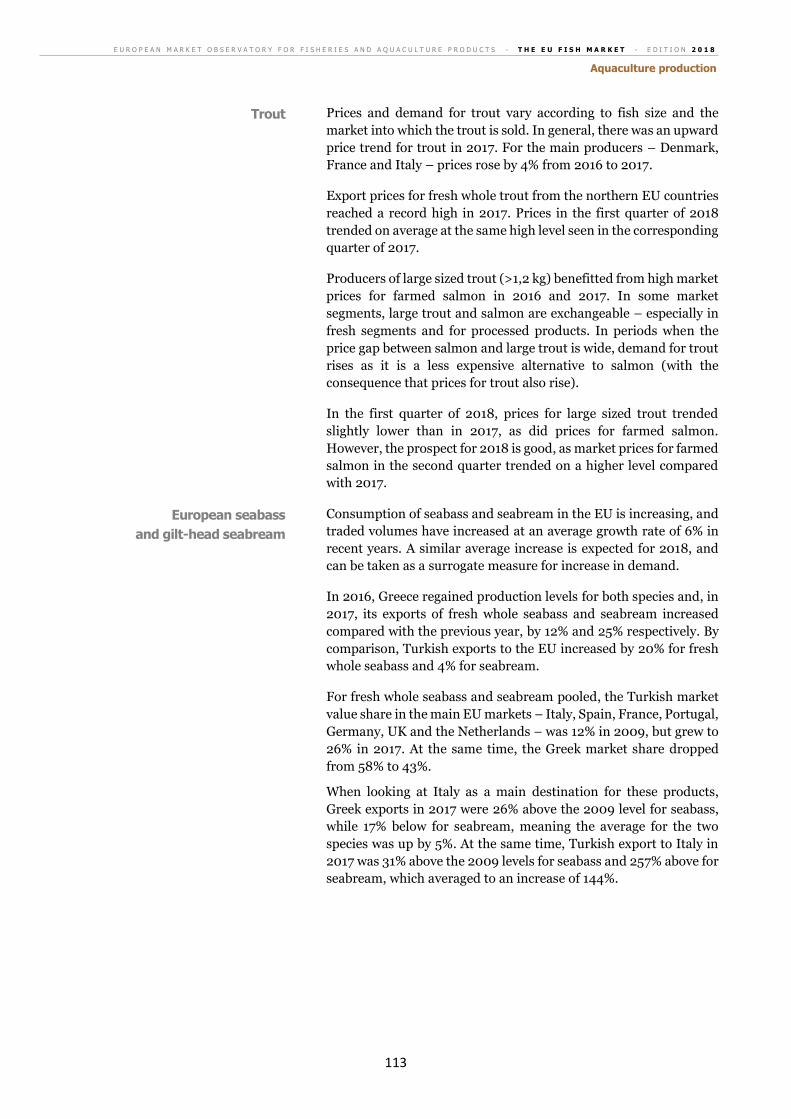
E U R O P E A N M A R K E T O B S E R V A T O R Y F O R F I S H E R I E S A N D A Q U A C U L T U R E P R O D U C T S - T H E E U F I S H M A R K E T - E D I T I O N 2 0 1 8
Aquaculture production
113
Prices and demand for trout vary according to fish size and the
market into which the trout is sold. In general, there was an upward
price trend for trout in 2017. For the main producers – Denmark,
France and Italy – prices rose by 4% from 2016 to 2017.
Export prices for fresh whole trout from the northern EU countries
reached a record high in 2017. Prices in the first quarter of 2018
trended on average at the same high level seen in the corresponding
quarter of 2017.
Producers of large sized trout (>1,2 kg) benefitted from high market
prices for farmed salmon in 2016 and 2017. In some market
segments, large trout and salmon are exchangeable – especially in
fresh segments and for processed products. In periods when the
price gap between salmon and large trout is wide, demand for trout
rises as it is a less expensive alternative to salmon (with the
consequence that prices for trout also rise).
In the first quarter of 2018, prices for large sized trout trended
slightly lower than in 2017, as did prices for farmed salmon.
However, the prospect for 2018 is good, as market prices for farmed
salmon in the second quarter trended on a higher level compared
with 2017.
Consumption of seabass and seabream in the EU is increasing, and
traded volumes have increased at an average growth rate of 6% in
recent years. A similar average increase is expected for 2018, and
can be taken as a surrogate measure for increase in demand.
In 2016, Greece regained production levels for both species and, in
2017, its exports of fresh whole seabass and seabream increased
compared with the previous year, by 12% and 25% respectively. By
comparison, Turkish exports to the EU increased by 20% for fresh
whole seabass and 4% for seabream.
For fresh whole seabass and seabream pooled, the Turkish market
value share in the main EU markets – Italy, Spain, France, Portugal,
Germany, UK and the Netherlands – was 12% in 2009, but grew to
26% in 2017. At the same time, the Greek market share dropped
from 58% to 43%.
When looking at Italy as a main destination for these products,
Greek exports in 2017 were 26% above the 2009 level for seabass,
while 17% below for seabream, meaning the average for the two
species was up by 5%. At the same time, Turkish export to Italy in
2017 was 31% above the 2009 levels for seabass and 257% above for
seabream, which averaged to an increase of 144%.
Trout
European seabass
and gilt-head seabream
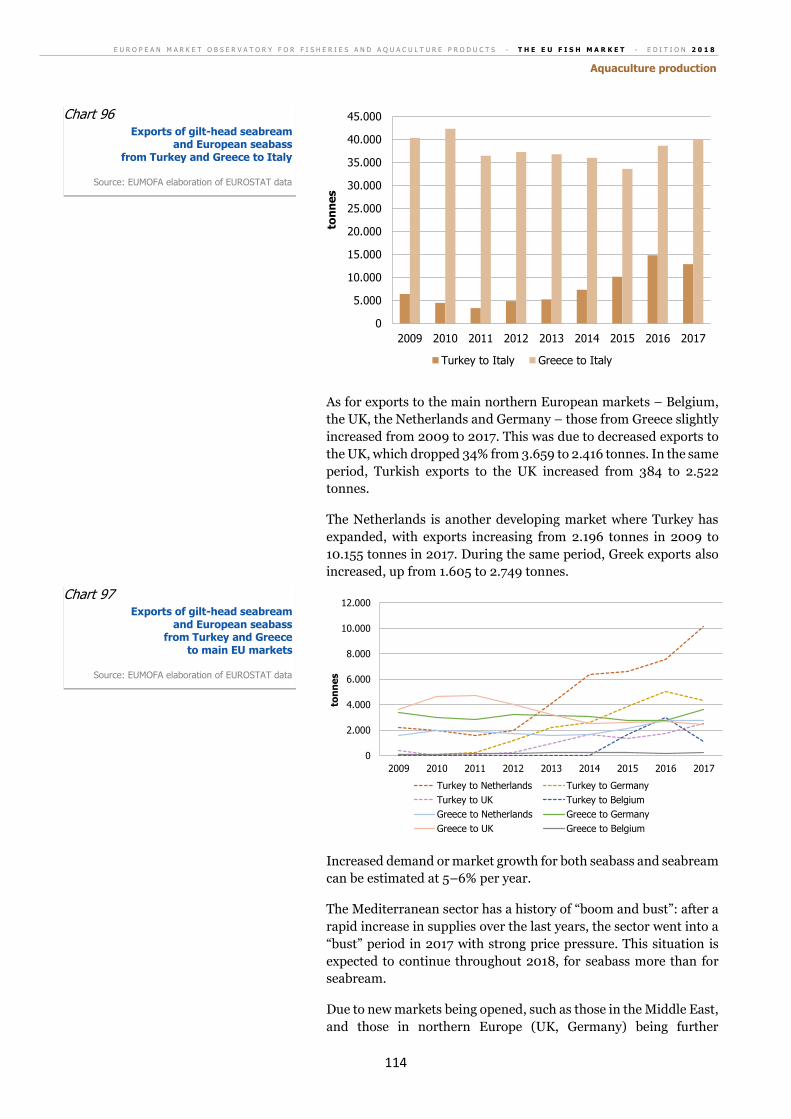
E U R O P E A N M A R K E T O B S E R V A T O R Y F O R F I S H E R I E S A N D A Q U A C U L T U R E P R O D U C T S - T H E E U F I S H M A R K E T - E D I T I O N 2 0 1 8
Aquaculture production
114
As for exports to the main northern European markets – Belgium,
the UK, the Netherlands and Germany – those from Greece slightly
increased from 2009 to 2017. This was due to decreased exports to
the UK, which dropped 34% from 3.659 to 2.416 tonnes. In the same
period, Turkish exports to the UK increased from 384 to 2.522
tonnes.
The Netherlands is another developing market where Turkey has
expanded, with exports increasing from 2.196 tonnes in 2009 to
10.155 tonnes in 2017. During the same period, Greek exports also
increased, up from 1.605 to 2.749 tonnes.
Increased demand or market growth for both seabass and seabream
can be estimated at 5–6% per year.
The Mediterranean sector has a history of “boom and bust”: after a
rapid increase in supplies over the last years, the sector went into a
“bust” period in 2017 with strong price pressure. This situation is
expected to continue throughout 2018, for seabass more than for
seabream.
Due to new markets being opened, such as those in the Middle East,
and those in northern Europe (UK, Germany) being further
0
5.000
10.000
15.000
20.000
25.000
30.000
35.000
40.000
45.000
2009 2010 2011 2012 2013 2014 2015 2016 2017to
nn
es
Turkey to Italy Greece to Italy
0
2.000
4.000
6.000
8.000
10.000
12.000
2009 2010 2011 2012 2013 2014 2015 2016 2017
ton
ne
s
Turkey to Netherlands Turkey to Germany
Turkey to UK Turkey to Belgium
Greece to Netherlands Greece to Germany
Greece to UK Greece to Belgium
Chart 97 Exports of gilt-head seabream
and European seabass from Turkey and Greece
to main EU markets
Source: EUMOFA elaboration of EUROSTAT data
Chart 96 Exports of gilt-head seabream
and European seabass from Turkey and Greece to Italy
Source: EUMOFA elaboration of EUROSTAT data
E U R O P E A N M A R K E T O B S E R V A T O R Y F O R F I S H E R I E S A N D A Q U A C U L T U R E P R O D U C T S - T H E E U F I S H M A R K E T - E D I T I O N 2 0 1 8
Aquaculture production
115
developed, there are positive trends for demand in the market.
However, the growth of the market has not been able to
accommodate the rapid increase in supplies. Nonetheless, since the
2018 growth in juvenile stocking within the sector is slowing, it can
be expected that a better market balance will be regained by 2019.
Bluefin tuna farming in the EU takes place in the Mediterranean.
From 2015 to 2017, quotas of bluefin tuna in the Atlantic increased
by 60%. In addition, tuna caught by purse seiners is being used for
farming. Thus, with the combination of the increased quotas and
more tuna available for farming, the farming potential in the
Mediterranean is increasing.
Most of the tuna farmed in the EU is intended for the Japanese
market. From highs in 2011 and 2012 of around 20,00 EUR/kg,
prices for bluefin tuna sold to Japan have shown a downward trend.
Export prices of fresh farmed bluefin tuna from Croatia to Japan fell
from 12,24 EUR/kg in 2016 to 10,94 EUR/kg in 2017. On the other
hand, prices from Malta rose from 12,57 to 13,01 EUR/kg.
In the first four months of 2018, the export price for fresh whole
bluefin tuna from Spain, Malta and Croatia to the Japanese market
averaged 9,93 EUR/kg, down from 11,39 EUR/kg in the
corresponding period in 2017.
Bluefin tuna
“The EU fish market” is published by the Directorate-General for Maritime Affairs and Fisheries of the European
Commission.
Editor: European Commission, Directorate-General for Maritime Affairs and Fisheries, Director-General.
Disclaimer: Although the Maritime Affairs and Fisheries Directorate General is responsible for the overall production
of this publication, the views and conclusions presented in this report reflect the opinion of the author(s) and do not
necessarily reflect the opinion of the Commission or its officers.
© European Union, 2018
KL-AP-18-001-EN-N
ISBN: 978-92-79-79971-6
ISSN: 2363-4154
DOI: 10.2771/41473
Reproduction is authorized, provided the source is acknowledged.
FOR MORE INFORMATION AND COMMENTS:
Directorate-General for Maritime Affairs and Fisheries
B-1049 Brussels
Tel: +32 229-50101
E-mail: [email protected]
www.eumofa.eu