The Essence & Goals
25
Transcript of The Essence & Goals

1

2
The Essence & Goals of the Report
Each year the face of Israeli society changes due to local and global developments and with it, the poverty indexes change as well. This is the 13th edition of The Alternative Poverty Report, reflecting the latest trends in relation to poverty and food insecurity in Israel for 2015. Latet operates on the front lines throughout the country in collaboration with 180 local NGOs and other aid organizations to address the issue of poverty.
This report serves as an alternative tool for getting to know and understand poverty. As opposed to official statistical reports, this report reflects the human face of poverty, through a broad perspective and in-depth analysis of trends and by providing a voice to the people receiving aid.
In this current release of 2015, the report includes for the first time The Multidimensional Alternative Poverty Index, which represents the depth of poverty and it’s different characteristics through the analysis of the gap between the basic needs of an individual to their current status.The 2015 index was conducted after dialogue and consultation with an expert committee. Moreover, a comprehensive survey was conducted that included 90 respondents, all of which are staff in academic institutions in the areas of economics, social work, public policy, law, philosophy, and sociology.
The current edition also presents a study, the first of its kind in Israel, entitled “The Cost of Poverty in Israel and Shrinking Yields.” The purpose of this study on the Social Return on Investment (SROI), is to examine the cost of poverty and the economic efficiency of treating the symptoms of poverty and loss of household income, compared to the opportunity cost of implementing a comprehensive plan to reduce poverty. Dealing with poverty and social inequalities are seen as a matter of moral values, reflecting national priorities. The SROI study examines the direct and indirect economic consequences on the Israeli economy and society, regardless of ideological concepts.
The Alternative Poverty Report was conducted by the Latet organization in order to expose Israeli society directly and authentically to what it really means to live in poverty. Most people are familiar with poverty only through the media, their perceptions, or prejudices. This report aims to educate the public to the causes of poverty, its characteristics and mainly the challenges and obstacles arising from the policies that hinder the ability of people to move out of poverty. In addition, this report seeks to serve as a means of pressure on decision-makers in government and the Knesset to take responsibility for the welfare of the citizens of Israel and to pursue an effective solution to the problem of poverty and social inequality.

3
We at Latet, believe that it is the obligation of the Israeli government to prioritize the issue of poverty and social inequality. This includes allocating the necessary funds and implementing a comprehensive program in order to reach the average poverty rate of other developed countries within a decade.
Expert Committee: Daniel Gottlieb, Vice President of Research and Planning and Netanela Berkeley Social Security, Dr. Nihaya Daoud - Expert in Public Health and Health Inequality - Ben-Gurion University; Dr. Milka Donhin- School of Public Health, Hebrew
University; Prof. Menachem Monnickendam - Poverty Researcher at the School of Social Work, Ben Gurion University; Prof. Michal Krumer-Nevo- head of The Israeli Center for Qualitative Research of People and Societies at the Ben Gurion University of the Negev; Attorney Gil Gan-Mor -Director of the Social and Economic Rights Unit and of the Right to Housing Program; Khawla Rihani- Director of Economic Empowerment for Women, Moshe Israeli - Representative of Rabbi Hananiah Chalke, The NGO Ezer Mizion; Orly Stuchiner Cohen - Welfare Programs Director, at Yedidute Toronto.

4
Methodology Rotem Market Analysis and Research and ERI Institute
The Alternative Poverty Report is a unique document that refers to the multiple elements that comprise poverty in Israeli society through a comprehensive look at the social gaps in Israel as of 2015.
The report is based on a collection of findings brought together through four studies and questionnaires; The first study analyzes the characteristics and coping strategies in the lives of people living in poverty. The second study was done in cooperation with local NGOs that Latet empowers and is designed to examine the trends in poverty, people’s needs, and the processes that are taking place in this area. The third survey was carried out among the general public and aims to examine the public’s perception of poverty and social gaps in Israel. There was an additional questionnaire, to measure poverty and its perceptions within public opinion - The Multidimensional Poverty Index.
All studies were conducted during the months of July-November 2015. The preparation of questionnaires, data collection, examination of findings, and analysis were conducted by the Research Department of the Latet organization with the assistance of and in consultation with leading research institutions of Israel.
Rotem Market Analysis and Research is a firm owned and managed by Dr. Arie Rotem. The company is considered to be one of the most advanced research institutes in Israel. The research for the report was led by Dr. Arie Rotem and Miriam Honen.
ERI Institute is a social-business venture that provides research and consultation services that combines expertise from academia and nonprofit organizations, a committee of senior experts and scholars from a diverse variety of fields and disciplines. The Institute is led by Gilad Tanay, an expert in the study of poverty and social justice. He is also the former director and founding member of the of the Association of Academics Standing Against Poverty and a professor of International Justice at Yale University.

5
The research was conducted this year using face to face surveys among 707 people in need who are receiving food assistance from NGOs. The interviewees filled out surveys and if needed, help was provided by a Latet representative.
Note: Some respondents did not answer all the questions presented to them. The percentages in the surveys are of those who responded.
The maximum sampling error for this group is + \ - 3.8% according to the standard margin of error.
The information collected is the base for this research, designed to reflect the everyday life and personal experiences of the aid recipients. These daily experiences are often not known or go unnoticed by the general public, decision-makers, and the government elite.
Profile of People Living in Poverty

6
Alternative Poverty Report 2015 - Highlights
The Alternative and Multidimensional Poverty Index for 2015 reflects a grim reality: 2,624,000 people live in poverty in Israel (31.9%), of whom 1,626,000 are adults (30.2%) and 998,000 are children (35.2%).
A unique research conducted by Latet through the ERI Institute, found that the State of Israel - loses- 48 billion NIS in GDP a year due to poverty. Research shows that if the recommendations by The Commission to Fight Poverty were implemented, and investments of 7.5 billion NIS were made annually for a decade, poverty rates in Israel would be reduced to the average rates of the other OECD countries. The expected economic benefits would reach about 13.2 billion NIS, turning a profit of 64 billion NIS and a 93% ROI (return on investment).
Children & Elderly62% of parents receiving aid had to forego medication or medical care for their children on a regular basis (12%) or from time to time(50%).
37% of children receiving aid had to skip or reduce meals due to economic distress.
27% of children receiving aid experienced hunger during the past year. 14% dealt with a situation where they did not eat
for a whole day, because their parents were unable to provide them with food.
14% of children receiving aid had resorted to begging, collecting food from garbage bins, and stealing food.
24% of children receiving aid went to school hungry with no sandwich or other food. 4% reported that this occurs on a regular basis.
Approximately 58% of children receiving aid mainly feed on carbohydrates (31%), and bread and butter (28%).
15% of parents receiving aid reported that their children were forced to work during the school year because of economic necessity. 9.5% of parents reported that they were forced to send one or more of their children to a boarding school.
96% of seniors reported that their age-related pension does not allow them to fulfill their basic needs nor live with dignity.
90% of seniors receiving aid are unable to make payments for household help or equipment, long-term care or hospice.
52% of seniors receiving aid cannot pay for their medications and medical services.

7
43% of the elderly suffer from a lack of nutritious meals because they are unable to pay for basic commodities.
61% of seniors receiving aid live alone, and 24% suffer from loneliness and can not take part in social activities.
Housing58% of aid recipients were forced out of their houses through lawsuits or evictions.
54% of aid recipients had their water or electricity cut off last year because they were unable to pay for it.
41% of aid recipients reported that they did not pay their bills (compared with only 5% of the general population).
21% of aid recipients are afraid of the high probability that they would be evicted from their homes this year due to inability to meet rent or mortgage payments. 25% believe that in such a case they would have no other choice but to go and live on the streets or in a shelter.
9% of aid recipients are homeless or live permanently at a shelter.
78% of aid recipients had to postpone necessary repairs on their dwellings for economic reasons, compared to 37% of the general population.
41% of aid recipients reported that their
living environment is dirty and surrounded
by trash. 42% report high levels of noise and 36% live in dilapidated houses. In addition, they deal with severe drug use and traffic issues, physical violence and sexual offenses.
53% of aid recipients have no air-conditioning or cannot not allow themselves to use it. 41% have no heaters or are unable to use them due to economic distress.
19% of aid recipients live in an apartment with only one bedroom.
Education80% of aid recipients do not have a high school diploma (compared to 33% of the general population), 41% have not completed their studies in high school (compared to 10%) and only 4% have higher education (compared to 32%).
Approximately 57% of parents receiving aid reported being unable to send their children to extracurricular activities and private lessons because of their economic
situation. An additional 44% reported being unable to purchase books and other basic school supplies.
44% of aid recipients reported that it is important for them to continue their education, a decrease of 12% compared to last year (50%).

8
66% of the people receiving aid stated that the reasons preventing them from achieving their goal of a higher education are primarily tuition fees and childcare. 73% reported that these obstacles make it impossible for them.
Health89% of the people receiving aid stopped buying medications this year on a regular basis (40%) or from time to time (49%) due to economic hardship (compared with 21% among the general public).
89% of the people receiving aid gave up dental care completely (40%) or at times (49%) due to economic hardship, compared with 37% in the general population.
62% of the people receiving aid suffer from many health complications, compared to 45% among the general public. 25% suffer from hypertension (compared to 13% of the general population), 24% have high cholesterol (compared to 17% of the general population) and 23% have diabetes (compared to 12% of the general population).
65% of the people receiving aid have basic health insurance through the Kupat Holim (compared to 17% among the general public), and 80% of the people receiving aid are unable to purchase supplemental health insurance (an increase of 14% compared to last year).
53% of the people receiving aid felt the
need for emotional support in the past year, but had to do without because they could not pay for it.
25% of the people receiving aid are chronically ill, handicapped or disabled.
Food Security90% of the people receiving aid have suffered during the past year from a lack of food or from nutritionally low diets, 55% suffered often or very often, compared to only 11.6% from the general public.
59% of the people receiving aid had to reduce or skip meals during the past year because they did not have enough money to buy food. 39% indicated that this happens almost every month.
23% of the people receiving aid reported that they did not eat a whole day because they did not have enough money to buy food. 37% indicated they felt hungry and 29% lost weight due to economic hardship.
12% of the people receiving aid were forced, over the past year, to look for food in garbage cans, beg for money, or eat discarded food. This is an increase of 16% compared to the previous year.
33% of the monthly expenditure of the people receiving aid is devoted to food, a total of ₪ 1,852 (average persons per household is 4.8). There is a gap of 1,000 ₪ when compared to the expenditure for food as needed for a family of five people at about 2900 to 3000 ₪.
9
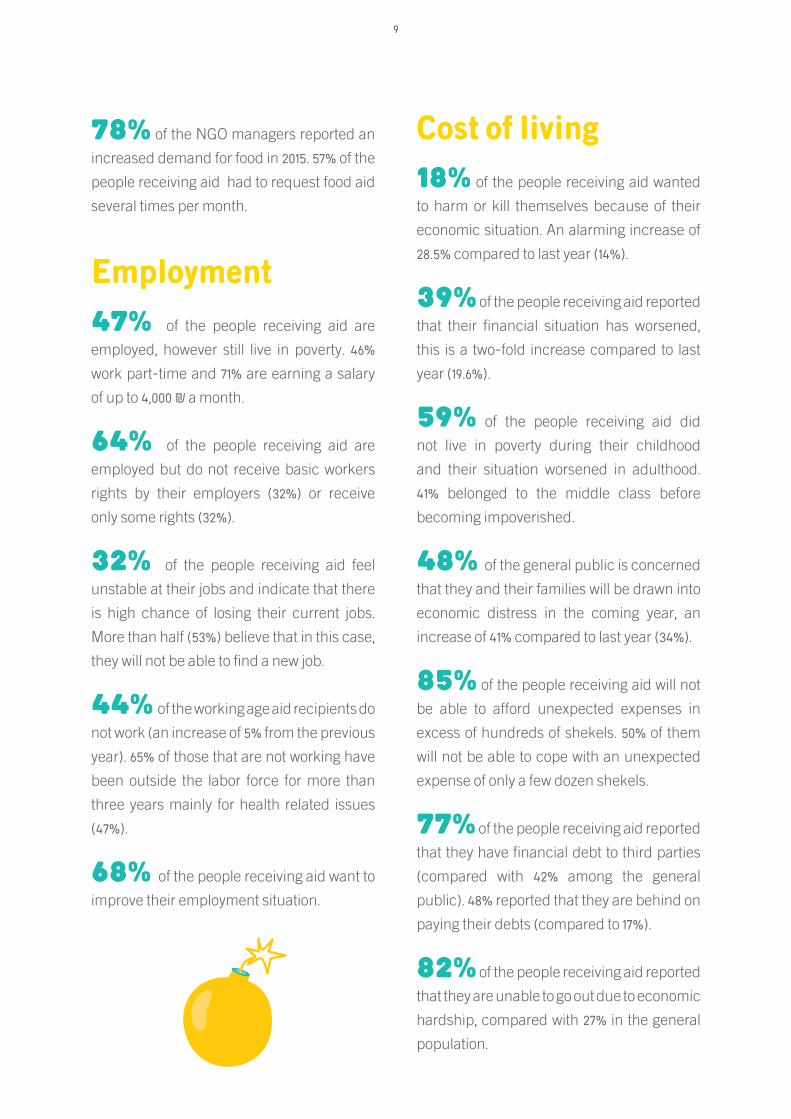
78% of the NGO managers reported an increased demand for food in 2015. 57% of the people receiving aid had to request food aid several times per month.
Employment47% of the people receiving aid are employed, however still live in poverty. 46% work part-time and 71% are earning a salary of up to 4,000 ₪ a month.
64% of the people receiving aid are employed but do not receive basic workers rights by their employers (32%) or receive only some rights (32%).
32% of the people receiving aid feel unstable at their jobs and indicate that there is high chance of losing their current jobs. More than half (53%) believe that in this case, they will not be able to find a new job.
44% of the working age aid recipients do not work (an increase of 5% from the previous year). 65% of those that are not working have been outside the labor force for more than three years mainly for health related issues (47%).
68% of the people receiving aid want to improve their employment situation.
Cost of living18% of the people receiving aid wanted to harm or kill themselves because of their economic situation. An alarming increase of 28.5% compared to last year (14%).
39% of the people receiving aid reported that their financial situation has worsened, this is a two-fold increase compared to last year (19.6%).
59% of the people receiving aid did not live in poverty during their childhood and their situation worsened in adulthood. 41% belonged to the middle class before becoming impoverished.
48% of the general public is concerned that they and their families will be drawn into economic distress in the coming year, an increase of 41% compared to last year (34%).
85% of the people receiving aid will not be able to afford unexpected expenses in excess of hundreds of shekels. 50% of them will not be able to cope with an unexpected expense of only a few dozen shekels.
77% of the people receiving aid reported that they have financial debt to third parties (compared with 42% among the general public). 48% reported that they are behind on paying their debts (compared to 17%).
82% of the people receiving aid reported that they are unable to go out due to economic hardship, compared with 27% in the general population.
10
Responsibility for alleviating poverty62.5% of the general population believe that the issues of poverty and the social inequality are the most pressing matters that needs to be addressed. 49% believe security is the most pressing matter, and 30.5% believe it is violence and the presence of racism in the Israeli society.
70% of the public sees the government as responsible for poverty reduction, but 67% believe that the treatment of the poverty problem is a low priority or not a priority at all.
83% of the public believe that the policy of the current government will not lead to a reduction of poverty and about half do not
believe that any government officials will take care of the problem of poverty (Prime Minister, Ministers of Finance and Social Affairs).
80% of the israeli public support lowering the VAT on food products, an increase of 10% compared to last year.
25% of the public believe that royalties on natural gas resources should be returned to the state budget. A similar percentage said that the funds should be transferred to the welfare budget (24%) and education (21%).
77% of NGO managers reported that 80% or more of the people receiving aid were referred by social workers at the Welfare Department. 71% of NGOs reported that they do not receive support from the Welfare Department for handling the needy.

11
IntroductionReducing poverty rates and the social gaps is a moral obligation we have as a country and society. However, the question is if it is also an economically worthwhile investment?
In this section, we answer this question through a thorough analysis of the cost of poverty on the Israeli economy as opposed to the required cost to reduce it.
Our research indicates that poverty has a heavy economic price on the Israeli economy, and the price continues to increase with each passing year. The economic costs of poverty are divided into 3 sections:
Direct Costs: public spending on aid given to people living in poverty (such as income assistance and distribution of meals to families living in food-insecure households).
Indirect costs: public spending on dealing with symptoms caused by poverty (such as the higher rates of diseases and crimes).
The Cost of Poverty in Israel and the Returns on Shrinking InvestmentsResearch Administrators: Gilad Tanay and Or Kramer
Principal Investigator: Amit Loewenthal
The potential cost: the economic loss to the overall economy due to the potential earning capacity of capable individuals were it not for their current situation would contribute to the country’s financial growth.
The study found that the direct costs of dealing with poverty are about 7 billion NIS per year, the indirect costs are at least 5 billion NIS per year, and that the potential costs are 36 billion NIS per year.
We estimate the annual cost of poverty on the Israeli economy is at least 48 billion NIS: 36 billion of which stem from the potential loss of earning capacity, and at least 12 billion NIS from direct and indirect expenses for dealing with poverty and its social implications.
What then is the economic return on investment from poverty alleviation? This is calculated as the ratio of the minimum investments required to reduce poverty to the forecasted profits that would be obtained through savings, as well as increased earning potential of those in poverty.
According to the report from the ‘Elalouf Committee

12
to Reduce Poverty’, an investment of 7.5 billion NIS per year is required over a decade to lower the poverty rates in Israel to the average rates of the other OECD countries.
The economic analysis presented below shows the economic benefits of implementing the committee’s recommendations, after consideration of inflation (ie. the change in the value of currency over time) would amount to gains of 132 billion NIS for the years 2016 - 2035 against the cost of 68 billion NIS (ie. a total gain of 64 billion NIS and a 93% return on investment).
In conclusion, the efforts to reduce poverty and social inequality in Israel are not only a moral obligation, but a sound economic policy and a financially worthwhile investment.
This section is a summary of the study that was conducted by a team from the ERI Institute, headed by Amit Loewenthal on behalf of Latet and does not include all of the calculations and methodologies used. The complete document detailing the methodology, underlying assumptions, and calculations, as well as a list of sources used can be viewed at http://www.latet.org.il
We would like to thank Dr. Moshe Hazan, Dr. Analia Schlosser, Dr. Ofer Seti, Mr. Maor Milgrom, Ms. Maayan Ashkenazi and Mr. Zeev Krill for their help and advice in producing the report.
Poverty cycle: Theoretical Background
To understand the economic costs of poverty to the economy, one must first understand the relationship between the phenomenon on individual and family level, as well as the larger social and economic level.
The effect of poverty is felt not just by individuals and their families, but also by the social circles around them - their neighborhoods, communities, throughout the cities in which they live all the way up to the level of the economy and even the country as a whole.As the country’s poverty rates go higher (and more people are living in poverty) its effects are felt with more intensity in more circles.
Figure 1 illustrates the mechanisms through which poverty affects households and details and sizes including circuit disciplines. Growing up in a poor household significantly increases the risk of crime, diseases, and reliance on social security. This impedes the development of important skills needed to integrate into the workforce, as well as the education system.
Poverty impacts both the individual and society at large. Growing up in a poor households increases the chances of being involved in crime, in having health

13
complications, and in becoming dependent on social services. Moreover, it impairs the development of needed skills to integrate into the workforce and acquire a higher level of education.
At market level, these phenomena produces two types of costs. First, higher public expenditure on the costs of dealing with people in poverty (such as food distribution to families suffering from food insecurity). Second, lower productivity and lower wages translates into a direct decline in GDP and economic growth.
At the individual level, the cost implications are the increased likelihood of intergenerational transmission of poverty ie. the likelihood that a person who grew up in a poor household will continue to be in poverty as they become an adult. The inter-generational transfer of poverty, creates a vicious cycle that perpetuates and compounds the cost of poverty over time, both for the individual and for the economy as a whole.
Let’s examine a few examples illustrating the principles outlined above. Food insecurity, which is highly correlated with poverty in Israel1, may impair cognitive2 and social development, as well as increase the risk of chronic diseases such as diabetes and hypertension3. Higher probability of health problems among those with meager means, as a direct result of poor diet and exposure to environmental problems, means relying on public health services in greater capacities. This causes an increased load
1 (Andlbld and others 2014)2 Hamelin, Habicht & Beaudry 19993 Seligman et al 2007, 2010
on the healthcare system and increased public expenditure on health (ie. days of hospitalization, more medicines and medical services), as well as lost output due to absence or abstention from work.
Delays in personal development and feelings of deprivation are a result of socio-economic inequality. Another result is limited access to adequate education, and this often leads to an increased tendency for crime and psychological4 problems. Crime and violence caused by poverty carry additional costs such as; additional police personnel, court fees, expenses on the detention and treatment of prisoners, as well as the compensation and rehabilitation to the victims of the crimes.
The overall negative symptoms related to poverty also reduces the ability to acquire the skills needed for the labor market. Throughout the life of the individual, the lack of these skills have serious implications for employee productivity, earnings capacity, and chances of settling in a permanent a job5.
The economy would suffer from relatively lower productivity, would produce less goods and services for the entire population, which would then prevent further economic growth and rising standards of living for the general population. This could be avoided, were it not for the presence of poverty.
Poverty, therefore produces a complex web of causes and effects which translates to significant damage and lack of long-term
4 Fainzylber, Lederman & Loayza, 2002 and Gilbert et al 20095 Solon 1999, Blanden, Hansen & Machin 2008 and Uzuki 2010

14
well-being for individuals and of prosperity for the entire economy. The following sections represent a numerical assessment of the overall costs to the economy, stemming from the same symptoms that make up this complex network.
Figure 1: The mechanisms by which poverty affects individuals and society6
6 Based on similar charts of Hirsch (2008) and Laurie (2008).
The Cost of PovertyJust as poverty is a complex social phenomenon, the assessment of the financial cost of poverty is just as complex.
To somewhat simplify the problem, we have classified this study and the costs into two main categories:1. Opportunity Cost: The lack of goods and
services from the people in poverty who would otherwise be productive members of society.
2. The cost of addressing poverty: The public expenditure, both direct and indirect, in respect to treating the issue of poverty.
Below are numerical estimates for both types of costs.
The Potential CostThe Loss of Potential Earnings
The opportunity cost in this case relates to the question: “How much did the Israeli economy lose every year because of low income among those living in poverty”? We will present a way to answer this question using a methodology that evaluates the impact of poverty on the future earning capacity of a family7.
The calculation will be displayed below in estimation of losses for 2013 (the last year for which there was sufficient data) resulting from the fact that the current workforce includes workers with low productivity rates due to a poor family environment when growing up. For example, suppose that Israel’s total workforce was only 100 employees, with 20 of them having grown up in poor families. Such a work force would naturally be less productive compared to a theoretical workforce where all 100 workers grew up in families that were not economically disadvantaged.
7 This methodology is based on a study con ducted in the UK by Branden, Hansen & Machin. This methodology is relatively con servative in assessing opportunity costs of poverty. In addition to less conservative methodologies tested, such as the Canadian model of Laurie (2008), with even higher costs. For reasons of conservatism the methodology we chose to focus on was the British model.
Higher public expenditure (the cost
of treating poverty)
The market produces less merchandise
and develops slower (opportunity cost)
Lower salary and productivity
Nutritional insecurity
Kids who grow up in poor houses
Poor households
Low skills lead to higher chances of:
• health complications • crime • using welfare services

15
Loss of income can be divided into two categories: First, the loss of additional income that would have otherwise been materialized for people who worked in 2013, and grew up in a poor household. Second, the loss of additional income that would have otherwise been materialized for people who did not work in 2013 and grew up in a poor household. Their productivity was affected and prevented them from being employed.
The estimates are based on extensive research on the relationship between poverty
Table 1: Economic loss of potential earning ability from workers who grew up in poverty
Ages Population
Population
having grown up
in poverty
Employees
who grew up in
poverty
Average annual
* wage loss in NIS
Total loss of wages
in NIS
18-24 594,809 209,373 94,388 6,661 628,750,65425-24 970,002 255,952 177,822 22,515 4,003,619,42835-44 803,521 163,754 128,113 39,964 5,119,973,60345-54 592,501 138,508 103,145 43,231 4,459,015,317Total 2,960,832 767,587 503,468 28,227 14,211,359,002
* (Note: total loss of the average annual salary is obtained by dividing the total wage loss to the size of the working population that grew up in poverty. The column that presents the average annual wage loss in NIS is not a total, because it shows the different data averaging in size)
and earning ability in the UK8. This study examined the relationship between poverty in the household of 16 year olds and their employment and wages later in adulthood. The findings from this study were then applied to the data on Israel. The calculation of the total economic loss of revenue in 2013 because of the poverty that existed in the past, and spans from 1975 through 2013. Tables 1 and 2 show the loss of wages that can be attributed to the fact that some of those same people were raised in poor households.
8 Blanden, Hansen & Machin (2008)

16
Table 2: Cost of unemployment for those who grew up in poverty
Ages Population Population having
grown up inpoverty
Loss ofemployees
Estimated average annual salary peremployee in NIS
Total loss ofwages in NIS
18-24 594,809 209,373 26,800 29,814 799,006,85225-24 970,002 255,952 35,321 50,282 1,776,009,38835-44 803,521 163,754 10,808 65,027 702,791,52145-54 592,501 138,508 9,141 65,781 601,333,864Total 2,960,832 767,586 82,070 47,266 3,879,141,624
The research revealed that the loss of GDP in 2013 stemming directly from the loss of earning capacity and unemployment from those who grew up in poor households is around 18 billion NIS (14.2 billion plus 3.8 billion). However, the opportunity cost of poverty does not stop here.
The potential raise in salaries, as shown above, is due to increased employee productivity. An increase in employee productivity therefore has another long-term impact, and creates value.
Trade and services in a modern economy are produced by workers and capital9. Where employee productivity is higher, capital output will also be higher. Therefore, holders of capital have an incentive to invest and expand their capital stock. Given the conventional assumptions about macroeconomic theory of production in a modern economy, this means that if the average salary (representing the marginal productivity of employees) increases, then overall GDP will increase as well.
Table 3 shows the difference between actual wages and GDP in 2013 to potential wages, productivity and GDP.
Table 3: GDP Growth Rates and an Increase in Wages
Actual Potential Difference(Workforce (Number of employees 2,324,145 2,406,215 82,070Aggregate annual wage in NIS millions) 254,052 272,114 18,062Average annual salaries in NIS (millions) 109,310 113,100 3,790GDP in 2013 in NIS (millions) 1,049,108, 1,085,407, 36,2990
Table 3 shows that the GDP growth rate would have been higher by approximately 36.3 billion NIS (a difference 3.5%), assuming increasing wages. Assuming GDP was growing in relation to increasing salaries and poverty levels remained low. Therefore, the attributed loss of income from potential capital and is estimated at 18 billion NIS.
9 Refers to to physical capital, such as factory machinery, office computers and the like.

17
Table 4: Summary of opportunity costs in 2013
NIS (millions) As a percentage of GDPThe total loss of income from work 18,091 1.72%The total loss of income from capital 18,208 1.74%The total loss of revenue of the GDP 36,299 3.46%
We believe that the opportunity costs in 2013, or the monetary value that the Israeli economy had lost in respect to poverty over the past years, has amounted to about 36.3 billion NIS, which is 3.46% of GDP.
The Cost of Addressing PovertyThe cost of addressing poverty is an ongoing burden to the economy due to the additional implications of poverty. Due to limited data available regarding the association between poverty and other public expenditures in Israel, we have taken a conservative approach to our calculations, which values the expenses at lower than actual levels. Therefore, we can conclude from this calculation is only the minimum cost of dealing with poverty and its consequences. The cost of addressing pov e rty are divided into 3 main categories: social welfare expenses, healthcare expenses and crime related expenses.
Welfare ExpensesAs part of gov e rnment expenditures in Israel, there are social service expenses to individuals and the families. In addition to this, there are a number of specific, targeted expenditures to low-income populations, such as income support and rent subsidies. In Israel, there is an extensive range of non-p r ofit organizations10 that provide similar or additional services to those already offered by the government.
From the state’s allocated budget, we calculated the the provisions directly dealing with poverty (such as National Insurance Allowances and rent subsidies), amounted in 2013 to 6.9 billion NIS.
Examining thes e government expenditures reflect indirect expenses on dealing with poverty, including services for children, youth and adults at risk, and other related expenses. The Ministry of Social Affairs in 2013 showed that this expenditure amounted to 2.763 billion NIS. We estimate that approximately 71% of this expenditure is caused by poverty11, specifically 1.950 billion NIS.10 According to Limor N. (2014). Summary of data, GuideStar, Lod, Total Expenditure for 2011 of the Social Welfare Organizations amounted to 7.6 billion NIS (current prices, total revenues this year stood at about 8.3 billion NIS (current prices), while only 0.6% of these revenues came from government support.11 This assessment is confirmed by Bramley and Watkins (2008)

18
An examination of financial and verbal statements of the NGO’s that are active in the field of welfare and assistance to impoverished populations shows that revenues in 2013 stayed at 444 million NIS. Hence, the costs falling under the category of relief were 9.3 billion in 2013.
Health care costsThere exists, as previously mentioned, a high correlation between healthiness and economic status. For example, according to a report by The National Plan measuring Community Health Care in Israel, there are very significant differences in the incidence of diabetes when dividing the population by socio-economic status. We have estimated the costs of dealing with the three diseases that are most highly correlated with food insecurity. Since nutritional insecurity is mainly a result of poverty, we can attribute the increased costs of dealing with these diseases to poverty.
Diseases Number of ill
patients in Israel
Annual cost
of patient care
in NIS
Number afflicted
do not suffer from
nutritional insecurity
Several who have
also suffered
from nutritional
insecurity
Some suffer
because
nutritional
insecurity
Annual cost
for nutritional
insecurity NIS
Type 2 diabetes 409,444 42,708 338,876 70,568 36,964 1,579Hypertension 1,011,674 2,840 781,105 230,569 38,428 109
Hyperlipidemia 1,272,334 3,911 964,050 308,285 71,143 278Total costs 1,966
Because those who suffer from hypertension, diabetes and hyperlipidemia are at risk for other health issue, such as heart disease and stroke, it is very possible that there are additional costs to the ones listed above.
Health expenditures in 2013 totaled at least 1.96 billion NIS according to our estimates12.
Police and Law Enforcement ExpensesThe total expenses of The Ministry of Public Security (including staff, the Israeli police force and the Prison Authority) and the expenses The Ministry of Social Affairs and Health are directly related crime and in 2013 amounted to approximately 10.7 billion NIS.
Because there are no sufficiently accurate data on the correlation between the crime and poverty in Israel, we estimated conservatively that only 5% of the total costs, or 0.539 billion NIS, attributable to poverty13.12 This estimate is the cost to deal with the three diseases listed as highly correlated with food insecurity.13 This assessment is supported by Bramley and Watkins (2008), showing that the UK the lower limit expenses due to crime is 5% of the budget of the relevant authorities.

19
Table 5: Summary of the costs addressing poverty, 2013 (NIS)
DomansExpenses arising
from povertyHealth and illness resulting from food insecurity 1,966crime 539
Welfare, government indirectly (expenses that are not(directed only to the poor population
1,951
Welfare, direct government (intended for individuals(within the poor population
6,902
(Welfare, direct private (through associations 444Total 11,802
The cost of addressing poverty, ie the public expenditure(both private and public) resulting from poverty in 2013 totaled at least 11.8 billion NIS. If some of these expenses were to be spared due to lower poverty rates in that year, this total amount could have been added to the state budget.
We estimate the economic cost of poverty in the Israeli economy in 2013 to be at least 48.1 billion NIS: 36.3 billion NIS in lost revenue and labor (opportunity cost) and at least 11.8 billion in direct and indirect expenses in dealing with poverty and its social ramifications.
The Future Costs of Preserving the Status QuoIn the previous section we focused on a specific year (2013) and evaluated the cost of not treating poverty over the past years. In this section we estimate the economic costs for the next 20 years, which are expected to result from the poverty that currently exists today (assuming that the status quo will be maintained and poverty rates will not be reduced).
To estimate the future cost of preserving the
status quo in relation to poverty, was based on two comprehensive empirical studies (funded by the International Monetary Fund14 and the OECD15) that evaluated the effect of net income inequality on economic growth. Both studies examined the relationship between inequality in a given year, and the growth rates of the following five years.
Calculations used from the basis of these studies were then extrapolated for economic growth over the next 20 years in which Israel would have no poverty at all, and was then compared to a scenario where poverty rates remained as they are. Needless to say, that the first scenario is impossible. However, theoretically, the gap between economic 14 Ostry, Berg & Tsangarides (2014)15 Cingano (2014)

20
growth and growth in this scenario where poverty rates remain as they are today, reflects the overall future cost of not reducing poverty.
In the first study (funded by the International Monetary Fund), based on data from 153 countries, found that a decrease of one percentage16 point in the Gini Index (by net income17) in the base year, exceeds the average annual growth rate for the next five years at 0:07 to 12:14 percentage points18.
The second study based on data from 31 countries in the OECD, examined the growth rate in five-year intervals (for example, the growth of economies between 1970 and 1975), and found that the growth rate exceeds the five-year average by 0.8 to 1.2 percentage points, with a drop of one percentage point in 16 The percentage represents change. For example, an increase of 2% to 3% is an increase of one percentage point, but reflects a change of 50%.17 The Gini Coefficient ranges from 0 (absolute income equality) to 1 (complete income inequality).18 For example, if in 2010-2015 the average rate of growth was 2%, down one percentage point in the Gini index, (for example from 0.29 to 0.28,) this will increase the growth rate of 2.07% 2.1%.
the Gini index.
In order to preserve the principle of conservatism, we used the lower limit of this estimation based on data from the OECD countries (most similar to Israel in character), that is, we estimated that every point drop in the Gini Index in a given year results in an increase of 0.8 percentage points for the overall growth in next five years.
In order to evaluate the change in the Gini index due to the reduction of poverty, we calculated the data from the Income Services of the Central Bureau of Statistics in 2013, and the Gini Index for that year for the two scenarios presented above. We assume, conservatively, that households stepping out of poverty are those who are living closest to it and that their new income is identical to that line (for example, if the household poverty line is 2,989 shekels, and household income figure is 2,000 shekels, income would rise by NIS -989).
Summary of the macro economy as demonstrated in two scenarios below:

21
Table 6: The effect of the decline in inequality growth, as a result of the reduction of poverty
YearPopulation
(in K)
GDP in billions NIS GDP per capita
in thousandsThe Gini index
Growth marginsover 5 years
Scenario A
(conservative
estimate)
Scenario B
(No poverty)
Scenario A
(conservative
status)
Scenario B
(No poverty)
Scenario A.
(Conservative
status)
Scenario B
(No poverty)
Scenario A.
(Conservative
status)
Scenario B
(No poverty)
2015 8,388.8 1,106 1,106 131.9 131.9 0.353 0.353 - -2020 9,105.9 1,221 1,221 134.1 134.1 0.353 0.314 1.7% 1.7%2025 9,844.9 1,348 1,390 137.0 141.2 0.353 0.314 2.1% 5.2%2030 10,604.6 1,489 1,534 140.4 144.7 0.353 0.314 2.5% 5.6%2035 11,395.6 1,644 1,693 144.2 148.6 0.353 0.314 2.7% 5.9%
Table 7: The total addition to GDP as a result of decreasing inequality
YearThe gap between Scenario A in which: the total future costs of preserving existing poverty rates
2016-2020 0.002021-2025 120.002026-2030 217.952031-2035 239.39Total 577.34
In summary, the analysis indicates that the preservation of current poverty rates is expected to cost the economy about 580 billion NIS over the next 20 years. Since there is no possible scenario in which we can get to a rate of 0% poverty, it is clear that there is no way to avoid all this loss, but only a part. The next section shows what would be the realistic returns of a poverty reduction plan, assuming we implement the recommendations of the ‘Elalouf Committee to Fight Poverty’.
We believe that if poverty rates remain at their current levels, the future cost to the economy is expected to be approximately 580 billion NIS over 20 years.
Forecasts of Future Benefits for Poverty Reduction: The Implementation of Recommendations from The ‘Elalouf Committee to Fight Poverty’
In this section we seek to assess the future economic benefits of a real plan to reduce poverty in Israel. Therefore, we chose to examine the proposed plan of the ‘Elalouf Committee’ from the year 2014. The objective of this program is for Israel to reach the average rates of poverty as those in the OECD countries within 10 years (provided that the conclusions the commission would be adopted in full19).
National Insurance Institute, Research and Planning Administration (2014). Report on poverty and social gaps in 192013 Annual Report, Jerusalem.

22
In favor of this assessment, we adopted the premise of the commission that such a target is possible within this time frame, provided that the committee’s conclusions would be adopted in full during these ten years. The poverty rate in OECD countries is calculated by a different method than in Israel, therefore we translated the objectives of the ‘Elalouf Committee’ in correllation to terms relevant to Israel as much as possible.
Table 8: The Incidence of Poverty in Israel and OECD as defined by the OECD20
The incidence
of poverty
Israel in 2013
as defined by
the OECD
Israel in 2013
as defined by
Social Security
The average for OECD
countries from 2011 to 2012,
as defined by the OECD
Estimation of committee
goals to fight poverty
as defined by Social SecurityPeople 18.0% 21.8% 11.1% 13.4%Children 23.5% 30.8% 13.5% 17.7%Households - 18.6% - 11.4%
The difference between the results of Scenario A and the official figure, which is 0.36, may cause additional or 20different information at the disposal of researchers from the OECD
Scenarios forecastTo evaluate the economic benefits of the proposed plan by The Commission to Fight Poverty, we look at two possible scenarios:
• Scenario A - Preserving the Status Quo: In this scenario, the incidence of poverty in the coming years remains at the same level as in 2013: 18.6% of households, 21.8% of people and 30.8% of children living below the poverty line.
• Scenario B - Achieving the objectives of the Committee: This scenario simulates a situation in which the committee’s recommendations to fight poverty are adopted starting in 2016, and the incidence of poverty decreases gradually. This
would mean that by 2025 the poverty rates of people and households drops to 13.4% and 11.4% respectively, and the poverty rate among children decreases to 17.7%. After 2025, poverty rates would remain at this level.
In both scenarios, the forecast is based on the assumptions we have outlined in the previous section, based on research from the relationship between inequality and growth in the OECD countries.
Scenario B, the Gini index change is due to the decline in the poverty rate is 0.9, from -0.353 to -0.344. To simplify this calculation, we assume that half of the change will take place in 2020, and the second half in 2025.

23
Summary of the macro economy as outlined in two scenarios below:
Table 9: The Effect of the Decline in Inequality & Growth, as a Result of the Reduction of Poverty
YearPopulation
(in K)
תמ“ג במיליארדי ש‘ תוצר לנפש באלפי ש‘ מדד ג‘יני צמיחה, מרווחי 5 שניםScenario A
(conser-vative
estimate)
Scenario B (objectives
achieved)
Scenario A (conser-
vative
estimate)
Scenario B (objectives Achieved)
Scnario A (conser-
vative
estimate)
Scenario B (conser-
vative
estimates)
Scenario A (conser-
vative estimates)
Scenario B (objectives
Achieves)
2015 8,388.8 1,106 1,106 131.9 131.9 0.353 0.353 - -2020 9,105.9 1,221 1,221 134.1 134.1 0.353 0.349 1.7% 1.7%2025 9,844.9 1,348 1,353 137.0 137.4 0.353 0.344 2.1% 2.5%2030 10,604.6 1,489 1,499 140.4 141.3 0.353 0.344 2.5% 3.2%2035 11,395.6 1,644 1,655 144.2 145.2 0.353 0.344 2.7% 3.4%
Table 10: Total Addition to the GDP every 5 yearsScanario B billions
Year2016-2020 0.002021-2025 13.032026-2030 38.542031-2035 52.77Total 104.34
Scenario A outlines the following summary for the coming years: poverty will remain at its current level. Scenario B simulates lowering poverty rates in accordance with the committe’s objectives. This is a significant benefit in the form of extra GDP per the amount of 104.34 billion NIS over the next 20 years. However we are not implying that implementing the committees recommendations would be financially benificial. In order to determine whether the investment will payoff or not, we must consider the expected expenditures.
If we can achieve the objectives of the ‘Elalouf Commitee to Fight Poverty’, the additional GDP according to the model (which takes into account the level of inequality and its impact on growth) would amount to approximately 104 billion NIS in the years 2016 through 2035.
Evaluating the Return on Reducing Poverty According to The Elalouf Commitee’s Blueprint to Fight Poverty.
This section presents the returns expected from the poverty reduction programs,

24
and outlines the proposal by The ‘Elalouf Commitee to Fight Poverty’.
In general, the yield is calculated as the ratio between the investment and the profit obtained from that initial investment. Therefore, in order to assess the returns on poverty reduction programs, we should
consider the initial investment required to carry it out, and to assess the expected benefits from its implementation.
The required investment, as recommended by the Commission, is 7.5 billion NIS per year for 10 years.
Table 11: Annual expenses in respect to implementing the conclusions of The ‘Elalouf Comitee to Fight Poverty’ (in billions NIS)21
Year/Domain Individual, Family, and Community
Housing Economy and Employment
Education Health Total
2016 3.035 1.59 2.3 0.5 0.56 7.992017 3 1.61 2.3 0.27 0.56 7.742018 3 1.63 2.3 0.27 0.56 7.76
2019-2025 3 1.63 2.3 0.07 0.56 7.56
Does this investment carry a positive return only from an economic perspective? This question depends on the expected benefits to be received. These benefits are in the form of cost savings in government expenditure due to the reduction of poverty and the additional GDP. The addition to the GDP ratio is calculated on the basis of the assessment in Section 5, while expected savings is calculated based on the estimated costs of dealing with poverty in section 3.2.
Table 12: Benefits vs. Costs, 2015-2035, the Implementation of the Conclusions of the Commission (in billions NIS)
Gains to GDP Expenditure on Poverty Reduction Money Saved104.34 76.37 70.12
However, in order to calculate the returns, an additional step is required, calculating the change in the value of money between of two periods of time. Most of the revenues from the implementation of this plan are expected to return towards the end of the forecast range and the beginning shows the main expenditure. Therefore, it is important to examine the change in the value of money throughout that period of time. Table 12 shows the costs and benefits of implementing the recommendations of the committee, assuming a real discount factor of 2%:
21 Elalouf Committee to Fight Poverty Report (2014).

25
Table 12: Benefits vs Costs, 2015-2035, the Implementation of the Comittee’s Conclusions, as Discounted by a Factor of 2% (in billions NIS)
Gains to GDP Expenditure on Poverty Reduction Money Saved
77.54 68.65 55.02
As you can see, after examining the change in the value of money over the period of time, total benefits (gains GDP and other savings) is 132.56 billion NIS, compared to an expense of just 68.65 billion NIS. Therefore, the net profits (benefits minus costs) of implementing the conclusions of the committee is 63.91 billion NIS, translating into yields of 93%.
Implementing the recommendations of the Commission to Fight Poverty would yield a net profit of 63.91 billion NIS and have a 93% return on investment over the years 2016-2035.
ConclusionIn this chapter, we reviewed the mechanisms by which poverty impacts the economy. We have estimated the economic costs and have showed that the investment in reducing poverty brings positive returns due to increased growth.Our findings suggest that reducing poverty is not only a moral obligation but is also in the economic interests of all of us; poor, rich, middle class, wealthy, decision makers, and the general public of Israel.
During the study, we reviewed many ways in which poverty affects society, based on the assumption that poverty is a multidimensional phenomenon. Other studies and surveys focus on collecting relevant data and examine the impact of poverty on different areas in Israel, while others focus on aspects such as criminology and public health, and will enable a more complete picture about the returns from poverty reduction. We belive that result of these studies will prove that the yields are much larger than what we could have proved in our research.
We would like to thank MAZON a Jewish response to hunger, for supporting our advocacy ef-forts and the publication of the Alternative Poverty Report. We would also like to thank the NGOs and other partners in assisting and collecting the data that made this report possible. Our joint efforts are changing the status of poverty in Israel.
For more information, please visit us at www.latet.org.ilCall us from US 1800-2044604 and from the world +972-6833388