The environmental responses of harmful algae known to ...
105
The environmental responses of harmful algae known to impact aquaculture species along the French Atlantic and English Channel coasts
Transcript of The environmental responses of harmful algae known to ...

The environmental responses of harmful algae known to impact aquaculture species along the
French Atlantic and English Channel coasts

Content
I. Climate change and HAB an aquaculture
II. Niche and subniche concept
III. The thesis results
IV.Application to the post-doc

Global change
Global warming

Global change
Global warming

Global change
Global warming

Global change
Global warming

Human impact

Human directly effect on food web
Human impact

=
Agriculture Nitrogen (N) Phosphate (P)
Eutrophication
Human impact

Harmful algae

Problematic
What is/are the real cause(s) of Harmful Algae Bloom (HAB)?
“The response of harmful algal blooms to the multifaceted forcing of projected climate change is largely unknown and
highly speculative.” (Wells et al., 2015)

Problematic
“[…] the role of biotic interactions as factors that need to be understood thoroughly […]” (Soberón et al., 2009)
What is the role of biotic interactions?

Describe and measure the spatial-temporal responses of the phytoplankton community
with the occurrence of a harmful algae.
Aim

Global warming
Eutrophication
Community
Harmful species
Interaction Global Change
Aim

E1
E2
E
Niche concept
(Jackson and Overpeck, 2000)

E1
E2
E
Nf
Niche concept
(Jackson and Overpeck, 2000)
E1
E2
E
Nf
Np
Niche concept
(Jackson and Overpeck, 2000)

E1
E2
E NR
Nf
Np
Niche concept
(Jackson and Overpeck, 2000)

E1
E2
E NR
Nf
Np
B
Niche concept
(Jackson and Overpeck, 2000)

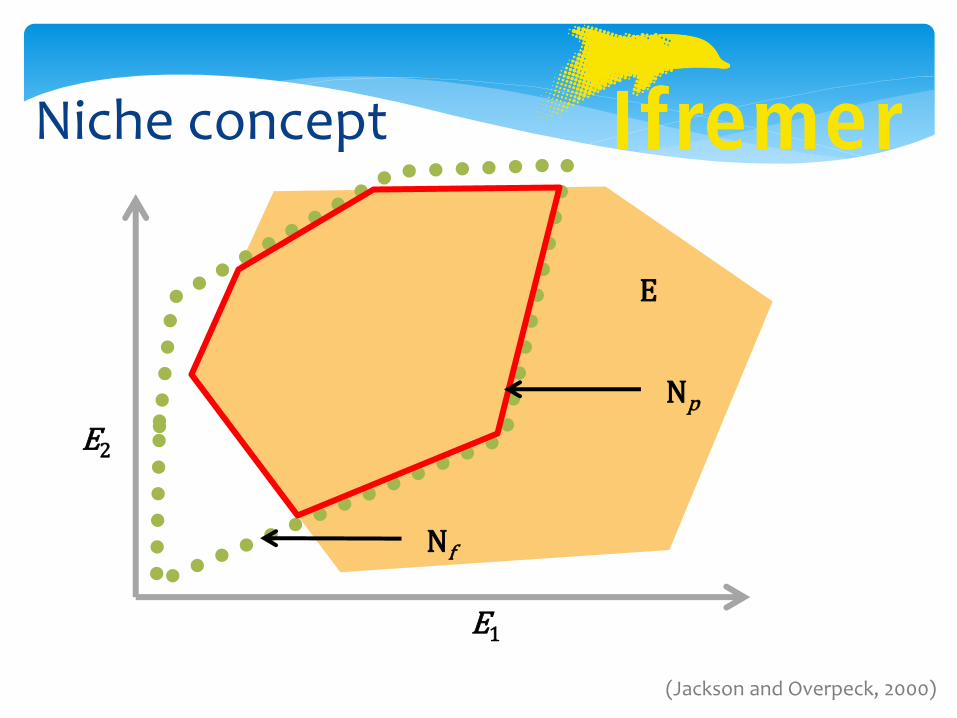
Subniche concept
Karasiewicz, S., Dolédec, S., Lefebvre, S., (2017). Within outlying mean indexes: Refining the OMI analysis for the realized niche decomposition. PeerJ.
E K
Subniche concept
E1
E2

Karasiewicz, S., Dolédec, S., Lefebvre, S., (2017). Within outlying mean indexes: Refining the OMI analysis for the realized niche decomposition. PeerJ.
E1
E2
E K
NR
Subniche concept

Karasiewicz, S., Dolédec, S., Lefebvre, S., (2017). Within outlying mean indexes: Refining the OMI analysis for the realized niche decomposition. PeerJ.
E1
E2
E
NR
K
Sp
Subniche concept

Karasiewicz, S., Dolédec, S., Lefebvre, S., (2017). Within outlying mean indexes: Refining the OMI analysis for the realized niche decomposition. PeerJ.
E1
E2
E K
SR
NR
Sp
Subniche concept

Karasiewicz, S., Dolédec, S., Lefebvre, S., (2017). Within outlying mean indexes: Refining the OMI analysis for the realized niche decomposition. PeerJ.
E1
E2
E K
SR
SB
NR
Sp
Subniche concept

Application

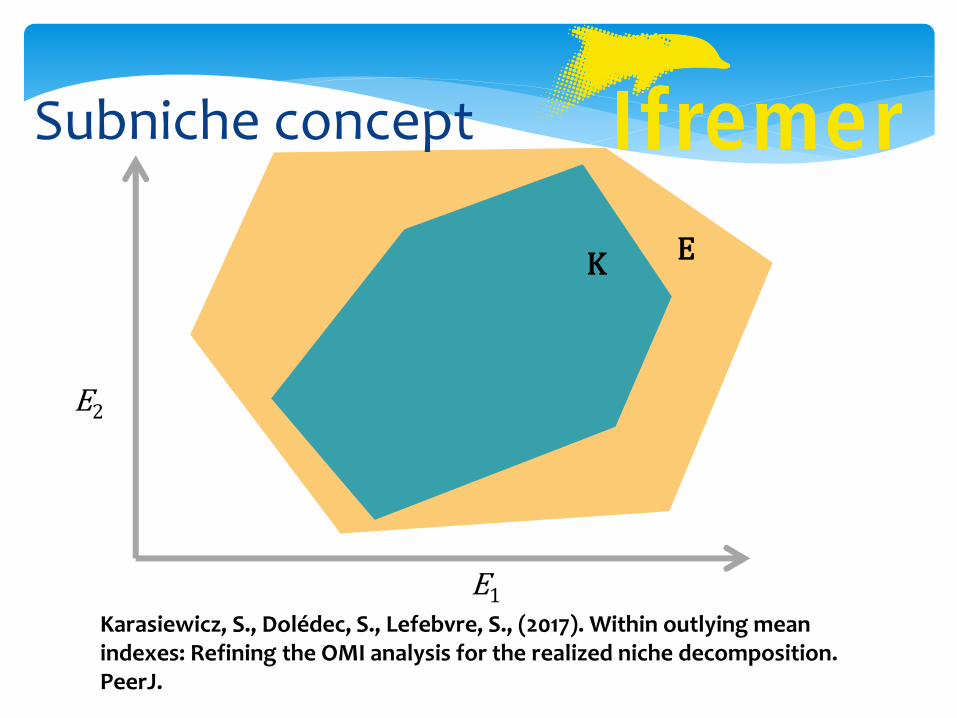
Phaeocystis spp.
+ Salinity (Borkman et al., 2016)
Appearance of Phaeocystis spp.
+N:P
- Si
+ Light
+ N:Si
References
(Riegman & Van Boekel,1996)
(Cadée and Hegeman, 1986)
(Peperzak 1993)
(Lancelot et al., 1987; Lancelot, 1990)
Phaeocystis spp.

Biomass
Winter Spring Summer Autunm Winter Spring Summer
Diatoms Phaeocystis
(Breton et al., 2006)
Phaeocystis spp.

Aim
Global warming
Eutrophication
Phaeocystis spp.
Global Change
Diatom Community
Interaction

Combination of REPHY (IFREMER) and SRN data (Lefebvre et al, 2011)
17 years (1998 to 2014)
26 diatoms species and Phaeocystis spp.
8 environmental variables
269 sampling dates
Data set

Combination of REPHY (IFREMER) and SRN data (Lefebvre et al, 2011)
17 years (1998 to 2014)
26 diatoms species and Phaeocystis spp.
8 environmental variables
269 sampling dates
Data set

Combination of REPHY (IFREMER) and SRN data (Lefebvre et al, 2011)
17 years (1998 to 2014)
26 diatoms species and Phaeocystis spp.
8 environmental variables
269 sampling dates
Data set

Calculates the overall species’ niche position and breadth of a community within an environmental space
G
OMI2
OMI1
OMI analysis (NR)
(Dolédec et al., 2000)

Calculates the sub- environmental space of HAB and non-HAB conditions
G
OMI2
OMI1
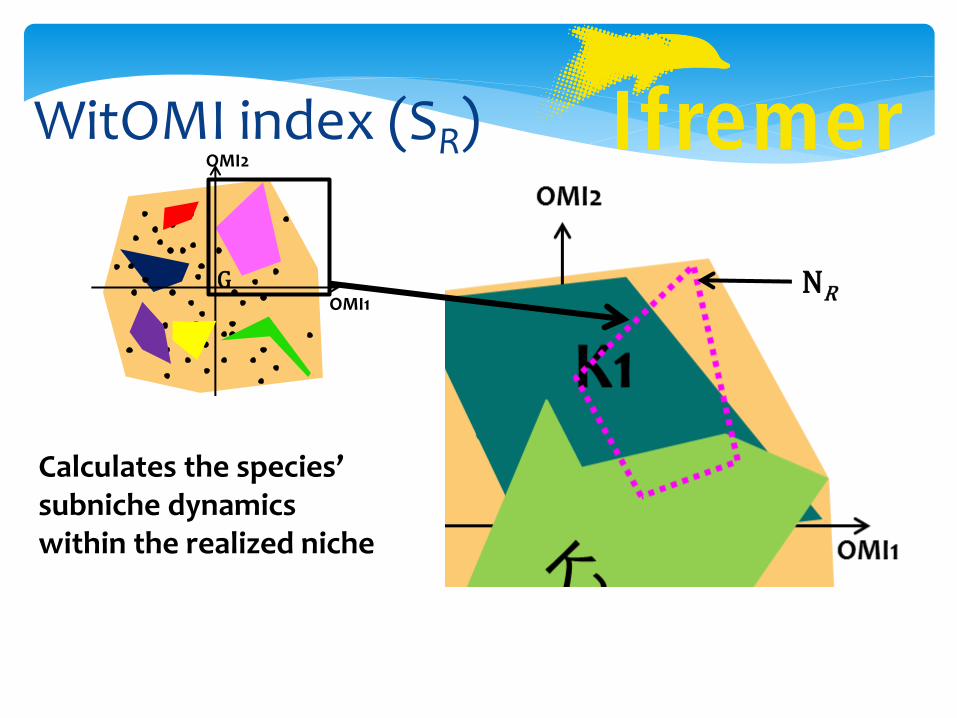
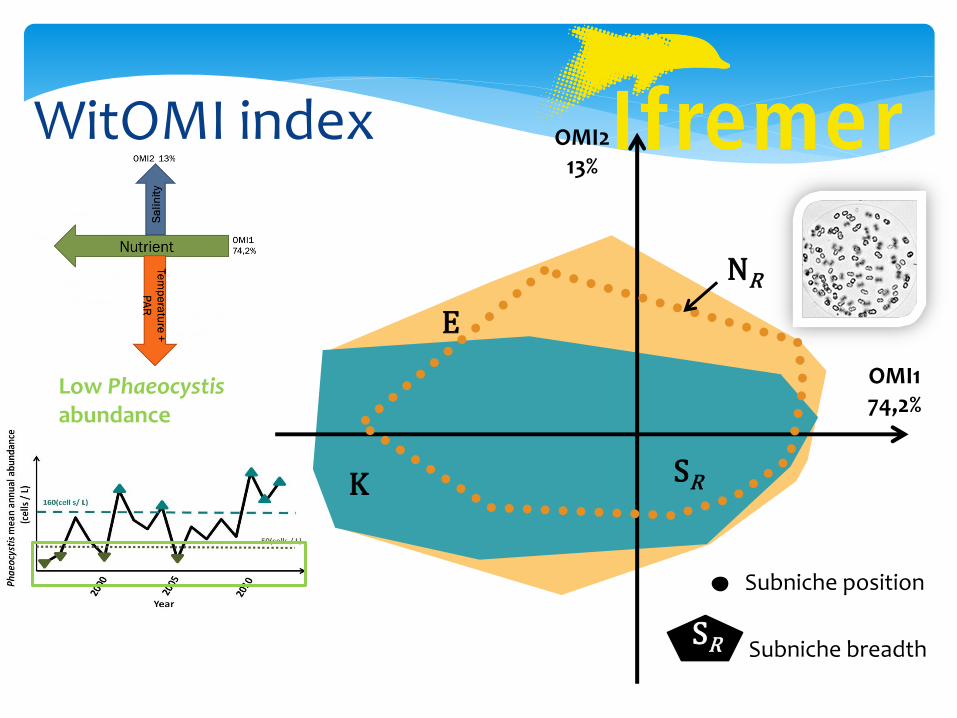
WitOMI index (SR)
(Karasiewicz et al., 2017)
G
OMI2
OMI1

G
OMI2
OMI1
WitOMI index (SR)
(Karasiewicz et al., 2017)
G
OMI2
OMI1

Calculates the sub- environmental space of HAB and non-HAB conditions
G
OMI2
OMI1
(Karasiewicz et al., 2017)
G
OMI2
OMI1
K1
WitOMI index (SR)

G
OMI2
OMI1
(Karasiewicz et al., 2017)
G
OMI2
OMI1
K1
Calculates the species’ subniche dynamics within the realized niche
NR
WitOMI index (SR)
Calculates the species’ subniche dynamics within the realized niche
G
OMI2
OMI1 NR
WitOMI index (SR)

Calculates the species’ subniche dynamics within the realized niche
G
OMI2
OMI1 NR
Sp
WitOMI index (SR)

Calculates the species’ subniche dynamics within the realized niche
G
OMI2
OMI1 NR
Sp
SR
WitOMI index (SR)

Calculates the species’ subniche dynamics within the realized niche
G
OMI2
OMI1 NR
Sp
SR SB
WitOMI index (SR)

G
OMI2
OMI1
(Karasiewicz et al., 2017)
G
OMI2
OMI1
K1
Can help determines a sub- community
WitOMI index (SR)

ρ
Bray-Curtis
Bray-Curtis
Sp
eci
es
Samples
Correlation between a
species and the sub- community
Species
Sam
ple
s
(Clarke et al., 2001)
Bv-Step analysis
Gives us the assemblage of species characterising the sub community
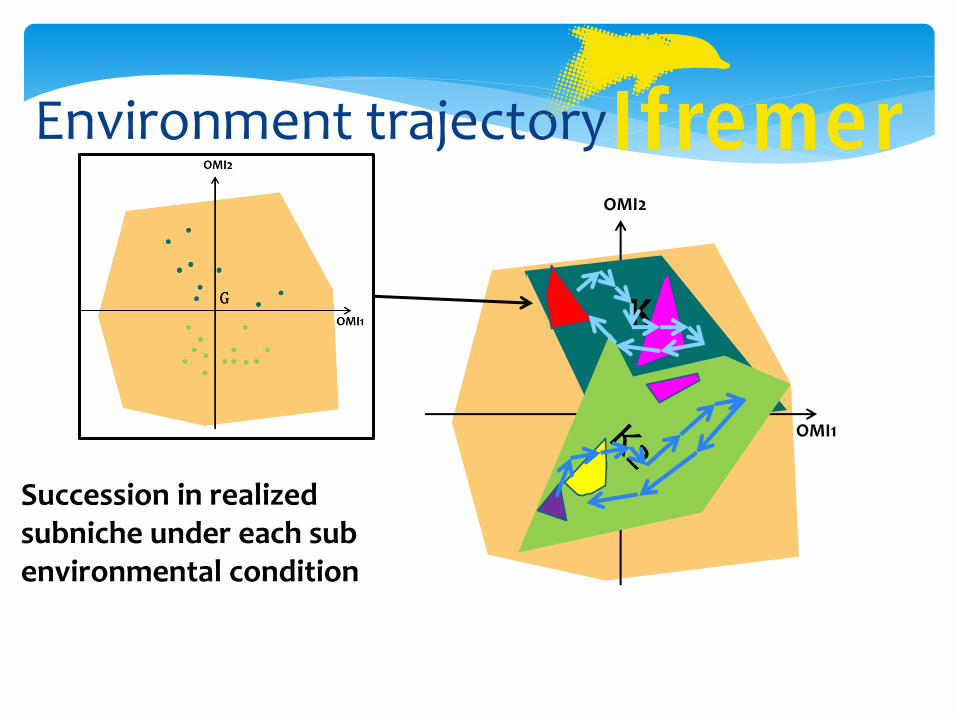
Environment trajectory
G
OMI2
OMI1
K1
Succession in realized subniche under each sub environmental condition
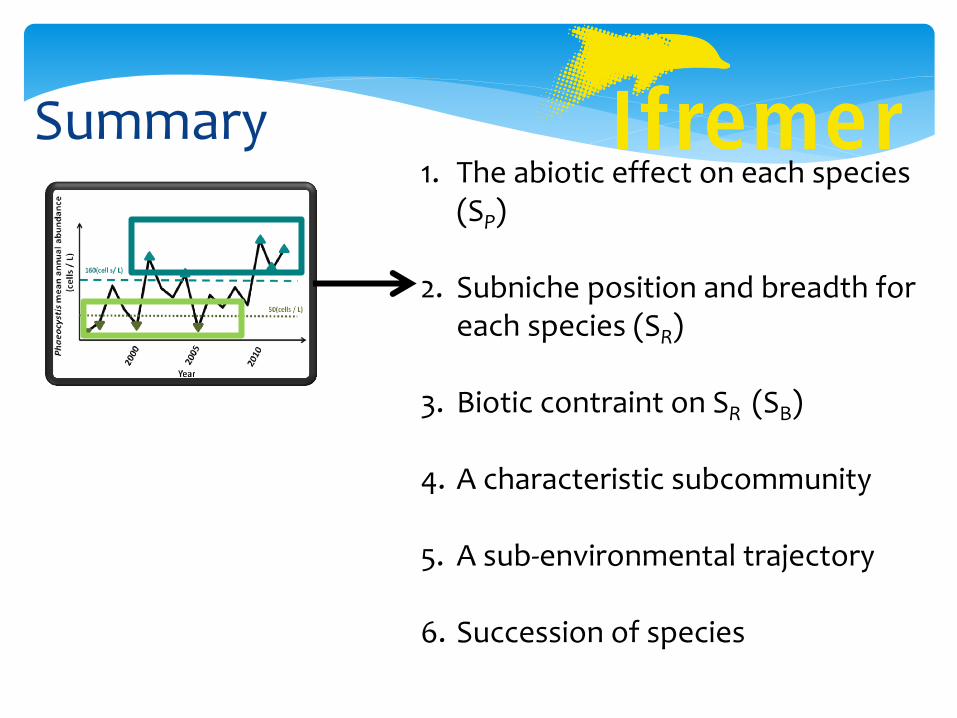
Summary 1. The abiotic effect on each species
(SP)
2. Subniche position and breadth for each species (SR)
3. Biotic contraint on SR (SB)
4. A characteristic subcommunity
5. A sub-environmental trajectory
6. Succession of species

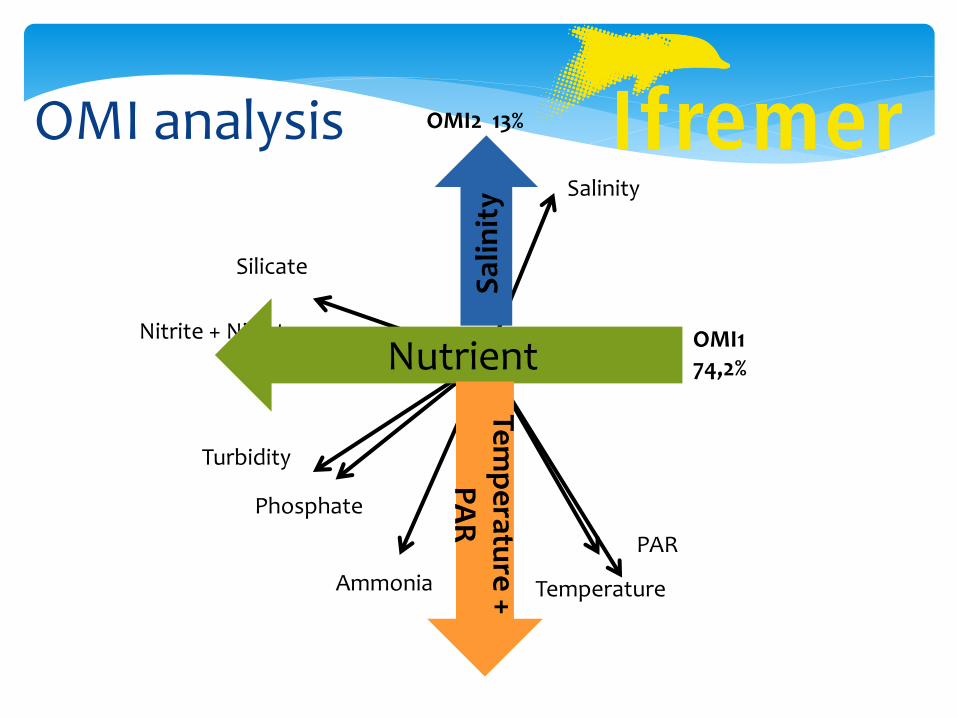
OMI2 13%
OMI1 74,2%
Salinity
PAR
Temperature
Silicate
Nitrite + Nitrate
Turbidity
Phosphate
Ammonia
OMI analysis
OMI2 13%
OMI1 74,2%
Salinity
PAR
Temperature
Silicate
Nitrite + Nitrate
Turbidity
Phosphate
Ammonia
Nutrient
Sal
init
y Te
mp
eratu
re +
P
AR
OMI analysis

OMI1 74,2%
OMI2 13%
1
2 Phae
Led
Gus
Ske Thn
Thg
Dit
Pss
OMI analysis
E
Niche position

Niche position
OMI1 74,2%
OMI2 13%
1
2 Phae
Led
Gus
Ske Thn
Thg
Dit
Pss
Leptocylindrus danicus
Thalassionema nitzschioides
OMI analysis
Skeletonema spp
Thalassiosira gravida Pseudo-nitzschia
seriata complex

OMI1 74,2%
OMI2 13%
E
NR
OMI analysis
niche position
niche breadth NR
Phae
OMI1 74,2%
OMI2 13%
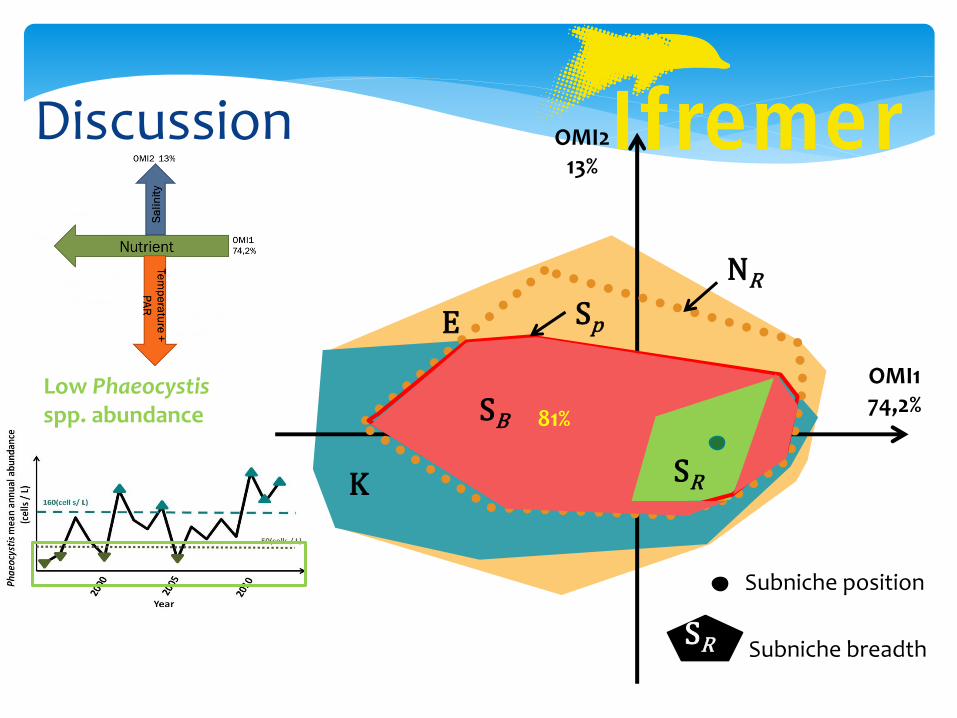
Low Phaeocystis abundance
E
NR
K SR
WitOMI index
Subniche position
Subniche breadth SR

OMI1 74,2%
OMI2 13%
Low Phaeocystis abundance
E
NR
K
Sp
WitOMI index
Subniche position
Subniche breadth SR

OMI1 74,2%
OMI2 13%
Low Phaeocystis abundance
E
NR
K SR
Sp
WitOMI index
Subniche position
Subniche breadth SR

OMI1 74,2%
OMI2 13%
E
NR
K SR
Sp
81% SB Low Phaeocystis abundance
WitOMI index
Subniche position
Subniche breadth SR

OMI1 74,2%
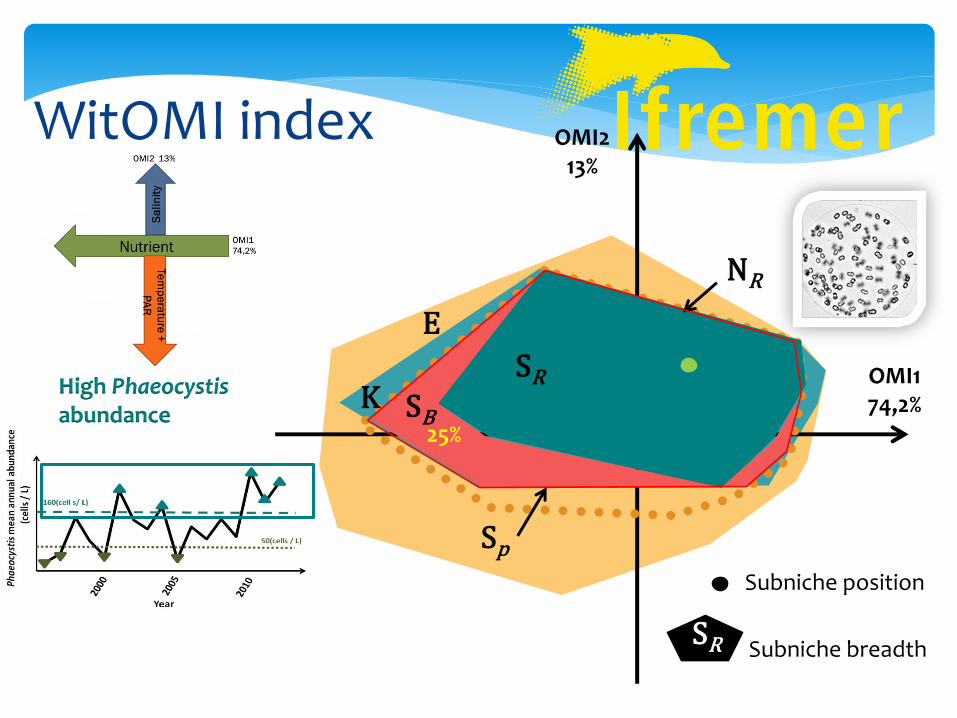
OMI2 13%
High Phaeocystis abundance
E
NR
K
Sp
SR
WitOMI index
Subniche position
Subniche breadth SR
OMI1 74,2%
OMI2 13%
High Phaeocystis abundance
25%
E
NR
K SR
Sp
SB
WitOMI index
Subniche position
Subniche breadth SR

OMI1 74,2%
OMI2 13%
NR
SR
E
SR
WitOMI index
OMI1 74,2%
Overall niche
OMI2 13%
E
NR
K
Sp
Low Phaeocystis abundance Phae
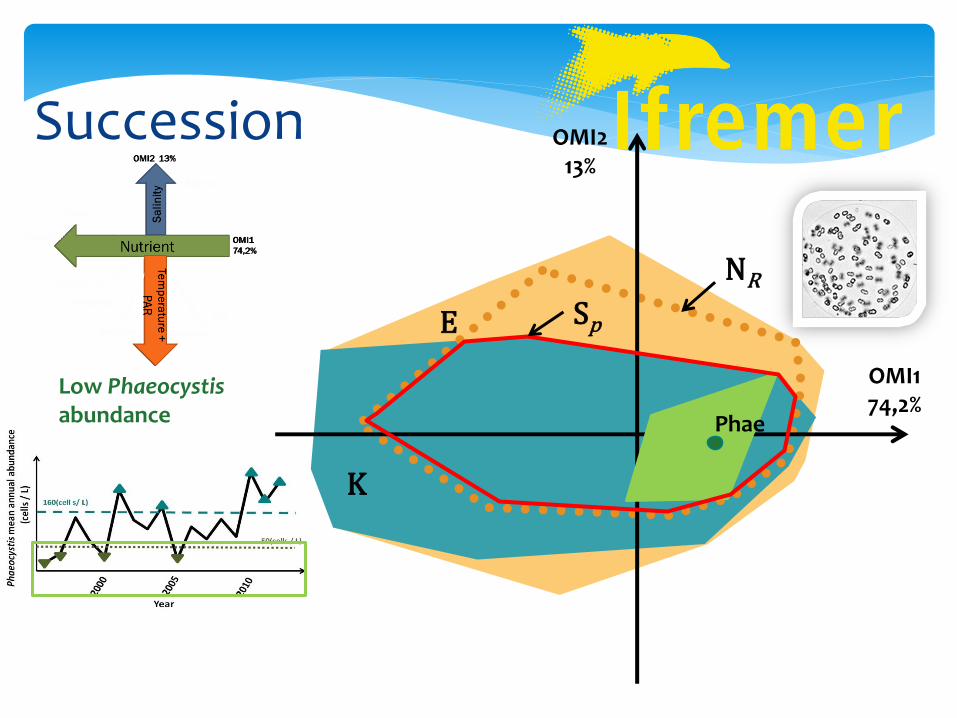
Succession

OMI1 74,2%
Overall niche
OMI2 13%
E
NR
K
Sp
Low Phaeocystis abundance Phae
Succession
J F
M
A M
J
J A
S N
D
O
OMI1 74,2%
Overall niche
OMI2 13%
E
NR
K
Sp
Low Phaeocystis abundance
Ske
Thn Thg
Pss Par
Gud Phae
Gus
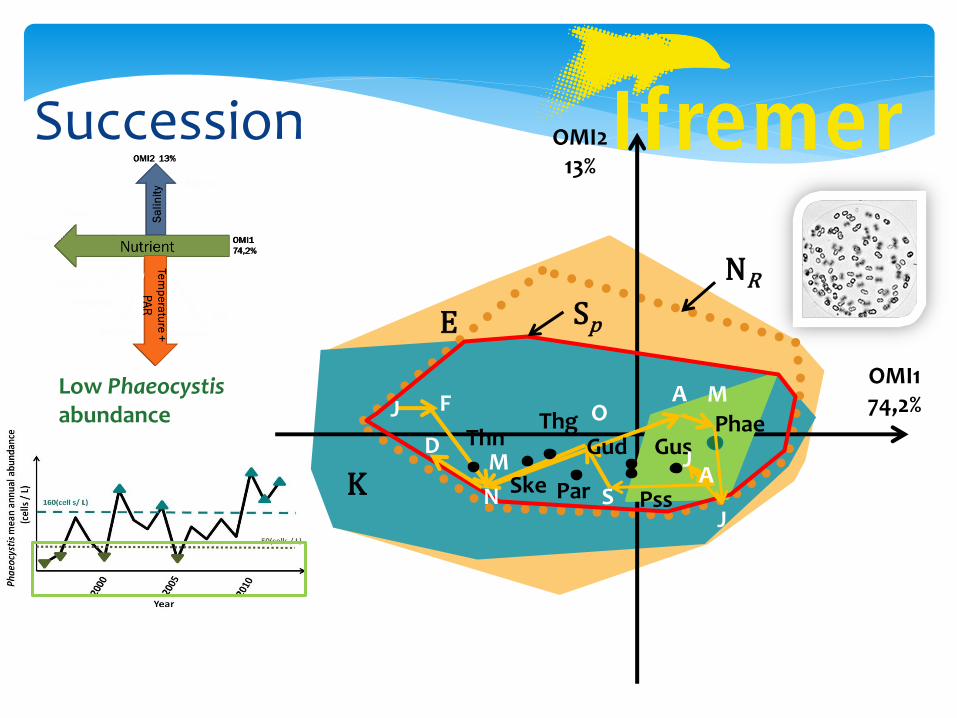
Succession
J F
M
A M
J
J A
S N
D
O

Overall niche
OMI1 74,2%
OMI2 13%
High Phaeocystis abundance
E
NR
K
Sp
J
F M A
M
J N
D J O
S
A
Ske Thn
Dit
Phae
Succession

Chaetoceros danicus Cha Ditylum brightwellii Dit Guinardia delicatula Gud Guinardia striata Gus Leptocylindrus danicus Led Nitzschia longissima Nit Paralia sulcata Par Pseudo-nitzschia seriata complex Pss Skeletonema spp. Ske Thalassionema nitzschioides Thn Thalassiosira gravida Thg Phaeocystis spp. Phae
Sub-community

Chaetoceros danicus Cha Ditylum brightwellii Dit Guinardia delicatula Gud Guinardia striata Gus Leptocylindrus danicus Led Nitzschia longissima Nit Paralia sulcata Par Pseudo-nitzschia seriata complex Pss Skeletonema spp. Ske Thalassionema nitzschioides Thn Thalassiosira gravida Thg Phaeocystis spp. Phae
Bv-Step analysis
8 species ρ = 0.97
10 species ρ = 0.96

Chaetoceros danicus Cha Ditylum brightwellii Dit Guinardia delicatula Gud Guinardia striata Gus Leptocylindrus danicus Led Nitzschia longissima Nit Paralia sulcata Par Pseudo-nitzschia seriata complex Pss Skeletonema spp. Ske Thalassionema nitzschioides Thn Thalassiosira gravida Thg Phaeocystis spp. Phae
Bv-Step analysis
6 common species
8 species ρ = 0.97
10 species ρ = 0.96

Discussion

Jan Mar Sep May Nov Jul
300
500
400
200
100
0
Me
an P
ha
eocy
stis
ab
un
dan
ce (
cell
/L)
Low Phaeocystis abundance
High Phaeocystis abundance
Discussion

Discussion
Jan Mar Sep May Nov Jul
300
500
400
200
100
0
Me
an P
ha
eocy
stis
ab
un
dan
ce (
cell
/L)
Low Phaeocystis abundance
High Phaeocystis abundance
Feb - Jun

Discussion
Jan Mar Sep May Nov Jul
300
500
400
200
100
0
Me
an P
ha
eocy
stis
ab
un
dan
ce (
cell
/L)
Low Phaeocystis abundance
High Phaeocystis abundance
Mar - Jul
Feb - Jun

Appearance of Phaeocystis
+ Salinity
+N:P
- Si
+ Light
+ N:Si
Discussion
DIN
:PO
4
DIN
:SiO
H
Jan Mar Sep May Nov Jul
SiO
H (
µm
ol/
L)
50
150
100
0
5
15
10
0
40
120
80
0 P
AR
(10
3 .W
.m²)
Turb
idit
y (N
TU
)
Jan Mar Sep May Nov Jul S
alin
ity

DIN
:PO
4
DIN
:SiO
H
Jan Mar Sep May Nov Jul
SiO
H (
µm
ol/
L)
50
150
100
0
5
15
10
0
40
120
80
0
Appearance of Phaeocystis
+ Salinity
+N:P
- Si
+ Light
+ N:Si
Discussion
PA
R (
103 .
W.m
²)
Tu
rbid
ity
(NT
U)
Jan Mar Sep May Nov Jul
Sal
init
y
High
Low

+ Salinity
Appearance of Phaeocystis
+N:P
- Si
+ Light
+ N:Si
Discussion
DIN
:SiO
H
Jan Mar Sep May Nov Jul
SiO
H (
µm
ol/
L)
50
150
100
0
5
15
10
0
40
120
80
0 Tu
rbid
ity
(NT
U)
Jan Mar Sep May Nov Jul
Sal
init
y
DIN
:PO
4
PA
R (
103 .
W.m
²)
High
Low

Appearance of Phaeocystis
+ Salinity
+N:P
- Si
+ Light
+ N:Si
Discussion
DIN
:SiO
H
Jan Mar Sep May Nov Jul
SiO
H (
µm
ol/
L)
50
150
100
0
5
15
10
0
40
120
80
0 Tu
rbid
ity
(NT
U)
Jan Mar Sep May Nov Jul
Sal
init
y
DIN
:PO
4
PA
R (
103 .
W.m
²)
High
Low

Appearance of Phaeocystis
+ Salinity
+N:P
- Si
+ Light
+ N:Si
Discussion
DIN
:SiO
H
Jan Mar Sep May Nov Jul
SiO
H (
µm
ol/
L)
50
150
100
0
5
15
10
0
40
120
80
0 Tu
rbid
ity
(NT
U)
Jan Mar Sep May Nov Jul
Sal
init
y
DIN
:PO
4
PA
R (
103 .
W.m
²)
High
Low

Appearance of Phaeocystis
+ Salinity
+N:P
- Si
+ Light
+ N:Si
Discussion
DIN
:SiO
H
Jan Mar Sep May Nov Jul
SiO
H (
µm
ol/
L)
50
150
100
0
5
15
10
0
40
120
80
0 Tu
rbid
ity
(NT
U)
Jan Mar Sep May Nov Jul
Sal
init
y
DIN
:PO
4
PA
R (
103 .
W.m
²)
High
Low

Appearance of Phaeocystis
+ Salinity
+N:P
- Si
+ Light
+ N:Si
Discussion
DIN
:SiO
H
Jan Mar Sep May Nov Jul
SiO
H (
µm
ol/
L)
50
150
100
0
5
15
10
0
40
120
80
0 Tu
rbid
ity
(NT
U)
Jan Mar Sep May Nov Jul
Sal
init
y
DIN
:PO
4
PA
R (
103 .
W.m
²)
High
Low

Appearance of Phaeocystis
+ Salinity
+N:P
- Si
+ Light
+ N:Si
Discussion
DIN
:SiO
H
Jan Mar Sep May Nov Jul
SiO
H (
µm
ol/
L)
50
150
100
0
5
15
10
0
40
120
80
0 Tu
rbid
ity
(NT
U)
Jan Mar Sep May Nov Jul
Sal
init
y
DIN
:PO
4
PA
R (
103 .
W.m
²)
High
Low

Appearance of Phaeocystis
+ Salinity
+N:P
- Si
+ Light
+ N:Si
Discussion
DIN
:SiO
H
Jan Mar Sep May Nov Jul
SiO
H (
µm
ol/
L)
50
150
100
0
5
15
10
0
40
120
80
0 Tu
rbid
ity
(NT
U)
Jan Mar Sep May Nov Jul
Sal
init
y
DIN
:PO
4
PA
R (
103 .
W.m
²)
High
Low

Discussion
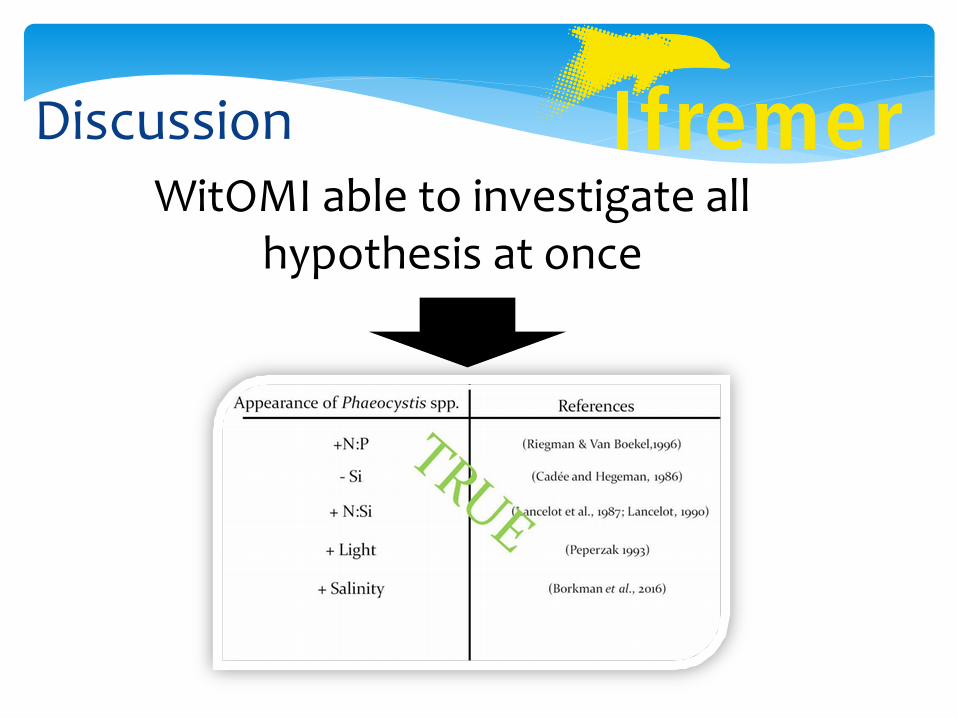
WitOMI able to investigate all hypothesis at once
Discussion
OMI1 74,2%
OMI2 13%
E
NR
K SR
Sp
81% SB Low Phaeocystis spp. abundance
Discussion
Subniche position
Subniche breadth SR

OMI1 74,2%
OMI2 13%
E
K
Sp
Phae
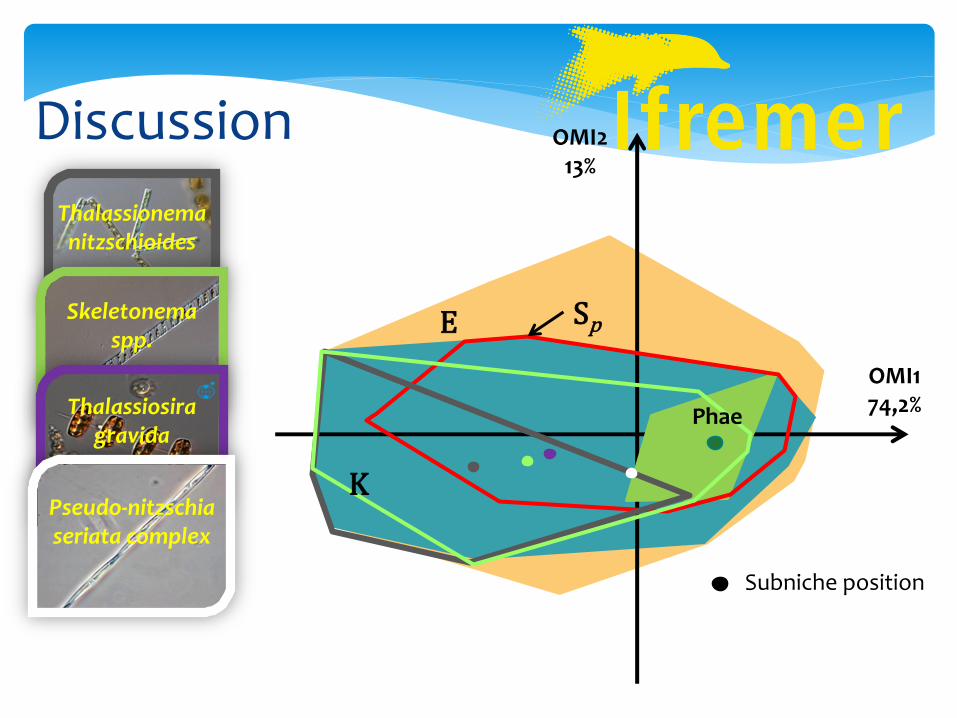
Discussion
K
Subniche position
Thalassionema nitzschioides
Skeletonema spp.
Thalassiosira gravida
Pseudo-nitzschia seriata complex

OMI1 74,2%
OMI2 13%
E Sp
Discussion
K
Phae
Thalassionema nitzschioides
Subniche position
Skeletonema spp.
Thalassiosira gravida
Pseudo-nitzschia seriata complex
OMI1 74,2%
OMI2 13%
E
K
Sp
Discussion
K
Phae
Subniche position
Thalassionema nitzschioides
Skeletonema spp.
Thalassiosira gravida
Pseudo-nitzschia seriata complex

+ Salinity (Borkman et al., 2016)
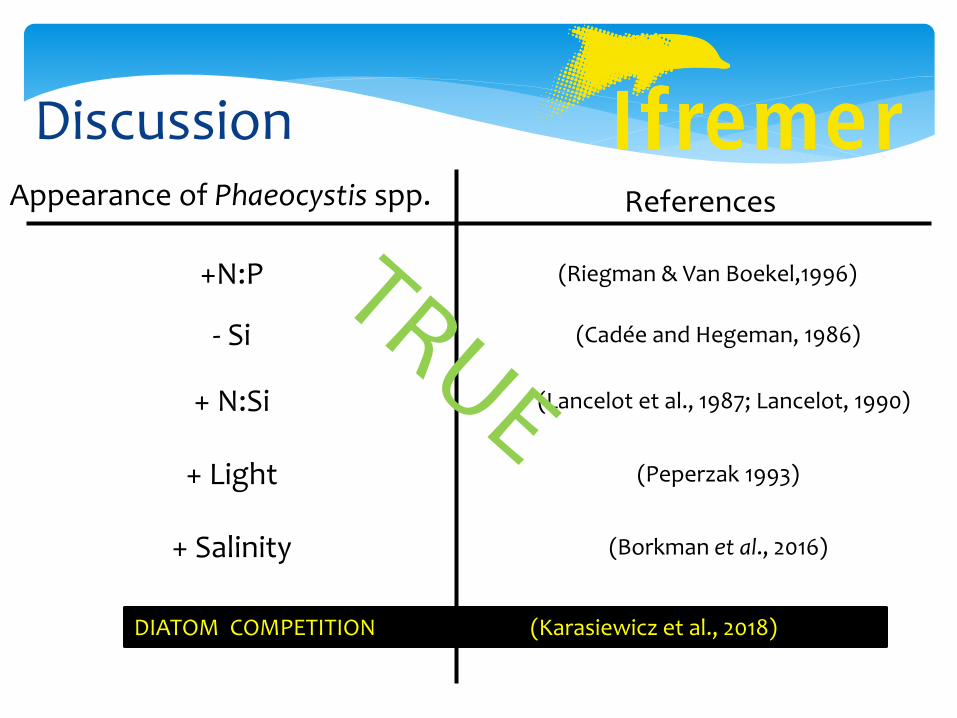
Appearance of Phaeocystis spp.
+N:P
- Si
+ Light
+ N:Si
References
(Riegman & Van Boekel,1996)
(Cadée and Hegeman, 1986)
(Peperzak 1993)
(Lancelot et al., 1987; Lancelot, 1990)
Discussion
(Lancelot et al., 1987; Lancelot, 1990)
+ Salinity (Borkman et al., 2016)
Appearance of Phaeocystis spp.
+N:P
- Si
+ Light
+ N:Si
References
(Riegman & Van Boekel,1996)
(Cadée and Hegeman, 1986)
(Peperzak 1993)
Discussion
DIATOM COMPETITION (Karasiewicz et al., 2018)
Phaeocystis spp. realized niches will mostly depend on the nutrient concentration and ratios (Winter nutrient stock)
The preceding diatoms can over compete Phaeocystis spp and contract its realized subniche under nutrient rich conditions
Conclusion


For the post-doc Only one site Temporal study
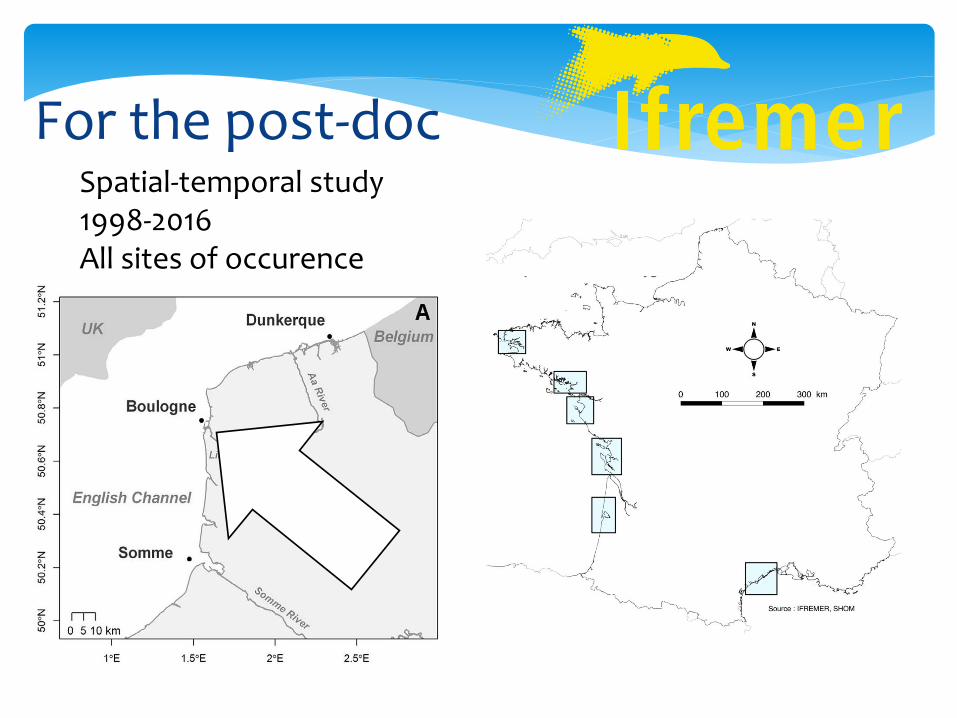
For the post-doc Spatial-temporal study 1998-2016 All sites of occurence

For the post-doc
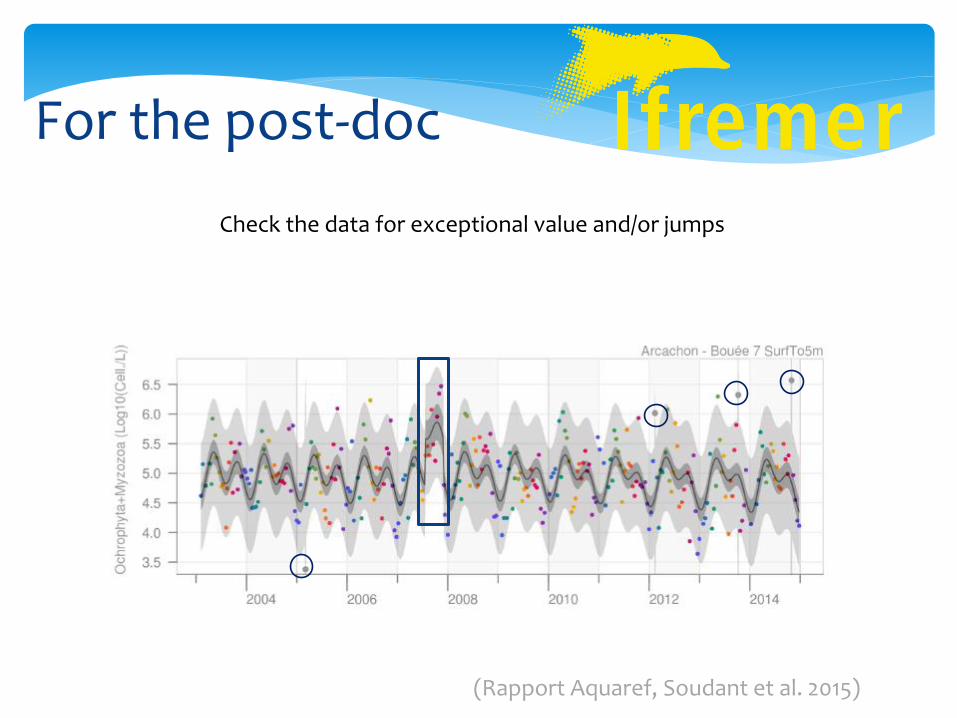
Check the data for exceptional value and/or jumps

For the post-doc
Check the data for exceptional value and/or jumps
(Rapport Aquaref, Soudant et al. 2015)
For the post-doc
Check the data for exceptional value and/or jumps
(Rapport Aquaref, Soudant et al. 2015)

For the post-doc
Check the data for exceptional value and/or jumps Use smooth data or not?
(Rapport Aquaref, Soudant et al. 2015)

For the post-doc
Local Harmful species in a regional context
Alexandrium minutum Rade de Brest
Lepidodinum chlorophorum Baie de Vilaine, Baie de Bourgneuf

For the post-doc
Hypothesis on Alexandrium minutum occurrence: • >15°C • Strong tides • …
Hypothesis on Lepidodinum chlorophorum occurrence: • Strong river outflow • Low mixing • …
Test the crurent knowledge for each species

OMI1 74,2%
OMI2 13%
E
NR
K SR
Sp
For the post-doc
Reduce spectulation on species competition by calculating overlap (Schoener ,1970)

OMI1 74,2%
OMI2 13%
E
NR
K SR
Sp
81%
SB
For the post-doc
Reduce spectulation on species competition by calculating overlap (Schoener ,1970) Only on SB

For the post-doc
Correlation of HAB with oysters recrutment, growth, reproduction…?
Use the RESCO-REMORA and Velyger data Stéphane Pouvreau
Problematic
“In summer 2012 […] a major PSP contamination event led to the prohibition of shellfish harvesting.” (Chapelle et al., 2015)
What is the impact of HAB on aquaculture?

For the post-doc
Use data created from North-Atlantic POLCOMS-ERSEM model (until 2099) Martin Huret
Butenschon et al. 2016

For the post-doc
Use data created from North-Atlantic POLCOMS-ERSEM model (until 2099) Martin Huret
To create an a posteriori environmental trajectory to visualize how future condition will proceed through the species niches
2030 2040
2050
2060
2070