The Environmental Characteristics of MTBE: Fate,...
26
In Aqua Veritas, LLC Technical Report TR-0020-MTBE The Environmental Characteristics of MTBE: Fate, Transport, Remediation & Comparison w/Ethanol July, 2003 Prepared By: Tim Douthit In Aqua Veritas, LLC 850 Mt. Pleasant Avenue Ann Arbor, Michigan 48103 [email protected]
Transcript of The Environmental Characteristics of MTBE: Fate,...
In Aqua Veritas, LLC Technical Report TR-0020-MTBE
The Environmental Characteristics of MTBE:
Fate, Transport, Remediation & Comparison w/Ethanol
July, 2003
Prepared By: Tim Douthit In Aqua Veritas, LLC 850 Mt. Pleasant Avenue Ann Arbor, Michigan 48103 [email protected]
Table of Contents
1.0 Introduction and Scope 1
2.0 The Introduction of MTBE from Gasoline into Groundwater 2
2.1 MTBE and the Composition of Gasoline 2
2.2 MTBE’s Solubility Relative to Other Gasoline Constituents 4
2.3 Dissolved-Phase Fate and Transport of MTBE 8
2.3.1 Natural Attenuation 10
2.3.2 Empirical Plume Data 16
3.0 MTBE Remediation Options 19
4.0 Ethanol vs MTBE 22
5.0 Summary 23
Exhibits
Exhibit 1 Approximate Raoult’s Law Mixture Solubility of Selected Gasoline Components 6
Exhibit 2 Dissolved Concentration of Selected Gasoline Components in contact w/Gasoline 6
Exhibit 3 Volatility of Selected Gasoline Components 7
Exhibit 4 Koc and Retardation Factors of Selected Gasoline Components 9
Exhibit 5 Henry’s Law Constant (H) of Selected Gasoline Components 11
Exhibit 6 Aqueous Anaerobic Degradation Rate of Selected Gasoline Components 13
Exhibit 7 MTBE Biodegradation Rates from Field Studies 14
1
1.0 Introduction and Scope
The following document contains information and references relevant to:
• The introduction of MTBE into subsurface soils and groundwater
• The fate and transport of dissolved-phase MTBE
• Methods and technologies applicable to the remediation of MTBE
These topics are presented with discussion comparing MTBE to other gasoline
constituents, including ethanol, and how the interchange of these constituents may affect
the environmental management of gasoline releases. This report represents an analysis
based on professional experience and research as well as review of available third-party
publications as referenced at the end of the text. However, the general field of MTBE (and
other oxygenate) research is dynamic and new information is constantly being produced.
Therefore the reader is encouraged to supplement this document with current reports,
conference documents, seminars, etc.
2
2.0 The Introduction of MTBE from Gasoline into Groundwater
2.1 MTBE and the Composition of Gasoline
MTBE has been used as an ingredient in gasoline since the late 70’s1. Originally
used as an octane enhancer during the phase-out of alkyl lead compounds, MTBE was also
used subsequently as an oxygenate to help meet automotive emissions standards.
Widespread use of MTBE in gasoline started in the early 90’s as a response to the
wintertime oxygenated gasoline program, part of the Clean Air Act Amendments of 19902.
Presently MTBE makes up approximately 11% of RFG by volume3.
Before the incorporation of MTBE in gasoline, the environmental management of
gasoline release sites relied on the analysis of other gasoline constituents in soil and
groundwater samples in order to delineate gasoline-impacted areas and assess the severity
of subsurface contamination by gasoline. Typically, several “indicator compounds” were
chosen as signals that gasoline contamination existed. The indicator compounds were
chosen either on the basis of being present in high concentrations within gasoline, or their
toxicity, or both. The higher the concentration of an indicator compound within gasoline,
the more likely would be its detection in environmental samples. The higher the toxicity
of an indicator compound within gasoline, the more important its subsurface
characterization became with respect to potential adverse effects on human health and the
environment. Additionally, indicator compounds were chosen on the basis of high
subsurface mobility compared to the remaining constituents of gasoline. Therefore, if the
subsurface extent of the gasoline indicator compounds had been completely delineated, one
1 Gibbs, L.M. 1990. Gasoline Additives – When and Why. SAE Technical Paper Series 902104 2 Gibbs, L.M. 1993. How Gasoline has Changed. SAE Technical Paper Series 932828 3 Note that due to the similarity in specific gravity (density relative to water) of both MTBE and gasoline (approximately 0.74), the volume percent and weight percent of MTBE in gasoline are approximately numerically equivalent.
3
could assume that the subsurface distribution of the remaining, less mobile gasoline
constituents would be less extensive. In general, the most popular gasoline indicator
compounds, prior to the advent of MTBE, were benzene, toluene, ethylbenzene and
xylenes, collectively referred to as BTEX. Benzene averages about 1.9 weight percent in
gasoline, while toluene, ethylbenzene and xylenes average about 8.1, 1.7 and 9.0 weight
percent in gasoline, respectively4. Thus, BTEX represents approximately 20% of the total
composition of gasoline by weight. Further, benzene is classified as a known carcinogen,
and relative to most gasoline constituents was considered to have high subsurface mobility.
Most gasoline release sites in New York, prior to the advent and/or awareness of MTBE
were, in fact, regulated on the basis of BTEX alone – if a site’s BTEX concentrations in
soil and groundwater were below regulatory limits, then it was assumed both by regulators
and the regulated community, that the remaining gasoline constituents were of no
additional environmental concern.
Now that the environmental industry has become aware of the relative abundance
of MTBE in gasoline and the unique challenges posed by MTBE (and other oxygenates) to
the management of gasoline release sites, the traditional suite of gasoline indicator
compounds (BTEX) has been joined, at a minimum, by MTBE in most soil and
groundwater analyses conducted during routine subsurface delineation and compliance
sampling events.
4 Potter, T.L. and Simmons, K.E. 1998. Composition of Petroleum Mixtures. TPH Criteria Working Group Series, Volume 2. Amherst Scientific Publishers, Amherst MA.
4
2.2 MTBE’s Solubility Relative to Other Gasoline Constituents
When gasoline is spilled, a number of different scenarios may be realized. In the
event of a small surface spill, the bulk of the spill may simply evaporate, especially if the
spill occurred on a relatively impermeable surface such as concrete. Some smaller
subsurface gasoline releases, for example an isolated underground storage tank (UST)
overfill event, may result in the gasoline being adsorbed onto soil particles and held in soil
interstices (termed free-phase “immobile” gasoline), especially in cases where groundwater
is deep and/or soils are relatively impermeable (clay and silt-rich sediments). However,
gasoline spills occasionally occur in volumes that overwhelm the soil’s adsorption and
storage capacity, resulting in the continued downward percolation of gasoline (termed free-
phase “mobile” gasoline) through the soil until the gasoline comes into contact with
groundwater. Once it comes into contact with groundwater, being less dense than water,
the gasoline essentially forms a floating layer on top of the groundwater5 and begins to
dissolve (dissolved-phase gasoline). Alternatively, if the soil through which the gasoline is
percolating is also subject to rainwater infiltration, some dissolution of gasoline may occur
prior to its reaching groundwater as infiltrating rainwater comes into contact with the
gasoline.
The dissolution of gasoline is a complex process, since gasoline is a mixture of
many components. In a mixture, the solubility of any one component of the mixture is
affected by the presence of the other components in the mixture. However, the expression
of this effect can be approximated using Raoult’s Law which states that the concentration
5 This is a simplification of the actual process wherein gasoline, water and air form a three-phase system in which the distribution of gasoline is more accurately described in terms of relative saturation within the soil’s pore system. However, for the purpose of this report, the only important factor is the contact between gasoline and groundwater which gives rise to dissolved-phase hydrocarbons based on the composition of gasoline and the chemical properties of the individual gasoline components.
5
of any one particular mixture component in the dissolved phase is proportional to the mole
fraction of that component in the mixture multiplied by its pure component solubility. This
means that while (for example), benzene’s pure-component solubility is approximately
1,800 milligrams per liter (mg/L)6, since its mole fraction in gasoline is approximately
2.4%7, the actual solubility of benzene from gasoline is only
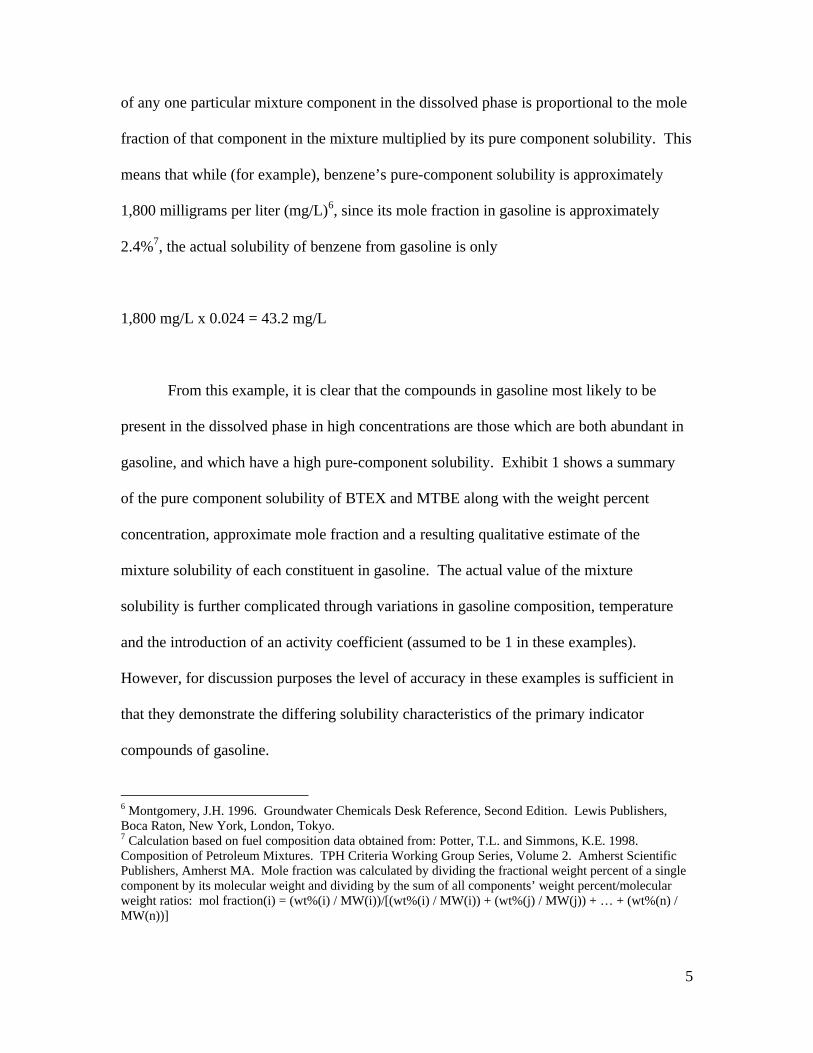
1,800 mg/L x 0.024 = 43.2 mg/L
From this example, it is clear that the compounds in gasoline most likely to be
present in the dissolved phase in high concentrations are those which are both abundant in
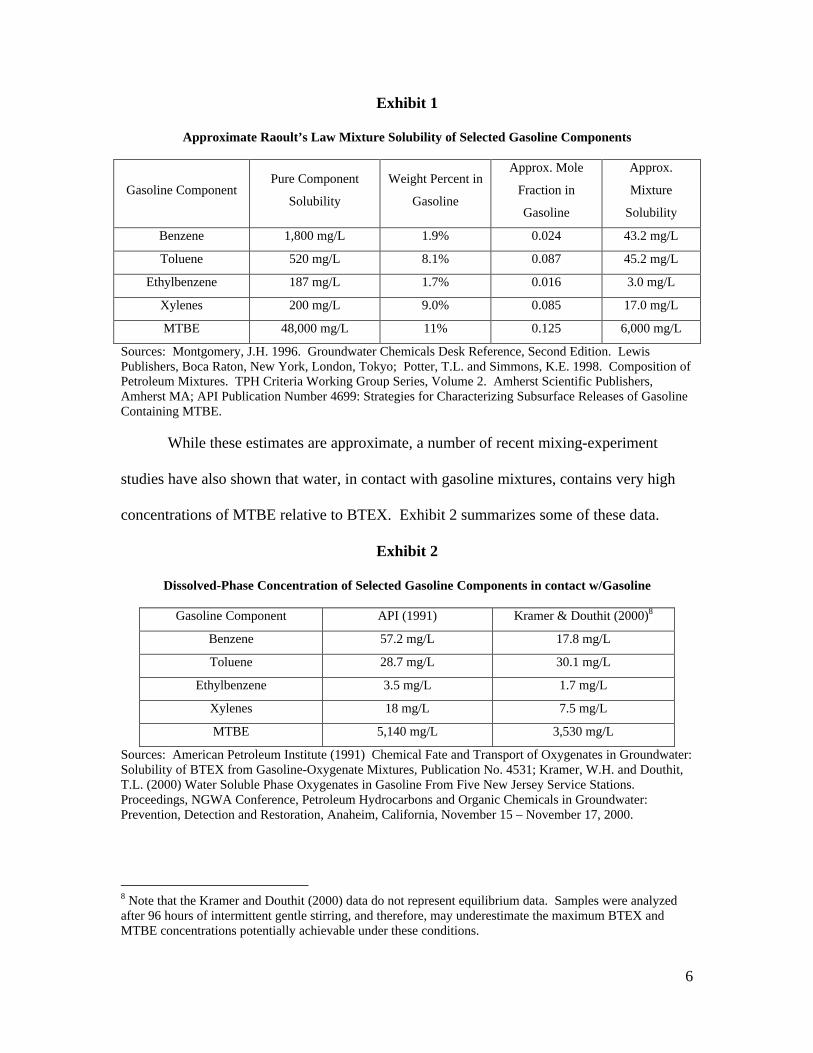
gasoline, and which have a high pure-component solubility. Exhibit 1 shows a summary
of the pure component solubility of BTEX and MTBE along with the weight percent
concentration, approximate mole fraction and a resulting qualitative estimate of the
mixture solubility of each constituent in gasoline. The actual value of the mixture
solubility is further complicated through variations in gasoline composition, temperature
and the introduction of an activity coefficient (assumed to be 1 in these examples).
However, for discussion purposes the level of accuracy in these examples is sufficient in
that they demonstrate the differing solubility characteristics of the primary indicator
compounds of gasoline.
6 Montgomery, J.H. 1996. Groundwater Chemicals Desk Reference, Second Edition. Lewis Publishers, Boca Raton, New York, London, Tokyo. 7 Calculation based on fuel composition data obtained from: Potter, T.L. and Simmons, K.E. 1998. Composition of Petroleum Mixtures. TPH Criteria Working Group Series, Volume 2. Amherst Scientific Publishers, Amherst MA. Mole fraction was calculated by dividing the fractional weight percent of a single component by its molecular weight and dividing by the sum of all components’ weight percent/molecular weight ratios: mol fraction(i) = (wt%(i) / MW(i))/[(wt%(i) / MW(i)) + (wt%(j) / MW(j)) + … + (wt%(n) / MW(n))]
6
Exhibit 1
Approximate Raoult’s Law Mixture Solubility of Selected Gasoline Components
Gasoline Component Pure Component
Solubility
Weight Percent in
Gasoline
Approx. Mole
Fraction in
Gasoline
Approx.
Mixture
Solubility
Benzene 1,800 mg/L 1.9% 0.024 43.2 mg/L
Toluene 520 mg/L 8.1% 0.087 45.2 mg/L
Ethylbenzene 187 mg/L 1.7% 0.016 3.0 mg/L
Xylenes 200 mg/L 9.0% 0.085 17.0 mg/L
MTBE 48,000 mg/L 11% 0.125 6,000 mg/L
Sources: Montgomery, J.H. 1996. Groundwater Chemicals Desk Reference, Second Edition. Lewis Publishers, Boca Raton, New York, London, Tokyo; Potter, T.L. and Simmons, K.E. 1998. Composition of Petroleum Mixtures. TPH Criteria Working Group Series, Volume 2. Amherst Scientific Publishers, Amherst MA; API Publication Number 4699: Strategies for Characterizing Subsurface Releases of Gasoline Containing MTBE.
While these estimates are approximate, a number of recent mixing-experiment
studies have also shown that water, in contact with gasoline mixtures, contains very high
concentrations of MTBE relative to BTEX. Exhibit 2 summarizes some of these data.
Exhibit 2
Dissolved-Phase Concentration of Selected Gasoline Components in contact w/Gasoline
Gasoline Component API (1991) Kramer & Douthit (2000)8
Benzene 57.2 mg/L 17.8 mg/L
Toluene 28.7 mg/L 30.1 mg/L
Ethylbenzene 3.5 mg/L 1.7 mg/L
Xylenes 18 mg/L 7.5 mg/L
MTBE 5,140 mg/L 3,530 mg/L
Sources: American Petroleum Institute (1991) Chemical Fate and Transport of Oxygenates in Groundwater: Solubility of BTEX from Gasoline-Oxygenate Mixtures, Publication No. 4531; Kramer, W.H. and Douthit, T.L. (2000) Water Soluble Phase Oxygenates in Gasoline From Five New Jersey Service Stations. Proceedings, NGWA Conference, Petroleum Hydrocarbons and Organic Chemicals in Groundwater: Prevention, Detection and Restoration, Anaheim, California, November 15 – November 17, 2000.
8 Note that the Kramer and Douthit (2000) data do not represent equilibrium data. Samples were analyzed after 96 hours of intermittent gentle stirring, and therefore, may underestimate the maximum BTEX and MTBE concentrations potentially achievable under these conditions.
7
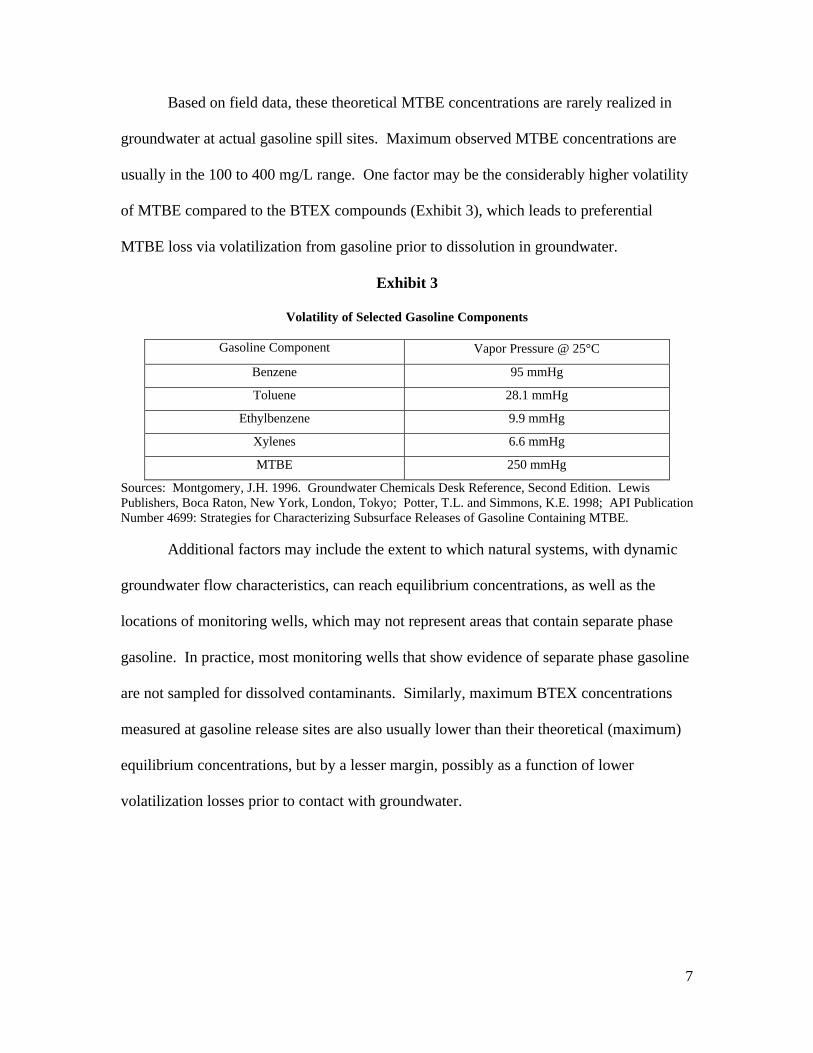
Based on field data, these theoretical MTBE concentrations are rarely realized in
groundwater at actual gasoline spill sites. Maximum observed MTBE concentrations are
usually in the 100 to 400 mg/L range. One factor may be the considerably higher volatility
of MTBE compared to the BTEX compounds (Exhibit 3), which leads to preferential
MTBE loss via volatilization from gasoline prior to dissolution in groundwater.
Exhibit 3
Volatility of Selected Gasoline Components
Gasoline Component Vapor Pressure @ 25°C
Benzene 95 mmHg
Toluene 28.1 mmHg
Ethylbenzene 9.9 mmHg
Xylenes 6.6 mmHg
MTBE 250 mmHg
Sources: Montgomery, J.H. 1996. Groundwater Chemicals Desk Reference, Second Edition. Lewis Publishers, Boca Raton, New York, London, Tokyo; Potter, T.L. and Simmons, K.E. 1998; API Publication Number 4699: Strategies for Characterizing Subsurface Releases of Gasoline Containing MTBE.
Additional factors may include the extent to which natural systems, with dynamic
groundwater flow characteristics, can reach equilibrium concentrations, as well as the
locations of monitoring wells, which may not represent areas that contain separate phase
gasoline. In practice, most monitoring wells that show evidence of separate phase gasoline
are not sampled for dissolved contaminants. Similarly, maximum BTEX concentrations
measured at gasoline release sites are also usually lower than their theoretical (maximum)
equilibrium concentrations, but by a lesser margin, possibly as a function of lower
volatilization losses prior to contact with groundwater.
8
2.3 Dissolved-Phase Fate and Transport of MTBE
Once any gasoline component dissolves into groundwater, its fate is a function of a
number of competing processes. Groundwater, which is not static but moves according to
local and regional flow patterns at various velocities, tends to transport these dissolved
components along its flow path, termed the “downgradient” direction9. Essentially, the
maximum rate of transport any gasoline component can achieve is that of the groundwater
in which it is dissolved. However, competing against groundwater is the tendency for
gasoline components to adsorb to various degrees onto soil particles along the flow path.
This tendency increases with increased soil organic carbon content, and also depends on
the specific sorption characteristics of the individual components. The tendency for a
gasoline component to adsorb to soils is estimated via the organic carbon partition
coefficient Koc. Koc represents the mass of a component in the dissolved phase relative to
the mass adsorbed onto carbon, and is one factor used in calculating the rate of transport of
a dissolved component through a porous medium (with a known or estimated organic
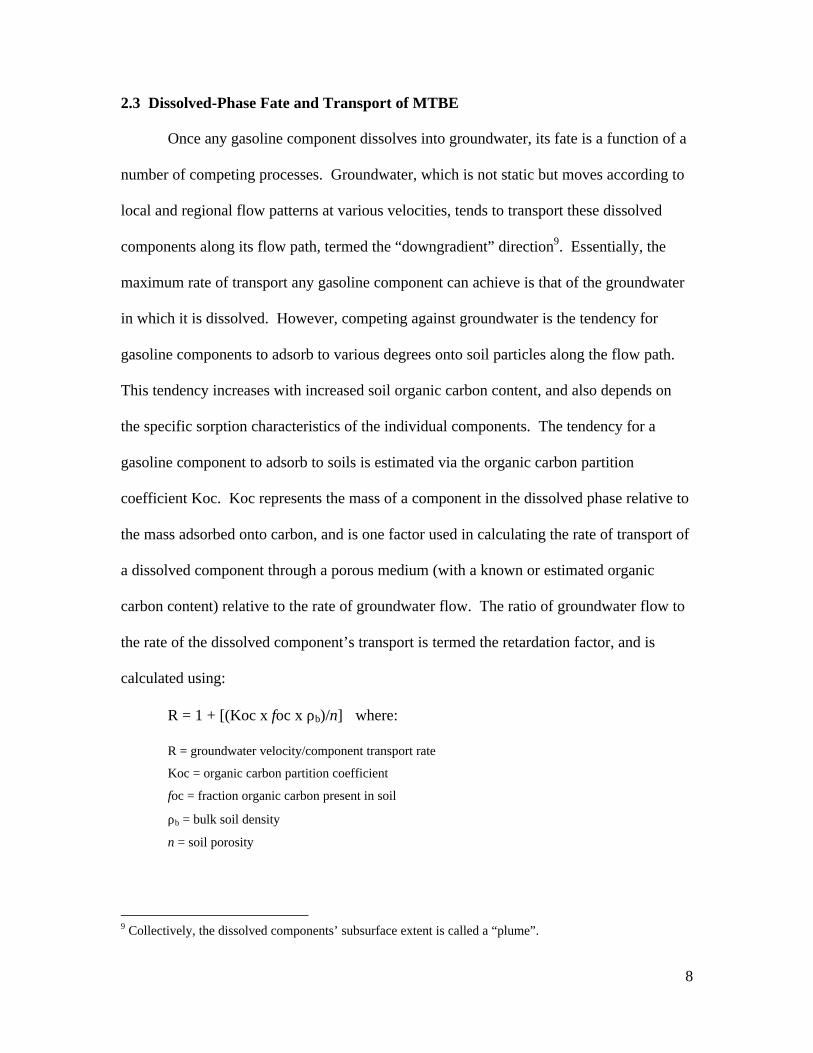
carbon content) relative to the rate of groundwater flow. The ratio of groundwater flow to
the rate of the dissolved component’s transport is termed the retardation factor, and is
calculated using:
R = 1 + [(Koc x foc x ρb)/n] where:
R = groundwater velocity/component transport rate
Koc = organic carbon partition coefficient
foc = fraction organic carbon present in soil
ρb = bulk soil density
n = soil porosity
9 Collectively, the dissolved components’ subsurface extent is called a “plume”.
9
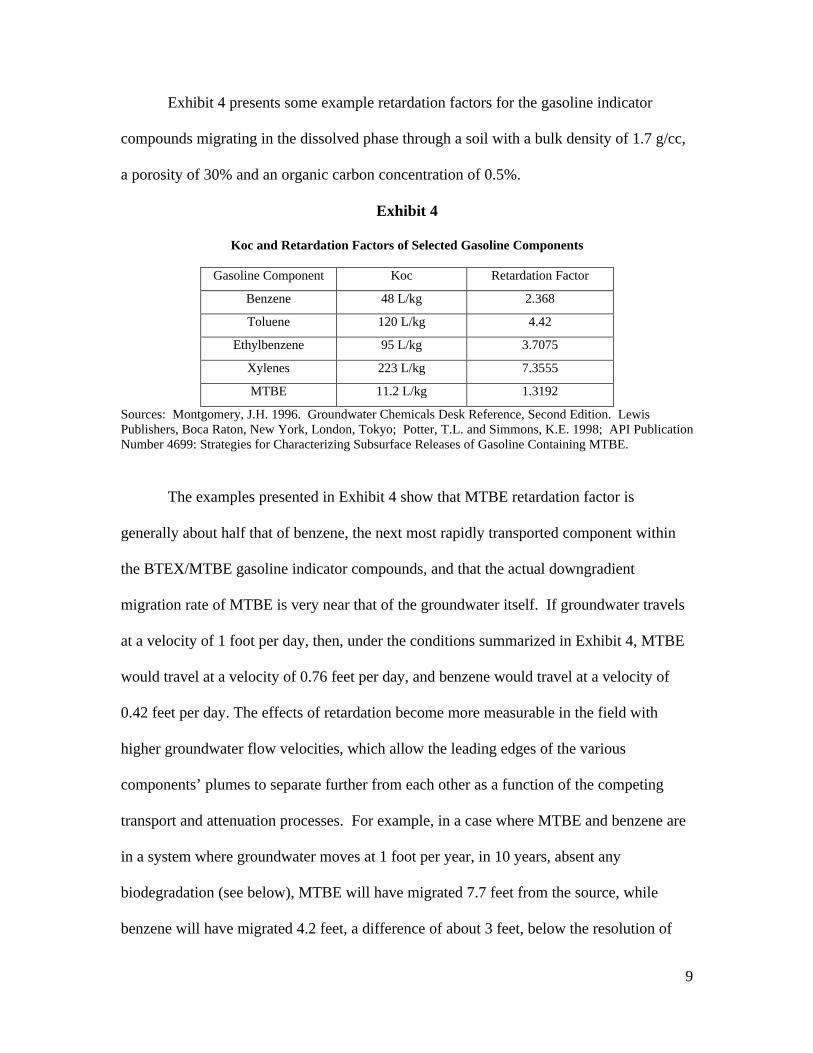
Exhibit 4 presents some example retardation factors for the gasoline indicator
compounds migrating in the dissolved phase through a soil with a bulk density of 1.7 g/cc,
a porosity of 30% and an organic carbon concentration of 0.5%.
Exhibit 4
Koc and Retardation Factors of Selected Gasoline Components
Gasoline Component Koc Retardation Factor
Benzene 48 L/kg 2.368
Toluene 120 L/kg 4.42 Ethylbenzene 95 L/kg 3.7075
Xylenes 223 L/kg 7.3555 MTBE 11.2 L/kg 1.3192
Sources: Montgomery, J.H. 1996. Groundwater Chemicals Desk Reference, Second Edition. Lewis Publishers, Boca Raton, New York, London, Tokyo; Potter, T.L. and Simmons, K.E. 1998; API Publication Number 4699: Strategies for Characterizing Subsurface Releases of Gasoline Containing MTBE.
The examples presented in Exhibit 4 show that MTBE retardation factor is
generally about half that of benzene, the next most rapidly transported component within
the BTEX/MTBE gasoline indicator compounds, and that the actual downgradient
migration rate of MTBE is very near that of the groundwater itself. If groundwater travels
at a velocity of 1 foot per day, then, under the conditions summarized in Exhibit 4, MTBE
would travel at a velocity of 0.76 feet per day, and benzene would travel at a velocity of
0.42 feet per day. The effects of retardation become more measurable in the field with
higher groundwater flow velocities, which allow the leading edges of the various
components’ plumes to separate further from each other as a function of the competing
transport and attenuation processes. For example, in a case where MTBE and benzene are
in a system where groundwater moves at 1 foot per year, in 10 years, absent any
biodegradation (see below), MTBE will have migrated 7.7 feet from the source, while
benzene will have migrated 4.2 feet, a difference of about 3 feet, below the resolution of
10
most monitoring well networks. In a system where groundwater moves 10 feet per year,
the MTBE will have traveled 77 feet, and benzene 42 feet, a difference of 35 feet, which
probably would be discernable at most sites.
2.3.1 Natural Attenuation
The ASTM Standard Guide for Remediation of Groundwater by Natural
Attenuation at Petroleum Release Sites (E 1943 – 98) describes the processes of natural
attenuation in the following manner:
“At petroleum release sites petroleum migrates outward from a source area through the environment creating a plume of petroleum constituents. The configuration of a solute plume is controlled by the source mass-loading rate relative to the removal rate of natural attenuation processes. Typically, the plume will expand until it reaches steady-state where the rate of petroleum constituents contributed from the source is balanced with the rate of natural attenuation. The natural [attenuation] processes are physical, chemical and biological in nature such as dispersion, dilution, volatilization, sorption and biodegradation. Biodegradation is the process which accounts for the majority of mass removal and associated concentration reduction for constituents of concern. Biodegradation actually reduces the mass of constituents through microbial metabolization of constituents of concern.”
All dissolved gasoline components undergo natural attenuation on their
downgradient flow path. Dispersion acts on all dissolved components, and serves to
reduce their concentration by “spreading” the plume in three dimensions along the flow
path. Dilution, for example by infiltration of rain water along the plume’s flow path will
similarly reduce the concentration of all dissolved components of a plume. Volatilization
of gasoline components from groundwater varies based on the individual component’s
Henry’s Law Constant (H), according to:
11
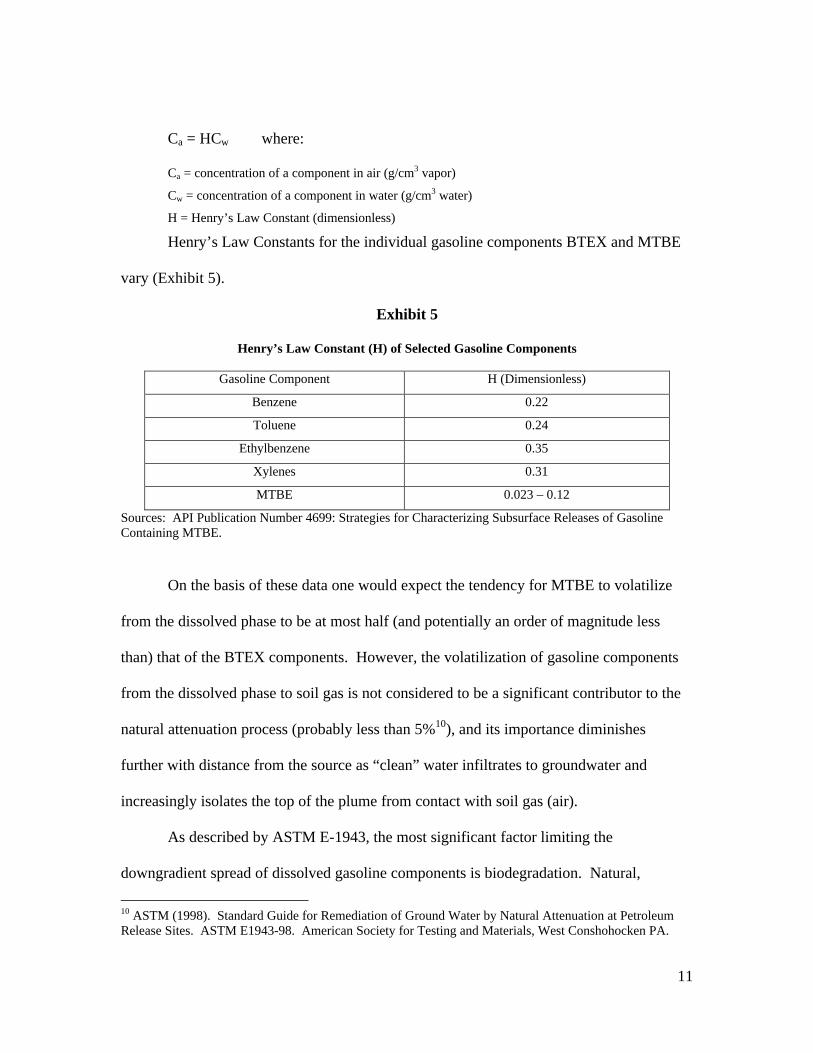
Ca = HCw where:
Ca = concentration of a component in air (g/cm3 vapor)
Cw = concentration of a component in water (g/cm3 water)
H = Henry’s Law Constant (dimensionless)
Henry’s Law Constants for the individual gasoline components BTEX and MTBE
vary (Exhibit 5).
Exhibit 5
Henry’s Law Constant (H) of Selected Gasoline Components
Gasoline Component H (Dimensionless)
Benzene 0.22
Toluene 0.24
Ethylbenzene 0.35
Xylenes 0.31
MTBE 0.023 – 0.12
Sources: API Publication Number 4699: Strategies for Characterizing Subsurface Releases of Gasoline Containing MTBE.
On the basis of these data one would expect the tendency for MTBE to volatilize
from the dissolved phase to be at most half (and potentially an order of magnitude less
than) that of the BTEX components. However, the volatilization of gasoline components
from the dissolved phase to soil gas is not considered to be a significant contributor to the
natural attenuation process (probably less than 5%10), and its importance diminishes
further with distance from the source as “clean” water infiltrates to groundwater and
increasingly isolates the top of the plume from contact with soil gas (air).
As described by ASTM E-1943, the most significant factor limiting the
downgradient spread of dissolved gasoline components is biodegradation. Natural,
10 ASTM (1998). Standard Guide for Remediation of Ground Water by Natural Attenuation at Petroleum Release Sites. ASTM E1943-98. American Society for Testing and Materials, West Conshohocken PA.
12
indigenous bacterial populations utilize dissolved gasoline components as a food source,
ultimately producing end-products including carbon dioxide and water. This process
reduces the mass of the contaminants, not just the concentration of contaminants, as is the
case with dispersion, dilution and volatilization. The rates at which the components of
gasoline are biodegraded depend on the component itself as well as the subsurface
conditions under which the degradation is occurring. Biodegradation in the presence of
dissolved oxygen is termed aerobic degradation, whereas biodegradation in the absence of
dissolved oxygen is termed anaerobic degradation. In simple terms, the process of
biodegradation is a microbially mediated oxidation of gasoline components wherein the
microbes strip electrons from the gasoline components and then pass the excess electrons
on to a “terminal electron acceptor” (which is thereby reduced). If dissolved oxygen acts
as the terminal electron acceptor (TEA), the process is aerobic. The absence of oxygen
forces the microbial population to utilize alternative TEAs, including nitrate (NO3-), ferric
iron (Fe3+), sulfate (SO42-) and under sufficiently reducing (methanogenic) conditions,
carbon. Generally, aerobic degradation rates exceed anaerobic degradation rates for
gasoline components. However, the dissolved oxygen content of most groundwaters is
rapidly depleted in the initial stages of a gasoline release as the aerobic microbial
population starts to metabolize the dissolved gasoline components. Absent significant
recharge of dissolved oxygen to the release area, anaerobic microbes begin to dominate the
biodegradation process. Consequently, while the rates of aerobic biodegradation are
higher, anaerobic processes are usually responsible for the bulk of the biodegradation
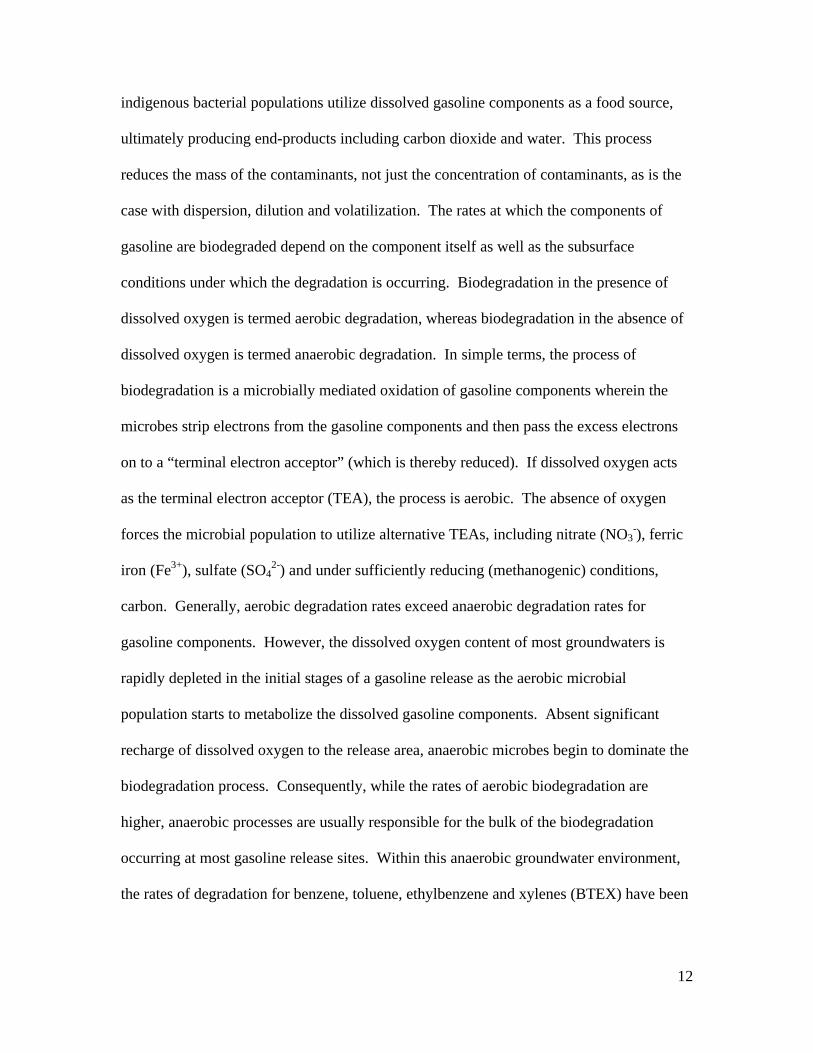
occurring at most gasoline release sites. Within this anaerobic groundwater environment,
the rates of degradation for benzene, toluene, ethylbenzene and xylenes (BTEX) have been
13
the subject of a significant body of research. While site-specific variations in BTEX
biodegradation rates exist on the basis of microbial population, geology, availability of
TEAs, etc., there is consensus in the literature that toluene, ethylbenzene and xylenes are
readily biodegraded. Less certainty is ascribed to the biodegradation rate of benzene under
anaerobic conditions, as reflected by the range of rates for benzene in the commonly used
summary presented in Exhibit 6:
Exhibit 6
Aqueous Anaerobic Degradation Rate of Selected Gasoline Components
Gasoline Component Half-Life11
Benzene 112 days – 720 days
Toluene 56 days – 210 days
Ethylbenzene 176 days – 228 days
Xylenes 180 days – 360 days
Source: Howard, P.H., Boethling, R.S., Jarvis, W.F., Meylan, W.M., Michalenko, E.M (1991) Handbook of Environmental Degradation Rates. Lewis Publishers, Inc. Chelsea, Michigan.
Notably absent from Exhibit 6 is a range of biodegradation rates for MTBE.
Research into the biodegradation of MTBE is a currently evolving process. As recently as
1998, ASTM E-1943 included the following statement which effectively echoed the
environmental industry’s opinion on MTBE biodegradation:
“… if constituents are present which do not readily attenuate, such as methyl-t-butyl ether (MTBE), remediation by natural attenuation may not be a suitable remedial alternative, or may need to be supplemented with other remedial technologies.”
Since then, a number of studies have attempted to demonstrate and quantify the
biodegradation of MTBE in groundwater, with varying degrees of success. Exhibit 7
11 The half-life of a given component is the time needed for half the component’s original concentration to be degraded. For example, assuming a the upper end of the range listed in Exhibit 6 for benzene, an initial concentration of 200 mg/L would degrade to 100 mg/L in 720 days, or about two years.

14
presents MTBE degradation rates under a variety of site conditions as presented in the
excellent literature survey given in Kolhatkar et al. (2000)12.
Exhibit 7
MTBE Biodegradation Rates from Field Studies
Aquifer Conditions 1st Order Attenuation
Rate (1/yr) Half-Life (days)
Aerobic and Nitrate Reducing 0 – 0.37 Infinite – 684
Sulfate Reducing 0 – 0.3 Infinite – 843 Methanogenic 0.3 – 10.9 843 – 23
Various laboratory studies on the degradation of MTBE also exist (also
summarized in Kolhatkar et al. 2000), many showing degradation rates that exceed those
summarized in Exhibit 7 above (particularly under aerobic conditions). However, the
extent to which these controlled-condition laboratory studies are applicable to dynamic and
complex field conditions is unclear, and therefore for this discussion, only field data are
considered relevant.
Notable among the field study results is that effective anaerobic biodegradation of
MTBE appears limited to methanogenic aquifer conditions, and even then only
sporadically. Kolhatkar et al (2000) could demonstrate biodegradation of MTBE at 6 of 48
sites studied where methanogenic conditions were documented. With few exceptions,
sulfate reducing conditions appear unfavorable to MTBE biodegradation (even in
laboratory studies), and a recent well-documented field study at Port Hueneme, CA
12 Kolhatkar, R., Wilson, J. and Dunlap, L.E. (2000) Evaluating Natural Biodegradation of MTBE at Multiple UST Sites. Proceedings, 2000 Petroleum Hydrocarbons and Organic Chemicals in Groundwater: Prevention, Detection and Remediation. Anaheim, California
15
indicated no biodegradation of MTBE under nitrate reducing, high sulfate conditions
(Amerson and Johnson, 2003)13.
Collectively, the field data indicate that with the exception of some sites with
specific methanogenic conditions, the biodegradation half-life of MTBE under anaerobic
conditions can be expected to range between infinite (no degradation) and the highest half-
life (lowest biodegradation rates) associated with benzene (around two years).
The extent to which the downgradient migration of gasoline components is limited
by biodegradation depends on the rate at which each component is biodegraded and the
rate at which the component is migrating (retardation factor). A readily biodegraded
component traveling slowly will achieve limited downgradient extent compared to a
biologically resistant component traveling quickly. It is the combination of its low
retardation factor (rapid migration) and low biodegradation rates (subsurface persistence)
that allows MTBE to form far more extensive plume lengths than are generally achieved
by the BTEX components which are more readily biodegraded and have higher retardation
factors. Furthermore, in the case of MTBE, despite the statement quoted from ASTM E
1743-98 above14, steady-state may not always be achievable due to its high relative
solubility. MTBE may leach out of the source area completely before natural attenuation
mechanisms (limited primarily to dissolution and dispersion) contain the downgradient
migration of the leading edge of the MTBE plume. This phenomenon can give rise to
“detached” MTBE plumes that separate from the source area and continue to migrate
13 Amerson, I. and Johnson, R.L. 2003 Natural Gradient Tracer Test to Evaluate Natural Attenuation of MTBE Under Anaerobic Conditions. Groundwater Monitoring and Remediation, Vol 23, No. 1 14 “Typically, the plume will expand until it reaches steady-state where the rate of petroleum constituents contributed from the source is balanced with the rate of natural attenuation.”
16
downgradient as an extended slug until dispersion and dilution define the limits of the
slug’s migration.
2.3.2 Empirical Plume Data
In recent years, several statistical surveys have been made of multiple hydrocarbon
plumes to determine, among other things, the relative plume geometries of MTBE and
BTEX components, most notably the “Texas Plume Study” (Mace and Choi 199815) and
the “California Plume Study” (Happel et al. 199816). These studies, however, do not
immediately support the observations described above in Section 3.3.1. In the Texas
study, the average MTBE plume length was only 27 feet longer than the average benzene
plume length. In the California study, 81% of the MTBE plumes were equal or shorter in
length than their corresponding benzene plume. However, the California study used
different criteria to determine the plume areas of MTBE (20 micrograms per liter [µg/L])
and benzene (1 µg/L), and the study’s results may have been influenced by separate release
histories for the MTBE and BTEX. As stated in Happel et al. (1998):
“Given both the anticipated high mobility and high recalcitrance of MTBE in the subsurface, these results appear to contradict expected behavior. However, it is important to realize that, for the majority of LUFT sites, release histories for MTBE and benzene most likely differed significantly; recent releases of gasoline containing significant quantities of MTBE may have occurred at sites with a long history of contamination with less or non-oxygenated fuels. Whereas several previous studies show that the vast majority of benzene plumes are apparently stable, the present limited analysis of timeseries data suggests that MTBE may behave differently resulting in a gradual spatial dissociation of MTBE and BTEX plumes over time. Thus, plume lengths measured at a single point in
15 Mace, R.E., and Choi, W. 1998. The Size and Behavior of MTBE plumes in Texas. Proceedings, Petroluem Hydrocarbons and Organic Chemicals in Ground Water. Prevention, Detection, and Remediation. Houston, Texas. 16 Happel, A.M., Beckenbach, E.H, and Halden, R.U. 1998. An Evaluation of MTBE Impacts to California Groundwater Resources. Lawrence Livermore National Laboratory, University of California. UCRL-AR-130897
17
time, e.g., 1995/96, cannot be indicative of future MTBE plume behavior and its relationship to that of benzene.”
Further, Happel et al. (1998) state:
“The primary attenuation mechanism for MTBE is dispersion. Observed
attenuation of BTEX and MTBE compounds at downgradient monitor wells suggests that MTBE is not significantly degrading in existing monitoring networks. Thus, MTBE may be regarded as recalcitrant under site-specific conditions. MTBE concentrations leaving these networks were greater than those of BTEX compounds at a significant portion of LUFT sites. Assuming resistance of MTBE to biodegradation, these plumes will eventually attenuate to regulatory concentration goals due to dispersion, although in contrast to BTEX compounds, the mass would not be depleted and significantly longer distances and time frames would be required.”
In the Texas study, the authors (Mace and Choi 1998) indicate that the data may
also have been affected by separate release histories. They state:
“The average difference between MTBE and benzene plume length may increase with time as MTBE plumes caused by more recent fuel releases grow and approach or exceed the length of a previously established benzene plume.”
Furthermore, the data may also have been affected by the relatively low
permeability of the study sites. 60% of the sites had measured or estimated intrinsic
permeabilities less than 10-10 cm2, corresponding to silts or clays17, and the median
hydraulic conductivity of all sites was reported to be 1.1 m/yr (0.01 ft/day), which would
give rise to slow groundwater flow rates. As pointed out above, it may be difficult to
discern significant transport differences at low groundwater flow velocity sites. However,
the study found that the average benzene plume length was 155 feet, which was exceeded
by the corresponding average MTBE plume length by 27 feet, or roughly 17%, which may
not be insignificant under these low-permeability conditions.
17 intrinsic permeability (k) corresponds to the more common hydraulic conductivity (K) via the relationship K = kρg/µ where ρ = fluid density (62.3 lb/ft3), g = gravity (32.2 ft/sec2) and µ = fluid viscosity (7.6E-4 lb/ft sec). An intrinsic permeability of 10-10 cm2 (1.08E-12 ft2) is equivalent to a hydraulic conductivity of 2.85E-6 ft/sec = 0.25 ft/day.

18
In 2000, the New England Interstate Water Pollution Control Commission
(NEIWPCC) conducted a survey of all 50 states to determine how MTBE contamination
was affecting state leaking underground storage tank (LUST) programs. Respondents to
the survey indicated that MTBE plume lengths “often” exceeded BTEX plumes in 15
states and 11 states indicated that they were “sometimes” longer. 16 states reported
maximum MTBE plume lengths in the 1,000 to 5,000 foot range. Kansas’ longest MTBE
plume was in excess of one mile and approximately 3,400 feet ahead of the associated
BTEX plume, and New York’s East Patchogue MTBE plume extends over 7,000 feet, and
while the BTEX plume has receded significantly due to source-area remediation efforts,
the MTBE plume has historically been approximately 3,000 – 5,000 feet ahead of the
associated BTEX plume. Similarly, an MTBE plume described in Thuma et al. (2001)18
from Suffolk County, New York is approximately 8,000 feet long, and exceeds the
associated BTEX component by about 7,000 feet.
Additional literature evidence for MTBE plume extents exceeding those of BTEX
plumes can be extracted from a survey of MTBE in ground and surface waters conducted
in the northeast by the Northeast States for Coordinated Air Use Management
(NESCAUM, 1999)19. Thus study summarizes a large body of existing data, which
collectively show a high frequency of MTBE detections without any associated BTEX
detections. Roughly, the survey indicates that of those groundwater samples which
showed either MTBE or BTEX, about 80% were MTBE-only, with the remaining being
MTBE and BTEX or BTEX-only detections. However, while the report outlines
18 Thuma, J., Hihshalwood, G., Kremesec, V. and Kolhatkar, R. 2001. Application of Ground Water Fate and Transport Models to Evaluate Contaminant Mass Flux and Remedial Options for a MTBE Plume on Long Island, NY. Proceedings, Petroluem Hydrocarbons and Organic Chemicals in Ground Water, Prevention, Detection and Remediation. Houston, Texas. 19 NESCAUM 1999. MTBE in Ground and Surface Waters of the NESCAUM Region.
19
individual case studies showing MTBE advancing ahead of BTEX in the subsurface, in
many instances, the concentration of MTBE-only detections were low, and may be
attributable to non-point sources (e.g. storm water runoff, etc.).
3.0 MTBE Remediation Options
The remediation of gasoline releases, which include MTBE, can be approached
using many of the conventional remediation technologies also applicable to the BTEX
gasoline components. For subsurface releases that have not reached groundwater, soil
vapor extraction (SVE) is more effective in removing MTBE from soil than it is for BTEX
components of gasoline due to the higher pure-component volatility of MTBE. Similar to
dissolution into groundwater, MTBE will preferentially enter the vapor phase from
gasoline compared to BTEX. However, once removed from soil, the removal of MTBE
from the gasoline vapor-laden air stream, if necessary, would be more difficult than the
removal of BTEX. Typically, the air stream is routed through carbon air filters (“vapor-
phase carbon”) that remove the gasoline components by adsorption. As discussed above,
MTBE has a lower tendency to adsorb onto carbon (lower Koc) than BTEX components,
and consequently either more carbon is necessary, or the carbon filters need to be changed
more frequently in order to prevent the discharge of vapor-phase MTBE to the atmosphere
than would be required for a BTEX-only SVE remediation effort. Currently, however,
atmospheric discharges of gasoline components are only infrequently, if ever, regulated on
the basis of MTBE. More typically, air discharges are regulated on the basis of benzene
concentrations due to the carcinogenic nature of this component.
20
Once the gasoline release reaches groundwater and remediation is required for
dissolved-phase gasoline, the removal of MTBE becomes more difficult than the removal
of BTEX. While MTBE volatilizes from gasoline more readily than does BTEX due to its
higher pure-component volatility, it volatilizes from water less readily than does BTEX
due to its low Henry’s Law constant. Therefore, attempting to strip MTBE from
groundwater, in-situ, via volatilization using air sparging (AS) is more difficult than for
BTEX. A secondary benefit (if not, in fact, the primary benefit) of AS is that it also
aerates the groundwater and promotes the aerobic biodegradation of dissolved gasoline
components. While this strategy is effective for BTEX components, which have relatively
high aerobic biodegradation rates and which also tend to reach predictable steady-state
(stable) plume configurations (allowing them to be targeted by fixed-location remediation
systems), it appears to be less effective for the more slowly biodegraded and highly mobile
MTBE, especially at sites with high groundwater velocity. Some success in MTBE
removal has been reported at sites using oxygen-infusion technologies, which increase the
dissolved oxygen concentrations significantly over traditional AS, however, whether an
effective balance can be achieved between oxygen delivery, aerobic biodegradation rate
and downgradient transport remains unclear.
Simple plume containment via groundwater extraction is an effective means of
removing MTBE from the subsurface and limiting its downgradient transport.
Additionally, as discussed above, since MTBE has a greater tendency to be present in the
dissolved phase whereas significant proportions of BTEX are also present in adsorbed
phases, groundwater extraction may be more effective in removing a higher percentage of
MTBE from the subsurface than would be the case for BTEX. However, similar to the
21
problems with SVE, once the dissolved MTBE is removed from the subsurface, its ex-situ
removal from water is more difficult than for BTEX. Typically, the removal of gasoline
components from water that has been pumped from the subsurface is achieved via air
strippers or carbon filtration (“liquid phase carbon”), or both. Again, due to the low
Henry’s Law constant, MTBE is less readily stripped from water than BTEX, and requires
higher air/water ratios (bigger air blowers, more air strippers, etc.). Also, due to the low
Koc, filtration through carbon requires more carbon units or more frequent carbon unit
change-outs to prevent the unwanted discharge of MTBE from the effluent of the treatment
system.
The primary factor affecting the environmental management of gasoline releases
that include MTBE, absent the somewhat higher degree of difficulty in remediating MTBE
relative to BTEX, is the higher probability of needing to remediate the dissolved-phase
MTBE plume in the first place. Regulatory requirements notwithstanding, a gasoline
component which achieves a high downgradient extent is more likely to impact a sensitive
receptor (e.g. a drinking water well) than a component which only achieves a limited
downgradient extent. While the principles of Risk Based Corrective Action, which
essentially dictate that the extent to which an environmental contaminant needs to be
remediated is proportional to the potential for its adverse impact to human health and the
environment, are equally applicable to MTBE and BTEX, the likelihood of the adverse
impact increases with increasing contaminant distribution. Furthermore, where
remediation is either necessary or a regulatory requirement, the application of cost-
effective, minimally intrusive biodegradation-driven natural attenuation strategies, either as
stand-alone approaches, or in conjunction with engineered remediation technologies, are
22
more readily accepted by regulators for BTEX than for MTBE given the complications
associated with MTBE persistence, fate and transport. Finally, regardless of the
remediation strategy selected, the delineation and monitoring effort associated with the
highly mobile, poorly biodegraded MTBE will be greater than for BTEX alone.
4.0 Ethanol vs MTBE
In the event that the oxygenate MTBE is removed from gasoline, in order to
maintain oxygen-content requirements, a likely replacement appears to be ethanol.
Ethanol shares many of the chemical characteristics of MTBE, including high solubility
(completely miscible with water), low Henry’s Law constant (0.00021 to 0.00026 [API
2000]20), high volatility (49 – 56.5 mm HG [API 2000]) and low Koc (1.58 – 16.2 [API
2000]. These factors suggest that an ethanol-containing gasoline release in contact with
groundwater would give rise to high concentrations of dissolved ethanol, which would then
migrate downgradient at near-groundwater velocities. Furthermore, ethanol has a lower
Henry’s Law constant and a lower Koc than MTBE, indicating that its removal from water
via stripping (either in- or ex-situ) or carbon filtration would be more difficult than for
MTBE. However, while the engineered remediation of ethanol, for those sites where
remediation is required, may be more difficult than for MTBE, the requirement for
engineered remediation of ethanol will probably be less urgent than that for MTBE due to
its higher biodegradation rates. For example, recent laboratory microcosm studies
conducted on aquifer material collected from gasoline release sites, described in Alavarez
20 API Publication Number 4699: Strategies for Characterizing Subsurface Releases of Gasoline Containing MTBE.
23
et al. (2001)21, returned ethanol half-lives between 0.35 and 35 days (MTBE was not
degraded at all in the same series of experiments). However, well-documented field data
on the biodegradation of ethanol are limited, and at least one field study indicated a half-
life on the order of 600 days (Corsuil et al. 2000)22.
Overall, the expectation is that ethanol will degrade at rates that generally exceed
those of BTEX, indicating that ethanol plume lengths will not approach those currently
described for MTBE. However, a side effect of the high biodegradation potential of
ethanol may be the preferential removal of terminal electron acceptors, thereby limiting the
biodegradation of the other gasoline components, including BTEX. Some speculation
exists regarding the increase of downgradient BTEX migration as a function of ethanol-
depressed biodegradation kinetics (e.g. Alvarez et al. 2001), however additional research is
needed to fully address this issue.
5.0 Summary
MTBE is unique among the components of gasoline due to its high solubility, low
Henry’s Law constant, low organic carbon distribution coefficient (Koc) and poor
biodegradation characteristics. The high solubility, low Koc and recalcitrant
biodegradation give rise to a relative enrichment of MTBE in the dissolved phase when
gasoline comes into contact with groundwater, as well as relatively extensive dissolved-
phase plume lengths, compared to other gasoline constituents. The more extensive the
21 Alvarez, P.J.J., Ruiz-Aguilar, G.M.L, Fernandez-Sanchez, J.M., Kim, D., Beller, H.R., and Kane, S.R. 2001in UCRL-AR-145380 Chapter 3: Effect of Enthanol and MTBE on BTEX Biodegradation in the Saturated Zone: Kinetic Studies. 22 Corsuil, H.X., Fernandez, M., do Rosario, M and Scabra, P.S. (2000). Results of a Natural Attenuation Field Experiment for an Ethanol-Blended Gasoline Spill. Proceedings, Petroleum Hydrocarbons and Organic Chemicals in Groundwater: Prevention, Detection and Remediation. Anaheim, California.
24
plume length, the more likely a given plume will adversely affect sensitive receptors, for
example public and private drinking water supplies. The low Henry’s Law constant and
low Koc make both the in- and ex-situ removal (remediation) of MTBE from groundwater
more difficult than is the case for other gasoline constituents.
The removal of MTBE from gasoline would considerably simplify the management
of gasoline releases by limiting their dissolved-phase extent and mobility, thereby more
easily allowing the application of cost-effective, minimally intrusive RBCA and MNA
strategies in remedial solutions as opposed to reliance on engineered containment systems.
However, due to oxygen content requirements effective for reformulated gasoline (RFG),
the removal of MTBE from gasoline would require its replacement with another
oxygenate. Currently, the most probable replacement appears to be ethanol. The
replacement of MTBE with ethanol, however, has less clear-cut consequences in the
management of gasoline releases than the simple removal of MTBE from gasoline.
Ethanol shares many of the chemical characteristics of MTBE (high solubility, low
Henry’s Law constant, low Koc) pertinent to dissolved-phase fate and transport and
remediation. However, ethanol is expected to be more readily biodegradable than MTBE
in subsurface environments, and consequently may not yield dissolved-phase plume
extents comparable to what is documented for MTBE.