The Enviable Dilemma: Concentrated Stock: Hold, Sell, or Hedge?
40
The Enviable Dilemma Concentrated Stock: Hold, Sell, or Hedge? BERNSTEIN WEALTH MANAGEMENT RESEARCH Investors holding concentrated stock positions must grapple with a number of complex questions. A comprehensive analysis of the key issues: • The tax cost of selling versus the benefit of diversification • How much to divest • Immediate versus staged selling • Alternatives to sale, including hedging with options
Transcript of The Enviable Dilemma: Concentrated Stock: Hold, Sell, or Hedge?

The Enviable DilemmaConcentrated Stock: Hold, Sell, or Hedge?
B E R N S T E I N W E A L T H M A N A G E M E N T R E S E A R C H
Investors holding concentrated stock positions must grapple with a number of complex questions. A comprehensive analysis of the key issues:
• The tax cost of selling versus the benefit of diversification
• How much to divest
• Immediate versus staged selling
• Alternatives to sale, including hedging with options

Bernstein does not offer tax or legal advice. Investors should consult their tax and legal advisors.
This research paper is one in a series produced by Bernstein’s Wealth Management Group on issues of particular significance to sophisticated and affluent investors and their professional advisors.

Bernstein Wealth Management Research 1
TABLE OF CONTENTS
Significant Research Conclusions . . . . . . . . . . . . . . . . . . . . . . . . . 1
THE DILEMMA: Hold-or-Sell Crosscurrents . . . . . . . . . . . . . . . . . . . . . 2
1. The Risk/Reward Imbalance of a Single Stock . . . . . . . . . . . . . . . . . . 3 Why concentrated stock positions tend to disappoint much more often than reward
The Mathematics of Volatility . . . . . . . . . . . . . . . . . . . . . . . . . 4
Psychological Barriers to Diversification . . . . . . . . . . . . . . . . . . . . . 7
2. Determining How Much to Sell . . . . . . . . . . . . . . . . . . . . . . . . . 8 Case Study: Partners sell a business, leaving one with 50% of his net worth in a single
stock, the other with 80%. For each of them, how much is too much?
3. The Benefits—and Drawbacks—of Staged Selling . . . . . . . . . . . . . . . 13 Selling over time can be alluring, but brings unintended consequences
4. Hedging Single-Stock Risk . . . . . . . . . . . . . . . . . . . . . . . . . . . 15 Techniques for holding your stock, deferring your taxes, and limiting your risk—
at least for a while
5. Charitable Remainder Trusts and Exchange Funds . . . . . . . . . . . . . . . 18 Can either of these alternatives to straight sale benefit long-term investors?
APPENDIX More on Hedging and on Trading Restrictions . . . . . . . . . . . . . . . . . . . 23


Bernstein Wealth Management Research 1
Significant Research Conclusions
It’s not unusual for investors, fiduciaries, and trustees to find themselves with too much of a good thing: owning or overseeing a large quantity of a highly appreciated stock. However that position was created, a single stock that constitutes a large portion of an investor’s net worth creates a dilemma: Should he hold, begin to diversify, or hedge?
Using an analytical model, Bernstein has integrated research on the risk/return characteristics of a single stock, the broader capital markets, and various diversification techniques in addition to outright sale. Some of our key conclusions are below.
• A single stock presents investors with an inferior risk/reward profile:
■ The higher volatility of an individual stock diminishes its expected long-term growth. Over the last 20 years, stocks with average volatility have lagged S&P-level returns by nearly three percentage points per year. For the most volatile quartile of stocks, the drag on performance has been close to seven points.
■ There is a pronounced skew to single-stock returns. While the additional return potential for holding the right stock is substantial, significant underperformance has been four times as likely.
• Reducing concentrated positions can help most investors achieve their long-term goals. A minimum divestment amount, tailored to the investor’s circumstances, should be considered to ensure meeting spending needs. An optimal sale amount can be quantified, based on the investor’s time horizon and risk tolerance, the tax cost of selling, the volatility of the single stock, and the level of portfolio concentration.
• Divesting in stages rather than all at once can be appealing for some investors, allowing them to retain upside potential in the stock. For corporate insiders, staged selling—via a 10b5-1 plan—can often be the best method of achieving diversification. However, timed strategies lengthen the holder’s exposure to risk, making them less desirable than up-front divestment for most other investors.
• Hedging via prepaid variable forwards or collars can offer protection, tax deferral, and a vehicle for diversification; the strategy is typically most effective for investors with short time horizons. Potential tax and cash-flow complications, as well as costs, build over time, reducing the appeal of hedging for a broader base of investors.
• Among other techniques, charitable remainder trusts stand out for their diversification benefits, and can be useful even for those with only moderate philanthropic intent. They can be customized to maximize either the investor’s wealth or legacy to charity.
Daniel J. Loewy Research Director, Wealth Management
Robert A. Weiss Director, Wealth Management Group
Key contributors: Patrick S. Boyle, Jonathan A. Reiss, and Richard L.N. Weaver

The Enviable Dilemma—Concentrated Stock: Hold, Sell, or Hedge?2
THE DILEMMA: Hold-or-Sell CrosscurrentsNumerous individuals and families have accumulated great wealth by holding large amounts of a single highly appreciated stock. The investor may have acquired the stock through the sale of a business, superior investment performance, an inheritance, or some other route. Regardless, this one stock may have become the prime determinant of his future wealth. And in many cases, the investor has become emotionally attached to the stock, especially if its performance has made him rich.
At the same time, a concentrated holding creates a dilemma for the investor and his legal and tax advisors. The stock may continue to shine, and diversification via sale entails a cost—a usually daunting tax bill. Most investors are aware, however, that tying much of their future security to the fluctuations of one stock is not a prudent strategy.
Although this dilemma is not unique to the 21st century, today’s environment makes the issue of concentration ripe for discussion. While stock volatility has risen dramatically, capital-gains tax rates have been reduced by half (Display 1)—strengthening the case for diversification sooner rather than later.1
It’s Not Just About TaxesBut the hold-or-sell decision goes far beyond resolving a binary issue: accepting the risk or paying the taxes. How much of a concentrated position—if any—should an investor divest, and what should he do with the remainder? How fast should he sell? Decisions like these can have a profound impact on whether or not long-term goals are met. Further, many alternatives, both new and traditional, to simply holding or selling are available that can help diversify and delay taxes along the way. They include hedging with derivatives and variants to straight sale.
Difficult Trade-Offs The array of decisions to be made precludes any singular answer. A 75-year-old with substantial assets outside his single stock must approach the dilemma differently from an investor 30 years younger whose solitary stock constitutes the whole of her portfolio. And even for a particular investor, there’s a myriad of variables to consider, since the future performance of any given stock as well as the market in aggregate is unknown. However, we believe that the more we demystify the decision-making process—the richer the analysis an investor is exposed to—the more likely he’ll choose a course of action optimal for his unique circumstances. That long-standing Bernstein tenet underlies the in-depth research study that follows.
22
1 Unless a future Congress extends the current tax code, on January 1, 2009, the maximum long-term capital-gains rate will revert to 20% from today’s 15% level.
DISPLAY 1
A Favorable Time for Diversification2004 vs. 10 years ago*
Stock Volatility: UP from 25% to 36%
Capital-Gains Tax Rate: DOWN from 28% to 15%
* Volatility is the rolling-three-year average for large-capitalization U.S. stocks; capital-gains tax is the highest federal rate.Source: CRSP, U.S. Treasury Dept., IRS, Standard & Poor’s, and Bernstein

Bernstein Wealth Management Research 3
1. THE RISK/REWARD IMBALANCE OF A SINGLE STOCK
Holding a single stock is alluring: Indeed, there’s probably no better way to build massive wealth in the capital markets than by concentrating your portfolio. If you had put $1 million into Coca-Cola stock on January 1, 1984, it would have grown to an incredible $34 million by the end of 2003. The same investment in Wal-Mart would have grown to $49 million; $64 million in Berkshire Hathaway; $289 million in Microsoft.2 Investors who bought these stocks early, and could withstand the volatility along the way (which in some cases reached extreme levels), trounced the S&P 500 over this period.
But few stocks—no matter how prized—have proven immune to a drastic turn of events. For example, look at how Fortune magazine’s “Most Admired Companies” of 2000, published right before the market collapse, went on to perform during the heart of the bear market over the next 21/2 years (Display 2):
Of these 10 companies—each identified by corporate executives, directors, and analysts as America’s best—seven lost at least half their stock value over this period. Despite their image of invincibility, they fared worse than the market as a whole during its most difficult period since the Great Depression. Further, dramatic losses like these have
not been a rare occurrence over the years, or confined to any particular industry. Shareholders of numerous large and once-prestigious companies—the likes of TWA, Magnavox, Enron, Singer, Zenith, PanAm, WorldCom, and Wang—have suffered mightily from poor management decisions, overexpansion, new competition, or unethical business practices.
But research reveals that poor results are not reserved for special cases: The average stock tends to lag the market. And the more volatile the stock, the lower the expected growth.
The Return Prospects Aren’t Worth the RiskThe above conclusion can appear puzzling. After all, the market is comprised of individual stocks, so how can the average stock underperform? The answer lies in the nature of a diversified portfolio, which is composed of many stocks that don’t march in tandem with one another. Some will be gaining while others are losing. Diversification therefore mutes a portfolio’s volatility—which raises long-term growth, since short-term fluctuations drag down performance.
The cost of volatility is not just a mathematical principle (see “A Closer Look: The Mathematics of Volatility” on page 4) but a historical reality. Display 3
Source: FactSet, Fortune, Standard & Poor’s, and Bernstein
Top 10 on Fortune “Most Admired” List: 2000
DISPLAY 2
Cumulative ReturnCompany 3/31/00 – 9/30/02
Lucent (98)
Cisco (86)
Intel (79)
Home Depot (59)
Microsoft (59)
Dell (56)
General Electric (50)
S&P 500 (44)
Wal-Mart (12)
Southwest Airlines (6)
Berkshire Hathaway 29
%
2 Based on an investment made in March 1986, after Microsoft’s initial public offering date
*Stocks are grouped based on volatility during the prior five years (1979–1983). Low-volatility stocks represented 25% of index and had volatilities less than 24%; average-volatility stocks represented 50% of index and had volatilities ranging from 24–35%; high-volatility stocks represented 25% of index and had volatilities in excess of 35%. S&P 500 volatility was 15.8%; all volatility figures are based on the annualized standard deviation of quarterly returns. Source: CRSP, Standard and Poor’s, and Bernstein
Single-Stock Performance by Volatility 1984–2003 Annualized*
DISPLAY 3
13.0% 12.6%
10.3%
6.5%
Percent of Stocks: Low Average High
Underperforming S&P 41% 63% 68%
Posting Negative Return 2% 6% 20%
S&P 500 Low Average High

The Enviable Dilemma—Concentrated Stock: Hold, Sell, or Hedge?4
A Closer Look | The Mathematics of Volatility
shows that during the 20 years ending in 2003 the volatility of the average single stock cost almost three percentage points of return per year versus the S&P 500—a shortfall known as “risk drag.” But that’s not all:
• Nearly two-thirds of these “average” stocks underperformed the market.
• The record was far worse with the highest-volatility group: a compounding rate only half the market’s.
• One out of five high-volatility stocks actually lost money over the full 20-year period (something the S&P 500 has never experienced over such a lengthy time frame).3
And the upside pales in comparison with the downside risk: Only 6% of the stocks in the S&P 500 beat the index by more than five percentage points a year over the 1984–2003 period, but 27% underperformed by at least the equivalent amount. Finding the right stock is a challenging enterprise.
What underlies the propensity of a volatile asset to underperform a broadly diversified pool of those same assets? To understand this concept, assume you’ve made three different one-dollar investments. Each has earned an average return of 10% per year for two years. But they’ve done so in very different patterns (display, right):
• Investment A is a single stock with an average return of 10%—earned by losing 20% in the first year and gaining 40% in the second. With that pattern of returns, your volatility would work out to be 30%—roughly in line with the average stock. With those results, your dollar would grow to $1.12 after the two years, the equivalent of a compound annual growth rate—the accurate metric for how fast your money is growing—of 5.8%.
• Investment B is also a single stock with a 10% average return—this time achieved by rising 50% the first year and declining 30% in the second. That’s 40% volatility—enough to make your original dollar worth only $1.05 at the end of the period: the equivalent of compounding at 2.5% a year. Your wealth grew at merely one-quarter of the stock’s 10% average rate. And you’ll note that only the magnitude of the annual returns matters; whether the pattern is loss/gain or gain/loss over the two years, the compound return is affected.
• Investment C combines Stocks A and B. By bringing A and B together into a portfolio that’s rebalanced, their gains and losses partly offset each other, so the path of C’s returns is much smoother than either of its two components alone. As a result, Investment C compounded at a much higher rate of 9.9%, growing your dollar to $1.21. This result demonstrates two principles: how volatility can damage returns and how diversification can mute volatility.
Returns
$1.21
1.12
1.05
9.9%
5.8
2.5
Growthof $1
CompoundGrowth
Year 2Year 1
$1Investment B
Investment C
Investment A
Investment Year 1 Year 2 Average Volatility
A (20 40 = 10 30
B 50 (30 = 10 40
C 15 5 = 10 5
)%
)
% % %
3 Since reliable records began in the 1920s

Bernstein Wealth Management Research 5
In sum, the profile of the average single stock has been decidedly unappealing: It has earned essentially bond-like returns, with volatility far greater than the S&P’s (Display 4). As for the most volatile cohort of individual stocks, they averaged returns similar to T-bills’, but with much more risk. Results like these are at odds with the most basic principle of investing—that assets with higher risk should compensate with higher returns.
Ret
urn
(%)
*Cash is represented by three-month Treasury bills, bonds by five-year Treasuries, and risk by the annualized standard deviation of quarterly returns. Source: Compustat, CRSP, Federal Reserve, and Bernstein
Average Single Stock
Volatile Single Stock
Asset Risk/Return*1984–2003 Annualized
DISPLAY 4
Risk (%)
S&P 500
Bonds
Cash
0 10 20 30 40 500
2
4
6
8
10
1214
However, what if a single stock is seen as important enough to be emblematic of a broader sector? Isn’t it then likely to perform more akin to a diversified portfolio? Consider, for example, a drug stock like Merck. Is exposure to this major company a proxy for investing in pharmaceuticals in general?
We analyzed the drivers of volatility in an investment in Merck. It turned out that only 20% of the stock’s volatility was attributable to its industry. And another 16% of the volatility derived from the fact that Merck trades on the U.S. stock market: Most stocks move in the direction of their home markets. The greatest portion by far—almost two-thirds—of Merck’s share-price volatility was purely a function of company-specific factors, most of them unpredictable. And the only reliable way to mitigate this risk is by diversifying into other companies and other industries.
But how much diversification is enough? The display to the right is based on our forecasts for S&P 500 returns and our single-stock analysis. Setting aside any premium that an active manager may earn, the greater the number of stocks in a portfolio, the more its return will approximate the index’s. We estimate that a portfolio with only one stock (of average volatility) will lag the index by about 21/2 percentage points a year. Increase
the portfolio to five stocks, and you get a “big bang”: The shortfall is reduced to the range of one percentage point. At about 20 stocks, a portfolio begins to reap the lion’s share of the diversification benefit. So investors with concentrated positions in two, three, or five stocks—not only one—face a significant headwind in earning return. ■
Diversification Reduces Risk Drag
Index Return
Portfolio Return
Based on Bernstein’s estimates of the range of returns for the applicable capital markets over the next 30 years. Data do not represent any past performance and are not a promise of actual future results. See Notes on Wealth Forecasting System, pages 33–34, for further details.
An
nu
aliz
ed R
etu
rn (%
)# of Stocks
5
6
7
8
9
50020105321
Cost of Volatility

The Enviable Dilemma—Concentrated Stock: Hold, Sell, or Hedge?6
Two Different Bell CurvesIntegrating our research findings on volatility and returns, Display 5 graphs the distribution of expected returns over a 20-year period for a diversified stock portfolio versus the average single stock. The curves were generated using Bernstein’s wealth-forecasting analysis, a proprietary analysis that melds the fundamental drivers of stock returns (such as earnings, dividends, interest rates, and valuation ratios) with our understanding of market behavior and probabilities.
On the horizontal axis of the display are compound annual returns ranging from dismal on the left to superlative on the right. The expected frequency of each of those returns (out of the 10,000 possible outcomes modeled) is on the vertical axis.
These graphed forecasts go to the heart of the single-stock issue. Compared with the curve for the diversified portfolio, the curve for the single stock is:
• Shifted to the left: The average compound return generated by a single stock is likely to be lower than a diversified portfolio’s.
• Wider: A single stock’s returns tend to be far less predictable than a diversified portfolio’s, and span a much broader range of possible outcomes.
• Skewed: The potential for a single stock to perform far better than a diversified portfolio, shown by the shaded area to the right, is far smaller than the likelihood a single stock will generate weaker returns, the shaded area to the left. In other words, while investors may get paid more in extra return for the extra risk they’re taking on with a single stock, the odds are against them.
Taxes: The Countervailing ForceAll of the above seems to constitute an open-and-shut case for selling and diversifying. In fact, most fiduciaries, whether acting on behalf of a pension plan, a trust, or an individual investor, are now required to diversify. For example, the Uniform Prudent Investor Act mandates that:
A trustee shall diversify the investments of a trust unless…because of special circumstances, the purposes of the trust are better served without diversifying.
But that qualifier—“unless because of special circumstances”—is important, and often those special circumstances will relate to taxation. Most private investors of means will face a large tax bill if they sell. And although today’s low tax rates reduce the cost of selling a low-basis position, a 15% federal gains tax is still a substantial amount to recoup. Some state tax rates can add meaningfully more to the penalty.
In assessing the tax bill on a single-stock sale, an investor needs to consider its amount and his personal time horizon: how long he’s willing to wait to earn the tax penalty back. The shorter the horizon, the more attractive avoiding a sale becomes. Amortized over only a few years, the tax penalty might never be recouped; the longer the horizon, the greater the chance a diversified portfolio will outpace a single stock.
Behavioral biases: the other big disincentive against diversifying. See “A Closer Look,” facing page.
24201612840–4–8–12
Fre
qu
en
cy
Based on Bernstein’s estimates of the range of returns for the applicable capital markets over the next 20 years. Data do not represent any past performance and are not a promise of actual future results. See Notes on Wealth Forecasting System, pages 33–34, for further details.
Extra upside potential
Diversified U.S. Equities
Extra downside risk
Average Single Stock
20-Year Expected Returns(Annualized)
DISPLAY 5
(%)
Bernstein Wealth Management Research 7
To illustrate the relationship between time and taxes, in Display 6 we assume that an investor owns $10 million of Stock XYZ, acquired many years ago at a zero cost basis. At a 6% state tax rate, her effective blended federal/state rate would be 18.9%,4 so if she sells her entire XYZ position she’ll owe $1,890,000 in gains taxes. To recoup that penalty, she’ll need a return of 23.3 percentage points over and above what she would have earned if she didn’t sell XYZ. Garnering that level of return from the market in one year would be highly unlikely. But if her timeframe is longer than that, her picture changes dramatically.
After 10 years, for example, the 23.3-point penalty would be recouped by an extra return of 2.1 points annually over what the investor’s original
A Closer Look | Psychological Barriers to Diversification
Given the unfavorable risk/return pattern of single stocks, one might expect that most holders of concentrated positions would rush to diversify. But when faced with monetary issues, investors often eschew optimal alternatives because of one or another widely held behavioral bias. The field of behavioral finance, which blossomed under Daniel Kahnemann (Nobel Prize winner in economics) and his colleague, the late Amos
Tversky, has provided great insight into the crosscurrents between investing and psychology. As indicated in the table below, behavioral biases tend to push investors in the direction of holding rather than selling a single stock. Studies have found that putting these decisions in an analytical framework can help people overcome these biases and arrive at better decisions. ■
Bias Description Investor Behavior
Anchoring Assuming the future will be like the past Expect continued outperformance from single stock: HOLD STOCK
Overconfidence Overrated ability to predict uncertain occurrences
Single stock seen as a known and successful entity: HOLD STOCK
Attraction to long shots Overestimating occurrence of positive low-probability events (like winning lottery)
Lure of big win: HOLD STOCK
Underestimating the likelihood of extreme events
Overly discounting the probability of unusually good and unusually bad outcomes
The possibility of life-changing negative results ignored: HOLD STOCK
Regret avoidance Regret for taking action more intense than regret for negative consequences of taking no action
Single stock may continue to appreciate, which would cause regret had it been sold: HOLD STOCK
Reference dependency Inappropriate reference point may influence decision-making
Reference point for a single stock tends to be its highest price; and so selling at a lower price feels like a failure: HOLD STOCK
Taking outsized risk to avoid loss
Incurring large risks to avoid a sure loss Avoid taxes attendant on diversifying: HOLD STOCK
*Cost basis assumed to be $0, with a federal long-term capital-gains tax rate of 15% and a state rate of 6%, yielding the 18.9% blended rate
Incremental Annual Return Needed to Recoup Taxes*
DISPLAY 6
23.3%
4.3%2.1% 1.1%
1 Year 5 Years 10 Years 20 Years
Sale of XYZ Stock
Current XYZ Stock Value $10,000,000
Taxes Due (18.9% Rate)* 1,890,000
After-Tax Proceeds 8,110,000
4 Some investors who sell their stock at a large gain may be subject to the Alternative Minimum Tax and would therefore have a higher effective tax rate.

The Enviable Dilemma—Concentrated Stock: Hold, Sell, or Hedge?8
single stock would have produced. It’s a gap that diversification should generally be able to close: As shown in Display 3, the market has historically outpaced the typical single stock by more than that. With a 20-year horizon, an incremental return of about one percentage point a year would be enough to justify a decision to sell and diversify.
The risk/reward imbalance of a single stock
The higher volatility of the average single stock
causes it to lag the market, and the more volatile
the stock the larger the performance drag has been.
Diversifying can both reduce risk and foster higher
long-term growth. While taxes are typically seen as
a significant barrier to divestment, most investors
are likely to recoup the cost of selling in five to
10 years.
2. DETERMINING HOW MUCH TO SELL:TWO CASE STUDIES
It seems that most investors would be wise to divest at least a portion of their concentrated positions. But how much is enough? In searching for an answer, investors with heavily concentrated exposure tend to share some of the same concerns; they ask questions such as:
• Will I be able to maintain my current lifestyle?
• How much volatility am I likely to experience?
• How much is my wealth likely to grow—or decline?
Though the questions for many are similar, the advice has to be customized. For each investor, the characteristics of his concentrated stock and his portfolio as a whole, the tax bill he’ll face upon sale, his tolerance for risk, and his long-term goals are unique. Bernstein uses a proprietary wealth-forecasting model that integrates the client’s circumstances with our capital-markets forecasts and our single-stock return analysis to develop a customized solution. (For details on our model, including more information on our capital-markets assumptions, see Notes, pages 33–34). To bring this process to life, we present two representative examples of investors facing the single-stock dilemma.
Partners Sell Their BusinessJohn Smith and Jane Jones have been partners for many years in a successful printing business which they decide to sell to XYZ Corp., a large conglomerate. In exchange, John and Jane each acquire $10 million of XYZ—a stock with average volatility—in a nontaxable exchange of shares. Their effective cost basis in XYZ is zero. What should John and Jane do with their windfalls?
We start with a profile of their circumstances and goals (Display 7):

Bernstein Wealth Management Research 9
Jane is younger and more aggressive, and her goals are more ambitious, but her wealth is also considerably more concentrated: The lion’s share of her money is tied up in XYZ. John’s goals and lifestyle are more modest (he spends a lower percentage of his assets than she does, for example). He is aiming to protect his wealth; given his much shorter investment horizon, he is contemplating the time when his heirs could benefit from a step-up in cost basis.
For both John and Jane, there are arguments for holding and arguments for divesting their XYZ shares. The case for at least some divestment seems clear for Jane. Aggressive though she may be, having 80% of her wealth in one stock is clearly dangerous. As for John, with $10 million in a diversified portfolio unconnected to XYZ, the concentration risk is not as great, but there are still benefits in diversifying—namely, a sharp reduction in the volatility of his portfolio. And so for both investors, our advice would be to reduce their holdings—although in Jane’s case to a much larger degree.
We’ll begin with John.
Risk of Holding Touches JohnAt first glance, it wouldn’t appear that the hold-or-sell decision has great relevance for John. With substantial assets exclusive of his XYZ shares, a short investment horizon, and a conservative spending budget, our analysis indicates that even if XYZ Corp. were to dissolve, the probability of his running out of money would be close to zero. Therefore, although holding on to all his XYZ stock carries risks for John, it is unlikely to disrupt his lifestyle.
But John is concerned about short-term volatility, which can eat into his assets. And with a portfolio half in one stock, significant fluctuations in wealth—even over a relatively short period—are likely. We quantified the chances that he would experience a loss of 20% or more at any point during his five-year time horizon. We’d estimate the probability of that event at 36% if he retains his current portfolio (Display 8). That’s probably
DISPLAY 7
Case-Study Profiles
John Smith Jane Jones
Age 75 55
Investment Time Horizon 5 yrs 20 yrs
Total Net Worth $20 million $12.5 million
% of Net Worth in XYZ Stock 50% 80%
Annual Spending Needs* $400,000 $375,000
Asset Allocation Excl. XYZ† 60% stock/40% bonds 80% stock/20% bonds
Self-Described Risk Profile Moderate Aggressive
Critical Goals Preserve nominal wealth Grow nominal wealth Limit volatility Maintain lifestyle
*In first year, growing with inflation† Stocks are allocated in the following proportions: 35% U.S. value, 35% U.S. growth, 25% developed foreign, 5% emerging markets; bonds are allocated 100% to diversified
municipals. Proceeds from any sales of XYZ are invested in this asset allocation.
Based on information in the “John Smith” case study and Bernstein’s estimates of the range of returns for the applicable capital markets over the next five years. Data do not represent any past performance and are not a promise of actual future results. See Notes on Wealth Forecasting System.
Chance of a 20% Peak-to-Trough Decline over Next Five Years
DISPLAY 8
Sell 90%Sell 40%Sell 0%
6%
20%
36%
The Enviable Dilemma—Concentrated Stock: Hold, Sell, or Hedge?10
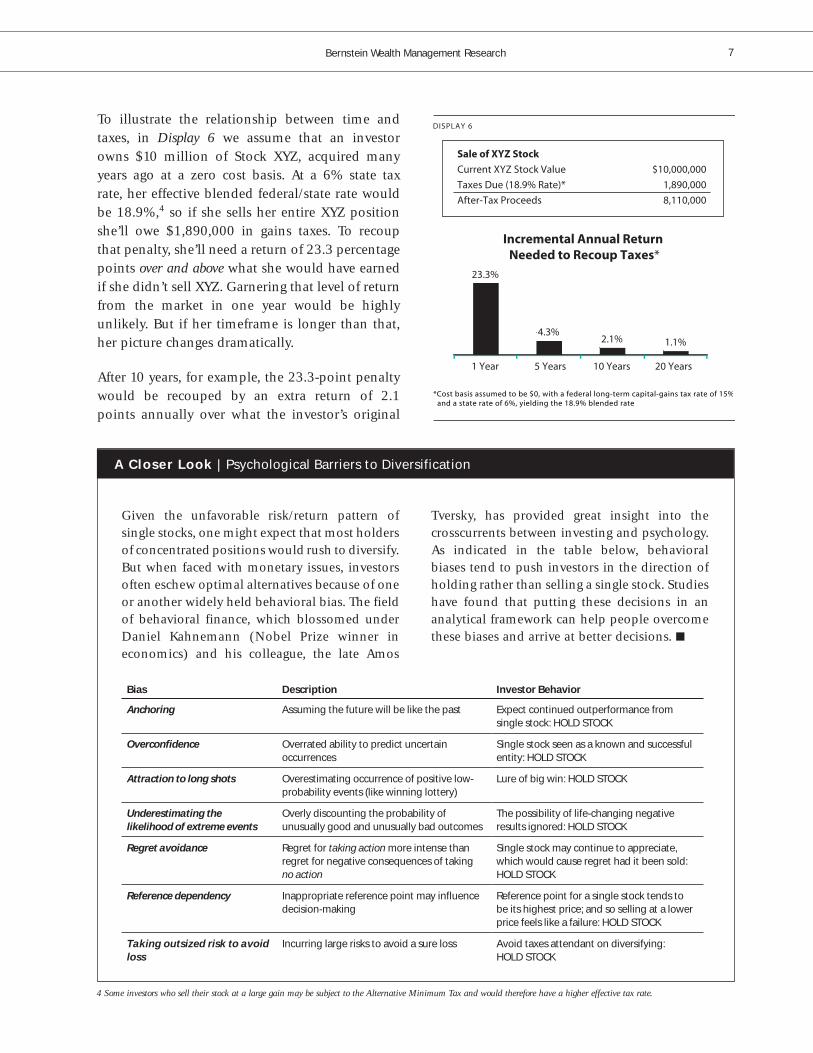
more risk than John is prepared to accept. By selling a substantial portion (40%) of his shares and using the after-tax proceeds to invest in a diversified portfolio, John can reduce those odds to one-in-five. If he sells virtually all his XYZ, the threat becomes far smaller. (We’re showing only three sale alternatives here, for the sake of simplicity. In our actual analysis, we model the results of all sale percentages from 0% to 100% in 10% increments.)
Reward: How Much Can John Make? So should John rid himself of most of his XYZ shares? Though diversifying would bring him significant risk reduction, the cost would likely be less wealth. And so John faces the crux of the single-stock dilemma: how to make the best trade-off.
The results of Bernstein’s analysis in John’s case are depicted in Display 9 as a “box-and-whiskers” chart: Each “box” contains 80% of the potential outcomes and each “whisker” encompasses another 5% of the outcomes. The number in the middle of the bar represents our estimation of the median result: An investor could reasonably expect to wind up with that amount or more half of the time over the analysis period. If John holds all of his XYZ, we estimate that median result at $24.2 million. That’s $4.2 million more than the $20 million he started out with—and a better
outcome than the two divestment alternatives we considered. If XYZ skyrockets, he could more than double his fortune—an outcome we’d expect 10% of the time.
But this growth potential needs to be weighed against the risks to his future wealth. And on this metric, holding creates a great deal more variability. If John holds on to all of his XYZ and the stock performs poorly, his $20 million could end up being worth $14.6 million or less 10% of the time; for all intents and purposes, that’s his downside. Compare those outcomes with the other extreme course he can take. If he decides to sell 90%, we forecast that he’d cut his downside losses by $2 million versus holding—but also slash his upside potential. By taking a “middle-of-the-road” course and selling 40% of his XYZ, he’d be only $600,000 worse off than holding in the median case, he’d gain $1 million more in downside protection, and he’d still have the opportunity to end up with almost twice as much money should the stock take off.
Our Recommendation for John
Minimum divestment: 0%
Optimal divestment: 40%
In general, a minimum divestment amount is needed for any investor whose level of concentration might put his most critical financial objectives at risk. However, John could financially withstand the risk of holding on to XYZ; therefore, our minimum divestment recommendation would be 0%.
But the wide variability in potential wealth is not optimal, and could be improved by diversifying. To find the optimal level of diversification, we combine the mathematical probabilities for his wealth in the future with how he values those probabilities—his appetite for big gains and his willingness to absorb large losses. Here we borrow from utility theory to quantify the amount of pleasure or pain that an individual experiences from different outcomes, given his or her unique appetite for return and tolerance
Leve
l of C
onfi
denc
e
$ M
illio
n
5%10%
50%
90%95%
$42.3
$24.2
$14.6 $15.7
$23.6
$37.0
$31.0
$22.6
$16.6
Based on information in the “John Smith” case study and Bernstein’s estimates of the range of returns for the applicable capital markets over the next five years. Data do not represent any past performance and are not a promise of actual future results. See Notes on Wealth Forecasting System.
Sell 90%Sell 40%Sell 0%
Portfolio Value After Taxes and Spending
Year 5
Initial Value: $20 Mil.
DISPLAY 9

Bernstein Wealth Management Research 11
for risk.5 When we integrate this analysis with the results of our wealth-forecasting model, we arrive at the optimal conclusion unique for each individual. In John’s case, our analysis concludes that a sale of 40% of his shares would be optimal. Given his conservative bent, the risk-reduction benefits of exiting some of his stock would prove valuable enough to forgo a limited amount of upside potential.
Jane Jones: Facing Far Greater RiskWith 80% of her money tied up in XYZ stock, Jane runs a far greater risk than John of compromising her lifestyle. If XYZ blows up or underperforms over a long period of time, the consequences would be devastating. If Jane sells no XYZ shares and maintains her current spending levels, we’d estimate her probability of running out of money at nearly one-in-five over her 20-year investment horizon (Display 10): an unacceptable level of risk for almost any investor. But the more Jane sells and diversifies, the more she limits the risk. By divesting just 40% of her XYZ position—she’d still have half her net worth tied up in the stock—we estimate that Jane would reduce her chances of going broke from one-in-five to one-in-twenty.
But is Jane’s return potential for holding all of her XYZ enough to offset her risk of running out of money? There’s no doubt she has huge upside potential if XYZ should soar—an ending value of some $93 million or more—but in the median case she’d generate far less wealth by holding (Display 11). With a 40% divestment, Jane’s median result would be $18.5 million—fully $3 million more than if she held all her XYZ—and her downside would improve considerably.
If Jane were to divest 90% of her stock, we estimate that her assets would grow, in the median case, by $5 million more than if she held all her stock, and close to $2 million more than if she sold 40%. And though she’d give up significant upside versus the other scenarios, she would also meaningfully reduce her downside risk.
Our Recommendation for Jane
Minimum divestment: 40%
Optimal divestment: 90%
Based on information in the “Jane Jones” case study and Bernstein’s estimates of the range of returns for the applicable capital markets over the next 20 years. Data do not represent any past performance and are not a promise of actual future results. See Notes on Wealth Forecasting System.
Probability of Running Out of Money
Year 20
After Taxes and Spending
DISPLAY 10
1009080706050403020100
<2%
5%
18%
Percent of Stock Sold
5%10%
50%
90%95%
$92.6
$15.4
$0.0 $3.1
$18.5
$71.4
$46.6
$20.3
$7.6
Based on information in the “Jane Jones” case study and Bernstein’s estimates of the range of returns for the applicable capital markets over the next 20 years. Data do not represent any past performance and are not a promise of actual future results. See Notes on Wealth Forecasting System.
Sell 90%Sell 40%Sell 0%
Portfolio Value After Taxes and Spending
Year 20
Initial Value: $12.5 Mil.
DISPLAY 11
$ M
illio
n
Leve
l of C
onfi
denc
e
5 To make these comparisons we use something called the “Constant Relative Risk Aversion” utility function. The “utility” of a given level of wealth is expressed by: Utility = (Wealth ^ (1-1/K))/ (1-1/K), where K represents the individual’s risk aversion. To assess the investor’s risk aversion, we use his expressed preference between stocks and bonds. For example, an investor who would allocate his investments 100% in bonds would have a far lower value of K than an investor who would allocate 100% in stocks. For each strategy, the utilities of the various possible outcomes are averaged to arrive at the expected utility. The strategy with the highest expected utility value would be optimal.

The Enviable Dilemma—Concentrated Stock: Hold, Sell, or Hedge?12
In our view, Jane should act immediately to sell at least 40% of her XYZ shares. This would reduce the risk that holding poses to her lifestyle to a more acceptable level—but she shouldn’t stop at that point. Over her long time horizon, the benefits of diversification would build, yielding far less risk and greater long-term growth in most cases. Our recommendation would be for Jane to divest 90% of her shares.
Guidelines for Investors These recommendations for John and Jane were tailored to their unique circumstances, as they would be for any investor who sought Bernstein’s advice. Still, based on the variables that we analyze in every case, there is a set of basic principles that applies across the board. As the variables change, so do our recommendations. To illustrate, consider the three key principles below, and how altering assumptions can lead to radically different conclusions. (The data below are based on “Jane Jones’s” case, but the relationships apply universally.)
1. If more volatile, sell more. All else equal, the more volatile the stock, the greater the risk borne by the investor and the lower the long-term growth. Therefore, a higher sale amount is typically prudent. But the investor’s time horizon can never be ignored (Display 12).
Over a time frame as relatively short as five years, we’d advise selling some 90% of a highly volatile stock—far more than we’d recommend with a stock of average or low volatility. But as the time horizon lengthens, the more the recommended sale percentages converge. Over 20 years, the chance of even a low-volatility stock underperforming—potentially at a dramatic level—becomes significant.
2. If lower cost basis, sell less. The higher the stock’s tax cost, the less of a concentrated position we’d recommend selling. With a 75% cost basis in a zero-tax state, all else equal, we’d likely recommend divesting nearly all of a concentrated single stock. However, with a 0% basis in a high-tax state and a five-year time horizon, we’d probably advise selling about half the stock. But if that time horizon extends to a period as long as 20 years, our analysis indicates that the benefits of diversification can overwhelm even a high tax bill.
3. Spending policy, volatility, and time horizon are all interrelated. The critical factors determining minimum and optimal diversification levels all affect one another. Display 13 illustrates how a minimum sale recommendation would be likely to vary with stock volatility and investor spending levels. The higher the spending budget and the greater the single stock’s volatility,
*Amount required to ensure 95% confidence of meeting spending needs based on “Jane Jones” case study and Bernstein’s estimates of the range of returns for the applicable capital markets over the next 20 years. Data do not represent any past performance and are not a promise of actual future results. See Notes on Wealth Forecasting System.**Grown with inflation† Spending is net of income. If the investor planned to remain in the workforce for a lengthy period (and hence was less dependent on the single stock), our minimum recommended sale amount would decline.
Minimum Sale Recommendation*DISPLAY 13
Spen
din
g†
Percent of Starting Stock Volatility Asset Value** Low Average High
2.5% 0% 20% 30%
3.0% 20% 40% 50%
3.5% 50% 70% 80%
4.0% 95% 95% 95%
%
*Based on information in the “Jane Jones” case study and Bernstein’s estimates of the range of returns for the applicable capital markets over the next 20 years. Data do not represent any past performance and are not a promise of actual future results. See Notes on Wealth Forecasting System.
Optimal Sale Recommendations*DISPLAY 12
0
20
40
60
80
100
20105
Years
1
High-VolatilityStock
AverageVolatility
LowVolatility

Bernstein Wealth Management Research 13
the higher we’d set the minimum divestment percentage. Indeed, at a certain long-term spending level (about 4% of the portfolio’s initial value, grown with inflation), we’d tend to recommend near-total divestment regardless of the stock’s volatility. Spending at that rate heightens the need to reduce single-stock risk.
Determining how much to sell
An analytical tool that quantifies the range of
potential outcomes can help investors and their
professional advisors assess the trade-offs inherent in
deciding whether and how much of a concentrated
stock to sell. At a minimum, investors should divest
enough to help ensure that their core lifestyle needs
are not at risk. The optimal amount to sell rises with
longer time horizons, lower risk tolerance, lower
tax costs, higher single-stock volatility, and higher
spending budgets.
3. THE BENEFITS—AND DRAWBACKS—OF STAGED SELLING
Investors may be uncomfortable with divesting a substantial piece of their stock all at once. In some cases, it might be because they’re convinced that their stock is undervalued and poised for a rebound. Others may be uneasy about paying such a large tax bill in one year, or concerned about the impact that a large sale might have on the market if executed too quickly. In the case of corporate insiders subject to trading restrictions, a blueprint for staged selling—a so-called 10b5-1 plan that specifies how much and when a stock will be sold—may be a valuable tool for helping executives achieve their long-term diversification goals.6
In situations like those, timed selling strategies can offer “middle-ground” alternatives that allow investors to smooth out their tax hit and retain meaningful upside potential. Below are some options that might be considered by investors wishing to divest their holdings over a five-year period:
• Sell all the stock now that they wish to sell (no staging).
• Sell 50% now, then equal portions quarterly over the next four years.
• Sell equal portions quarterly over five years.
• Sell as the stock appreciates—and in any case, after five years (the “profit-taker” approach).7
• Sell all the stock after five years.
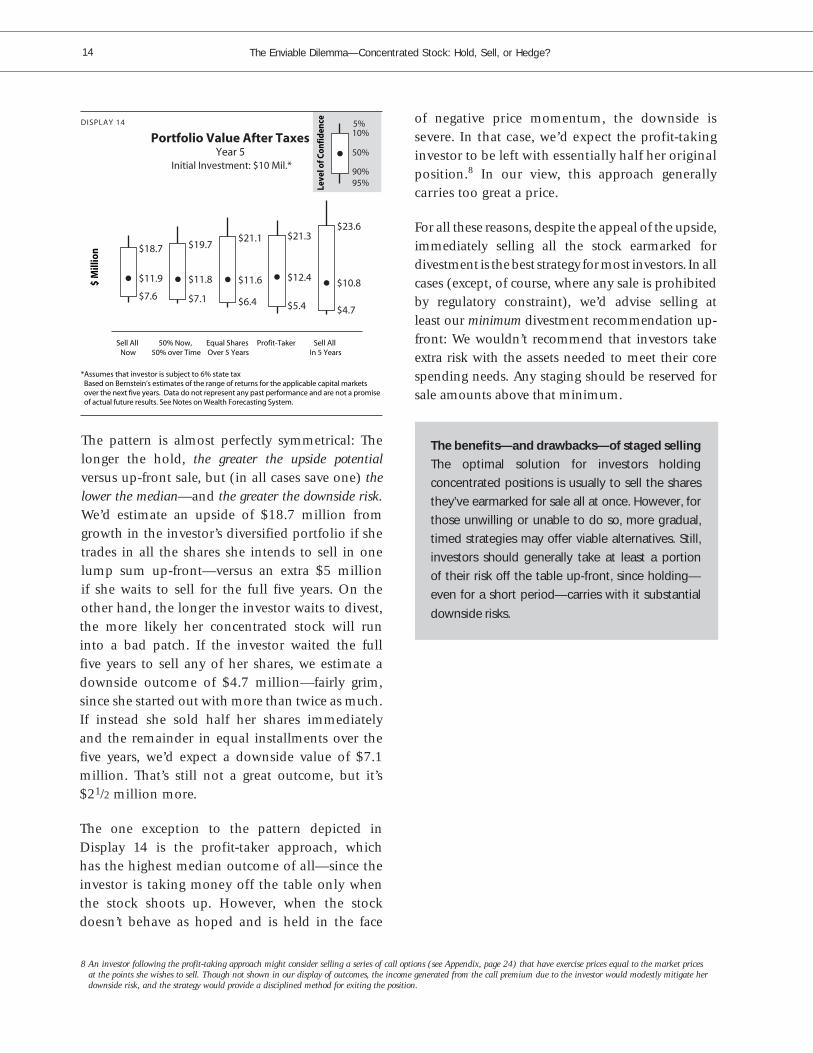
Increased Upside and Downside Our analytical tool can be used to assess the pros and cons of strategies like these. Display 14, next page, presents our assessment of the rewards and risks of immediate sale versus various staged five-year strategies for an investor with a $10 million position in an average-volatility stock. The outcomes (after taxes) assume that all sale proceeds are reinvested in a diversified stock portfolio.
6 In October 2000, the Securities and Exchange Commission added this rule to the Securities Exchange Act of 1934. Rule 10b5-1 provides an affirmative defense against insider-trading liability if a corporate insider demonstrates that before becoming aware of inside information he entered into a binding contract to purchase or sell a security, instructed another person to purchase or sell a security, or adopted a written plan for trading securities. See Glossary of Trading Restrictions and Regulations in Appendix, pages 30–31.
7 A typical profit-taker approach might work something like this: The investor sells 25% of his initial shares if a $100 stock rises to $120, 50% if the stock rises to $140, 75% at $160, and 100% at $180. Even if these targets are not met, the entire position targeted for divestment is sold at the end of the five-year period.
The Enviable Dilemma—Concentrated Stock: Hold, Sell, or Hedge?14
The pattern is almost perfectly symmetrical: The longer the hold, the greater the upside potential versus up-front sale, but (in all cases save one) the lower the median—and the greater the downside risk. We’d estimate an upside of $18.7 million from growth in the investor’s diversified portfolio if she trades in all the shares she intends to sell in one lump sum up-front—versus an extra $5 million if she waits to sell for the full five years. On the other hand, the longer the investor waits to divest, the more likely her concentrated stock will run into a bad patch. If the investor waited the full five years to sell any of her shares, we estimate a downside outcome of $4.7 million—fairly grim, since she started out with more than twice as much. If instead she sold half her shares immediately and the remainder in equal installments over the five years, we’d expect a downside value of $7.1 million. That’s still not a great outcome, but it’s $21/2 million more.
The one exception to the pattern depicted in Display 14 is the profit-taker approach, which has the highest median outcome of all—since the investor is taking money off the table only when the stock shoots up. However, when the stock doesn’t behave as hoped and is held in the face
of negative price momentum, the downside is severe. In that case, we’d expect the profit-taking investor to be left with essentially half her original position.8 In our view, this approach generally carries too great a price.
For all these reasons, despite the appeal of the upside, immediately selling all the stock earmarked for divestment is the best strategy for most investors. In all cases (except, of course, where any sale is prohibited by regulatory constraint), we’d advise selling at least our minimum divestment recommendation up-front: We wouldn’t recommend that investors take extra risk with the assets needed to meet their core spending needs. Any staging should be reserved for sale amounts above that minimum.
The benefits—and drawbacks—of staged selling
The optimal solution for investors holding
concentrated positions is usually to sell the shares
they’ve earmarked for sale all at once. However, for
those unwilling or unable to do so, more gradual,
timed strategies may offer viable alternatives. Still,
investors should generally take at least a portion
of their risk off the table up-front, since holding—
even for a short period—carries with it substantial
downside risks.
8 An investor following the profit-taking approach might consider selling a series of call options (see Appendix, page 24) that have exercise prices equal to the market prices at the points she wishes to sell. Though not shown in our display of outcomes, the income generated from the call premium due to the investor would modestly mitigate her downside risk, and the strategy would provide a disciplined method for exiting the position.
Leve
l of C
onfi
denc
e
5%10%
50%
90%95%
$18.7
$11.9
$7.6
$19.7
$11.8
$7.1
$21.1
$11.6
$6.4
$21.3
$12.4
$5.4
$23.6
$10.8
$4.7
*Assumes that investor is subject to 6% state tax Based on Bernstein’s estimates of the range of returns for the applicable capital markets over the next five years. Data do not represent any past performance and are not a promise of actual future results. See Notes on Wealth Forecasting System.
$ M
illio
n
Portfolio Value After Taxes Year 5
Initial Investment: $10 Mil.*
DISPLAY 14
Sell All In 5 Years
Profit-TakerEqual Shares Over 5 Years
50% Now, 50% over Time
Sell All Now

Bernstein Wealth Management Research 15
4. HEDGING SINGLE-STOCK RISK Holding, selling, and trimming do not exhaust the possibilities for owners of concentrated stock positions. Some believe that hedging strategies can “do it all”—protect wealth, delay taxes, and diversify a portfolio at the same time.
For example, imagine that you were the owner of $10 million worth of a single stock, and could enter into a contract to sell your shares at a specified future date. In exchange, you’d be able to receive an up-front cash payment representing the lion’s share (usually 80–90%) of the stock’s current value. In the meantime, you could do anything you wished with that money—invest in a diversified stock portfolio, for example.
The contract would typically give you downside protection through a predetermined floor price for your stock and the potential to participate in its upside, should it appreciate. Further, so long as the delivery amount were not preset but dependent on the value of the stock at the expiration of the contract, no taxes would be due until then. And you could choose to settle either by delivering your stock to the counterparty (so-called “physical settlement”) or—if you wanted to retain your shares—by cash.
Prepaid Variable Forwards: Hedge and DiversifyThe fact is, you could enter into such a transaction, called a prepaid variable forward sale (PVF),9 a recent innovation in single-stock risk management (Display 15). Essentially, the PVF functions like a “collar”—a similar hedging strategy that provides downside protection via the purchase of a put option and some upside participation (limited by the sale of a call option).10 But with the PVF you have a much larger cash pool to work with, enabling you to diversify your assets more effectively. Of course, none of this comes free, since the up-front payment you receive is less than the full value of your stock. (See Appendix, pages 25–27, for more details on the structure and pricing of PVFs and collars.)
The attractions of PVFs are obvious. Indeed, a PVF can be a preferred means of managing a concentrated position, particularly for:
• Investors unwilling or unable to relinquish their single stock for emotional reasons or because of trading restrictions.11 These investors will often find the downside protection of hedging valuable relative to holding.
• Investors with short time horizons. Upon their death, their heirs may be entitled to a step-up
9 A PVF contract is highly complex and needs to be structured properly because of tax and other considerations. Any investor considering a PVF should consult his legal and tax advisors.
10 An investor can borrow money against a collar, but if he plans to reinvest the funds in marginable securities, his loan is limited by regulation to 50% of the market value of the stock underlying the collar.
11 This group may include corporate insiders. Investors facing corporate or regulatory restrictions should consult their legal and tax advisors before entering into a PVF contract. Some of these investors may not be permitted to sell or hedge their shares.
How A Prepaid Variable Forward Is StructuredDISPLAY 15
Investor receives up-front payment (typically 80–90% of value) in exchange for delivery of variable amount of shares or cash in the future
Floor price protects investor from decline in value of the stock
Cap price allows investor to participate in limited stock price appreciation
Enters prepaid forward contract
Investor Counterparty
$10MM stock held as collateral
Up-front payment
Settles prepaid forward contract
Investor Counterparty
Investor may retain some shares if stock price appreciates
Delivers shares (or cash)

The Enviable Dilemma—Concentrated Stock: Hold, Sell, or Hedge?16
in cost basis on the assets they inherit, meaning that they could avoid paying capital-gains tax altogether. In this situation, hedging is often a better strategy than holding or selling.
Do PVFs Work for Most Investors? But prepaids are not for everyone. They’re private transactions requiring large amounts of money, and as with all hedging strategies, they’re complex and often misunderstood. Using our wealth-forecasting system, we analyzed when a typical three-year PVF might be preferable to a straight sale. Display 16 illustrates the probabilities that such a PVF would outperform an outright sale given varying market returns (the horizontal axis) and single-stock returns (vertical axis). We’re assuming a $10 million stock position ($100 per share, $0 cost basis).12 The PVF is structured as follows:
• An up-front payment to the investor of $85.80 per share;
• A floor of $100 per share (akin to a purchased put) and a cap at $120 per share (akin to a sold call);
• Physical settlement at expiration.
It’s clear that the better the stock performs, the more likely that this representative PVF will beat outright sale. Once the stock hits a return target of about 5% a year (including dividends), the PVF is likely to win out. This should be enough to compensate
the investor for the cost of the transaction ($14.20 per share—the difference between his $100 initial position and the up-front payment he receives). Interestingly, how the market does is virtually irrelevant.13 The reason is that the up-front payment from the PVF has itself provided the investor with the means to create a diversified portfolio of comparable size.
We estimate that in our representative PVF the single stock will meet its 5% hurdle rate about half the time. There’s some irony here, since a PVF is often thought of as a hedge against poor single-stock performance. In reality, if the stock performs poorly the investor would have been better off selling. The stock’s appreciation is needed to offset the PVF’s cost, since the investor will still owe taxes on the up-front payment when he settles the contract. In fact, in this $10 million example the PVF had a downside $600,000 worse than a straight sale. Indeed, investors looking solely for pure downside insulation may be better off with traditional collars. With a collar, an investor is not compelled to incur additional financing costs for diversification purposes.
So far we’ve been assuming that the investor is willing to give up his shares when the hedging contract expires. But investors do have the option to settle with cash and keep their stock, delaying taxes longer. Unfortunately, though, cash settlement can bring a host of complications—and the longer the hedge is maintained on that basis, the more damaging the effects can become.
Cash Settlement: The Complexities of Straddle TaxationCash settlement sounds appealing: Since the shares are never delivered, no taxes are due. However, investors haven’t escaped taxation altogether, since any gains or losses on the hedge are taxable. This raises a key problem called “straddle taxation.” The rules are complicated, but the concept is simple: If a hedging transaction is settled in cash, any gains
*Assumes physical settlement of contract Source: Bernstein
Probability of Three-YearPVF Outperforming Sale*
DISPLAY 16
Sto
ck A
nn
ual
ized
Ret
urn
Market Annualized Return
12 Results are after taxes, assuming 6% state rate, and assuming that all sale proceeds are reinvested in 100% equities.
13 PVFs can be customized in various ways. An investor desiring greater upside potential in the stock will need to accept a smaller up-front payment, so that the break-even point versus outright sale may be higher. That would make market returns more relevant.
10%+ >98% >98% >98% >98%
5–10% 96% 97% 93% 92%
0-5% 8% 10% 12% 11%
Negative <2% <2% <2% <2%
Negative 0–5% 5–10% 10%

Bernstein Wealth Management Research 17
from the hedge are taxable immediately at higher short-term rates, while losses from the hedge are treated as long-term and may not be deductible until the underlying stock is sold. For the investor, this is a lose-lose proposition (Display 17).
Though the implications of straddle taxation are essentially the same with virtually any hedging transaction, we’ll stick with our representative PVF to illustrate the potential complications that may arise if the stock either rises or falls significantly:
• If the stock has dropped to $60 at settlement, the investor will be required to come up with cash to buy back his shares from the counterparty. Since he has already received $85.80 up-front, that shouldn’t pose a problem. However, the investor does owe short-term gains taxes, due immediately, on the $25.80 per share he’s gained on the contract. What started out as a long-term gain is now subject to highly unfavorable short-term treatment. Assuming a combined federal and state rate of 38.9%, that translates into a tax bill of $1 million.
• If the stock has risen to $160 at expiration, settlement might get stickier. The investor will get to keep shares equal to the first $20 of the gain, since that’s the cap on the PVF. So he’ll need to pay the counterparty $140 per share, or $14 million. Even if he had that cash on hand, would he want to vastly increase his concentration risk? And while he’d be due a $5.4 million capital loss (long-term), he wouldn’t be able to harvest it until the underlying shares were sold.
The more extreme the stock’s price movement, the more devastating the complications could become. At some point, the tax and cash-flow implications of cash settlement can be so large that the investor would be better off delivering his shares and paying the capital-gains taxes. In that case, the investor would have in effect accomplished nothing: He’d have lost his intended tax deferral and lost his stock.
Rolling Over: Time Hurts You The question then becomes whether the benefit of deferring the capital-gains tax on the underlying stock outweighs the risks of cash settlement. To address this issue, we looked at two strategies: hedging for three years with a PVF, and hedging for nine—both cash-settled (Display 18). Many longer-term investors holding concentrated
Leve
l of C
onfi
denc
e
5%10%
50%
90%95%
$15.1
$10.4$7.1
$16.1
$11.5
$7.3$9.0
$15.7
$27.0
$6.9
$15.0
$29.7
*Assumes cash settlement for previous PVF contracts and rollovers to new contracts using the up-front payments from subsequent contracts. Assumes floor and cap remain constant at 100% and 120% of price at time of roll. Up-front payment, initially at $85.80, will vary at each roll, primarily based on interest rates and the stock dividend. Source: Bernstein
$ M
illio
n A
fter
Tax
es
Rolling Three-Year PVFs*Initial Investment: $10 Mil.
DISPLAY 18
Year 3 Year 9
PVFSell AllPVF Sell All
Position at Expiration of PVF Tax Characterization Timing of Recognition and Taxation
Gain: Stock price below up-front payment to investor Short-term capital gain Immediately upon expiration
Loss: Stock price above up-front payment to investor Long-term capital loss May be required to defer until gains on
underlying stock are realized
Bernstein is not a legal or tax advisor. Consult your legal and tax advisors before implementing any transaction that may result in straddle taxation.
DISPLAY 17
Straddle-Taxation Rules Work Against Investors

The Enviable Dilemma—Concentrated Stock: Hold, Sell, or Hedge?18
positions choose to “roll over” their hedges into new contracts, preserving their tax benefits and downside protection while maintaining exposure to their stocks.14
Over the three-year period, our representative PVF beat outright sale on the upside, on the downside, and in the median case, highlighting the short-term benefits of tax deferral. However, if the investor cash-settles and discontinues her hedge, she’s back where she was at the beginning, holding a highly concentrated low-basis stock. If she continues to roll over her hedge, time is not her friend. After nine years, in our judgment the investor would clearly have been better off had she sold outright. The PVF loses to sale by more than $2 million on the downside and by $700,000 in the median case. The costs incurred in cash-settling and in renewing each new hedge build over time, making hedging an unappealing long-term strategy.
Still, though an outright sale is typically the best long-term bet, hedging is often preferable to doing nothing. Especially for investors who cannot sell, utilizing one or another hedging mechanism will provide them with more protection than holding on to a single stock.
For anyone considering hedging, careful individualized attention by tax and legal professionals is critical. Although Bernstein does not offer legal or tax advice, we can play a role by evaluating the financial implications of the various alternatives.
Hedging single-stock risk
An investor with a short time horizon, an
unwillingness to sell, or a restriction on a sale
may view hedging as a useful means of managing
single-stock risk. Prepaid variable forwards are a
relatively new hedging vehicle that can also provide
substantial liquidity for diversification. But risks
come with the territory that can erode the benefits
of hedging, particularly if the strategy is employed
long-term.
5. CHARITABLE REMAINDER TRUSTS AND EXCHANGE FUNDS
For investors with a longer investment horizon diversifying is typically the best strategy. However, sometimes a straight sale can leave money on the table. There are at least two other alternatives that investors often consider:
The first is an exchange fund. Exchange funds offer diversification without realizing a current taxable gain. Many investors contribute their appreciated stocks to a limited partnership in exchange for an interest in the resulting diversified portfolio. By placing the shares in the partnership, investors may be entitled to discount the value of their shares, yielding potential estate-planning benefits. After a predetermined period (generally seven years), each shareholder can withdraw a pro rata share of the diversified portfolio.
Despite the above benefits, there are many drawbacks to exchange funds, so investors need to exercise caution before joining in. The seven-year period generally comes with little or no income. Exchange funds are not suitable for those looking for liquidity from their single-stock strategy. Further, though the portfolio is largely managed passively, the fees can be high and there may be a sales load. Some exchange funds may also suffer from “negative selection bias,” since investors may contribute shares of companies they no longer wish to hold. Finally, in addition to the single stocks contributed, regulations require exchange funds to invest at least 20% of their value in illiquid “qualifying assets”—usually commodity or real-estate interests, which the partnership generally buys with debt. With all of these complications, we typically would not recommend exchange funds, especially for a sizable portion of an investor’s single-stock position.
14 An investor who decides to settle in cash and renew her hedge may be able to offset some of the large cash requirement with the up-front payment from the new contract.

Bernstein Wealth Management Research 19
CRTs: Permanent Divestment with Added Benefits The second alternative investors might consider is a charitable remainder trust (CRT). CRTs can play an important role in one’s diversification strategy, especially for long-term investors who are philanthropically minded. CRTs feature an attractive array of benefits:
• The investor transfers a highly appreciated asset to a trust.
• The investor receives a charitable tax deduction at the time of the grant.
• The asset is typically sold by the trust tax-free, and the proceeds reinvested in a diversified portfolio.
• The investor receives an annual income stream from the trust—either a fixed dollar amount (in an annuity trust) or a fixed percentage (in a unitrust) of the trust’s market value. (This income is taxable, partially offsetting the initial tax-free sale of the stock.)
• The trust provides a vehicle for charitable giving, since at the trust’s termination the remaining assets go to a charity of the investor’s choice.
A CRT is not right for everyone. The initial transfer of assets is irrevocable, and the investor’s degree of charitable intent will bear on the attractiveness of a CRT. Investors considering a CRT need to make sure they know the answers to a number of critical questions:
How much should I contribute to the CRT?
What is the optimal payout rate?
What should the asset allocation of the CRT be?
How much wealth do I want to go to charity?
Will I be better off with or without a CRT?
An investor’s individual circumstances heavily influence the answer to each of these questions. With capital-gains rates at 15%, however, most investors will need a relatively long time horizon for a CRT to generate enough personal wealth to match what the investor would accumulate if
he sold outright. Consider a lifetime charitable remainder unitrust for a 55-year-old donor contributing $10 million in stock with a zero cost basis. The CRT is invested 100% in stocks, with the investor’s personal assets allocated 60% to stocks and 40% to bonds. Our analysis indicates that with a payout rate of 11%, it would take approximately 17 years to reach this “crossover” point (Display 19). Therefore, at least some level of charitable intent makes a CRT more attractive.
Generally speaking, the following factors affect the timing of this crossover point:
• Payout rate—At a higher payout percentage, greater amounts of money will be pulled out per year and reinvested, thereby resulting in a faster return on initial investment. However, over a long enough time period a lower payout rate may result in more total wealth, since the trust will have the benefit of higher tax-deferred compounding.
• Tax cost of sale—The lower the tax basis of the contributed asset and the higher the effective tax rate, the earlier crossover will be reached.
Acc
um
ula
ted
Wea
lth
($ M
il.)
*Median result Based on a 55-year-old donor contributing $10 million ($0 cost basis) to a lifetime
charitable remainder unitrust (CRUT) with 11% annual payouts, and with 12 months preceding the first unitrust payout. Calculation according to Sections 7520 and 664 of the Internal Revenue Code of 1986, as amended, and the Treasury Department regulations thereunder. Assumes §7520 rate of 5%, state tax rate of 6.85%, income payments invested 60% in global stocks and 40% in bonds, and CRUT invested 100% in global stocks.
Based on Bernstein’s estimates of the range of returns for the applicable capital markets over the next 30 years. Data do not represent any past performance and are not a promise of actual future results. See Notes on Wealth Forecasting System.
Years
Sell outright, paytaxes, and reinvest
Additional wealth from creating CRT
Contribute to CRT, accumulate and reinvest payouts
Crossover
0
10
20
30
40
50
15100
Asset Growth After Taxes*Cumulative Results
DISPLAY 19
2520 305

The Enviable Dilemma—Concentrated Stock: Hold, Sell, or Hedge?20
• Relative equity allocation—The more aggressive the equity allocation within the CRT, the sooner crossover can be expected in the median case—but with increased risk on the downside.
While the time horizon needed to achieve crossover with CRTs is long, these trusts can be powerful tools to achieve one’s personal and charitable goals. In our example above, by year 17, the investor will have accumulated $20 million in personal wealth from the CRT in the median case, including reinvestment of the payouts—effectively the same amount as he’d have by selling and diversifying. But the CRT will still have $6.5 million left in the trust to pass to the charity—a benefit of great importance to some investors.
And by taking a lower payout rate, an investor who is philanthropically minded can create an even larger charitable legacy, without materially reducing his personal wealth. Over the long term, the results can be substantial. For our hypothetical CRT, our investor might consider reducing his payout rate to 5%, instead of 11%. The trade-off is a $4 million reduction in his personal wealth over 30 years, but an increase of more than $25 million in the amount of money left to go to charity. By leaving the assets in the tax-deferred environment longer, the CRT created almost $22 million of additional wealth (Display 20). And under both payout scenarios, the investor has accumulated more wealth by diversifying inside a CRT rather than selling outright in a taxable portfolio.
Whether an investor should move forward with a CRT and how it should be structured will depend on how he balances his personal and charitable goals. Further, the investor needs to keep in mind
that he’s given up control of whatever portion of the stock he puts in the trust. If in any given year, he winds up needing more money than the CRT is throwing off, he’ll have to look elsewhere. For that reason, CRTs are appropriate for only a portion of an investor’s assets. CRT investors should ensure that there’s enough wealth outside their trusts to care for their needs.
For more of our analysis of CRTs, see our publication Unlocking the Investment Potential of Charitable Remainder Trusts.
Other diversification alternatives
Exchange funds and charitable remainder trusts both
offer tax deferral and diversification. CRTs are often
an attractive choice and can be customized to meet
the unique personal and charitable objectives of the
donor. The longer the investment time horizon, the
more effective CRTs can be, especially for those with
philanthropic intent. ■
*Median result See note below Display 19.
Accumulated Wealth from CRT*After Taxes—Year 30
Initial Value: $10 Mil.
DISPLAY 20
Charity’s Interest
PersonalWealth
$ M
illio
n
CRT 5% PayoutCRT 11% PayoutSell Outright
$77.0
$30.3$4.9
$55.4
$41.0
$46.7$50.5$41.0
Bernstein Wealth Management Research 21
SUMMARIZING THE ALTERNATIVESBearing in mind that there are no easy answers in managing single-stock exposure, we’d make the following points:
• All strategies come with costs attached, whether they’re calibrated in dollars or extra risk.
• Given a long enough investment horizon, selling a substantive portion of one’s holdings outright and paying the taxes is probably the best strategy. At a minimum, investors should act to divest enough shares to help ensure meeting their long-term spending needs.
• Hedging via derivatives makes sense for a subset of investors, particularly those with short investment time horizons or restrictions on sale. However, derivatives’ broader appeal is limited: The transactions are highly complex and can prompt unfavorable tax and cash-flow complications.
• Especially for investors with philanthropic intent, charitable remainder trusts can be a useful vehicle for diversifying a portion of their assets.
Given the many dimensions of managing highly concentrated wealth, an analytical model that quantifies the costs and benefits of each strategy in a host of market environments can help investors and their advisors make well-informed decisions. ■


Bernstein Wealth Management Research 23
Appendix
MORE ON ALTERNATIVES TO OUTRIGHT SALE
GLOSSARY OF TRADING RESTRICTIONS AND REGULATIONS
We devote our Appendix to details on two complex topics associated with single-stock exposure:
• Hedging and other alternatives to simply selling and diversifying (some of which are discussed in the preceding pages, others introduced here);
• A glossary of rules applicable to restricted trading and key regulations that holders of concentrated stock may face.
For any investor considering hedging or related arrangements, or subject to trading restrictions, we recommend becoming familiar with the information on the following pages.

The Enviable Dilemma—Concentrated Stock: Hold, Sell, or Hedge?24
Option Strategies: Buy a Put
Investor pays premium to sell a stock at a specified price and time
Assumptions
Stock Price
Put Strike
Put Premium
Time to Expiration
$100
$85
$10*
3 yrs
Po
siti
on
Val
ue
($)
*Put pricing is for illustrative purposes only.†Tax-straddle rules may have a significant negative impact on after-tax results. Source: Bernstein
Stock
Put Payoff DiagramPre-Tax†
Stock Price at Expiration ($)
Stock + Put
0
50
100
150
200
200180160140120100806040200
Option Strategies: Sell a Call
Investor receives premium in exchange for granting counterparty the right to buy a stock at a specified price and time
Assumptions
Stock Price
Call Strike
Call Premium
Time to Expiration
$100
$120
$10*
3 yrs
Po
siti
on
Val
ue
($)
*Call pricing is for illustrative purposes only.†Tax-straddle rules may have a significant negative impact on after-tax results. Source: Bernstein
Stock
Call Payoff DiagramPre-Tax†
Stock Price at Expiration ($)
Stock + Call
0
50
100
150
200
200180160140120100806040200
Pros
Downside price protection at put strike
Retain full upside potential of stock
May defer tax/preserve potential step-up
Maintain some dividends and voting rights
Cons
Premium paid can be significant
Tax-straddle rules may apply
Cash-flow complications at expiration may necessitate sale and gain recognition
Dividend may not qualify for 15% tax rate
Counterparty credit risk
Pros
Generates up-front cash payment
Upside potential up to call strike
May defer tax/preserve potential step-up
Maintain some dividends and voting rights
Cons
No downside protection (except premium)
Appreciation limited to call strike
No diversification achieved

Bernstein Wealth Management Research 25
Cashless Collar
Combination of purchased put and sold call that is often structured as “cashless,” requiring no up-front payment
Assumptions
Stock Price
Put Strike
Call Strike
Premium
Time to Expiration
$100
$85
$120
Cashless
3 yrs
Po
siti
on
Val
ue
($)
*Tax-straddle rules may have a significant negative impact on after-tax results. Source: Bernstein
Stock
Collar Payoff DiagramPre-Tax*
Stock Price at Expiration ($)
Collar
0
50
100
150
200
200180160140120100806040200
Pros
Downside price protection at put strike
Upside potential up to call strike
Can be designed as cashless to avoid any up-front cost
May defer tax/preserve potential step-up
Maintain some dividends and voting rights
May cash-settle transaction if wish to retain shares
Supports limited borrowing to diversify
Cons
Appreciation limited to call strike
Pricing set to allow dealer profit
Tax-straddle rules may apply
Sufficient exposure to stock-price movement needed for collar not to be considered a sale for tax purposes
Dividend may not qualify for 15% tax rate
Counterparty credit risk
Prepaid Variable Forward Sale
Investor receives up-front payment (typically 80–90% of value) in exchange for delivery of variable amount of shares or cash in the future
Floor price protects investor from decline in value of the stock
Cap price allows investor to participate in limited stock price appreciation
Enters prepaid forward contract
Investor Counterparty$10MM stock held as collateral
Up-front payment
Settles prepaid forward contract
Investor CounterpartyInvestor may retain some shares
if stock price appreciates
Delivers shares (or cash)
Pros
Downside price protection at floor price
Upside potential up to predetermined cap
Up-front payment can be used to diversify
May defer tax/preserve potential step-up
Maintain some dividends and voting rights
May cash-settle transaction if wish to retain shares
Cons
Appreciation limited to cap price
Can be costly
Tax-straddle rules may apply
Dividend may not qualify for 15% tax rate
Counterparty credit risk

The Enviable Dilemma—Concentrated Stock: Hold, Sell, or Hedge?26
Notes on Wealth Forecasting System (continued)Prepaid Variable Forward Sale vs. Stock Performance
Assumptions
Stock Price
Shares
Position Value
Floor Price
Cap Price
Up-Front Payment
Time to Expiration
$100
100,000
$10 Mil.
$100
$120
$85.80
3 yrs
Po
siti
on
Val
ue
($M
il.)
*Assumes no reinvestment return for up-front payment. The PVF would be positively or negatively affected if the up-front payment were reinvested, as is often the case. Tax-straddle rules may have a significant negative impact on after-tax results.
Stock
PVF Payoff DiagramPre-Tax*
Stock Price at Expiration ($)
PVF
0
5
10
15
20
200180160140120100806040200
StockValue of Position
Up-Front Payment
Shares Retained
Value Retained Pre-Tax Value From PVF
Shares Delivered
Value Delivered
$80 $ 8,000,000 $8,580,000 0 $ 0 $ 8,580,000 100,000 $ 8,000,000
$100 10,000,000 8,580,000 0 0 8,580,000 100,000 10,000,000
$110 11,000,000 8,580,000 9,091 1,000,000 9,580,000 90,909 10,000,000
$120 12,000,000 8,580,000 16,667 2,000,000 10,580,000 83,333 10,000,000
$140 14,000,000 8,580,000 14,286 2,000,000 10,580,000 85,714 12,000,000
If the stock closes at or below the floor, the investor must deliver 100,000 shares (100%).
If the stock closes above the floor, the investor must deliver all shares less the value of any upside up to the cap price.
Source: Bernstein

Bernstein Wealth Management Research 27
Notes on Wealth Forecasting System
In a prepaid variable forward sale, the pricing is composed of the cost of the collar embedded in the transaction and the implied financing of the up-front payment
Assumptions—3-Year PVF
Stock Price
Estimated Volatility
Cap Price
Floor Price
Up-Front Payment
Risk-Free Interest Rate
Dividend Yield
$100
30%
$120
$100
$85.80
2.8%
1.7%
Pricing Components*
Cap @ $120
Floor @ $100
Collar cost per share†
Implied financing
Cost to investor per share
Annual Percentage Cost
$ 14.2)
(17.7)
$ (3.5)
(10.7)
$(14.2)
4.5%
*This example employs a Black-Scholes option-pricing model for a call written and a put purchased against a common underlying security. A detailed explanation of the model’s sensitivity to the inputs is available upon request.†For illustrative purposes only, we assume the entire dealer markup is embedded in the cost of financing, with none embedded in the collar. Source: Bernstein
Prepaid Variable Forward Pricing
“Cashless” does not mean costless; the call sold is typically worth more than the put purchased, but this spread is retained by the dealer as his profit
Assumptions
Stock Price
Estimated Volatility
Call Strike Price
Put Strike Price
Risk-Free Interest Rate
Dividend Yield
$100
30%
$120
$85
2.8%
1.7%
Implied Pricing*
Call @ $120
Put @ $85
Spread retained by dealer
Annual Percentage Cost
$ 14.2
(10.5)
$ 3.7
1.2%
*This example employs a Black-Scholes option-pricing model for a call written and a put purchased against a common underlying security. A detailed explanation of the model’s sensitivity to the inputs is available upon request. Source: Bernstein
—3-Year Collar
“Cashless” Collar Pricing
The Enviable Dilemma—Concentrated Stock: Hold, Sell, or Hedge?28
Sell Stock and Reinvest Buy Put Sell Call
Cashless Collar
Prepaid Variable Forward Exchange Fund
Charitable Remainder Trust
Exposure to single stock
Eliminated Downside reduced to put strike; full upside retained
Full downside exposure maintained (net of premium income); upside eliminated above call strike
Downside reduced to put strike; upside eliminated above call strike
Downside reduced to lower limit; upside eliminated above upper limit
Eliminated (assuming portfolio is diversified and holding-period requirements are met)
Eliminated (assuming stock is sold)
Tax on embedded capital gain
Paid Deferred Deferred Deferred Deferred Deferred Eliminated in CRT (deferred on payout)
Cost of transaction Brokerage commission
Put premium Implicit in call premium
Implicit in put/call premiums; additional cost to borrow
Implicit in embedded put/call premiums and discounted up-front payment
Management fees, loads, early-withdrawal penalties
Administrative fees and brokerage commissions
Diversifi cation By reinvesting proceeds
If borrow against position to invest
If borrow against position to invest
If borrow against position to invest
Yes, via discounted up-front payment
Yes—but portfolio may not be fully diversified
By selling the CRT stock and reinvesting
Liquidity Yes If borrow against position
If borrow against position
If borrow against position
Yes Limited Limited to distributions from trust
Income-producing Yes No Yes No No Generally very limited
To donor for term of trust
Other factors to consider*
Time horizon vs. tax cost
Tax-straddle rules, potential cash-flow complications, regulatory limits on borrowing
Tax-straddle rules, potential cash-flow complications, regulatory limits on borrowing
Tax-straddle rules, potential cash-flow complications, regulatory limits on borrowing
Tax-straddle rules, potential cash-flow complications
20% “Qualifying (usually illiquid) Assets” generally purchased with debt; negative selection bias
10% minimum charitable remainder interest; charitable intent may be necessary
Summary Given long-term horizon, generally the best strategy
Provides protection, but very costly
No downside protection; provides income
Beneficial if cannot sell or anticipating step-up; significant costs and potential complications
Beneficial if cannot sell or anticipating step-up; significant costs and potential complications
Expensive, given passive management; illiquid
Good long-term strategy, particularly for someone with charitable intent
*Insiders and affi liates will have additional issues to consider, including any regulatory limitations on sales and hedging transactions.
Summary of Alternatives
Bernstein Wealth Management Research 29
Glossary of Trading Restrictions and Regulations*
Investors who are insiders, affiliates, and/or restricted holders of a stock have additional issues to bear in mind when evaluating a diversification or hedging strategy. Such investors should consult with their personal legal and tax advisors as well as corporate counsel before executing any strategy discussed in this publication. Below is a list of key terms and regulations that often must be considered.
Affiliate—A person who directly or indirectly controls, or is controlled by, or is under common control with, the issuing company. “Control” means the power to direct the management and policies of the company through ownership of voting securities, by contract, or otherwise. Generally, officers, directors, 10% shareholders, and their immediate family members are considered to be affiliates.
Blackout—A period when companies prohibit employees and affiliates from liquidating shares or participating in other share transactions. Blackout periods often coincide with quarter-end, year-end, and earnings reporting schedules.
Constructive Sale—A transaction regarded by the IRS as a sale. Section 1259 of the Internal Revenue Code, which was added by the Taxpayer Relief Act of 1997, discusses constructive-sale treatment of appreciated positions. The Section eliminated the long-term tax-deferral benefits of short sales, referring specifically to certain transactions, including a “short-against-the-box” and forward contracts that deliver a “substantially fixed” amount of property for a “substantially fixed” price. Revenue Ruling 2003-7 provided some clarification of the IRS’s position on Prepaid Variable Forwards. In summary, the IRS stated that a “shareholder has neither sold stock currently nor caused a constructive sale of stock if shareholder receives a fixed amount of cash, simultaneously enters into an agreement to deliver on a future date a number of shares of common stock that varies significantly depending on the value of the shares on the delivery date, pledges the maximum number of shares for which delivery could be required under the agreement, retains an unrestricted right to substitute cash or other shares for the pledged shares and is not economically compelled to deliver the pledged shares.”
Control Securities—Registered or unregistered securities owned by an affiliate of the issuing company (see “Affiliate,” above).
Forms 3, 4, and 5—Disclosure forms authorized in Section 16(a) of the Securities Exchange Act of 1934; the SEC mandates filing of these forms for the primary purpose of disclosing the transactions and holdings of reporting persons: i.e., directors, officers, and beneficial owners of registered companies.
Form 3—An initial statement of holdings that must be filed within 10 days after the person becomes a reporting person.
*This Glossary is provided for informational purposes only. These regulations are subject to change. Bernstein does not offer legal or tax advice.

The Enviable Dilemma—Concentrated Stock: Hold, Sell, or Hedge?30
Form 4—A statement that reports subsequent changes in ownership, and must be filed before the end of the second business day following the day on which a transaction resulting in a change in beneficial ownership has been executed.
Form 5—A statement that reports changes in ownership and total beneficial ownership as of the end of the issuer’s fiscal year by insiders and persons ceasing to be insiders during the fiscal year. It must be filed on or before the 45th day after the end of the issuer’s fiscal year.
Form 144—A statement that must be filed with the SEC as notice of the proposed sale of restricted securities or control securities under Rule 144. The form is valid for 90 days.
Insider—Generally an officer, director, or principal stockholder of a publicly owned corporation, or member of his/her immediate family (see “Affiliate,” above). Term may also apply to persons who obtain non-public information about a company.
Legend—Most restricted stock bears a legend restricting manner of sale. The securities may not be sold until the legend is removed from the certificate. Only a transfer agent can remove a restrictive legend. The transfer agent usually requires a letter from issuer’s counsel.
Lock-Up Agreement—A contractual agreement between a company and the underwriter of its shares that prohibits or limits the number of shares that may be sold or hedged by some or all of the existing shareholders over a designated period of time.
Restricted Securities—Unregistered securities acquired directly or indirectly from an issuer, or from an affiliate of the issuer, in a transaction not involving a public offering. Certificates of restricted securities are typically stamped with a restrictive legend indicating that the securities have not been registered under the Securities Act of 1933.
Rule 10b5-1—A “safe harbor” permitting insiders to trade stock under certain circumstances. The ability of an affiliate of a publicly traded corporation to freely liquidate shares may be limited from time to time by company-imposed “blackout” periods (see above). Additionally, even if the affiliate abides by the company’s rules for trades by insiders, he may be unable to trade in the issuer’s securities. This is because he may be aware of material non-public information (“inside information”). Under Rule 10b5-1 adopted by the Securities and Exchange Commission, a corporate insider may assert affirmative defenses from insider trading liability if he demonstrates that before becoming aware of inside information, he: (1) entered into a binding
Glossary of Trading Restrictions and Regulations (continued)

Bernstein Wealth Management Research 31
Glossary of Trading Restrictions and Regulations (continued)
contract to purchase, sell, or hedge the security; (2) instructed another person to purchase, sell, or hedge the security for the insider’s account; or (3) adopted a written plan for trading securities. The availability of “affirmative defenses” requires that any formula-based trading strategy to purchase, sell, or hedge securities (“Plan”) be entered into in “good faith” and not as part of a strategy or scheme to evade the laws proscribing insider trading. Creating a purchase, sale, or hedging plan utilizing 10b5-1 will allow affiliates to establish a financial strategy designed to fit with their long-term goals. Trades of securities under a Plan would still have to be executed in compliance with the requirements of U.S. securities law and/or other legal and contractual restrictions.
A 10b5-1 Plan must be authorized during a time when the issuer’s rules would permit insiders to purchase, sell, or hedge securities issued by the issuer (“window period”). The Plan must specify the terms (i.e., amount, date, etc.) of the proposed transaction(s) and must describe in detail any formula, mechanism, or trading program to be followed. At the time the Plan is authorized, the insider must not possess inside information. The Plan must not permit the insider to exercise any subsequent influence over how, when, or whether to effect purchases, sales, or hedges, and any person who was authorized by the Plan to exercise such influence must not have done so on the basis of inside information.
Rule 144—An SEC rule that permits the public resale of restricted securities or control securities if the following conditions are met:
Holding Period—Restricted (unregistered) stock must be held for one year (calculated from the date of full payment) before it may be sold subject to Rule 144. There is no required holding period for control stock.
Current Public Information—Adequate current public information must be available on the company. Generally, the company must have been subject to SEC reporting requirements for at least 90 days and filed all required reports during the 12 months preceding the sale.
Volume Limitations—During any three-month period, the amount of stock that can be sold under Rule 144 cannot exceed the greater of 1% of shares outstanding, or the average weekly reported trading volume during the four calendar weeks preceding the filing of notice of the proposed sale. Restricted securities held by non-affiliates are subject to volume limitations if owned for a period between one and two years. Resale of shares held by non-affiliates for more than two years is no longer subject to volume limitations. Shares sold by control persons are always subject to volume limitations.
Manner of Sale—The securities must be sold in brokers’ transactions. Neither the seller nor the broker can solicit orders to buy the securities. The broker can receive no more than usual and customary commission.

The Enviable Dilemma—Concentrated Stock: Hold, Sell, or Hedge?32
Filing Notice with the SEC—If proposing to sell more than 500 shares or $10,000 worth of securities under Rule 144 during any three-month period, seller must file Form 144 at the time of or prior to placing the order. Form is valid for 90 days.
Rule 144(k)—Applies to restricted securities held by non-affiliates of the company who have not been affiliates (see above) for at least 90 days and have held the shares for at least two years. Shares may be sold without satisfying the current public information, volume limitation, manner of sale, and notice requirements of Rule 144. Restrictive legend must still be removed prior to sale.
Rule 145—Governs the sale of securities received in business combinations such as mergers, reclassifications, consolidations, or asset transfers. In some instances, holders of securities received in such registered transactions must sell the stock subject to certain requirements of Rule 144. Persons who do become affiliates of the acquiring company must sell subject to Rule 144, except that the one-year holding period would not apply to securities acquired in the Rule 145 transaction. Affiliates of the acquired company who do not become affiliates of the acquiring company must comply with the requirements of Rule 144, except for the one-year holding period and notice of filing. After one year but less than two years after the 145 transaction, these shares can be sold free of restrictions if the company has filed its SEC public reporting requirements in a timely fashion. Two years after the transaction, such stock can be sold without restriction.
Section 16(b)—A section of the Securities Exchange Act of 1934 that permits the issuing company to recover “short-swing profits” from an officer, director, or 10% shareholder. A short-swing profit occurs when, within a period of less than six months, there is either a purchase and sale of a security at a higher price, or a sale and purchase at a lower price. For the purposes of this Section, hedging contracts such as put purchases, call sales, zero cost collars, and prepaid variable forwards would be considered the equivalent of “sell” transactions in the underlying securities. Unwinding or cash-settling these contracts may be considered the equivalent of “buy” transactions. Establishing hedging contracts greater than six months in duration and physically settling such contracts through delivery of the underlying securities may help to mitigate the risk of creating a short-swing profit.
Section 16(c)—A section of the Securities Exchange Act of 1934 that prohibits an insider from selling short any equity security of the issuer for more than a 20-day period; however, certain equity derivatives are permitted as hedges to long positions.
Seller’s Representation Letter—Verifies that the seller has fulfilled all requirements of Rule 144; must be signed by the seller and returned to the selling broker prior to selling securities under Rule 144 or Rule 145. ■
Glossary of Trading Restrictions and Regulations (continued)

Bernstein Wealth Management Research 33
Notes on Wealth Forecasting System
1. Purpose and Description of Wealth Forecasting AnalysisBernstein’s Wealth Forecasting Analysis is designed to assist investors in making their long-term investment decisions as to their allocation of investments among categories of financial assets. Our planning tool consists of a four-step process: (1) Client-Profile Input: the client’s asset allocation, income, expenses, cash withdrawals, tax rate, risk-tolerance level, goals, and other factors; (2) Client Scenarios: in effect, questions the client would like our guidance on, which may touch on issues such as when to retire, what his cash-flow stream is likely to be, whether his portfolio can beat inflation long-term, and how different asset allocations might impact his long-term security; (3) The Capital-Markets Engine: a model that uses our proprietary research and historical data to create a vast range of market returns, which takes into account the linkages within and among the capital markets (not Bernstein portfolios), as well as their unpredictability; and finally (4) A Probability Distribution of Outcomes: Based on the assets invested pursuant to the stated asset allocation, 90% of the estimated ranges of returns and asset values the client could expect to experience are represented within the range established by the 5th and 95th percentiles on “box-and-whiskers” graphs. However, outcomes outside this range are expected to occur 10% of the time; thus, the range does not establish the boundaries for all outcomes. Expected market returns on bonds are derived taking into account yield and other criteria. An important assumption is that stocks will, over time, outperform long bonds by a reasonable amount, although this is in no way a certainty. Moreover, actual future results may not meet Bernstein’s estimates of the range of market returns, as these results are subject to a variety of economic, market, and other variables. Accordingly, the analysis should not be construed as a promise of actual future results, the actual range of future results, or the actual probability that these results will be realized.
2. RebalancingAnother important planning assumption is how the asset allocation varies over time. We attempt to model how the portfolio would actually be managed. Cash flows and cash generated from portfolio turnover are used to maintain the selected asset allocation among cash, bonds, stocks, and REITs over the period of the analysis. Where this is not sufficient, an optimization program is run to trade off the mismatch between the actual allocation and targets against the cost of trading to rebalance. In general, the portfolio will be maintained reasonably close to the target allocation. In addition, in later years, there may be contention between the allocation of the total relationship and the allocations of the separate portfolios. For example, suppose an investor (in the top marginal federal tax bracket) begins with an asset mix consisting entirely of municipal bonds in his personal portfolio and entirely of stocks in his retirement
portfolio. If personal assets are spent, the mix between stocks and bonds will be pulled away from targets. We put primary weight on maintaining the overall allocation near target, which may result in an allocation to taxable bonds in the retirement portfolio as the personal assets decrease in value relative to the retirement portfolio’s value. Positions in a single stock are not rebalanced.
3. Expenses and Spending Plans (Withdrawals)All results are generally shown after applicable taxes and after anticipated withdrawals and/or additions, unless otherwise noted. Liquidations may result in realized gains or losses, which will have capital-gains-tax implications.
4. Modeled Asset ClassesThe following assets or indexes were used in this analysis to represent the various model classes:
Asset Class Modeled as...
Annual Turnover
Rate
Intermediate-Term Diversified Municipals
AA-Rated In-State Municipal Bonds of 7-Year Maturity
30%
U.S. Value S&P/BARRA Value Index 15
U.S. Growth S&P/BARRA Growth Index 15
Developed International MSCI EAFE Unhedged 15
Emerging Markets MSCI Emerging Markets Free Index (Renamed Emerging Markets Index 1/29/04)
20
Single Stock (Low Vol.)
Volatility: 20%; Dividend: 3.0%; Beta: 1.0
0
Single Stock (Avg. Vol.)
Volatility: 30%; Dividend: 1.7%; Beta: 1.0
0
Single Stock (High Vol.)
Volatility: 50%; Dividend: 0.0%; Beta: 1.0
0
5. VolatilityVolatility is a measure of dispersion of expected returns around the average. The greater the volatility, the more likely it is that returns in any one period will be substantially above or below the expected result. The volatility for each asset class used in this analysis is listed in Note #9 on the next page. In general, two-thirds of the returns will be within one standard deviation. For example, assuming that stocks are expected to return 8.0% on a compounded basis and the volatility of returns on stocks is 17.0%, in any one year it is likely that two-thirds of the projected returns will be between (8.9)% and 28.0%. With intermediate government bonds, if the expected compound return

The Enviable Dilemma—Concentrated Stock: Hold, Sell, or Hedge?34
Notes on Wealth Forecasting System (continued)
* The federal income-tax rate represents Bernstein’s estimate of either your maximum marginal tax bracket or an “average” rate calculated based upon the marginal rate schedule. The federal capital-gains tax rate is represented by the lesser of your maximum marginal income-tax bracket or the current cap on capital gains for an individual or corporation, as applicable. Federal tax rates are blended with applicable state tax rates by including, among other things, federal deductions for state income and capital-gains taxes. The state tax rate generally represents Bernstein’s estimate of the maximum unified rate, if applicable.
is assumed to be 5.0% and the volatility is assumed to be 6.0%, two-thirds of the outcomes will typically be between (1.1)% and 11.5%. These ranges are slightly skewed relative to what you might expect because the volatility calculation assumes the returns are log-normally distributed. Bernstein’s forecast of volatility is based on historical data and incorporates Bernstein’s judgment. It should also be noted that volatility varies in different time periods, particularly for inflation and fixed-income assets.
6. Technical AssumptionsBernstein’s Wealth Forecasting Analysis is based on a number of technical assumptions regarding the future behavior of financial markets. Bernstein’s Capital Markets Engine is the module responsible for creating simulations of returns in the capital markets. These simulations are based on inputs that summarize the condition of the capital markets as of October 15, 2003. Therefore, the first 12-month period of simulated returns represents the period from October 15, 2003 through October 14, 2004, and not necessarily the calendar year of 2003. A description of these technical assumptions is available on request.
7. Tax ImplicationsBefore making any asset-allocation decisions, an investor should review with the investor’s tax advisor the tax liabilities generated by the different investment alternatives presented herein, including any capital gains that would be incurred as a result of liquidating all or part of the investor’s portfolio, investments in municipal or taxable bonds, etc.
8. Tax Rates*Bernstein’s Wealth Forecasting Analysis has used the following marginal tax rates for this analysis:
Start Year 2003 2009 2011
End Year 2008 2010 2042
Federal Income-Tax Rate 35.00% 35.00% 39.60%
Federal Capital-Gains Tax Rate 15.00% 20.00% 20.00%
Qualified Dividend Rate 15.00% 35.00% 39.60%
State Income-Tax Rate 6.00% 6.00% 6.00%
State Capital-Gains Tax Rate 6.00% 6.00% 6.00%
9. Assumptions—Capital-Market Statistics
AnnualizedCompound
Return
AverageAnnualReturn
AverageAnnualIncome
1-YearVolatility
30-YearAnnualizedEquivalentVolatility
Int.-Term Diversified Municipals
3.5% 3.7% 3.5% 3.8% 3.9%
U.S. Value Stocks
8.2 10.0 2.7 17.9 13.9
U.S. Growth Stocks
8.2 10.3 1.5 19.4 16.3
Developed International Stocks
8.7 11.5 2.7 21.4 14.9
Emerging- Markets Stocks
7.7 12.0 1.9 27.2 22.7
Single Stock (Low Volatility)
6.7 10.2 2.5 22.8 22.8
Single Stock (Avg. Volatility)
5.3 10.2 2.2 30.8 28.1
Single Stock (High Volatility)
1.8 10.1 2.1 46.9 39.4
Inflation 2.4 2.4 N/A 1.3 6.2

BERNSTEIN WAS ESTABLISHED IN 1967 to manage investments for private families and individuals. Its mission grew to include sell-side research and institutional asset management, but advising private clients has remained a central focus throughout our successful history. At year-end 2003, as a unit of Alliance Capital Management L.P., Bernstein Investment Research and Management oversaw more than $50 billion in private capital for a clientele including some of the nation’s most prominent families and individuals.
One of the chief ways Bernstein serves its clients is through the firm’s Wealth Management Group—an ensemble of experienced professionals that melds our money-management experience with in-depth knowledge of trust and estate planning, tax management, and other areas of importance to wealthier individuals and families. At its core is an ever-advancing state-of-the-art wealth-forecasting tool designed to help clients make better-informed decisions on the issues that concern them most—including retirement planning, complex asset-allocation strategies, annual budgeting, single-stock strategies, multi-generational investment planning, and philanthropic giving. The Wealth Management Group works closely with clients, their Bernstein Advisors and, when appropriate, their legal and tax advisors to develop sophisticated investment strategies tailored to each client’s unique situation.

SINGSTCKBK0204© March 2004, Alliance Capital Management L.P. All rights reserved.
www.bernstein.com
New York 212-486-5800
Boston Scheduled to open in 2004
Chicago 312-696-7800
Dallas 214-860-5200
Houston 832-366-2000
Los Angeles 310-286-6000
Miami 305-530-6200
Minneapolis 612-758-5000
San Francisco 415-217-8000
Seattle 206-342-1300
Tampa Scheduled to open in 2004
Washington, DC 202-261-6700
West Palm Beach 561-820-2100