
The enigma of us productivity slowdown a theoretical analysis
13
Journal of Economics and Sustainable Development www.iiste.org ISSN 2222-1700 (Paper) ISSN 2222-2855 (Online) Vol.5, No.13, 2014 116 The Enigma of US Productivity Slowdown: A TheoreticalAnalysis Prof.Dr.AbdulGhafoorAwan Dean Faculty of Management and Social Sciences, Institute of Southern Punjab-Pakistan Prof.Dr.RanaEjaz Ali Khan Chairman, Department of Economics, Islamia University of Bahawalpur,Pakistan Abstract Introduction:The economy of the United States is the number one economy of the world on the basis of its GDP size.Many economies of the world depend upon the working upon it. However, US economy has been facing the phenomena of labour productivity slowdown since 1973. The productivity grow was witnessed during 1990s decade due to revolution of information technology but it was proved transitory. To investigate this phenomena the economists have been actively working and using different theoretical and empirical approaches. But it is still an enigma and its real cause has so far not been detected. Objective of the study: The objective of this research study is to investigate why US economy has been facing productivity growth slowdown since long, what are its causes and what is its possible solution? Methodology:The author has used qualitative research approach in which real economy sector and technology economy sector have been studied on the basis of secondary data collected from OECD, IMF, World Bank,etc. The individual share of these sectors in the US GDP has been determined to analyze their effects on productivity growth. The author has also compared goods and services sectors and their contribution into the US GDP. Findings:The results of study shows that no breakthrough or major innovation has been occurred in major sector of US economy. Information technology is a small sector and growth in this sector during 1990s has not brought any significant impact on US economy. The evidence shows that quality of patents is falling despite increasing number of researchers during the period of 1990-2010 and it reflects diminishing return on R&D investment in technology sector. The ratio of input/output is 40/100 which is totally against the concept of constant return to scale. Key words: Productivity, Patent, R&D, Technological progress,output 1. Introduction- Importance of Growth Gordon (2012) says that by economic growth we usually mean the growth rate of real GDP per person (or per capita). The achievement of rapid growth is one of the most important distinguishing features of a successful economy. The fact that U.S. economy grew more rapidly than those of the industrialized nations of Europe during the century between 1850 and 1950 allowed Americans to enjoy a higher standard of living than most residents of Europe throughout the postwar era. How economic growth affects standard of living one can understand this phenomenon by looking the economic history. In 1870, average real GDP per person in the United Kingdom, was 37 percent higher than in the United States. But in 2010 average real GDP per person in the United States was 32 percent higher than in the United Kingdom. How was this possible? Faster economic growth, meaning a higher average annual growth rate of natural real GDP per person, allowed the United States first to catch up to the United Kingdom in 1906, and then from 1916 to 1950 to move ahead of the United Kingdom. Although the United Kingdom kept pace with the United States after 1950, but it was never able to close the gap. This was a race between the tortoise and the hare, in which the tortoise never caught up. The gap between the average real GDP per person in two countries makes an enormous difference in their relative standard of living. 2. Growth differences between US and EU The comparisons are made in a way that holds constant the prices of goods and services in the two countries. US economic growth between 1870 and 2010 : 1.81 percent per year for the United States as compared to 1.40 percent for the United Kingdom. Minor differences in economic growth rates sustained over a long period build up into substantial differences in relative living standards. The table 1 shows comparison of the level and growth rate of per capita GDP of G-7 countries during the last 120 years.
-
Upload
alexander-decker -
Category
Business
-
view
31 -
download
2
Transcript of The enigma of us productivity slowdown a theoretical analysis

Journal of Economics and Sustainable Development www.iiste.org
ISSN 2222-1700 (Paper) ISSN 2222-2855 (Online)
Vol.5, No.13, 2014
116
The Enigma of US Productivity Slowdown: A TheoreticalAnalysis
Prof.Dr.AbdulGhafoorAwan
Dean Faculty of Management and Social Sciences, Institute of Southern Punjab-Pakistan
Prof.Dr.RanaEjaz Ali Khan
Chairman, Department of Economics, Islamia University of Bahawalpur,Pakistan
Abstract
Introduction:The economy of the United States is the number one economy of the world on the basis of its GDP
size.Many economies of the world depend upon the working upon it. However, US economy has been facing the
phenomena of labour productivity slowdown since 1973. The productivity grow was witnessed during 1990s
decade due to revolution of information technology but it was proved transitory. To investigate this phenomena
the economists have been actively working and using different theoretical and empirical approaches. But it is
still an enigma and its real cause has so far not been detected.
Objective of the study: The objective of this research study is to investigate why US economy has been facing
productivity growth slowdown since long, what are its causes and what is its possible solution?
Methodology:The author has used qualitative research approach in which real economy sector and technology
economy sector have been studied on the basis of secondary data collected from OECD, IMF, World Bank,etc.
The individual share of these sectors in the US GDP has been determined to analyze their effects on productivity
growth. The author has also compared goods and services sectors and their contribution into the US GDP.
Findings:The results of study shows that no breakthrough or major innovation has been occurred in major sector
of US economy. Information technology is a small sector and growth in this sector during 1990s has not brought
any significant impact on US economy. The evidence shows that quality of patents is falling despite increasing
number of researchers during the period of 1990-2010 and it reflects diminishing return on R&D investment in
technology sector. The ratio of input/output is 40/100 which is totally against the concept of constant return to
scale.
Key words: Productivity, Patent, R&D, Technological progress,output
1. Introduction- Importance of Growth
Gordon (2012) says that by economic growth we usually mean the growth rate of real GDP per person (or per
capita). The achievement of rapid growth is one of the most important distinguishing features of a successful
economy. The fact that U.S. economy grew more rapidly than those of the industrialized nations of Europe
during the century between 1850 and 1950 allowed Americans to enjoy a higher standard of living than most
residents of Europe throughout the postwar era. How economic growth affects standard of living one can
understand this phenomenon by looking the economic history. In 1870, average real GDP per person in the
United Kingdom, was 37 percent higher than in the United States. But in 2010 average real GDP per person in
the United States was 32 percent higher than in the United Kingdom. How was this possible? Faster economic
growth, meaning a higher average annual growth rate of natural real GDP per person, allowed the United States
first to catch up to the United Kingdom in 1906, and then from 1916 to 1950 to move ahead of the United
Kingdom. Although the United Kingdom kept pace with the United States after 1950, but it was never able to
close the gap. This was a race between the tortoise and the hare, in which the tortoise never caught up. The gap
between the average real GDP per person in two countries makes an enormous difference in their relative
standard of living.
2. Growth differences between US and EU
The comparisons are made in a way that holds constant the prices of goods and services in the two countries. US
economic growth between 1870 and 2010 : 1.81 percent per year for the United States as compared to 1.40
percent for the United Kingdom. Minor differences in economic growth rates sustained over a long period build
up into substantial differences in relative living standards. The table 1 shows comparison of the level and growth
rate of per capita GDP of G-7 countries during the last 120 years.

Journal of Economics and Sustainable Development www.iiste.org
ISSN 2222-1700 (Paper) ISSN 2222-2855 (Online)
Vol.5, No.13, 2014
117
Table 1 Growth Rate of Per Capita Real GDP in 2010 Dollars for G-7 (1870-2010)
Level in 2010
U.S.dollars Average annual growth rate in percent
1870 2010
1870-
2010
1
1870
-
1913
1913
-
1955
1955-
1973
1973-
2010
United
States 3,714 47,133 1.81 1.8 1.72 2.37 1.67
Canada 2,598 39,844 1.95 2.24 1.56 2.91 1.59
U.K 5,038 35,660 1.4 1.01 1.14 2.36 1.68
Japan 1,133 34,176 2.43 1.47 1.69 7.87 1.75 France 2,926 33,770 1.75 1.44 1.36 4.04 1.43 Germany 2,905 34,226 1.76 1.59 1.1 4.03 1.61 Italy 2,412 30,108 1.8 1.25 1.41 4.57 1.55 __________________________________________________________________________________________
Source: Robert J. Gordon (2012) Macroeconomics (12th Edition), Pearson Education Inc.
New Jersey, U.S.A.
This Table shows not only the process of economic growth that rises the standard of living decade after decade,
but two types of short-term movements. The first of these is wartime destruction which is clearly visible in the
sharp drop in the living standard of Germany and Japan from 1940-1950. Making up for wartime destruction
explains much of the rapid economic growth in these two countries in 1950s and 1960s. The second type of
short-term economic change is the business cycle. The data for each country are annual, so that alternation of
business recessions and expansions is visible, most notably during depression years of the 1930s. It also displays
the unique nature of the Great Depression in the United States and Canada, where per person real GDP declined
much more than in other countries. The Table also highlights the slow growth of G-7 economies after 1973.
Although different factors such as saving and investment, technological change, level of education, human
capital, etc, yet growth would grind to a halt without a continuing stream of new invention, and maintaining the
flow of inventions and new ideas requires incentives to inventors to make the large, up-front investment needed
to create new computer chips, smart phones, software, medical technology, drugs and other novel products.
3. Differences between Economic and Productivity Growth
Economic growth refers to an improvement in the standard of living, defined as output per capita or member of
the population. Labour productivity is defined as output per hour of work (Y/H). The growth rate of the standard
of living is y-n (output minus population growth rate), while the growth rate of labour productivity is y-h (output
minus hours).The difference between the rate of standard of living and that of labour productivity is
y-n-(y-h) = h-n
When hours grow faster than population (h>n) , the standard of living grows faster than labour productivity. As
shown in the above Table European countries still lag well behind the United States in their output per capita,
but several of the leading European nations have almost caught up the United States in their level of labour
productivity or output per hour.
4. Productivity Slowdown: Europe versus United States
The reason that productivity in Europe has grown faster than the standard of living is clear from the above
equation-hours of work in Europe have grown more slowly than the population. Over two decades before 2007,
Europeans choose to take longer vacations than are typical in the United States, their average unemployment rate
rose, and their labour-force participation rate declined. Europeans retire at earlier ages than Americans. These
events prevent the European standard of living from catching up to the United States even as the productivity
gap has vanished for some European nations. For Western Europe as a whole, by 1995 productivity had reached
91 percent of the United States but since then has dropped back to about 78 percent in 2010.
Gordon (2012) argues that there are two reasons: The first centered on differences between and service industries
in Europe and the United States, and the second related to the very different responses of European labour
markets to the Global Economic crisis after 2007. The new research has identified the service sector in Europe as
Journal of Economics and Sustainable Development www.iiste.org
ISSN 2222-1700 (Paper) ISSN 2222-2855 (Online)
Vol.5, No.13, 2014
118
the source of Europe’s ongoing failure to catch up to the level of U.S. productivity. The European problem
centers on wholesale and retail trade, where the United States has achieved big productivity gains as large new
stores (called big boxes) have been constructed in suburbs and at freeway interchanges by Wal-Mart, Target,
Home Depot, Best Buys, and other nationwide retailers. The European retailing industry has not participated in
the “Big Boxes” productivity boom because of differing European institutions. European zoning or land use
regulations are much more restrictive than in the United States. European firms responded very differently to
manage the falling productivity. In place of the mass layoffs in the United States, which cut labour input relative
to output and raised productivity, in Europe mass layoffs were avoided, particularly in Germany, the largest
European country. To create an incentive for forms to retain workers, the government encouraged firms to
reduce hours of workers, say from 40 to hours per week. Yet the worker’s salary was not cut in half but was
largely maintained, thanks to government subsidies to this “work-sharing” set of policies. By avoiding mass
layoffs, Germany and some other European countries have avoided much of human tragedy of long term
unemployment that has afflicted the United States, but at the cost of stagnant productivity.
5. Why U.S. Productivity slow down?
What are the causes of US productivity slowdown? To illustrate this phenomenon, it is pertinent to note that
both technology and productivity are the same. Mostly productivity originate from technology development in
the long run. But in the short-run efficiency also affect productivity. During 1970s and 1980s the productivity
growth slowdown was not due to the falling of technological progress but it was due to slackness in efficiency. It
were external shocks that disturb the developed economies. For example, abrupt increase in oil prices in 1973
and 1979 brought instability in about all advanced economies. Two sectors such as energy and transportation
were the main victims of these oil shocks and production of auto and power sectors were sharply dropped
(Nordhaus 2004). Besides affecting these two sectors specifically, oil shocks caused two major recessions during
1974 and 1981 during which the capital stock was lying idle significantly. Unemployment and inflation were
increased. Thus, the increase in technological progress was offset by slowdown in productivity growth. But
1990s decade was better from productivity point of view because during this period the productivity level was
improved due to vital technological changes in information technology and telecommunications. A new
economy based on information technology was emerged. But the information technology sector was very small
as compared to manufacturing sector and therefore no major breakthrough was noted in the economies of
advanced countries. It did not affect the productivity growth substantially as was observed in industrial sector
due to technological advancement.
6. Difference of Technological Progress Mostly the economists build their model on the basis of technological progress by treating “technology” was a
single major factor causing productivity growth. But when we analyze the impact of technological development
on different sector we find different result because technological development in various sectors is different. A
major technological breakthrough have been witnessed in telecommunication and electronic sectors. In these
sectors, many new industries were developed and these industries captured world markets. But no major
innovations was seen in traditional service professions such as academia. Even today, teachers use the same
methods of teaching which their grandfathers used a century back. Similarly, barbers use the same tools which
they used some time in past. This is the reasons that the remunerations in these two professions are still high. In
contrast, prices of goods of those sectors where technological progress have been occurred, were fell
substantially. For example, the sharp reduction in the cost of electricity has brought a large change in the
economies because it has been used by all major sectors and brought a positive impact on output. It must be
remembered that if technological progress is taken place in big sectors of the economy it bring visible change in
economic growth. But if it were occurred in small sector it will not affect the overall economy and no visible
change will be taken place. Thus, the difference of technological advancement is measures in its impact on total
economy not on a single sector. We highlight this fact through two examples.
EXAMPLE 1: BREAD AND CHEESE.
Suppose bread and cheese are being produced in an economy and these two goods are perfect complements and
their consumption is in a fixed ratio because both are eaten jointly. When one buy cheese he will also buy bread
so the production of these goods will always be equal. Also suppose that these two industries faced various rate
of technological development. Technology improves in bread industry, increasing the output of bread sector by 4
per cent per year while the output of cheese sector remained the same due to lack of technological progress. It
means that the production of bread will increase 4 percent per year while the production of cheese will remain
unchanged. Practically, this was not taken place because it would cause more production of bread than cheese.
The capital and labour will move from bread industry to cheese industry. The movement of factors of production
from high level productive industry (bread) to slow level productive industry (cheese) and minimize the effects
of technological advancement in bread industry. If we analyze this scenario in the long term we can see that

Journal of Economics and Sustainable Development www.iiste.org
ISSN 2222-1700 (Paper) ISSN 2222-2855 (Online)
Vol.5, No.13, 2014
119
bread production will increase to abnormal level and the resources allocation will be negligible to this sector and
more resources will be deployed in the cheese sector to improve its production to match the production of bread
industry. The shifting the capital and labour from bread industry to cheese industry every year will not increase
total output in the economy and the economic growth will be zero.
So the movement of resources from one small sector to another small sector will not enhance productivity level
of an economy.
EXAMPLE 2: BUTTER AND MARGARINE.
In this example we take two goods that butter and margarine which are perfect substitutes for each other. The
consumer will consume any one which will be cheap. Imagine that rate of technological advancement are
different. Technology improves 2 percent per year in margarine sector but no technological development was
occurred in butter sector. We suppose butter is cheaper than margarine in the beginning and the consumers
prefers to consume only butter. We also suppose that technological innovations were occurred in margarine
industry and the prices of margarine falls drastically. It becomes cheap than butter. So the people will start
buying margarine due to its less prices. Overall economic growth will increase because technological progress
was occurred in relevant sector which was perfect substitute. The outcome of this example is quite different from
first example because in that case the technological growth was stopped while in second example it was
accelerated over time and brought a large effect on the overall economy.
7. Relationship between Technology level andSpeed of Technological Progress
Today technological development has cumulative nature. Sometimes Research and Development brings positive
effects but sometimes its effects are negative. If we deeply study the R&D process we will find that present
researchers have more knowledge and possesses more research tools than their predecessors. We assume that
today researchers will be more productive and efficient than past researchers. But the fact is that present
researchers are facing multi-dimensional problems in generating new ideas, creating new products or developing
new technologies because radical inventions have been made in past. Now the researchers are making
incremental innovations. In other worlds they are improving past inventions. This is the reason that the speed of
technological advancement is substantially slow. The economists call it “Fishing out” effect because all big
fishes have been brought into net. Now hectic efforts are needed for innovations and inventions. As the level and
speed of technological advancement is slow so the productive growth is also slow.
8. TECHNOLOGICAL PROGRESS IN REAL WORLD
8.1 Goods versus services When we carry out comparative analysis of the growth of goods and services we will find that all major
innovations have been in taken place in manufacturing sector. Major resources were allocated to increase the
output of goods to meet their growing demand due to increasing in population growth and market size. We also
find that little innovations have been made in services sector during last 50 years. This is the reason that prices of
goods have been sharply fallen while the remuneration of services have either been remained constant or moved
upward. The difference between a pair of jeans and woman’s haircut was about 13 times in 1927 but it was
reduced to 3 times in 1998 due to fall in the prices of jeans. If we study the consumption pattern of US citizens
we find that total spending on services in 1950 was 40 percent which was increased to 60 percent in 2008. This
shifting of spending from goods to services, where productivity level was slow, have affected the economy
negatively. For example, the cost of education has increased substantially in the United States and Robert
Gordon (2012) has called it “cost disease” which is preventing the students to get higher education.
Manufacturing production in many OECD economies has declined in recent decades so that, on average, services
now account for about 70% of OECD GDP. In fact, in the United States and the United Kingdom, employment
in manufacturing industries is now less than 10% of total employment. As part of this general decline, the scope
and nature of manufacturing has changed so that what was once dominated by skilled trades and vocations,
machine operators, assembly line workers, etc., now relies increasingly on service occupations and service inputs.
This reflects the increasing use of technology in production, international sourcing of more sophisticated
intermediate inputs and a range of social factors (such as the changing skill composition of populations).
Measuring trends in the interdependence of services and manufacturing industries is not easy. However, the
contribution of services activities relating the production of goods has increased largely recently. Data on
occupations show that in the last decade there has been a steady increase in the share of employees in the
manufacturing sector who are employed in occupations that can be considered as services-related, such as
management, business, and finance and legal professionals. In 2008, on average, the share in the OECD area had
reached about 35% although it varied between 18% (Poland)and 52% (United States).
Estimates based on OECD’s “harmonized” input-output tables can reveal the amount of services embodied in
one unit of final demand for manufactured goods. The contribution of services value added needed to satisfy
demand for manufactured products varies between 10 and 30% – again highlighting the symbiotic nature of the
Journal of Economics and Sustainable Development www.iiste.org
ISSN 2222-1700 (Paper) ISSN 2222-2855 (Online)
Vol.5, No.13, 2014
120
two sectors. Between 1995 and 2005, significant increases in total services embodied in manufacturing were
evident in Poland, Turkey and the United States. Such changes over time may reflect a shift in industrial
structures towards manufacturing products that are more service intensive.
We can conclude from the above discussion that economic growth has been stopped. No, because tremendous
efforts are underway to make technological advancement in services sector such as banking and education. If
these efforts are proved fruitful we will witness dramatic change in these two sectors. Banking and education
sectors throughout world are embarked upon to bring vital changes in their operations through induction of
technologies. Internet banking and expansion of distance learning or online teaching are best examples.
8.2 Information Technology and its impact
A second application of our analysis of differential technological progress is the information technology
industries, the most dynamic part of the economy today. Here rapid technological advance has been reflected in
plummeting prices. For example, the prices of computers fell drastically. The price index for computer fell at an
average rate of 15 percent per year between 1981 and 2006. About 20 years back the price of computer was very
high and very few people can afford. But today its prices are normal and now middle income person can easily
purchase it. Similarly, the prices of cell phone were very high 10 years back and only elite class can afford to
purchase it. But now the situation is quite different. Now even lower income people are also having Cell phone
and enjoying its facilities. So we can say that the production of computers and cell phone has increased many
times in number but the amount of their sale might not be increased.
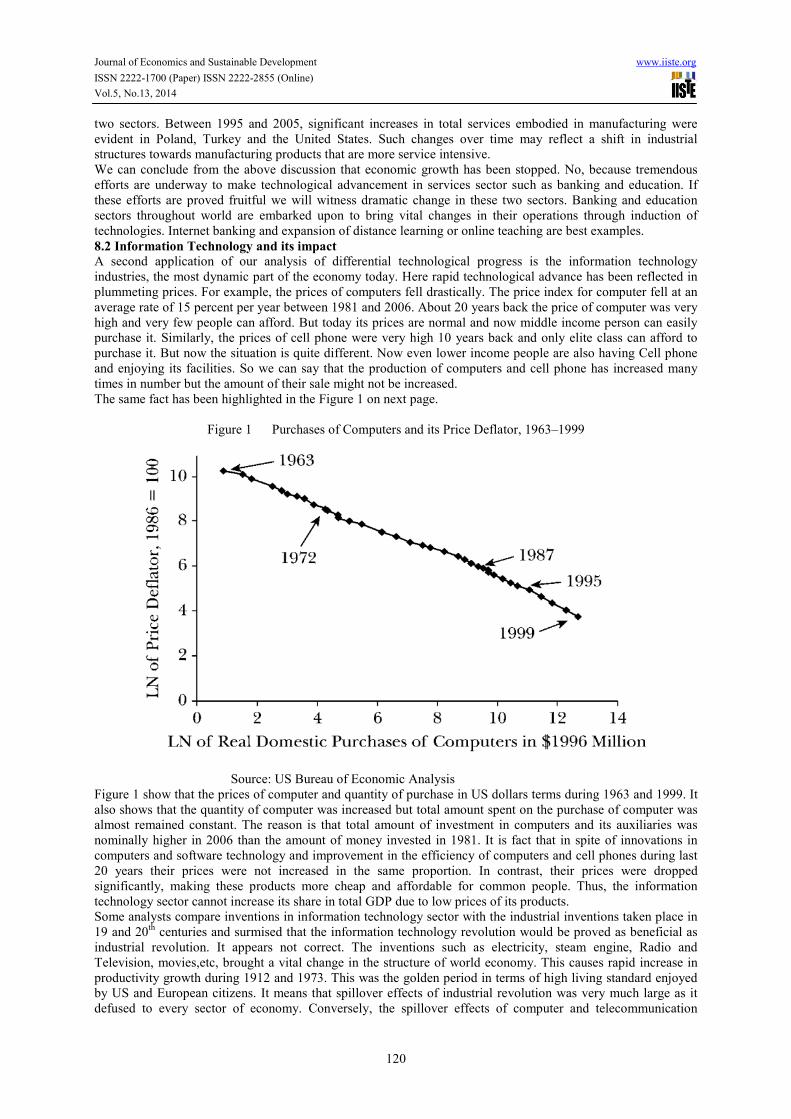
The same fact has been highlighted in the Figure 1 on next page.
Figure 1 Purchases of Computers and its Price Deflator, 1963–1999
Source: US Bureau of Economic Analysis
Figure 1 show that the prices of computer and quantity of purchase in US dollars terms during 1963 and 1999. It
also shows that the quantity of computer was increased but total amount spent on the purchase of computer was
almost remained constant. The reason is that total amount of investment in computers and its auxiliaries was
nominally higher in 2006 than the amount of money invested in 1981. It is fact that in spite of innovations in
computers and software technology and improvement in the efficiency of computers and cell phones during last
20 years their prices were not increased in the same proportion. In contrast, their prices were dropped
significantly, making these products more cheap and affordable for common people. Thus, the information
technology sector cannot increase its share in total GDP due to low prices of its products.
Some analysts compare inventions in information technology sector with the industrial inventions taken place in
19 and 20th
centuries and surmised that the information technology revolution would be proved as beneficial as
industrial revolution. It appears not correct. The inventions such as electricity, steam engine, Radio and
Television, movies,etc, brought a vital change in the structure of world economy. This causes rapid increase in
productivity growth during 1912 and 1973. This was the golden period in terms of high living standard enjoyed
by US and European citizens. It means that spillover effects of industrial revolution was very much large as it
defused to every sector of economy. Conversely, the spillover effects of computer and telecommunication

Journal of Economics and Sustainable Development www.iiste.org
ISSN 2222-1700 (Paper) ISSN 2222-2855 (Online)
Vol.5, No.13, 2014
121
products was only 12 percent and its impact on the rest of 88 percent economy is found absent. According to
Gordon (2012) the revival of productivity growth due to information technology in the United States economy
was transitory because it has again slowdown in 2000s due to absence of innovations in major sectors of the
economy. We may conclude that fast economic growth during 1913-1973 was the result of multi-factor
productivity growth which sustain for a long period of time.
8.2.1 Declining Returns in Computer industry Weil (2011) enumerated differences between computer and earlier inventions occurred during industrial
revolution. The first one is the steep fall in the prices of computer. This decline was occurred despite the fact that
computer efficiency was substantially increased. He argued that major declined was occurred during transition
period that started in 1950s and ended in 1980s. The initial computer which is known as mainframe computer
was very much costly but its transition to personal computer causes decline in prices. If the prices remained at
previous level the majority of the people could not afford it. But intensity in the decline of the prices of computer
was noted between 1987 and 1994 before internet invention. Gordon (1990, p. 239) has estimated the computer
prices were dropped 35 percent per year during 1972 and 1987. He has pleaded that technical advancement in
information technology sector may not be as important as it perceived at initial stage. The speed of technological
progress has exceeded than the demand of computer. This fact has been highlighted in the Figure 10.2, showing
the demand and supply of computer.
In this figure the price of computer has been shown on vertical axis while demand of computer has been
displayed at horizontal axis. When the price was P1 the supply was S1 but when price fell to P2 the supply was
increased to S2. It means that the demand was less increased vis-à-vis price decline because of excessive supply
of computer in the market.The horizontal supply curve shows consumer surplus as suggested by Brynjolfsson
(1996, p. 290), Gordon (1990, p. 46) and Sichel (1997, p. 17). It also shows that computer memory, speed and
fast performance did not affect marginal cost of enhancing the production of computer. The Figure 2 shows that
there is not major shift in demand curve. We can conclude that the pace of technological advancement in
computer technology has negatively affected the demand of computer and its prices.
Figure 2 Supply and demand of computer
Source:Unpublished series provided by Christian Ehemann of the Bureau of Economic Analysis.
Weil (2009) further argues major innovations during information technology revolution was occurred in
computing and telecommunications which were small sector. The impact of these innovations on other sectors of
economy is insignificant. This is the reason that these innovations has not brought a significant effect on total
factor productivity. The data for the period 1987-1999 plotted in the Figure 3 reveals this fact. It shows that IT
sector has only 1.4 percent share in total US GDP during the same period.

Journal of Economics and Sustainable Development www.iiste.org
ISSN 2222-1700 (Paper) ISSN 2222-2855 (Online)
Vol.5, No.13, 2014
122
Figure: 3 Share of information technology in total GDP
The Figure 3 shows that the nominal share of ITC sector was almost remained the same during 1987-1999 with
minor fluctuations. While price index was fell about 25 percent per year for straight 17 years in 2001, showing
drastic decline the marginal productivity of computer capital.
8.3 Slowing process of innovations Patents are assumed to be the output of R&D and it plays very significant role in incremental innovations and
economic growth. During 1992 and 2003, the number of patent application filed in Europe, Japan and the United
States were increased by more than 40 percent. Business firms and public sector research organizations use
patents to protect their inventions. It has accelerated the process of innovations in different sectors of economy.
A new wave of inventions in scientific and technological breakthroughs were taken place particularly in
Information and telecommunication and biotechnology fields. These innovations were not the result of
individual efforts of human being but it were taken place due to increasing interaction among the firms operating
in different regions of globe. As the business of firms were increasingly globalized they need legal protection
and patenting for the safety of their investment in Research and Development. Efforts were made to the legal
framework and patent laws standardize and operative. Software and biotechnology products were included in
patenting regimes. These measures increases exponential growth in the number of patents. More than 850,000
applications were filed in the United States, Japan and Europe in 2002 as compared to 650,000 filed in 1993.
These figures shows the growth in the research and development activities of business firms all over the world.
But this speed of the developed of innovations was badly affected by 2008 financial crisis. The business
activities were slowdown all over the world and it badly affected their R&D activities and pace of patent
generation. The data given in Table 10.2 show the number of patents applications filed in 2001-2010 period in
the United States, European Union,Canada and Japan. We are very much surprised that the number of patent
applications was halved from 38036 in 2004 to 18925 in 2010 in the United States. Similarly, the number of
patent applications were reduced from 61288 to 41266 in 2009 in the European Union while in Japan their
number were decreased from 23616 in 2006 to 15063 in 2010. Likewise, In Canada the number of patent
applications were dropped from 2893 in 2006 to 1942 in 2010. The decreasing number of patents all over the
world indicates the slowing the process of innovations(See the Table 2).
Table 2 Number of Patents applications filed during 2001-2010
Countries 2001 2002 2003 2004 2005 2006 2007 2008 2009 2010
U.S.A 33777 35311 36036 38036 39504 36947 33958 32030 31441 18925
European 53806 53883 55422 58147 61288 61405 58988 58998 41266 -
Union
Japan 21559 22546 23616 22436 22006 23616 21451 19334 19767 15063
Canada 1970 2214 2346 2681 2893 2887 2756 2587 2687 1942
Source: OECD, August, 2013
Some economists like Weil (2009) doubted the perfectibility of the patents as measure of technological

Journal of Economics and Sustainable Development www.iiste.org
ISSN 2222-1700 (Paper) ISSN 2222-2855 (Online)
Vol.5, No.13, 2014
123
advancements. Industries are different in how likely inventions are to be patented as compared to being protected
by other means. For example, a survey of the managers of R&D labs found that pharmaceutical industry is the
most important where patenting is made to protect the copying of medicines. This is the reason that Switzerland
is the country where patent protection is largely practiced by pharmaceutical firms.
8.4 Falling Quality of Patents
Another surprising fact revealed by OECD (2011) data is that the quality of patents has dropped during 1990-
2010. It has become practice that the firm apply for patenting of even minor improvement in its product or
services which large number but low quality. It has slower pace of real inventions that is needed by the advanced
economies to maintain the momentum of their economic growth. The Scoreboard of Science, Industry and
Technology, 2011 showed that the quality of patents has decreased on average 22 percent during 1990-2010.
This pattern was seen almost in all countries where patenting is going on. The OECD has conducted this survey
to asses which country is doing good job in the creation of innovation. The survey reveals that the United
Kingdom was best in semiconductor and environmental technology, South Korea is best in ICT technology and
Germany was best solar energy. The patents produced in the United States, Germany and Japan were high
quality because the business firms of the countries focus on radical innovations to create incremental innovations.
The share of these countries was 70 percent in top ranking of patents in 1995 which, now, has declined to 55
percent in 2010. In contrast, the share of Scandinavian countries, South Korea, India and China are rapidly
increasing since 2005. Now China ranks 8th
number in the globe.
8.5 Growing Number of Researchers The United States, with nearly USD 400 billion of intramural R&D expenditures in 2008, performs the most
research and development (R&D). It is followed by China with nearly one third of that value (in current
purchasing power parity terms), just ahead of Japan. The combined European Union accounts for nearly three
quarters of the US R&D total. The emerging economies share in world’s Research and Development, counted in
terms of total number of researchers and budgetary allocations is increased (See Table 3). The major portion of
Research and Development outlays is spent on the salaries and allowances of the researchers because their
strength is large and it needs huge funds for their personal activity. This illustrates the close relationship between
number of researchers and R&D expenditures as a percentage of GDP as a percentage of total employment.
Finland exhibits the highest research intensity on both measures. Variations can be related to differences in the
price of R&D inputs, such as researcher costs, the pattern of R&D specialization and the requirements in terms
of capital expenditure, and the possibility that some countries may be developing their research infrastructure for
future use. The number of researchers in different countries have been shown in the Table 3. It shows the growth
of researchers will be rapid only in two countries such as the United States and China.
Table: 3 Number of researchers in different countries during 1990-2010
Full time R&D Researchers
1990 1995 2000 2005 2010
CANADA 65730 87380 107967 136768 148483
FRANCE 123439 151248 172070 202506 234201
GERMANY 241869 281128 257874 272148 327500
ITALY 77876 75536 66110 82488 15846
JAPAN 582815 673421 647572 680631 655530
USA 981659 1035995 1293582 1375304 1412638
CHINA 471400 522000 695062 1118698 1152311
UK 127000 145673 170554 248593 235372
RUSSIA 610357 506420 464577 442071
TURKEY 11225 15854 23083 39138 64340
Data Source: OECD Economic Outlook,2012
R&D (research and development) expenditure is an investment aimed at new knowledge, products or processes.
Funding may come from government or business. Government-funded R&D aims mainly at producing new
fundamental knowledge or satisfying social needs such as health or defence and is not expected to affect
productivity as currently measured. Business-funded R&D is typically oriented towards new processes and new
products and is expected to increase productivity when successful. It is normally mildly pro-cyclical, i.e.it is
affected by the business cycle, as it is subject to financing constraints (the availability of cash limits R&D
expenditures, as high risk and little collateral make financial markets reluctant to fund R&D). The most recent
data show that trademark activity has been strongly affected by the economic crisis, with a marked drop in
finance- and insurance-related trademarks at the US Patent and Trademark Office (USPTO) from mid-2007.
Goods and other services trademark activity turned down with the cycle and then up with the cycle at the
beginning of 2009.

Journal of Economics and Sustainable Development www.iiste.org
ISSN 2222-1700 (Paper) ISSN 2222-2855 (Online)
Vol.5, No.13, 2014
124
9. Falling Productivity growth
The dramatic reduction in the growth of productivity in the United States started in the 1970s. During the period
of 1890-191 the productivity growth on average was 1.72 percent per year which was surprisingly decreased
0.86 percent per annum in 1972-1995. The productivity slowdown which prevails among all developing
economy is enigma, which has so far not been solved by the economies in spite of their hectic research efforts.
Many economists have view that fast technological progress made to develop living standard has almost stopped.
Similarly, the fall in productivity growth has added the negative impact on the living standard. During 2008
financial crisis, productivity was become negative. However, it was improved in 2010 but again it was dropped
in 2011. Figure 4 shows the wide fluctuations in the US productivity growth during 2008 and 2012 period.
Figure: 4 US Labour productivity during 2008-2012
10. Four phases of U.S. Productivity Growth
Gordon (2012 P:409) maintains that the rapid advance in the U.S. standard of living in the first half of the 20th
century was fueled by growth in labour productivity that averaged slightly below 2 percent per year. This period
of half century was 1900-1950. Next decade, e.g.1960s productivity was better and it reached around 2.7 percent.
The period of slow productivity growth between 1.3 and 1.6 percent was between 1976 and 1995.Then
productivity growth trend exhibited a strong revival, reaching 2.4 percent in 2002 before slipping back to 1.8
percent in 2006-2010. The four era of productivity growth as "fast," "slow," "fast" and "uncertain."
11. Sources of Productivity Growth Slowdown
Gordon (2012) has mentioned some causes of US productivity growth slowdown which are stated as under :-
♦ Demographic change.
The 1970s and 1980s witnessed large increase in the population of teenagers and of the share of females who had
jobs instead of staying home. The influx of these relatively inexperienced workers reduced the average
efficiency of the workforce. Furthermore, because their wages were less, labour become cheap relative to
physical capital. Growth in capital stock slowed, growth in the labour force, and the result was much slower
growth in the ratio of capital to labour (K/N).
♦ High Energy consumption and rising cost
Higher energy prices induced firms to use less energy, and this reduced the productivity of the other factors of
production, capital and labour. More recent research by William Nordhause (2004) of Yale University identifies
particular energy-dependent industries that bore the brunt of the slowdown in productivity growth, including oil
and gas extraction, motor vehicles, electricity generation, pipelines and air transportation.
♦ WeakInfrastructure.
Infrastructure is assumed to be an important source of growth. Rich nations differ from poor nations by spending
more on education, sewers, highways, airports and other types of infrastructure investment. Of particular
importance was the timing of the construction of interstate highway system between 1958 and 1972, overall a
period of high productivity growth. Once the basic interstate system was completed in the early 1970s, there

Journal of Economics and Sustainable Development www.iiste.org
ISSN 2222-1700 (Paper) ISSN 2222-2855 (Online)
Vol.5, No.13, 2014
125
were no longer further benefits equivalent to the one-time-only improvement in productivity that came from
substantial increase in the speeds at which truck drivers could travel.
♦ Productivity of more output with fewer employees.
The productivity growth revival was witnessed during 1999 and 2004 was due to two factors: one was the
production and use of computers on massive scale by different sectors of economy and other was the collapse of
the stock market and of profits in 200-2002 led business firms to cut costs more vigorously than in previous
postwar recession. Layoff were severe, and employment continued to decline in 2002-03 even after output had
started to recover. With output growth and jobs shrinking, productivity (output per hour) soared. Third factor
was hypothesis centers on intangible capital, types of investment that are not included in the government's
definition of computer and software investment. While the use of the Web was introduced in the late 1990s,
computers did not become truly effective until old business practices were changed and employees were
retrained to use the computers in new ways. In short, benefits of the invention of internet spilled over from the
late 1990s into 2001-04 periods even though the government's measure of computer investment declined sharply.
♦ Pessimism about future productivity growth.
Over the years 2005-07, economists become pessimistic about future productivity growth. They suggested that
the post-1995 revival had come to an end and was by its nature a "one-time-only" event rather than the start of
decade after decade of rapid productivity growth. One argument was that the mid-1990s marriage of the personal
computer and communication, resulting in the internet and the World Wide Web, clearly stimulated productivity
in the late 1990s but could only be invented once. A second argument is that, while invention continues with the
iPod, iPhone, iPad, and others, these are mainly beneficial to consumers and have relatively small impact on
business productivity. A third argument is that the apparent causes of productivity boom in 2001-04 were
inherently temporary. The crash in the stock markets and profits caused extreme cost cuts and job layoffs that
temporarily boosted productivity growth, but once hiring resumed productivity growth declined sharply.
Similarly, the intangible capital hypothesis holds that the benefits of the 1990s computer investment boom were
delayed, but only for so long.
♦Uncertain future growth productivity
As late 2010, the future growth of productivity is highly uncertain. Optimists point to the sharp upturn in the
productivity in 2008-09 but pessimists view the parallel with 2001-04. The economic crisis of 2008-09,
including collapse of profits and stock market, echoed what happened eight years earlier. Because firms cut costs
so drastically, they overreacted in laying off workers more than was justified by the decline in output, and
measured productivity growth bounced up. But 2010-11 productivity growth had slowed sharply after the 2009
spurt, just as it did in 2005-07 after the 2001-04 upsurge.
♦ Slowing Real income per capita
Gordon (2012) predicts that over a longer period of 10 or 20 years, growth in real per capita is likely to be slower
than over the 20 previous years 1987-2007 for two main reasons. First, the impending retirement of the baby
boom generation (who were born in 1947-63) will reduce the number of workers relative to the number of retired
people. Since hours of work per person (including the entire population aged from 16 to above 100 in age) will
fall, this means by definition that income per person will grow more slowly than productivity. The second
underlying cause of slower future growth, not just in that standard of living but in productivity itself, is the end
of a century-long increase of an increase in the educational attainment of Americans. Steadily as elementary
education spread in the late nineteenth century, as high school education became universal between 1910 and
1940, and then as millions went to college after world war second, the average number of years of education of
the American population reached steadily higher. But this progress stopped around 1990. The average number of
school years completed by Americans stopped increasing. Yet other nations that had long remained behind
caught up and surged ahead.
♦ Slow Growth of Human Capital
Why are other nations catching up and surging ahead of the United States? There are two basic answers:. The
first is that American higher education has a "cost disease" almost as pernicious as that of medical care. Many
elite universities enroll the same number of students as 30 years ago but a much higher real cost, that is, nominal
cost adjusted for economy-wide inflation. Among the components of higher cost are faculty salaries, no-teaching
leaves give to faculty as part of faculty recruiting, extra buildings despite the same number of students, and costs
of maintaining those building. The second reason is the problem that students and their parents have in financing
the higher cost of college education. Federal aid for scholarships is less generous than previously, and budget
problems of state governments have caused rapid increase in tuition at state universities that previously charged
only modest tuition. In short, many young Americans are not going to college because they and their parents
cannot afford it, and they do not want to burden themselves with six-digit student loans.
Gordon (2012) further argues that education is an input into the production function that makes each worker
more productive. The slowdown in the growth of human capital in the United States since 1990 is one of several
reasons to be pessimistic about future growth in the standard of living, even if the pace of innovation remains as

Journal of Economics and Sustainable Development www.iiste.org
ISSN 2222-1700 (Paper) ISSN 2222-2855 (Online)
Vol.5, No.13, 2014
126
rapid as it was over the past two decades. Thus, the retirement of baby-boomers and rising cost of higher
education are the barrier to the creation of human capital. He proposed that partial solution to falling ratio of the
population of working age relative to the population of retired people who are not working is encourage
immigration of young people, particularly those with high skills. The rising relative cost of higher education
calls for policies to retrain the cost of disease, which is difficult to achieve since many of the universities with
rapidly rising costs are private institutions with their own large endowments.
12. Findings & Conclusions.
We have analyzed US economic slowdown puzzle by studying technological progress function. The main inputs
of this function are the labour and human capital of researchers along with capital (laboratories, computers, etc).
According to Weil (2009) the number of R&D scientists increased by a factor of 10 during 1950-1999 but the
growth rate of technology has not increased in the same ratio. Our study shows there are two problems with
technology production function. (i) Negative effect of the level of technology on the growth rate of technology
(the fishing out effect); (ii) Decreasing return to scale.We find that if we use 100% inputs in technology
production function, we will get only 40% of output because of the above two reasons: fishing out and
decreasing return to scale. The cause of low growth rate of technology is that although the numbers of R&D
scientists are increasing, yet they are not making radical inventions that bring revolution in the economy of
world. They are making only incremental innovation, just adding something to previous vital inventions made
during 19th
and 20th centuries. Similarly, the standard of patents has also dramatically dropped about 20%
between 1990s and 2000s (OECD Report, Sept, 2011). Moreover, all innovations made during last two decades
are restricted to specific sector, information technology, which does not constitute a very large fraction of the
economy and spillover effects of technology industries is only 12 percent and its effects on the rest of 88 percent
economy is absent. This is the reason that in spite of fast growth in technology sector the economic growth is
very slow in the United States. This country is a knowledge base economy and its economic growth depends on
new ideas, new products and new inventions in major sectors of the economy. Whenever the US economy stops
inventions its growth is slowed down despite the fact that the number of researchers and incremental innovations
have increased as compared to basic and radical innovations.
References
Brynjolfsson, E., and L.M. Hitt. (1995). "Information Technology as a Factor of Production: The Role of
Differences among Firms." Economics of Innovation and New Technology. Special issue on information
technology and productivity paradox. 3(4): 183–200.
Bureau of Labour Statistics (2012) “US Labour Productivity Report,2012”.
Gordon,Robert.J (1999) "The Aftermath of the 1992 ERM Breakup: Was There a Macroeconomic Free
Lunch?," NBER Working Papers6964, National Bureau of Economic Research, Inc.
Gordon.Rover J (2000) “Does the New Economy Measure up to the Great invention of the past?” Journal of
Economic Oerspectives,Vol.14,pp.49-74.
Gordon,Robber J (2012) “Macroeconomics”, New Delhi: PHL Learning Private Ltd.
Griliches,Zvi (19947 “The Productivity Slowdown: Is a growing unmeasurable sector the culprits” Review of
Economics and Statistics, V.79, Issue 3 pp 371,August, 1997.
Magdoff,Harry& Paul M.Sweezy (1977) “The End of Prosperity: The American Economy in the 1970s”, New
York, Monthly Review Press, U.S.A.
Nordhaus,William D. (2204) “Schumpeterian Profits in the American Economy: Theory and Measurement.”,
NBER Working Paper No. 10433,Issued in April 2004.
OECD Report (2011) “Education at a Glance 2011: OECD Indicators”
OECD Report,(2012). “OECD Guidelines for Multinational Enterprises”, Annual Report, 2012.
OECD Report (2012) “Economic Outlook”, September,2012.
OECD Report (2013) “Composite Leading Indicators (CLIs”, OECD, August 2013.The Sichel,Daniel E.
(1997)“Computer Revolution : An Economic Perspective” Brookings Institution Press.
Weil,David N (2011) “Macroeconomics:, Pearson Education Inc, Addison-Wesley, U.S.A.
Wolf,E.N. (1991). “Capital Formation and Productivity Convergence over the Long-Term”, American Economic
Review, Vol 81, pp 565-579.

The IISTE is a pioneer in the Open-Access hosting service and academic event
management. The aim of the firm is Accelerating Global Knowledge Sharing.
More information about the firm can be found on the homepage:
http://www.iiste.org
CALL FOR JOURNAL PAPERS
There are more than 30 peer-reviewed academic journals hosted under the hosting
platform.
Prospective authors of journals can find the submission instruction on the
following page: http://www.iiste.org/journals/ All the journals articles are available
online to the readers all over the world without financial, legal, or technical barriers
other than those inseparable from gaining access to the internet itself. Paper version
of the journals is also available upon request of readers and authors.
MORE RESOURCES
Book publication information: http://www.iiste.org/book/
IISTE Knowledge Sharing Partners
EBSCO, Index Copernicus, Ulrich's Periodicals Directory, JournalTOCS, PKP Open
Archives Harvester, Bielefeld Academic Search Engine, Elektronische
Zeitschriftenbibliothek EZB, Open J-Gate, OCLC WorldCat, Universe Digtial
Library , NewJour, Google Scholar

Business, Economics, Finance and Management Journals PAPER SUBMISSION EMAIL European Journal of Business and Management [email protected]
Research Journal of Finance and Accounting [email protected] Journal of Economics and Sustainable Development [email protected] Information and Knowledge Management [email protected] Journal of Developing Country Studies [email protected] Industrial Engineering Letters [email protected]
Physical Sciences, Mathematics and Chemistry Journals PAPER SUBMISSION EMAIL Journal of Natural Sciences Research [email protected] Journal of Chemistry and Materials Research [email protected] Journal of Mathematical Theory and Modeling [email protected] Advances in Physics Theories and Applications [email protected] Chemical and Process Engineering Research [email protected]
Engineering, Technology and Systems Journals PAPER SUBMISSION EMAIL Computer Engineering and Intelligent Systems [email protected] Innovative Systems Design and Engineering [email protected] Journal of Energy Technologies and Policy [email protected] Information and Knowledge Management [email protected] Journal of Control Theory and Informatics [email protected] Journal of Information Engineering and Applications [email protected] Industrial Engineering Letters [email protected] Journal of Network and Complex Systems [email protected]
Environment, Civil, Materials Sciences Journals PAPER SUBMISSION EMAIL Journal of Environment and Earth Science [email protected] Journal of Civil and Environmental Research [email protected] Journal of Natural Sciences Research [email protected]
Life Science, Food and Medical Sciences PAPER SUBMISSION EMAIL Advances in Life Science and Technology [email protected] Journal of Natural Sciences Research [email protected] Journal of Biology, Agriculture and Healthcare [email protected] Journal of Food Science and Quality Management [email protected] Journal of Chemistry and Materials Research [email protected]
Education, and other Social Sciences PAPER SUBMISSION EMAIL Journal of Education and Practice [email protected] Journal of Law, Policy and Globalization [email protected] Journal of New Media and Mass Communication [email protected] Journal of Energy Technologies and Policy [email protected]
Historical Research Letter [email protected] Public Policy and Administration Research [email protected] International Affairs and Global Strategy [email protected]
Research on Humanities and Social Sciences [email protected] Journal of Developing Country Studies [email protected] Journal of Arts and Design Studies [email protected]