The Enforcement of Labor Law in the Developing World: Some ... · The Enforcement of Labor Law in...
29
1 The Enforcement of Labor Law in the Developing World: Some Stylized Facts from Labor Inspections Rita K. Almeida World Bank and IZA Lucas Ronconi Centro de Investigación y Acción Social May 2012 This paper empirically explores the incidence of labor inspections across firms in 72 developing countries. Given the relatively little knowledge on the behavior of labor inspection agencies, our objective is to present a collection of stylized facts on the incidence of enforcement. Our findings consistently show that larger firms are more likely to be inspected than smaller firms. Interestingly, inspections are less likely to occur among firms with a larger share of low-skilled workers, and that operate in industries with more tax evasion. Furthermore, we do not find evidence that the firm’s market power is correlated with inspections. We explore the heterogeneity of these findings across income and geographic groups, and conclude by briefly discussing the consistency of the stylized facts with competing theories of inspection agencies behavior. Overall, the evidence suggests that inspection agencies in the developing world usually have low levels of efficiency and effectiveness. Keywords: Enforcement, Labor Inspections, Regulations, Firm Level Data. JEL Classification codes: H00; H26; J20; J30; K31; O17; O41 Acknowledgment: This project would not have been possible without the financial support of a World Bank Research Support Grant granted to Rita Almeida. The findings expressed in this paper are those of the authors and do not necessarily represent the views of the World Bank.
Transcript of The Enforcement of Labor Law in the Developing World: Some ... · The Enforcement of Labor Law in...
1
The Enforcement of Labor Law in the Developing World: Some Stylized Facts from
Labor Inspections
Rita K. Almeida
World Bank and IZA
Lucas Ronconi
Centro de Investigación y Acción Social
May 2012
This paper empirically explores the incidence of labor inspections across firms in 72
developing countries. Given the relatively little knowledge on the behavior of labor
inspection agencies, our objective is to present a collection of stylized facts on the
incidence of enforcement. Our findings consistently show that larger firms are more
likely to be inspected than smaller firms. Interestingly, inspections are less likely to occur
among firms with a larger share of low-skilled workers, and that operate in industries
with more tax evasion. Furthermore, we do not find evidence that the firm’s market
power is correlated with inspections. We explore the heterogeneity of these findings
across income and geographic groups, and conclude by briefly discussing the consistency
of the stylized facts with competing theories of inspection agencies behavior. Overall, the
evidence suggests that inspection agencies in the developing world usually have low
levels of efficiency and effectiveness.
Keywords: Enforcement, Labor Inspections, Regulations, Firm Level Data.
JEL Classification codes: H00; H26; J20; J30; K31; O17; O41
Acknowledgment: This project would not have been possible without the financial support of a World Bank Research Support Grant granted to Rita Almeida. The findings expressed in this paper are those of the authors and do not necessarily represent the views of the World Bank.
2
1. Introduction
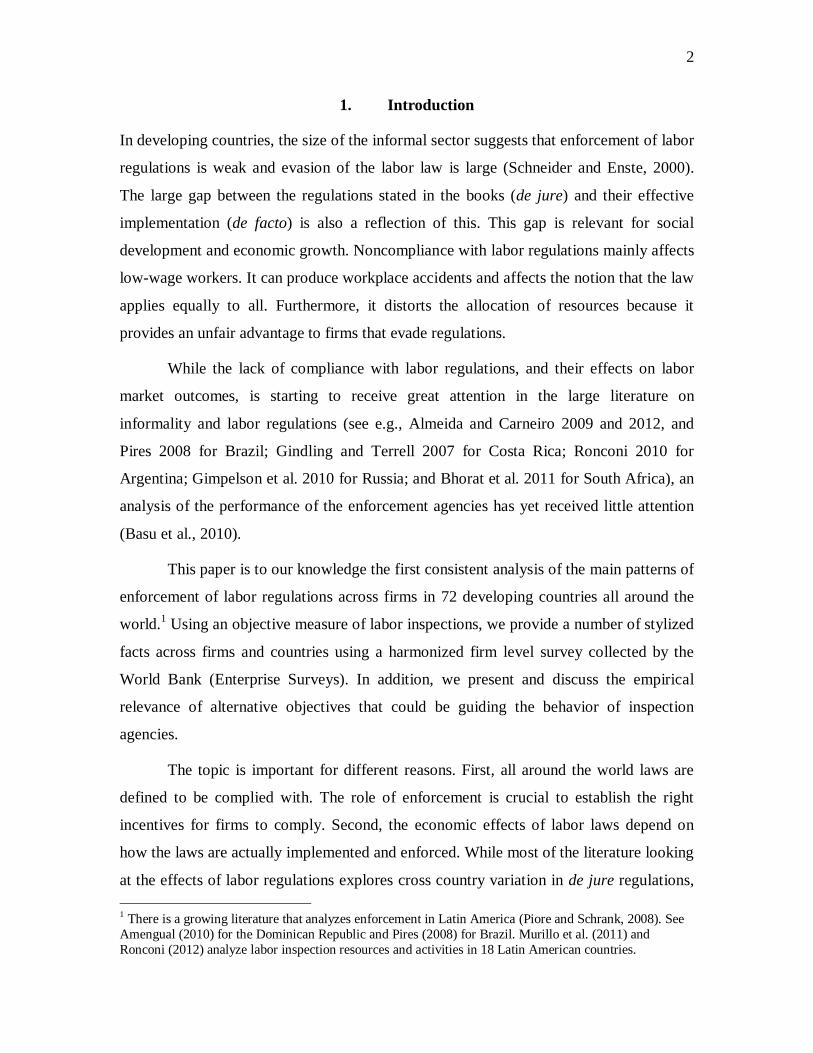
In developing countries, the size of the informal sector suggests that enforcement of labor
regulations is weak and evasion of the labor law is large (Schneider and Enste, 2000).
The large gap between the regulations stated in the books (de jure) and their effective
implementation (de facto) is also a reflection of this. This gap is relevant for social
development and economic growth. Noncompliance with labor regulations mainly affects
low-wage workers. It can produce workplace accidents and affects the notion that the law
applies equally to all. Furthermore, it distorts the allocation of resources because it
provides an unfair advantage to firms that evade regulations.
While the lack of compliance with labor regulations, and their effects on labor
market outcomes, is starting to receive great attention in the large literature on
informality and labor regulations (see e.g., Almeida and Carneiro 2009 and 2012, and
Pires 2008 for Brazil; Gindling and Terrell 2007 for Costa Rica; Ronconi 2010 for
Argentina; Gimpelson et al. 2010 for Russia; and Bhorat et al. 2011 for South Africa), an
analysis of the performance of the enforcement agencies has yet received little attention
(Basu et al., 2010).
This paper is to our knowledge the first consistent analysis of the main patterns of
enforcement of labor regulations across firms in 72 developing countries all around the
world.1 Using an objective measure of labor inspections, we provide a number of stylized
facts across firms and countries using a harmonized firm level survey collected by the
World Bank (Enterprise Surveys). In addition, we present and discuss the empirical
relevance of alternative objectives that could be guiding the behavior of inspection
agencies.
The topic is important for different reasons. First, all around the world laws are
defined to be complied with. The role of enforcement is crucial to establish the right
incentives for firms to comply. Second, the economic effects of labor laws depend on
how the laws are actually implemented and enforced. While most of the literature looking
at the effects of labor regulations explores cross country variation in de jure regulations, 1 There is a growing literature that analyzes enforcement in Latin America (Piore and Schrank, 2008). See Amengual (2010) for the Dominican Republic and Pires (2008) for Brazil. Murillo et al. (2011) and Ronconi (2012) analyze labor inspection resources and activities in 18 Latin American countries.
3
more recent work has emphasized the importance of enforcement (e.g., Boeri and Jimeno
2005; Caballero et al. 2004; Albrecht et al. 2009, Ronconi 2010; and Almeida and
Carneiro 2009 and 2012). Third, labor market regulations – and thus their enforcement -
focus on features of jobs that are usually desirable to workers. Forth, in many countries
labor regulations are criticized for being restrictive and their enforcement may create
constraints to economic activity. Some firms may be more affected than others so a better
understanding of this incidence within countries is important for efficiency. Fifth, there is
theoretical debate over the objectives of labor inspection agencies but little empirical
knowledge on their actual behavior.
One shortcoming of our data that unfortunately we cannot address is that we only
observe a sample of registered firms. Our sample does not include unregistered firms and
therefore leaves out the majority of the firms in many countries. This is probably a minor
issue for our main topic of interest since most of the labor inspections are de facto
focused on registered firms.
Our empirical strategy is very simple. We explore variation in the incidence of
labor inspections across firms within countries, and also analyze differences in the level
of enforcement across countries. The data we use is particularly useful for several
reasons. First, the data is harmonized and comparable across countries. Second, the
survey informs whether the firm was inspected by the labor agency during the previous
year. This is an objective and comparable indicator of enforcement of labor law that is
usually not available in other studies.2 Third, the survey collects detailed information on a
large set of firm’s characteristics including, among others, location, size, sector of
activity, skills of the workforce, degree of unionization, market power, and participation
in a business association. This information allows determining the characteristics of
inspected firms, and hence, permits analyzing the objectives of inspections agencies. Do
2 Actually, in most of the cross country work, the indicators of enforcement of labor laws tend to be subjective. For example, Caballero et al. (2004) use perceptions-based measures of “government effectiveness” and an indicator of the “rule of law”, which are only crude proxies for the labor law enforcement. In addition, Botero et al. (2004) simply assume that labor laws are more likely to be enforced in countries with a more educated workforce without providing further justification for this. Almeida and Susanli, forthcoming, and Almeida and Aterido (2011) use Enterprise Survey data but investigate the link between de facto labor regulations and firm size, and between de facto labor regulations and the investment of firms in job training.
4
agencies mainly worry about reducing labor violations? Or are they mainly concern about
collecting revenues? Do agencies care about the potential job destruction that
enforcement could produce? Are they captured by lobby groups?
Our paper shows that, in almost all countries, larger firms are more likely to be
inspected than smaller firms. Given that larger firms are more likely to comply with labor
regulations, it appears that reducing noncompliance is not the main objective of
inspection agencies. Furthermore, we do not observe more inspections among firms with
a larger share of low-skilled workers (i.e., where violations are arguably more likely). In
addition, we also find that firms that operate in sectors of activity with less compliance
are less likely to be inspected.
The paper proceeds as follows. Section 2 proposes a simple model of enforcement
of labor regulations and discusses implications for the distribution of labor inspections
across firms. Section 3 describes the data and provides descriptive statistics for the main
variables used in the empirical analysis. Section 4 proposes a simple empirical approach
and presents the main findings. Section 5 explores heterogeneity across regions and
income levels. Section 6 concludes by briefly discussing the consistency of the stylized
facts with competing theories of inspection agencies behavior.
2. Models of Enforcement of Labor Regulations
We are interested in understanding the behavior of labor inspection agencies in the
developing countries. To our knowledge there is yet little formal modeling of
enforcement agency’s behavior. Key ingredients of any model of public enforcement of
the law include the objective function of the enforcement agency and the information
available to the agency when identifying firms to inspect and accomplish its objectives.
In this section we briefly review alternative models.
2.1 The Agency Objective Function
There are alternative theories about the behavior of public enforcement agencies. First,
the economic theory of public enforcement of the law is based on the assumption that
public enforcers act so as to maximize social welfare (Polinsky and Shavell, 2000). A
5
second approach, more dominant in public administration, tends to explain enforcement
agencies’ behavior in terms of idiosyncratic aspects of inspectors and the nature of the
task (Bardach and Kagan, 1982). Third, is the capture theory, which emphasizes the
importance of elected officials and lobby groups in determining agency structure, tasks
and budgets (Calvert et al., 1989).
In this paper we present a fourth approach that assumes that the objective of the
agency is to maximize the net monetary benefits with the inspection activity. We present
a very simple and static model where the agency maximizes the net difference between
the agency’s revenues and costs of labor inspections.3 The cost variables are the wages of
inspectors (w) and transportation cost from the inspection agency to the firm (d). The
monetary benefits of conducting inspections are fines collected and tax compliance per
violation (t). We assume the government has an estimate of the probability that a firm
violates a labor and social security regulation (θ) and an estimate of whether the firm
would react to enforcement via compliance (δ) or via job destruction. We also assume
that firms are more likely to react to enforcement via job destruction when fines and taxes
are higher (i.e., dδ/dt < 0). Therefore, the net monetary benefit (B) of inspecting firm i is:
Bi = θi * δ(t)i * t * Si – wi – di, where S is the number of employees.
This extremely simple model suggests that a firm is more likely to be inspected
when it is located near the agency, when it takes less of the inspector’s time to conduct
the inspection, when the firm has more employees, when the firm is more likely to be a
non-complier and when the firm is more likely to react to inspection via formalization.
The effect of taxes and fines is ambiguous because they have a positive direct effect on
revenues but also a negative indirect effect since they reduce the probability that a firm
would react to enforcement via formalization.
It is worth noting that, if the objective of the agency is to maximize revenues, then
the costs factors would not matter. If the objective is mainly legalistic (i.e., minimize
violations), then the agency would ignore the variable δ. That is, the agency would not
3 Assuming a static model makes more sense when the inspection agency has a very short term horizon. We think that this is a reasonable assumption because in developing countries the inspection agency is usually not in the hands of an independent civil service but controlled by the executive power (see Ronconi 2012 for Latin America).
6
care about enforcing regulations in firms that would become bankrupt if forced to comply
with the law. Finally, according to capture theory the quantity and distribution of
inspections depends on the interests and power of lobby groups. For example, firms that
are members of a business association would be less likely to be inspected if the group is
powerful. Similarly, unionized firms would be more likely to be inspected if unions are
powerful.4
2.2 The Agency Information Set
A key issue is that the inspection agency usually neither knows which firms are
complying nor which firms would react to enforcement via formalization. Agencies can
obtain information about violations by providing a toll-free number to make complaints.
However, this information is usually not conclusive, because some workers simply ignore
their rights. Furthermore, the information obtained via complaints does not tell much to
determine whether enforcement would produce formalization or job destruction.
Therefore, it is reasonable to assume that the agency uses observable characteristics of
the firm as proxies for θ and δ. But, which characteristics of the firm the agency actually
observes?
It is likely that the agency knows the main line of business of each firm in the
economy and that the agency has an estimate of the rate of noncompliance across sectors
of activity (E). The agency might also know whether the firm intensively uses low skilled
labor (L) and that violations are more prevalent among these workers. That is, we expect
that θ is a positive function of both E and L.
As proxies for δ, the agency would like to have information about the market
power (P) of firms. That is, the agency would like to know if the firm can translate the
increase in labor costs produced by inspections into higher prices. Because a direct
measure of firm’s market power is usually not available, the agency could use observable
characteristics as proxies. We expect that, as proxies for market power, the agency takes
into account the size of the firm (S), exports (X), sales to the government (G), and market 4 Unionization is also likely to be influential when agencies maximize net revenues for several reasons. First, unionized workers are presumably more aware of their rights and more confident that they would not be fired if they denounce violations. Second, because in some countries labor unions are more likely to organize in more profitable firms, the agency could take unionization as an indicator that the firm would react to enforcement via formalization and not via job destruction.
7
share (M). We assume that δ is a positive function of each of these variables. In the next
section we test the predictions of this simple model.
3. Data and Descriptive Statistics
3.1 Data
We use the Enterprise Survey which provides information on labor inspections at the
firm-level for a representative sample of registered firms in the private sector in a large
number of countries. The Enterprise Survey is a stratified random sample with
replacement. The survey is answered by business owners and top managers, and it
usually includes 1,500 firms in large countries, 360 firms in medium-sized economies,
and 150 interviews in small economies.5
The survey has been conducted since 2002 in almost every country of the world.
In some countries the survey included a question about labor and social security
inspections. More specifically, it asked whether the establishment was inspected during
the last year by labor and social security officials. We restrict the analysis to firms located
in developing countries where the survey included this question. This resulted in a total
of 46,719 firms located in 72 countries (19 in Africa, 11 in Latin America, 26 in Asia,
and 16 in Europe).6 When we restrict the analysis to firms with non-missing data on size,
location, foreign ownership, sector of activity, and exports, the resulting sample is 44,545
firms located in 72 countries. This will be our main sample which we name as sample A.
Regrettably, due to changes in the questionnaire across countries and years, many
important variables that could affect inspections according to the discussion in section 2
are only available for a fraction of the countries and firms in sample A. Therefore, we
create three alternative samples, B, C, and F.
5 For more details see the website https://www.enterprisesurveys.org/ 6 Albania, Armenia, Azerbaijan, Bangladesh, Belarus, Benin, Bhutan, Bosnia, Brazil, Bulgaria, Burkina Faso, Cambodia, Cameroon, Cape Verde, Chile, China, Costa Rica, Croatia, Dominican Republic, Ecuador, Egypt, El Salvador, Eritrea, Ethiopia, Georgia, Guatemala, Guyana, Honduras, Hungary, India, Indonesia, Kazakhstan, Kenya, Kyrgyzstan, Lao, Latvia, Lebanon, Lithuania, Macedonia, Madagascar, Malawi, Malaysia, Mali, Mauritius, Moldova, Montenegro, Morocco, Nicaragua, Niger, Oman, Pakistan, Peru, Philippines, Poland, Romania, Russia, Saudi Arabia, Senegal, Serbia, South Africa, Sri Lanka, Syria, Tajikistan, Tanzania, Thailand, Turkey, Uganda, Ukraine, Uzbekistan, Vietnam, Yemen, and Zambia.
8
Sample B includes firms in sample A with information on all of the following
three proxies of θ: Share of workers with temporary contracts, share of workers with five
or less years of schooling, and percentage of sales reported for tax purposes by the typical
firm in the same line of business.7 Sample B includes 27,575 firms located in 60
countries. In sample C, we restrict firms in sample A to those with information on
unionization and participation in a business association. The sample shrinks to 21,002
firms located in 39 countries, mainly because of lack of unionization data. Finally, the
number of firms with information for all of the analyzed variables is only 9,802 firms
located in 30 countries (Sample F).
3.2 Main patters of Labor Inspections
This section presents basic statistics for labor inspections. We first present some cross-
country patterns using our main sample and relate it with country variables. Then, we
explore the incidence of inspections across firm’s characteristics.
3.2.1 Labor inspections across countries
The mean value of labor inspections across countries is 0.51, meaning that slightly more
than half of registered firms are inspected by labor and social security officials per year.
More than 85% of registered firms are inspected in Albania, Egypt and Morocco, and less
than 20% in Georgia, Indonesia and Cambodia.
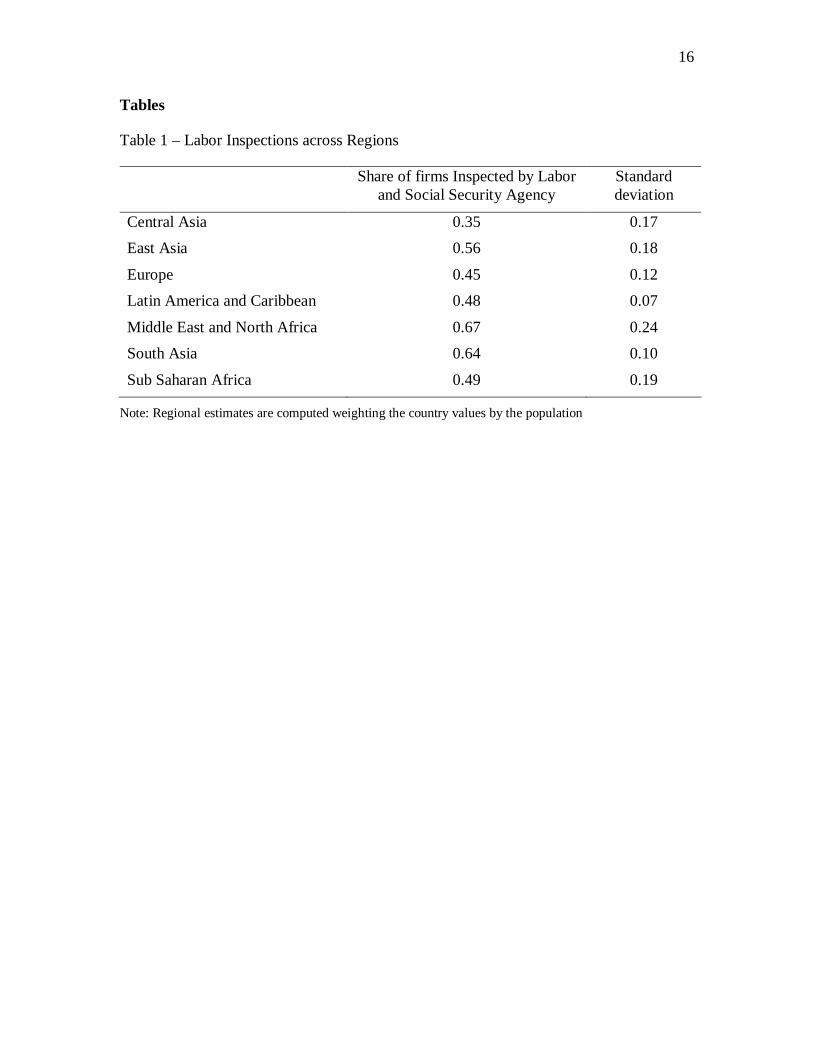
Table 1 presents the mean value of labor inspections across regions. The MENA
region has the highest level of inspections and Central Asia the lowest. Furthermore,
there is heterogeneity within regions as shown by the relatively high standard deviation.
<Table 1 here>
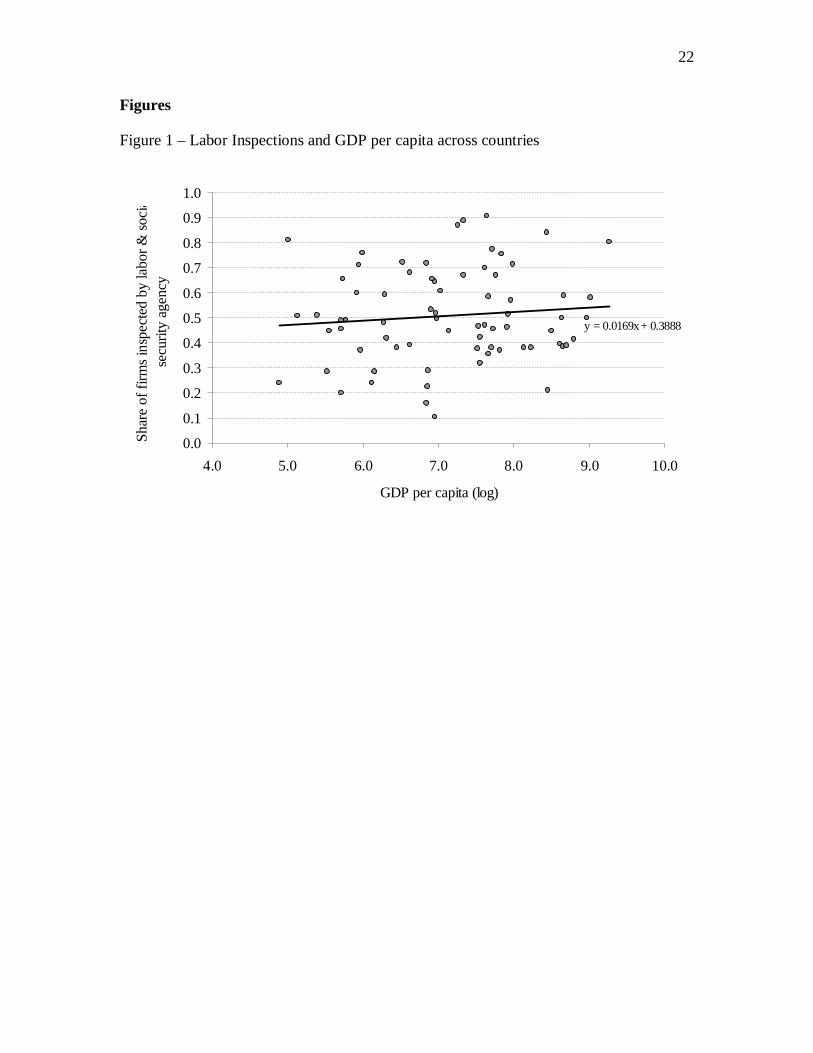
We observe than richer countries are more likely to conduct inspections, but the
correlation is very weak. Figure 1 is a scatterplot between (log) GDP per capita and the
share of firms that report being inspected in each of the 72 analyzed developing
countries. The pairwise correlation coefficient is 0.1 and statistically insignificant.
<Figure 1 here>
7 We assume that tax evasion is closely correlated with labor law violations and evasion of social security taxes.
9
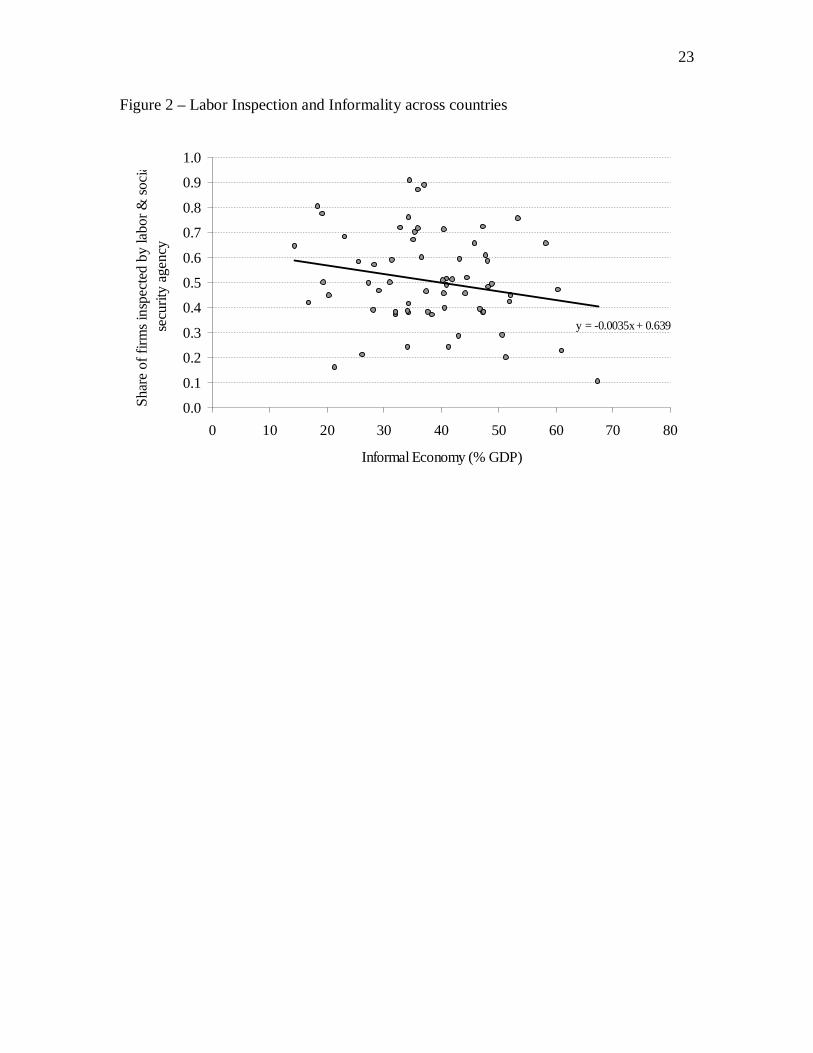
There is, however, a stronger correlation between inspections and the size of the informal
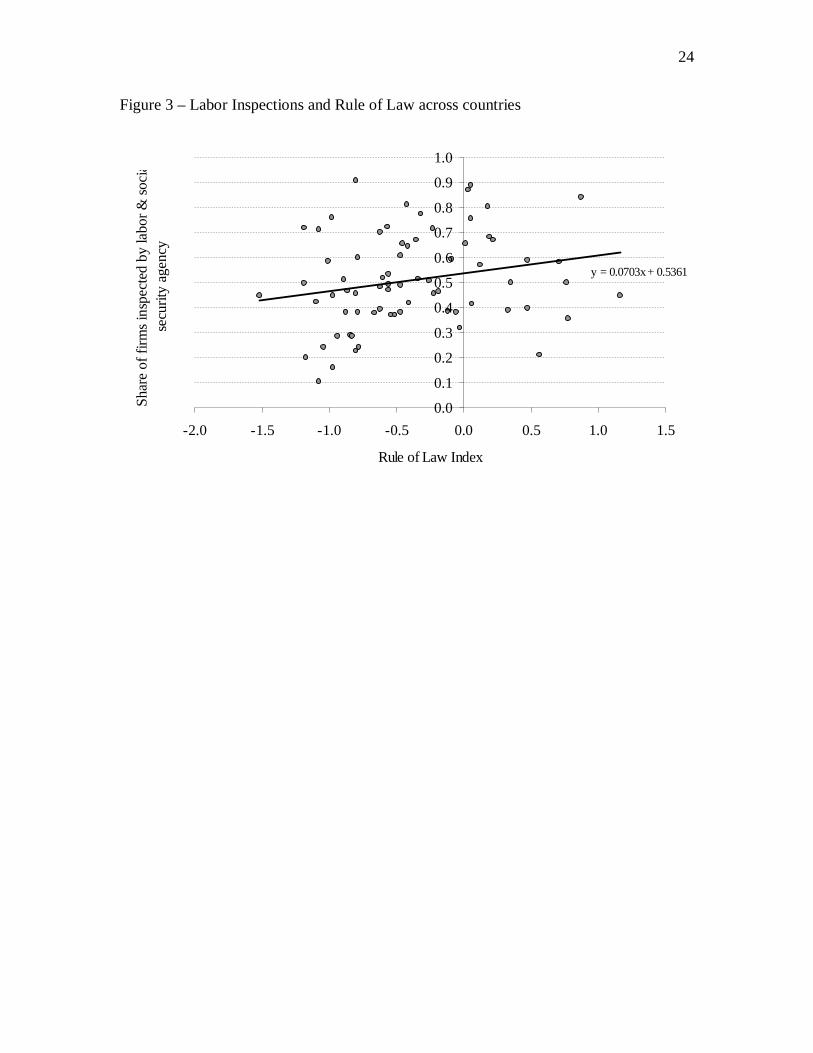
economy (Figure 2),8 and between inspections and a rule of law index (Figure 3).9
Countries with more inspections have less informality (pairwise correlation equal to -0.21
and significant at the 10% level), and countries with a higher value in the rule of law
index have more enforcement (pairwise correlation equal to 0.22 and significant at the
10% level). Although these simple correlations do not imply causality, they are consistent
with the hypothesis that more inspections increase compliance.
<Figure 2 here>
<Figure 3 here>
3.2.2 Labor inspections across several firm’s characteristics
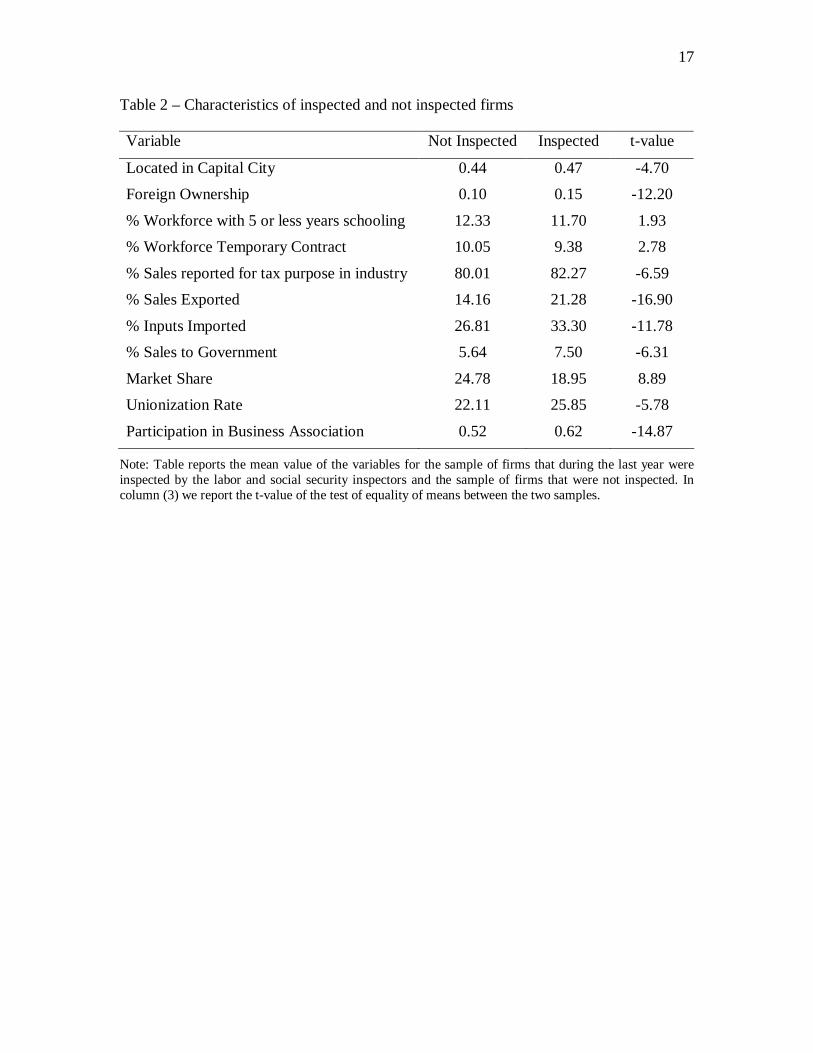
Table 2 provides the mean value of a set of firm’s characteristics for those that have and
have not been inspected by the labor and social security agency during the previous year.
The statistics suggest that inspected firms (compared to those that were not inspected) are
more likely to be located in the capital city, to be foreign, to export and import, to sell to
the government, and to have a larger proportion of their workforce unionized. More
surprisingly, is the finding that inspected firms are more likely to be members of a
business association, to have a more educated workforce, to operate in industries with
higher tax compliance, and that inspected firms have, on average, a smaller market share
compared to firms that have not been inspected.
<Table 2 here>
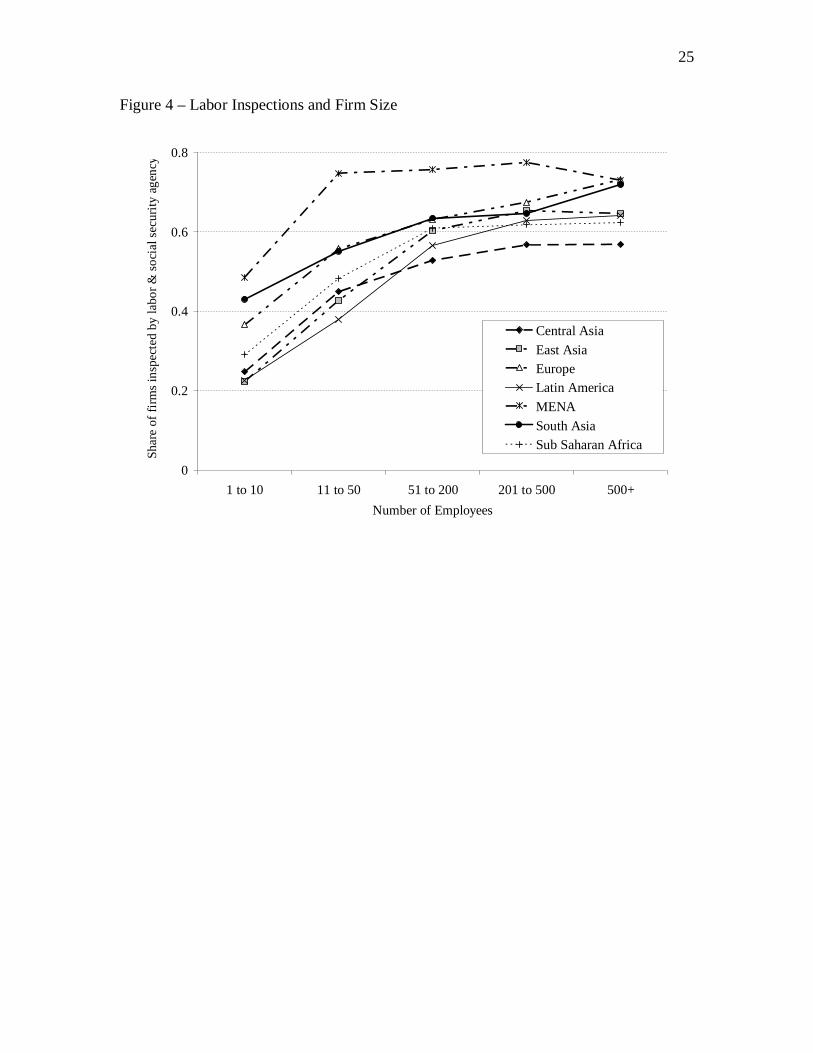
Figure 4 shows the incidence of labor inspections across firm size and region.
Larger firms (i.e., with more employees) are more likely to be inspected compared to
smaller firms in the seven groups. Furthermore, in 66 out of the 72 analyzed countries,
the average size of inspected firms is larger than the average size of non-inspected
8 The measure of the informal economy, as a percentage of GDP, is from Schneider (2002). 9 The rule of law index captures perceptions of the extent to which agents have confidence in and abide by the rules of society, and in particular the quality of contract enforcement, property rights, the police, and the courts, as well as the likelihood of crime and violence (Kaufmann et al., 2010). The index is constructed by averaging data from different sources, and varies between -2.5 and 2.5, with higher values corresponding to better outcomes. The data is available in the WGI website together with details on the aggregation procedure. http://info.worldbank.org/governance/wgi/sc_country.asp
10
firms,10 and the econometric evidence below shows that this is a very robust relationship
and quantitatively the most important determinant of inspections.
<Figure 4 here>
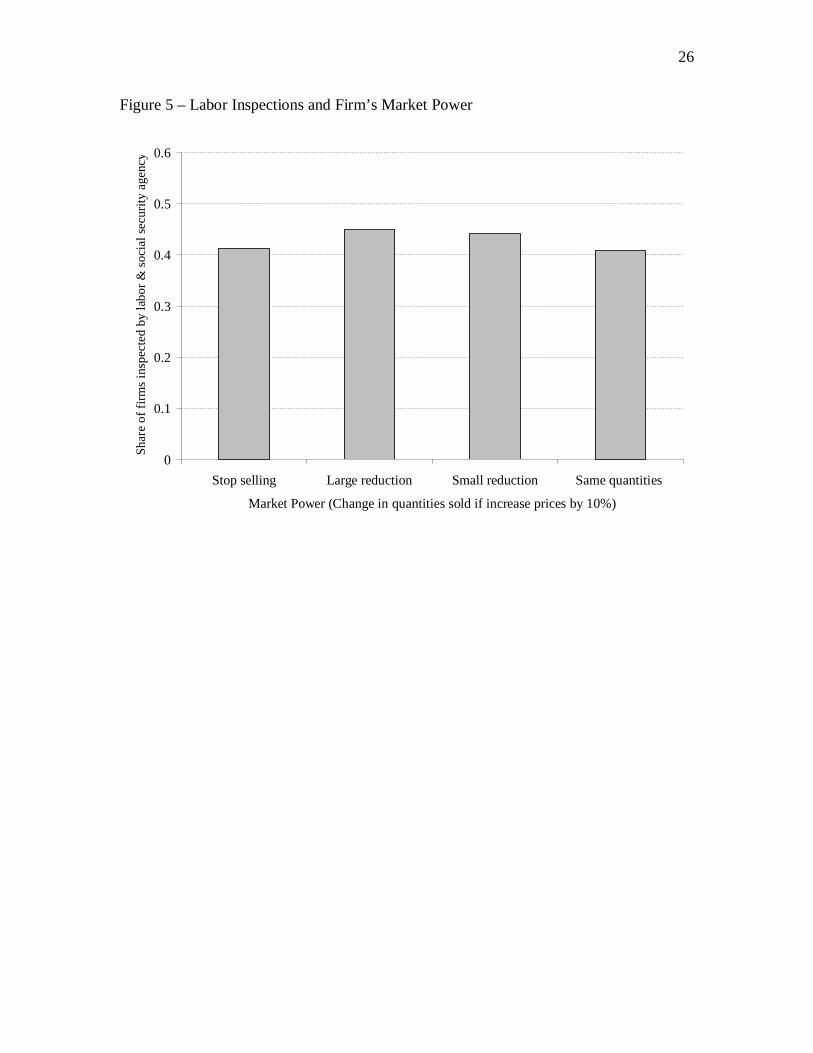
Figure 5 shows the incidence of labor inspections across firm’s market power.11 A
firm is assumed to have more market power if quantities sold decrease little after
increasing prices (and assuming that competitors keep prices constant). Firms with
greater market power can translate the increase in labor costs produced by inspections
into higher prices, and hence, are more likely to react to enforcement via formalization
rather than job destruction. Interestingly, we find that firms that have more market power
are less likely to be inspected compared to firms that expect a sharp reduction in sales.
This result, along with the finding that firms that have a larger share of the national
market are actually less likely to be inspected compared with firms with smaller market
shares, is at odds with the assumption that inspection agencies have the willingness (or
ability) to focus on firms that are more likely to react to inspection via formalization and
not via job destruction.
<Figure 5 here>
4. Econometric Model and Main Findings
In this section we estimate at the firm level the relationship between the incidence of
labor inspections and several firm characteristics. In particular, we assume that:
Inspectionij = αj + ψXij + εij (1)
where Inspectionij is an indicator equal to 1 if firm i in country j was inspected by labor
and social security officials during the previous year and 0 otherwise, X is a vector of
explanatory variables of the incidence of labor inspections, and αj is a set of country fixed
effects. We assume that εij is normally distributed and estimate equation (1) with a probit
model. Standard errors are clustered at the country level.
10 The six exceptions are Azerbaijan, Egypt, Montenegro, Morocco, Peru and Saudi Arabia. 11 Information about firm’s market power is only available in 39 out of the 72 countries in the main sample. Given the small sample, we do not disaggregate by region.
11
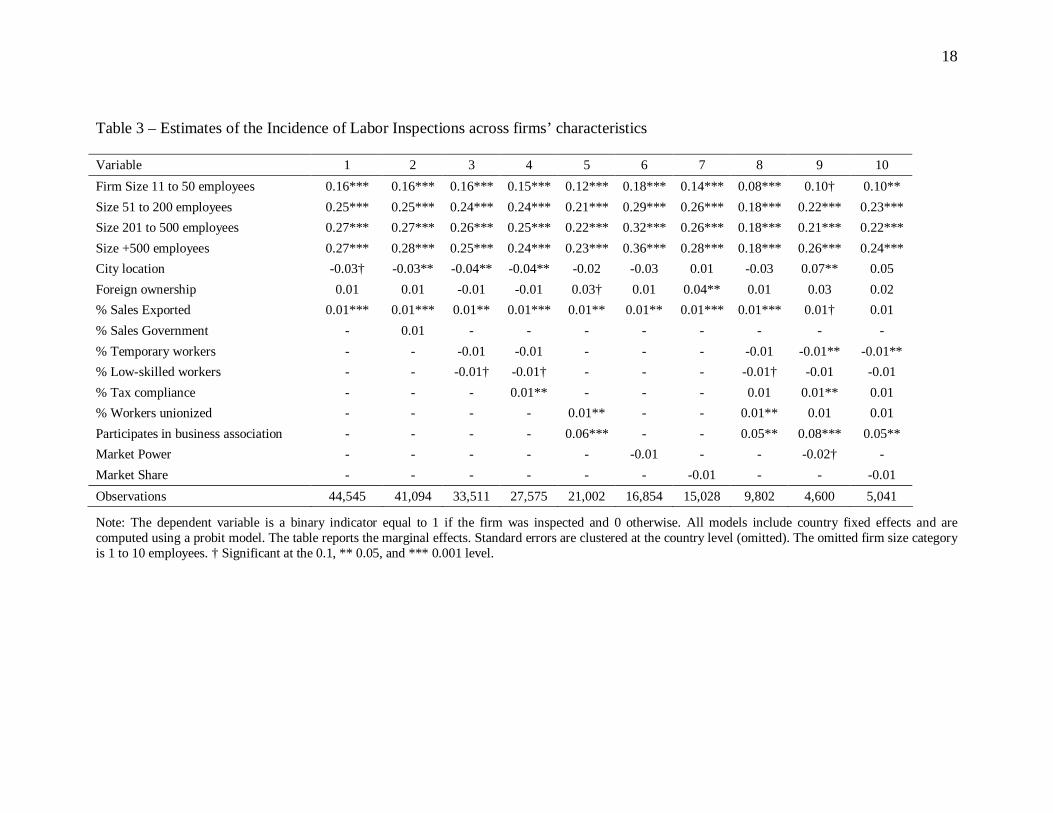
Table 3 presents the results for different specifications depending on the firm
characteristics included. In column (1) we include the set of baseline firm characteristics
that are observable in the main sample (i.e., firm size, location, foreign ownership, sector
of activity, and exports). In columns 2 to 10 we add several other characteristics of the
firm proxying the net benefits of inspections. As discussed above, unfortunately, these
characteristics are only available for a subset of firms in sample A. All specifications
include country fixed effects.
<Table 3 here>
The findings in table 3 show that few variables are consistently strong predictors
of the incidence of inspections. In particular, larger firms are more likely to be inspected
than smaller firms. Across specifications the magnitude of the effect is also reasonably
constant. The main differences are between firms with 1 to 10 employees and firms with
11 to 50 employees (15 percent increase in the probability of being inspected), and
between with firms with 51 to 200 employees (an additional 10 percent increase). Firms
that export are also more likely to be inspected.
There is some evidence that inspections are more likely among firms with a high
skilled workforce, with less market power, with higher unionization, and among firms
that are members of a business association and that operate in sectors of activity with
higher tax compliance. However, these results are not always robust across specifications.
A number of other firm characteristics, including location, foreign ownership, sales to the
government and other traits not included in the table (i.e., age, imports, technology, and
changes in employment) are usually not correlated with inspections.
There are several explanations for the robust correlation between labor
inspections and firm size. First, it is plausible that enforcement agencies want to
maximize revenues but have little capacity to discriminate firms with and without market
power. Therefore, they may use firm size as a proxy. Second, most of the inspections
have lower costs in larger firms because documentation is organized and is easier to
follow the process. In small or middle sized firms information is not so structured and
inspectors would probably lose more time without a final “payoff” of having many fines.
Third, the positive correlation could be driven by corruption: because larger firms tend to
12
be more productive they have the resources to pay higher bribes. Forth, there could be
reverse causality if labor inspections increases firm efficiency (Piore and Schrank, 2008).
This in turn may promote higher exports, technological adoption and ultimately firm size.
5. Heterogeneity of the Main Findings across Income and Region
In this section we investigate the heterogeneity of our baseline findings across income
groups and regions. In particular, we are interested in analyzing whether the objective
functions of enforcement agencies differ by levels of economic development or by
region. We categorize countries in three income groups (low-income, lower-middle
income, and upper-middle income of more) following the World Bank classification. In
tables 4 and 5 we replicate the main specifications for the different income groups and
regions.
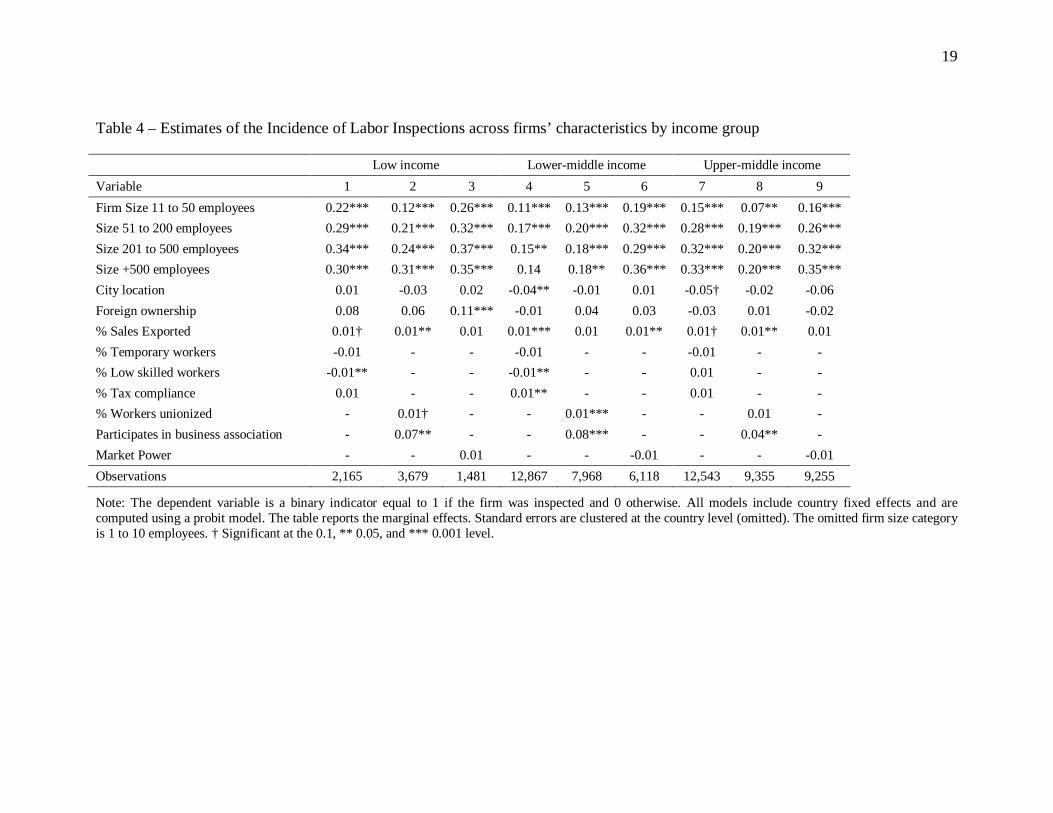
<Table 4 here>
The estimates are quite similar across income groups. Inspection agencies focus
on firms that have more employees, export, and participate in a business association.
Location, ownership and market power are usually not significantly correlated with the
incidence of inspections. The main difference across income groups appears to be related
to the skills of the workforce and their participation in a labor union. In low and lower-
middle income countries the agency is less likely to inspect firms with low skilled
workers and more likely to inspect unionized firms, but that relationship is not observed
in upper-middle income countries. One plausible interpretation of this result is that
inspection agencies in poorer countries have lower technical capacities to detect
violations, and hence, rely more on complaints, which are more likely among workers
who are aware of their rights (that is, unionized workers and those that have more
education).
The regional estimates show some interesting patterns. In particular, inspection
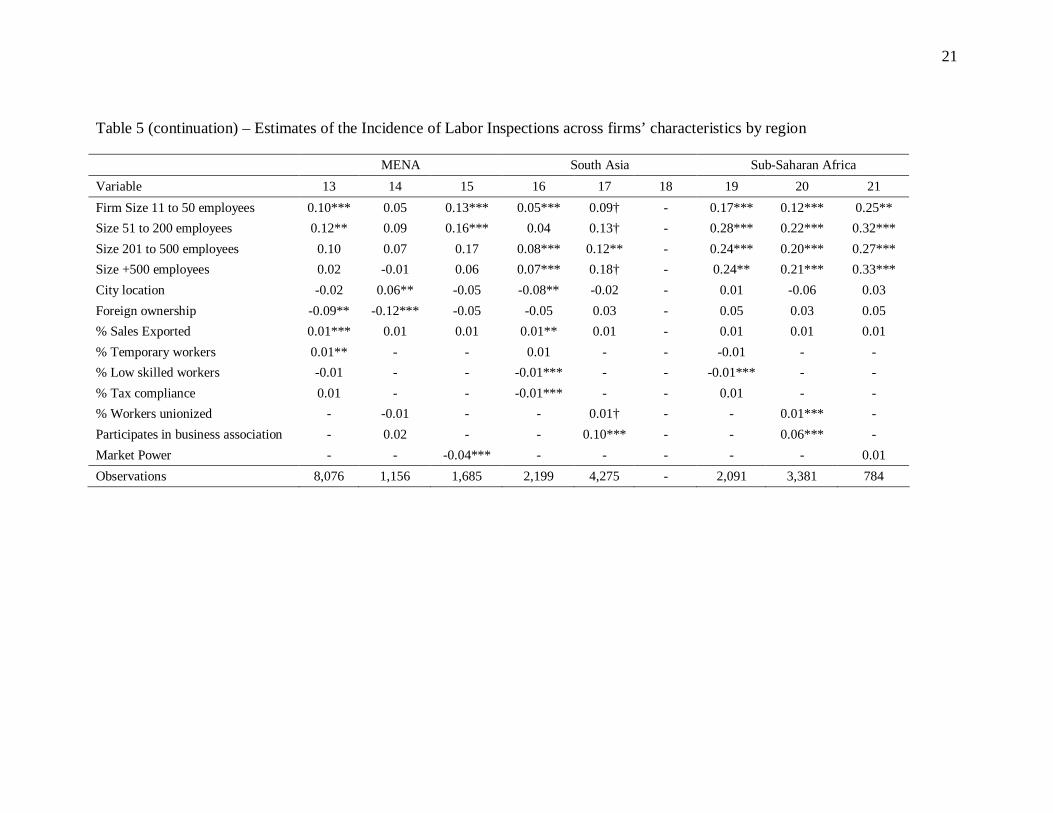
agencies in the Middle East and North Africa appear to focus their efforts differently
compared to agencies in other regions: First, while larger firms are more likely to be
inspected in all regions this is not the case in MENA. Second, agencies in MENA are less
13
likely to inspect foreign firms while a positive correlation is usually observed in other
regions (developing countries in Europe are another exception). Third, MENA is the only
region where firms with more market power are less likely to be inspected; no significant
correlation is observed in other regions. Fourth, firms with a larger share of low skilled
workers are more likely to be inspected in MENA (as well as in Latin America), but the
opposite occurs in the other regions.
<Table 5 here>
6. Conclusion
This paper empirically explores the incidence of labor inspections across firms that
operate in 72 developing countries. Given the relatively little knowledge on the behavior
of inspection agencies, our objective is to present a collection of stylized facts. Pooling
firms across countries we find that firms with more employees are more likely to be
inspected and the result is robust to the inclusion of several controls. Few other variables
are statistically correlated with inspections. Exporting firms, members of a business
association, firms that have a larger share of high-skilled and unionized workers, and that
operate in sectors of activity with more compliance are more likely to be inspected,
although these results are not as robust as the effect of firm size. Other characteristics of
the firm, such as location, foreign ownership, market power, share of sales to the
government, imports, and recent changes in employment are not correlated with
inspections.
We group countries by the level of economic development and by region to
explore whether there is heterogeneity across these categories. Although we find some
heterogeneity, most of the results obtained using the pooled sample hold. The most
salient exceptions are: First, the higher incidence of inspections among firms with a more
skilled and unionized workforce is only observed in the low and lower-middle income
groups. Second, inspection agencies in the Middle East and North Africa present some
anomalies, such as being less likely to inspect firms that are foreign, larger and with more
market power.
14
Are these results consistent with any particular theory of inspection agencies
behavior? Answering this question is complex because the behavior of enforcement
agencies not only depends on their objectives but also on their capacity to access and
process information about firm’s characteristics. The finding that the incidence of
inspections is lower among firms that operate in industries with more tax evasion and that
have a larger share of low skilled workers goes against the predictions of a legalistic
approach. If agencies were mainly concerned about ensuring compliance, then, they
should focus their efforts on firms with low skilled workers (because, this is where
violations usually occur) and in sectors with more evasion. This information is usually
easily available to the agency, and hence, it is unlikely that the problem is lack of
technical capacity to pursue a legalistic objective.
The finding that larger firms and members of business associations are more
likely to be inspected is at odds with the capture theory. However, there are other results,
such as the evidence for the MENA region and the lack of a correlation between
inspections and market power, which suggest that agencies are in some cases captured by
lobby groups. The fact that firms with a unionized workforce are more likely to be
inspected could be interpreted as evidence of capture by labor unions, but could also
indicate that inspections agencies mainly react to complaints and have little capacity to be
proactive.
Some results are consistent with the idea that agencies attempt to maximize net
revenues (such as the finding that larger firms are more likely to be inspected), however,
the findings that inspections are more likely among firms in industries with low tax
evasion and that firm’s market power is not correlated with inspections are at odds with
this approach.
Summing up, the inspections agencies we study are presumably driven by a
number of objectives (which sometimes are in conflict), and have little capacity to obtain
and process the necessary information to achieve those objectives. The result is that
inspected firms are not systematically different from those that are not inspected in a
large number of characteristics, which suggest that inspection agencies have low levels of

15
efficiency. More importantly, they also have low effectiveness as shown by the large
number of labor violations in the developing world.
16
Tables
Table 1 – Labor Inspections across Regions
Share of firms Inspected by Labor
and Social Security Agency Standard deviation
Central Asia 0.35 0.17 East Asia 0.56 0.18
Europe 0.45 0.12 Latin America and Caribbean 0.48 0.07
Middle East and North Africa 0.67 0.24 South Asia 0.64 0.10
Sub Saharan Africa 0.49 0.19
Note: Regional estimates are computed weighting the country values by the population
17
Table 2 – Characteristics of inspected and not inspected firms
Variable Not Inspected Inspected t-value
Located in Capital City 0.44 0.47 -4.70 Foreign Ownership 0.10 0.15 -12.20
% Workforce with 5 or less years schooling 12.33 11.70 1.93 % Workforce Temporary Contract 10.05 9.38 2.78
% Sales reported for tax purpose in industry 80.01 82.27 -6.59 % Sales Exported 14.16 21.28 -16.90
% Inputs Imported 26.81 33.30 -11.78 % Sales to Government 5.64 7.50 -6.31
Market Share 24.78 18.95 8.89 Unionization Rate 22.11 25.85 -5.78
Participation in Business Association 0.52 0.62 -14.87
Note: Table reports the mean value of the variables for the sample of firms that during the last year were inspected by the labor and social security inspectors and the sample of firms that were not inspected. In column (3) we report the t-value of the test of equality of means between the two samples.
18
Table 3 – Estimates of the Incidence of Labor Inspections across firms’ characteristics
Variable 1 2 3 4 5 6 7 8 9 10 Firm Size 11 to 50 employees 0.16*** 0.16*** 0.16*** 0.15*** 0.12*** 0.18*** 0.14*** 0.08*** 0.10† 0.10** Size 51 to 200 employees 0.25*** 0.25*** 0.24*** 0.24*** 0.21*** 0.29*** 0.26*** 0.18*** 0.22*** 0.23*** Size 201 to 500 employees 0.27*** 0.27*** 0.26*** 0.25*** 0.22*** 0.32*** 0.26*** 0.18*** 0.21*** 0.22*** Size +500 employees 0.27*** 0.28*** 0.25*** 0.24*** 0.23*** 0.36*** 0.28*** 0.18*** 0.26*** 0.24*** City location -0.03† -0.03** -0.04** -0.04** -0.02 -0.03 0.01 -0.03 0.07** 0.05 Foreign ownership 0.01 0.01 -0.01 -0.01 0.03† 0.01 0.04** 0.01 0.03 0.02 % Sales Exported 0.01*** 0.01*** 0.01** 0.01*** 0.01** 0.01** 0.01*** 0.01*** 0.01† 0.01 % Sales Government - 0.01 - - - - - - - - % Temporary workers - - -0.01 -0.01 - - - -0.01 -0.01** -0.01** % Low-skilled workers - - -0.01† -0.01† - - - -0.01† -0.01 -0.01 % Tax compliance - - - 0.01** - - - 0.01 0.01** 0.01 % Workers unionized - - - - 0.01** - - 0.01** 0.01 0.01 Participates in business association - - - - 0.06*** - - 0.05** 0.08*** 0.05** Market Power - - - - - -0.01 - - -0.02† - Market Share - - - - - - -0.01 - - -0.01 Observations 44,545 41,094 33,511 27,575 21,002 16,854 15,028 9,802 4,600 5,041
Note: The dependent variable is a binary indicator equal to 1 if the firm was inspected and 0 otherwise. All models include country fixed effects and are computed using a probit model. The table reports the marginal effects. Standard errors are clustered at the country level (omitted). The omitted firm size category is 1 to 10 employees. † Significant at the 0.1, ** 0.05, and *** 0.001 level.
19
Table 4 – Estimates of the Incidence of Labor Inspections across firms’ characteristics by income group
Low income Lower-middle income Upper-middle income Variable 1 2 3 4 5 6 7 8 9 Firm Size 11 to 50 employees 0.22*** 0.12*** 0.26*** 0.11*** 0.13*** 0.19*** 0.15*** 0.07** 0.16*** Size 51 to 200 employees 0.29*** 0.21*** 0.32*** 0.17*** 0.20*** 0.32*** 0.28*** 0.19*** 0.26*** Size 201 to 500 employees 0.34*** 0.24*** 0.37*** 0.15** 0.18*** 0.29*** 0.32*** 0.20*** 0.32*** Size +500 employees 0.30*** 0.31*** 0.35*** 0.14 0.18** 0.36*** 0.33*** 0.20*** 0.35*** City location 0.01 -0.03 0.02 -0.04** -0.01 0.01 -0.05† -0.02 -0.06 Foreign ownership 0.08 0.06 0.11*** -0.01 0.04 0.03 -0.03 0.01 -0.02 % Sales Exported 0.01† 0.01** 0.01 0.01*** 0.01 0.01** 0.01† 0.01** 0.01 % Temporary workers -0.01 - - -0.01 - - -0.01 - - % Low skilled workers -0.01** - - -0.01** - - 0.01 - - % Tax compliance 0.01 - - 0.01** - - 0.01 - - % Workers unionized - 0.01† - - 0.01*** - - 0.01 - Participates in business association - 0.07** - - 0.08*** - - 0.04** - Market Power - - 0.01 - - -0.01 - - -0.01 Observations 2,165 3,679 1,481 12,867 7,968 6,118 12,543 9,355 9,255
Note: The dependent variable is a binary indicator equal to 1 if the firm was inspected and 0 otherwise. All models include country fixed effects and are computed using a probit model. The table reports the marginal effects. Standard errors are clustered at the country level (omitted). The omitted firm size category is 1 to 10 employees. † Significant at the 0.1, ** 0.05, and *** 0.001 level.
20
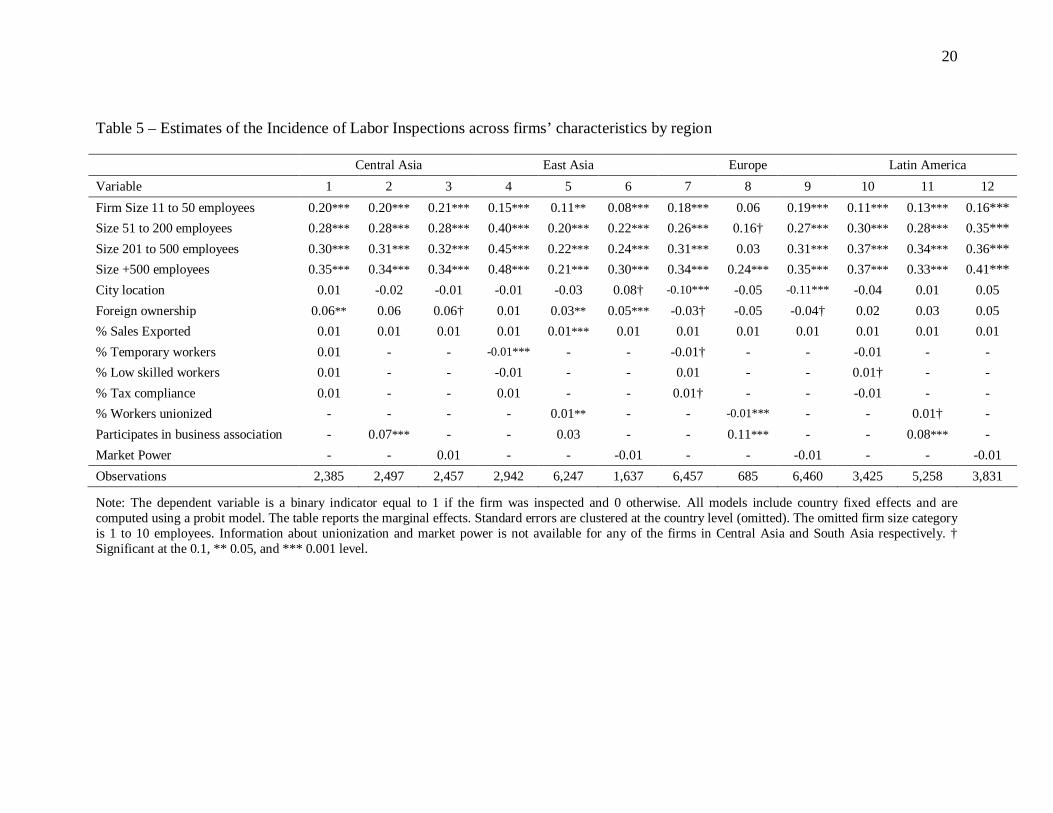
Table 5 – Estimates of the Incidence of Labor Inspections across firms’ characteristics by region
Central Asia East Asia Europe Latin America Variable 1 2 3 4 5 6 7 8 9 10 11 12 Firm Size 11 to 50 employees 0.20*** 0.20*** 0.21*** 0.15*** 0.11** 0.08*** 0.18*** 0.06 0.19*** 0.11*** 0.13*** 0.16*** Size 51 to 200 employees 0.28*** 0.28*** 0.28*** 0.40*** 0.20*** 0.22*** 0.26*** 0.16† 0.27*** 0.30*** 0.28*** 0.35*** Size 201 to 500 employees 0.30*** 0.31*** 0.32*** 0.45*** 0.22*** 0.24*** 0.31*** 0.03 0.31*** 0.37*** 0.34*** 0.36*** Size +500 employees 0.35*** 0.34*** 0.34*** 0.48*** 0.21*** 0.30*** 0.34*** 0.24*** 0.35*** 0.37*** 0.33*** 0.41*** City location 0.01 -0.02 -0.01 -0.01 -0.03 0.08† -0.10*** -0.05 -0.11*** -0.04 0.01 0.05 Foreign ownership 0.06** 0.06 0.06† 0.01 0.03** 0.05*** -0.03† -0.05 -0.04† 0.02 0.03 0.05 % Sales Exported 0.01 0.01 0.01 0.01 0.01*** 0.01 0.01 0.01 0.01 0.01 0.01 0.01 % Temporary workers 0.01 - - -0.01*** - - -0.01† - - -0.01 - - % Low skilled workers 0.01 - - -0.01 - - 0.01 - - 0.01† - - % Tax compliance 0.01 - - 0.01 - - 0.01† - - -0.01 - - % Workers unionized - - - - 0.01** - - -0.01*** - - 0.01† - Participates in business association - 0.07*** - - 0.03 - - 0.11*** - - 0.08*** - Market Power - - 0.01 - - -0.01 - - -0.01 - - -0.01 Observations 2,385 2,497 2,457 2,942 6,247 1,637 6,457 685 6,460 3,425 5,258 3,831
Note: The dependent variable is a binary indicator equal to 1 if the firm was inspected and 0 otherwise. All models include country fixed effects and are computed using a probit model. The table reports the marginal effects. Standard errors are clustered at the country level (omitted). The omitted firm size category is 1 to 10 employees. Information about unionization and market power is not available for any of the firms in Central Asia and South Asia respectively. † Significant at the 0.1, ** 0.05, and *** 0.001 level.
21
Table 5 (continuation) – Estimates of the Incidence of Labor Inspections across firms’ characteristics by region
MENA South Asia Sub-Saharan Africa Variable 13 14 15 16 17 18 19 20 21 Firm Size 11 to 50 employees 0.10*** 0.05 0.13*** 0.05*** 0.09† - 0.17*** 0.12*** 0.25** Size 51 to 200 employees 0.12** 0.09 0.16*** 0.04 0.13† - 0.28*** 0.22*** 0.32*** Size 201 to 500 employees 0.10 0.07 0.17 0.08*** 0.12** - 0.24*** 0.20*** 0.27*** Size +500 employees 0.02 -0.01 0.06 0.07*** 0.18† - 0.24** 0.21*** 0.33*** City location -0.02 0.06** -0.05 -0.08** -0.02 - 0.01 -0.06 0.03 Foreign ownership -0.09** -0.12*** -0.05 -0.05 0.03 - 0.05 0.03 0.05 % Sales Exported 0.01*** 0.01 0.01 0.01** 0.01 - 0.01 0.01 0.01 % Temporary workers 0.01** - - 0.01 - - -0.01 - - % Low skilled workers -0.01 - - -0.01*** - - -0.01*** - - % Tax compliance 0.01 - - -0.01*** - - 0.01 - - % Workers unionized - -0.01 - - 0.01† - - 0.01*** - Participates in business association - 0.02 - - 0.10*** - - 0.06*** - Market Power - - -0.04*** - - - - - 0.01 Observations 8,076 1,156 1,685 2,199 4,275 - 2,091 3,381 784
22
Figures
Figure 1 – Labor Inspections and GDP per capita across countries
y = 0.0169x + 0.3888
0.0
0.1
0.2
0.3
0.4
0.5
0.6
0.7
0.8
0.9
1.0
4.0 5.0 6.0 7.0 8.0 9.0 10.0
GDP per capita (log)
Shar
e of
firm
s ins
pect
ed b
y la
bor &
soci
al
se
curit
y ag
ency
23
Figure 2 – Labor Inspection and Informality across countries
y = -0.0035x + 0.639
0.0
0.1
0.2
0.3
0.4
0.5
0.6
0.7
0.8
0.9
1.0
0 10 20 30 40 50 60 70 80
Informal Economy (% GDP)
Shar
e of
firm
s ins
pect
ed b
y la
bor &
soci
al
se
curit
y ag
ency
24
Figure 3 – Labor Inspections and Rule of Law across countries
y = 0.0703x + 0.5361
0.0
0.1
0.2
0.3
0.4
0.5
0.6
0.7
0.8
0.9
1.0
-2.0 -1.5 -1.0 -0.5 0.0 0.5 1.0 1.5
Rule of Law Index
Shar
e of
firm
s ins
pect
ed b
y la
bor &
soci
al
se
curit
y ag
ency
25
Figure 4 – Labor Inspections and Firm Size
0
0.2
0.4
0.6
0.8
1 to 10 11 to 50 51 to 200 201 to 500 500+Number of Employees
Shar
e of
firm
s ins
pect
ed b
y la
bor &
soci
al se
curit
y ag
ency
Central AsiaEast AsiaEuropeLatin AmericaMENASouth AsiaSub Saharan Africa
26
Figure 5 – Labor Inspections and Firm’s Market Power
0
0.1
0.2
0.3
0.4
0.5
0.6
Stop selling Large reduction Small reduction Same quantities
Market Power (Change in quantities sold if increase prices by 10%)
Shar
e of
firm
s ins
pect
ed b
y la
bor &
soci
al se
curit
y ag
ency
27
References
Albrecht, James, Lucas Navarro, and Susan Vroman, 2009. “The Effects of Labour
Market Policies in an Economy with an Informal Sector,” Economic Journal, vol. 119,
No. 539, pp. 1105-29.
Almeida, Rita, and Pedro Carneiro. 2012. “Enforcement of Labor Regulation and
Informality.” American Economic Journal: Applied Economics, forthcoming.
Almeida, Rita, and Reyes Aterido. 2011. “On-the-Job Training and Rigidity of
Employment Protection in the Developing World: Evidence from Differential
Enforcement.” Labour Economics, Vol. 18, No. 1, pp. S71-S82.
Almeida, Rita, and Bilgen Susanli. 2012. “Enforcement and Labor Market Regulations
and Firm Size: Micro Evidence for Developing Countries.” Review of Development
Economics, forthcoming.
Almeida, Rita, and Pedro Carneiro, 2009. “Enforcement of Labor Regulation and Firm
Size.” Journal of Comparative Economics, Vol. 47, No. 1, pp. 28-46.
Amengual, Matthew. 2010. “Complementary Labor Regulation: The Uncoordinated
Combination of State and Private Regulators in the Dominican Republic.” World
Development, Vol. 38, No. 3, pp. 405–14.
Bardach, Eugene, and Robert Kagan. 1982. Going by the book: The problem of
regulatory unreasonableness. Philadelphia, PA: Temple University Press.
Basu, Arnab, Nancy Chau, and Ravi Kanbur. 2010. “Turning a blind eye: Costly
enforcement, credible commitment and minimum wage laws.” The Economic Journal,
Vol. 120, No. 543, pp. 244–69.
Bhorat, Haroon, Ravi Kanbur, and Natasha Mayet. 2011. “The Determinants of
Minimum Wage Violations in South Africa.” Charles H. Dyson School WP 2011-05.
Boeri, Tito, and Juan Jimeno. 2005. “The effects of employment protection: Learning
from variable enforcement.” European Economic Review, Vol. 49, No. 8, pp. 2057-77.
28
Botero, Juan, Simeon Djankov, Rafael La Porta, Florencio Lopez-de-Silanes, and Andrei
Shleifer. 2004. “The Regulation of Labor.” Quarterly Journal of Economics, Vol. 119,
No. 4, pp. 1339–82.
Caballero, Ricardo Kevin Cowan, Eduardo Engel, and Alejandro Micco. 2004. “Effective
Labor Regulation and Microeconomic Flexibility.” Yale Economic Growth Center
Working Paper 893.
Calvert, Randal, Matthew McCubbins, and Barry Weingast. 1989. “A Theory of Political
Control and Agency Discretion.” American Journal of Political Science, Vol. 33, No. 3,
pp. 588–611.
Gimpelson, Vladimir, Kapelyushnikov, Rostislav, and Anna Lukyanova. 2010.
“Employment Protection Legislation in Russia: Regional Enforcement and Labor Market
Outcomes.” Comparative Economic Studies, Vol. 52, No. 4, pp. 611-36.
Gindling, Thomas, and Terrell Katherine. 2007. “The effects of multiple minimum wages
throughout the labor market: The case of Costa Rica.” Labour Economics, Vol. 14, No.3,
pp. 485–511.
Kaufmann, Daniel, Aart Kraay, and Massimo Mastruzzi. 2010. “The Worldwide
Governance Indicators: A Summary of Methodology, Data and Analytical Issues.” World
Bank Policy Research Working Paper No. 5430.
Murillo, Maria Victoria, Lucas Ronconi, and Andrew Schrank. 2011. “Latin American
Labor Reforms: Evaluating Risk and Security.” In J. A. Ocampo and J. Ross (Eds.), The
Oxford Handbook of Latin American Economics. Oxford, UK: Oxford University Press.
Piore, Michael, and Andrew Schrank. 2008. “Toward managed flexibility: The revival of
labour inspection in the Latin world.” International Labour Review, Vol. 147, No. 1, pp.
1-23.
Pires, Roberto. 2008. “Promoting sustainable compliance: Styles of labour inspection and
compliance outcomes in Brazil.” International Labour Review, Vol. 147, No. 2–3, pp.
199-229.
Polinsky, Mitchell, and Steven Shavell. 2000. “The Economic Theory of Public
Enforcement of Law.” Journal of Economic Literature, Vol. 38, No. 1, pp. 45–76.
29
Ronconi, Lucas. 2012. “Globalization, Domestic Institutions and Enforcement of Labor
Law: Evidence from Latin America.” Industrial Relations, Vol. 51, No. 1, pp. 89–105
Ronconi, Lucas. 2010. “Enforcement and Compliance with Labor Regulations in
Argentina.” Industrial and Labor Relations Review, Vol. 64, No. 4, pp. 719-36.
Schneider, Friedrich, and Dominik Enste. 2000. “Shadow economies: Size, causes, and
consequences.” Journal of Economic Literature, Vol. 38, No. 1, pp. 77–114.
Schneider, Friedrich. 2002. “Size and measurement of the informal economy in 110
countries around the World.” Paper presented at a Workshop of the Australian National
Tax Centre ANU, Canberra, Australia.