THE ENERGY INTENSITY OF LIGHTING CANNABIS...
85
THE ENERGY INTENSITY OF LIGHTING USED FOR THE PRODUCTION OF RECREATIONAL CANNABIS IN WASHINGTON STATE AND IMPLICATIONS FOR ENERGY EFFICIENCY by Sarah L. Sweet A Thesis Submitted in partial fulfillment of the requirements for the degree Master of Environmental Studies The Evergreen State College June 2016
Transcript of THE ENERGY INTENSITY OF LIGHTING CANNABIS...

THE ENERGY INTENSITY OF LIGHTING
USED FOR THE PRODUCTION OF RECREATIONAL
CANNABIS IN WASHINGTON STATE
AND IMPLICATIONS FOR ENERGY EFFICIENCY
by
Sarah L. Sweet
A Thesis Submitted in partial fulfillment
of the requirements for the degree Master of Environmental Studies
The Evergreen State College June 2016

©2016 by Sarah Sweet. All rights reserved.

This Thesis for the Master of Environmental Studies Degree
by
Sarah L. Sweet
has been approved for
The Evergreen State College
by
________________________ Kathleen M. Saul, MA, MES
Member of the Faculty
________________________ Date

ABSTRACT
The Energy Intensity of Lighting Used for the Production of Recreational Cannabis in Washington State and Implications for Energy Efficiency
Sarah L. Sweet
In November 2012, Washington State voters passed Initiative 502 (Initiative Measure no. 502, 2012), which legalized recreational use of cannabis by adults and created a
framework for its production. Due to the need for artificial light and environmental controls, however, commercial cannabis grown indoors suffers from chronically high
energy demand. Lighting alone accounts for up to 86% of the total electricity use (Arnold, 2013; Jourabchi, 2014 and Mills, 2012). Based on these numbers, it appears lighting used by indoor cannabis producers would provide the most pertinent data in
regards opportunities for energy efficiency. Energy efficiency has significance not only in meeting ever increasing electrical load demands (Northwest Power and Conservation
Council, 2015), but also as a requirement of The Energy Independence Act (I-937) which requires the state’s largest utilities which provide 81% of the state’s electricity to date to attain all “cost effective” energy efficiency (Energy Independence Act, I-937, 2006). To
help address energy consumption and potential energy efficiency within this industry, this thesis examines data collected voluntarily from licensed recreational cannabis producers
in Washington State regarding their usage of agricultural lighting. The producers surveyed reported using a variety of lighting types other than HIDs and density of fixture
placement over cannabis plants. These results contradict existing literature which estimates energy consumption baselines for cannabis production based on the usage of
only HID lamps and a standard fixture density. The finding of this thesis show a standard baseline may not be appropriate for the recreational cannabis industry and that
approaches to energy efficiency will need to be individualized for each producer. Due to the diversity of the commercial cannabis industry, there will need to be a coordinated
effort between policy makers, utilities and cannabis producers to use energy more wisely in this burgeoning industry.

iv
TABLE OF CONTENTS
LIST OF FIGURES & TABLES ...................................................................................... VI
LIST OF ACRONYMS ................................................................................................... VII
ACKNOWLEDGEMENTS ........................................................................................... VIII
CH. 1 INTRODUCTION .................................................................................................... 1 1.1 BACKGROUND ........................................................................................................... 1 1.2 RESEARCH PROBLEM ................................................................................................ 2 1.3 RESEARCH QUESTION ............................................................................................... 3 1.4 SIGNIFICANCE OF RESEARCH PROBLEM AND QUESTION ......................................... 4 1.5 FOUNDATIONAL WORK .............................................................................................. 5 1.6 ROADMAP ................................................................................................................... 6
CH. 2 CANNABIS, ENERGY, AND RECENT LEGISLATIVE INITIATIVES ............. 8 2.1 CANNABIS CULTIVATION ........................................................................................... 8
Cultivation & Distribution Patterns of Cannabis: Local, Indoor Production ............ 8 Modern Indoor Cannabis Production ....................................................................... 11 Energy Intensity of Indoor Cannabis Production ...................................................... 14 Energy Efficiency in Indoor Agriculture ................................................................... 18
2.2 WASHINGTON STATE ENERGY LEGISLATION & PLANNING .................... 24 Significance of Energy Conservation ........................................................................ 24 The Washington State Energy Independence Act: Initiative 937 .............................. 25 The Northwest Power and Conservation Council’s Seventh Power Plan ................. 26
2.3 RECREATIONAL CANNABIS LEGISLATION: THE FEDERAL STANCE VS. WASHINGTON STATE .............................................................................................. 28
Federal Stance Regarding Recreational Cannabis ................................................... 28 Washington State Cannabis Production .................................................................... 30 Summary .................................................................................................................... 31
CH. 3 METHODS ............................................................................................................. 32 3.1 STUDY OBJECTIVES ................................................................................................ 32 3.2 RESEARCH DESIGN & DATA COLLECTION ............................................................. 33 3.3 STUDY OVERVIEW .................................................................................................. 34
CH. 4 RESULTS & DISSCUSSION ................................................................................ 38 4.1 VARIATION IN CANNABIS PRODUCTION OPERATIONS .............................................. 39 4.2 REPORTED LIGHTING TYPES ..................................................................................... 42 4.3 PHOTOPERIODS ......................................................................................................... 46

v
4.4 LAMP DENSITY ......................................................................................................... 47 4.5 ENERGY INTENSITY OF LIGHTING ............................................................................. 50
CH. 5 CONCLUSIONS & RECOMMENDATIONS ...................................................... 55 5.1 RECOMMENDATIONS FOR ENERGY EFFICIENCY GAINS IN GROW LIGHTING ............. 55 5.2 SUMMARY OF RECOMMENDATIONS FOR FURTHER STUDY ....................................... 61
REFERENCES ................................................................................................................. 64
APPENDICES .................................................................................................................. 70 APPENDIX A- SURVEYS .................................................................................................. 70 APPENDIX B-CORRESPONDENCE .................................................................................... 74 APPENDIX C- ASSUMPTIONS ........................................................................................... 76

vi
LIST OF FIGURES & TABLES
FIGURES
FIGURE 4.1.1: OPERATION TYPES REPORTED FOR THIS THESIS ......................................... 40 FIGURE 4.1.2: OPERATION TYPES REPORTED FOR NWPCC SURVEY ................................ 41 FIGURE 4.2.1: HIGH PRESSURE SODIUM LAMP ................................................................... 42 FIGURE 4.2.2: METAL HALIDE LAMP ................................................................................ 43 FIGURE 4.2.3: COMPACT FLUORESCENT ............................................................................ 43 FIGURE 4.2.4: T5 FLUORESCENT ....................................................................................... 43 FIGURE 4.2.5: REPORTED LIGHTING TYPES-VEGETATIVE ................................................. 44 FIGURE 4.2.6: REPORTED LIGHTING TYPES-FLOWERING .................................................. 45 FIGURE 4.4.1: LAMP DENSITY-VEGETATIVE ..................................................................... 48 FIGURE 4.4.2: LAMP DENSITY-FLOWERING ...................................................................... 49 FIGURE 4.5.1: EUI-VEGETATIVE ....................................................................................... 52 FIGURE 4.5.2: EUI-FLOWERING ........................................................................................ 53
TABLES
TABLE 2.1.1: MILLS' MODEL ............................................................................................. 16 TABLE 4.3.1: PHOTOPERIODS ............................................................................................. 47

vii
LIST OF ACRONYMS
aMW- Average Megawatt
CFL- Compact Fluorescent
EE-Energy Efficiency
EUI- Energy Use Intensity
LED- Light Emitting Diode
MH- Metal Halide
NWPCC-Northwest Power and Conservation Council
PAR- Photosynthetically active radiation
PSE-Puget Sound Energy
HID- High Intensity Discharge
HPS-High Pressure Sodium
kWh- Kilowatt hour
THC- Tetrahydrocannabinol
WSIA-Washington Sungrowers Industry Association
WSLCB- Washington State Liquor and Cannabis Board

viii
ACKNOWLEDGEMENTS
I would like to express my sincere gratitude to the following people, who provided support and guidance throughout the duration of this project:
First and foremost, my reader Kathleen Saul who has given me incredible feedback and advice throughout this process.
Massoud Jourabachi of the Northwest Power and Conservation Council for providing me with his data.
Bobby Coleman, fellow MES grad who gave me the initial idea for this project.
My amazingly supportive peer review group; Quasar Surprise, Greg Taylor and Ayako Okuyama-Donofree.
My Mother and Grandmother who taught me positivity and perseverance which were vital for this process.
All my other family and friends for their continual encouragement.
My patient partner Eric for all his support and my not-so patient young son Ash who told me he would build me a robot to do my homework for me.

1
CH. 1 INTRODUCTION
1.1 BACKGROUND
In November 2012, voters in Washington State passed Initiative 502 (Initiative
Measure no. 502, 2012), which decriminalized recreational use of cannabis (commonly
referred to as “marijuana”) by adults and created a framework for commercial cannabis
cultivation within Washington State. Use of cannabis for recreational purposes in this
context can be understood as the “voluntary ingestion for personal pleasure or satisfaction,
unrelated to any medical condition” (Warren, 2015 p. 394). Small-scale legal cultivation
of cannabis for medical use had been active prior to I-502, but increased demand from
recreational users necessitates larger operations (Washington State Institute for Public
Policy, 2015).
Indoor cannabis production has purportedly been the most popular method among
cannabis producers for reasons that will be discussed in the next chapter. Large scale or
small, indoor cultivation can be complex. Elaborate ventilation and environmental
controls to adjust heat and humidity must be installed to create the optimal environment
for the cannabis plants. Precise mixes of water and nutrients must also be delivered to
each plant at the right time. Finally, agriculturally-appropriate lamps producing the correct
spectrums of light must be used for a certain number of hours per day to induce either
vegetative growth or flowering (Mills, 2012).

2
1.2 RESEARCH PROBLEM
The Washington State Liquor and Cannabis Control Board regulates licensing for
cannabis growers. At the time of this writing, the Board does include environmental
regulations relating to air and water quality in the licensing process, but offers no
guidelines or limitations for energy usage associated with cannabis cultivation. The lack of
energy guidelines should be concerning, because cultivating cannabis indoors requires
massive amounts of electricity, mainly due to the need for specialized lighting and climate
control equipment (Mills, 2012). Very little research has been conducted on the actual
energy consumption of cannabis production due to its prior history as an illicit activity,
which has made data about growers fairly inaccessible (Washington State Institute for
Public Policy, 2015). The ambiguity surrounding illicit cannabis operations resulted in a
hidden variable for historic electrical load, and has prevented electrical demand driven by
these activities from being accurately gauged in forecasts. The commercial cannabis
industry may have significant influence on energy demands.
Passed in 2006, I-937 requires the state’s 17 largest utilities to obtain at least 15%
of their supply portfolio from renewable resources by 2020 (Energy Independence Act,
I-937, 2006). These utilities must also pursue “all cost-effective energy conservation;”
they must participate in energy conservation programs to decrease demand and lower
costs for their customers. The cost of conservation programs must not exceed the price of
the energy they offset (Energy Independence Act, I-937, 2006, pp. 2-4). Energy
conservation programs offered by each utility differ due to the unique makeup of their
power portfolios and the customers they serve. Each service territory also varies and may
include a mix of residential, commercial and/or industrial customers, each with distinctive
energy needs and conservation opportunities.

3
Each utility must prepare a biennial Conservation Potential Assessment to identify
“achievable opportunities” in conservation (Energy Independence Act, I-937, 2006, pp.
4-5). The assessment takes into account the unique makeup of a utility’s customers and
their historic electricity usage, which will then be used to make demand projections and
identify conservation opportunities. These assessments ultimately set each utility’s
conservation goal for a two-year period. Failure to meet these goals results in financial
penalties for the utility and requires a public report to their customers (Energy
Independence Act, I-937, 2006). Of course, demand projections and thus, conservation
assessments, never included large-scale cannabis production prior to the passage of I-502
in 2012. The extent of this new energy demand has only recently come to light as the
legal commercial cannabis industry grows.
1.3 RESEARCH QUESTION
What is the electrical energy intensity per square foot of cannabis canopy cover
attributed to grow lighting for commercial cannabis agriculture in Washington State?
a. What energy efficiency measures for agricultural lighting could be taken in
commercial cannabis agriculture in alignment with conservation goals
required by Washington State’s Energy Independence act (I-937)?

4
1.4 SIGNIFICANCE OF RESEARCH PROBLEM AND QUESTION
Initiative 502 may have large-scale implications in relation to energy demand as an
increasing number of cannabis producers seek to satisfy the needs of a new and growing
market. My research seeks to enhance our understanding of energy usage related to
cannabis cultivation and how it may fit into the overall state energy plan. Revelations in
this area could have implications for future policy changes to I-502 and may also provide
utilities with more data on which to base their demand projections, which in turn, may
influence energy conservation planning.
The Northwest Power and Conservation Council released the region’s Seventh
Power Plan, finalized in February 2016, outlining a 20-year regional power plan for
Idaho, Montana, Oregon and Washington. Unlike previous plans, the Seventh Power Plan
now addresses indoor agriculture, but as of this writing, details on specific electricity load
patterns remain in development. Further research in this area will be needed to help
develop energy conservation plans and load demand projections. Such plans will be
especially important as the debate on cannabis legalization continues to unfold and if
more states decriminalize recreational use. By providing a new framework for
understanding load demand and energy efficiency within this emerging industry, a more
complete picture of cannabis legalization could better inform utility decisions and policy
development.

5
1.5 FOUNDATIONAL WORK
Very little research has focused specifically upon the energy intensity of cannabis
production. Three sources in particular provided a foundational basis for this thesis. Evan
Mills (2012) authored the only peer-reviewed paper on the topic. In it, he presents a
model for calculating high, low and average energy intensity for cannabis production.
Mills’ model utilizes what he considers “typical [indoor] practices” for cultivation which
include heating of irrigation water, high-intensity lighting, extensive climate control for
heating and cooling, de-humidification and air cleaning. The resulting framework results
in a fairly transferable figure of 13,000 kWh average per year for one “standard
production module” consisting of a 4x4x8 cubic foot chamber containing four cannabis
plants (Mills, 2012 p. 59).
In the second study, Massoud Jourabchi of the Northwest Power and Conservation
Council (NWPCC) postulates lighting alone accounts for up to 80% of total energy
consumption (Jourabchi, 2014). Mills’ (2012) research also found lighting to be the
single largest factor in energy consumption, reporting it to average around 38% of the
total electrical energy consumption (p.65). Part of the discrepancy in the numbers can be
attributed to the fact that Mills (2012) included in his calculations the preparation of
cannabis after harvest, whereas Jourabchi (2014) did not. Mills (2012) also did not
interview cannabis growers directly, but rather performed an analysis using data from
“horticultural equipment manufacturers, trade media, open literature and interviews with
horticultural equipment vendors” (p. 59). Conversely, Jourabchi’s (2014) study resulted
from interviewing growers directly and generating data based on actual production.
Regardless of the discrepancy in methods, both studies found lighting to be the largest

6
proportion of energy usage in cannabis production. A third study, in 2013 by graduate
student Jessica Arnold, observed three California cannabis dispensaries and echoed
results from Jourabachi (2014) and Mills (2012). Arnold (2013) uncovered results closer
to Jourabchi’s findings, with lighting accounting for 79% to 86% of total electrical
consumption (p.70).
The direction of this thesis has been shaped by consistent observation of lighting as
the largest contributor to electrical energy consumption in cannabis production. Because
lighting appears to be the most impactful factor in electrical load growth resulting from
cannabis production, it also presents the greatest opportunity for energy efficiency. While
Arnold (2013) and Mills (2012) focused their research on carbon emissions relating to
cannabis production (calculating energy usage as a byproduct of this goal), this thesis
concentrates on the electrical energy requirements of agricultural lighting used in
cannabis production to better understand this portion of the load demand for the cannabis
industry.
1.6 ROADMAP
To understand the potential relationship between cannabis production, energy
intensity and the requirements of I-937, the following chapter will begin with a broad
overview of cannabis cultivation and distribution patterns, then move into more specific
cultivation methods and energy requirements. Energy efficiency measures for indoor
agriculture will also be considered. The next section will place the significance of the
energy intensity required for cannabis cultivation within the context of I-937. A

7
discussion of the Seventh Power Plan (which lays out energy planning for the entire
Pacific Northwest region for the next 20 years) as it relates to indoor agriculture and
energy efficiency will be included, as well as a short explanation of the Conservation
Potential Assessments required of utilities to set energy conservation goals. Finally, I-502
and impacts associated with its implementation will be discussed, which will transition
into the final conclusions of this chapter.
Chapter 3 will introduce the original research conducted for this thesis project in a
review of methods used. The sample set for this work consisted of 12 commercial
cannabis producers operating in Washington State surveyed specifically for this thesis,
along with an additional 17 surveyed by the Northwest Power and Conservation Council
(NWPCC) in 2015. Details in the chapter will include research design and data collection
as well as an overview of the analyses performed.
Chapter 4 will present the results of this thesis project and reflections related to
these results. Analyses will focus on understanding the relationship between energy
intensity and lighting used in cannabis production. The first analyses will examine the
operation types of each respondent: indoor, outdoor, greenhouse or a combination. Next,
reported lighting types used will be explored, along with the daily run time for the lights
(photoperiods). The square footage of cannabis canopy served by each lamp (lamp
density) will also be investigated, followed by the energy intensity attributed to lighting
per square foot of cannabis canopy. Conclusions and recommendations based on the
findings will be presented in the final chapter.

8
CH. 2 CANNABIS, ENERGY, AND RECENT LEGISLATIVE INITIATIVES
2.1 CANNABIS CULTIVATION
Cultivation & Distribution Patterns of Cannabis: Local, Indoor Production
The benefits of indoor cannabis production become apparent when reviewing
existing literature. In an anonymous online survey of 6,530 cannabis growers across 11
countries, researchers discovered that growers in the United States preferred indoor
cultivation largely because of climate (outdoor crops being at the mercy of the weather),
the lack of available land in populated areas for outdoor growing and risk of detection in
the case of illegal operations (Potter, 2014 p. 231). Even with legal operations, security
raises major concerns. In Washington State, potential cannabis producers must report
their security measures as part of I-502’s review process to obtain a license for cannabis
production (Chapter 314-55 WAC, 2015). As Decorte (2009) points out, conclusions
drawn from the comparison of cannabis markets worldwide would be tenuous due to the
variations in the cannabis products, legalities in each country and cultivation techniques
(p.272). Even so, Potter’s (2014) analysis does shed light on the difference in trends of
cannabis cultivation between more- and less-densely populated countries. Indoor
cannabis cultivation tends to occur more frequently in densely populated areas. For
example, respondents in the UK cite a lack of land, and fear of discovery or theft as the
main contributing factors for this preference (p. 230).
Another study by Chadillon-Farinacci (2015) analyzes trends in cannabis
cultivation between 2001 and 2009 through the review of arrest records tied to the
discovery of illegal grow operations in the province of Quebec, Canada. Chadillon-

9
Farinacci (2015) found that hydroponic cultivation1 tends to be most popular within large
cities. Several factors contribute to this popularity. First, hydroponic methods offer more
ability to control the growth cycle of plants due to the ease of administering nutrients and
control over light levels, resulting in harvest patterns more easily adjusted to meet market
demand (Chadillon-Farinacci, 2015). Second, the ability to control harvest patterns also
results in higher overall productivity. Bouchard (2008) found that outdoor soil-based
cultivation that would be limited to a natural annual growth cycle had an average yield
per plant at 1.9 ounces, but with only one harvest per year. Indoor soil-based cultivation
produces 3.38 ounces per plant each year, but over multiple harvests. Indoor hydroponic
methods (which as mentioned previously offered the highest level of control over light
levels and nutrient loads) yielded the most per plant annually at 3.96 ounces. The high
annual yields with hydroponic cultivation can be attributed to the ability to harvest more
frequently than both outdoor and outdoor soil-based cultivation. Chadillon-Farinacci
(2015) also pointed out that hydroponic methods require greater financial investment than
soil-based cultivation, as well as a permanent site for operations and thus a “deeper
commitment” on the part of growers (p. 321). As an illegal operation, this could
constitute a greater risk; as a legal operation, however, hydroponic methods could be
extremely attractive to growers with the financial capital for the initial investment.
Researchers have also found a tendency for cannabis to be distributed closer to the
original source than other drugs, with 72.5% having been both grown and distributed on
the same continent and 57.5% regionally, making cannabis unique among other
1Hydroponic cultivation refers to the process by which plant roots are suspended in, or continuously misted with nutrient rich solution (El-Ramady et al., 2014).
10
“plant-based” recreational drugs such as cocaine or heroin (Chadillon-Farinacci, 2015 p.
311). Local cultivation cuts down on the degradation of the tetrahydrocannabinol2 (THC)
during storage since it keeps the product closer to the consumer (Decourte, 2009 p. 272).
Cannabis growers have been said to have a “preoccupation with the strength and the
quality of the cannabis they grow” (Decorte, 2010 p.274). Through observations during
interviews of cannabis growers in Oregon and Washington State, Morris (2015)
compared them to the micro-brewers of the Northwest, creating a local product with a
sense of pride, a likeness especially appropriate since cannabis belongs to the genus
humulus, better known as hops (Knight et al. 2010 p. 37).
Market trends and product characteristics leading cannabis to “stay local” result in
an interesting side effect: a smaller carbon footprint for transportation. Shorter shipping
distances between cannabis producers and ultimate end users translates to less burning of
fossil fuels. In turn, this makes THC a “greener” drug, at least in regards to shipping.
Local pride and freshness also may greatly encourage the preference of consumers for a
local market. At the time I-502 was enacted, however, local production in Washington
State had been the only option, as no surrounding states had decriminalized recreational
cannabis. Even with Oregon decriminalizing recreational cannabis shortly after
Washington, transportation of the drug across state lines still constitutes a felony
according to Section 812 of Title 21 of the U.S. Code, which classifies marijuana as a
Schedule I Controlled substance (United States Code, 2006).
2Tetrahydrocannabinol, or THC, is the main “psychoactive substance” in cannabis that makes it attractive as a recreational drug (Vanhove, 2011 p. 158).

11
As illustrated by the previous sections, multiple factors push cannabis growers in
the United States towards indoor cultivation. In practice, cultivation trends in known
cannabis grow operations also show a tendency toward indoor production (Potter, 2014;
Chadillon-Farinacci, 2015). While factors influencing the local production and
distribution of cannabis help lower the drug’s carbon footprint, indoor cultivation does
not. In fact, indoor cultivation tends to be highly energy and water intensive (Mills,
2012).
Modern Indoor Cannabis Production
Cannabis sativa L (hereafter simply referred to as “cannabis”) contains the highest
levels of THC among the cannabis species (Vanhove, 2011 p. 158). The psychoactive
effect of THC have been reported to induce relaxation, euphoria, sensory alteration and
an elevated or “mellow” mood, making cannabis attractive as a recreational drug (Hart et
al., 2001 & Green et al. 2003). The use of cannabis for recreational purposes can be
understood as the “voluntary ingestion for personal pleasure or satisfaction, unrelated to
any medical condition” (Warren, 2015 p. 394). Growers of the plant have developed
techniques that amplify THC concentrations to enhance their psychoactive effects. These
techniques include genetic manipulation through cross breeding and the “sinsemilla
technique” for cultivation that utilizes only female cannabis plants – their unfertilized
flowers contain the highest THC concentrations (Pijlman et. al 2005 p. 178). To control
growth cycles through light exposure, indoor cultivation becomes necessary as a way to
fully manage the plant’s environment. Mills (2012) estimates a cannabis production
operation uses one 1,000-watt High Pressure Sodium (HPS) lamp per four plants (pp. 61
& 65). The following outline of the sinsemilla technique exemplifies the energy

12
consumption associated with grow lighting used in indoor cannabis production:
1. Germination: Development of the plant’s embryo lasts 3-7 days. At the end of
this stage, a single rootlet pushes downward and a visible sprout pushes upward
(Cervantes, 2006 pp. 2-3).
2. Seedling growth (about a month): Rootlets continue to develop. Seedlings need
16-18 hours of light to continue developing properly (Cervantes, 2006 p. 3).
3. Vegetative state: “Maintained” by providing plants 18-24 hours of light daily for 4
weeks (Cervantes, 2006 p. 3).
4. Pre-Flowering: After 4 weeks of vegetative growth, pre-flowers appear. These
flowers signal the sex of the plants. Growers destroy males or remove them to be
used as breeding stock, as female cannabis plants produce more cannabinoids and
THC (Cervantes, 2006 p.5).
a. Mother Plants: Strong female plants will be selected to become “Mother
Plants” that will provide cuttings to produce clones. For them to remain
useful in this purpose, they must be kept in the vegetative growth state
requiring 18-24 hours of light a day. (Cervantes, 2006 p. 5)
b. Clones: Tips of the mother plant’s branches will be clipped off to create a
“clone.” It takes a clone 10-20 days to develop a root system and then 14
weeks with 18-24 hours of light a day to stay in a vegetative state. Clones
provided by the mother plant produce the actual harvested cannabis crop.
Thus, keeping a reliable supply of cannabis requires a consistent supply of
clones, which in turn depend on the productivity of the mother plants.
(Cervantes, 2006 pp. 5-8)

13
5. Flowering: Cannabis plants will be induced to flower by simulating fall-like
conditions, e.g., shorter days. Cannabis grown for commercial purposes will be
placed on a cycle of 12 hours of darkness and 12 hours of light. (Cervantes, 2006
p. 8). By removing the male cannabis plants earlier in the process, the remaining
female clones will be left un-pollinated and their flowers will increase in size for
weeks. Shorter light cycles and the absence of pollination results in “cannabinoid-
laden resin production” and peaked THC production (Cervantes, 2006 p. 8).
The sinsemilla technique highlights the high level of control developed by
cannabis producers. However, environmental control has not been the only motivation for
indoor cultivation. As discussed earlier, due to its illegal nature in the United States,
cannabis has historically been grown indoors for security and secrecy. Even with legal
production, indoor cultivation still has advantages. Growers have full control over
environmental factors, the ability to grow year round, and many feel it results in a better
final product with higher THC levels (Knight et al. 2010 p. 37; Mills, 2012 p.58; Warren,
2015 p. 401). For example, the ability to block pollination through the removal of male
cannabis plants and to manipulate light to simulate the seasonal changes required by the
sinsemilla technique can be achieved only through indoor cultivation. In addition, while
cannabis would naturally complete its life -cycle over the course of one year (Cervantes,
2006 p.2), the sinsemilla technique shortens the cannabis plant growth cycle to mere
months by restarting at the clone stage rather than from the seed. The shortened harvest
cycles made possible by indoor cannabis production results in the ability to produce more
cannabis per year and a product high in THC (Pijlman et. al 2005 p. 178; Decorate, 2009
p. 271), the ultimate goal for a recreational cannabis grower.

14
While indoor cultivation offers a high level of regulation for cannabis production,
variations among THC levels remain difficult to fully control. In a 2010 study, Knight et
al. (2010) found there to be “considerable” variation in THC levels among cannabis
plants even within the same crop (p. 41). The authors postulate the cause of such
variation may be due to the “narrow window of time in which a flower is in peak
condition. They will all mature at slightly different rates and be in different stages of
“ripeness” at any given time (Knight, 2010 p.41-42). Despite the lack of uniformity in
ripeness, for the sake of logistics, crops will be harvested all at once, leading to variations
in THC levels, even among flowers of the same harvest (Knight, 2010 p.42). With the
difficulty in obtaining consistently high levels of THC even among the same crop, it
becomes apparent why cannabis growers will invest in the energy intensive sinsemilla
technique to achieve the best possible THC levels in their plants.
Energy Intensity of Indoor Cannabis Production
Based on surveys collected in 2014 from a small number of licensed recreational
cannabis producers in Washington State, electricity demand for recreational cannabis
production ranges between 60 and 160 Average Annual Megawatts3 (Jourabchi, 2014).
The producers surveyed also indicated that in their particular operations, lighting
accounted for 80% of electricity use (Jourabchi, 2014). Mills (2012) estimates lighting
levels associated with indoor cannabis production to be on par with hospital operating
3Average Annual Megawatt, written as aMW, refers to the electricity generated by the continuous production of one megawatt over the course of one year. An average megawatt is equal to 8,760 MW, as there are 8,760 hours in one year (Harrison, 2008).

15
room usage and also notes it is 500 times greater than the “recommended level for
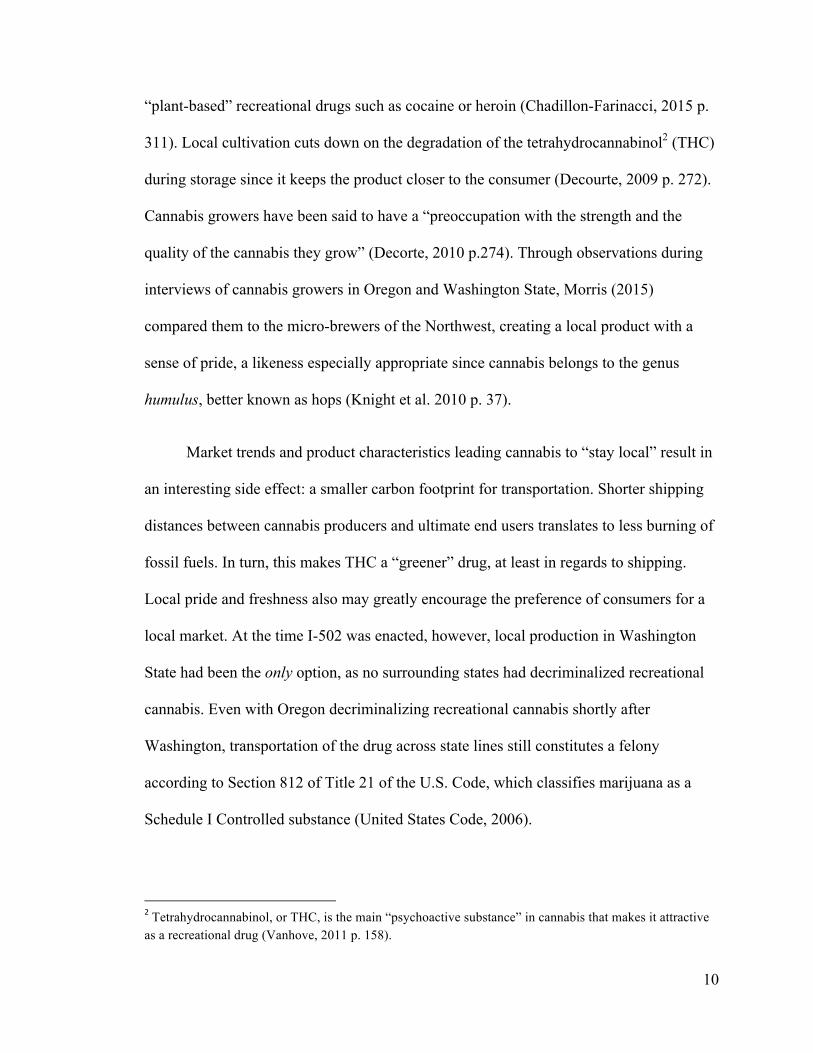
reading” (p.59). As mentioned previously, Mills (2012) created a standard model by
analyzing data from horticultural manufactures, vendors and review of literature rather
than collecting data directly from cannabis growers. Mills’ (2012) analysis assumed full
indoor production and the exclusive use of high intensity discharge lamps (HID) (Fig.
2.1.1). Mills’ (2012) model attempted to provide a general idea of energy requirements
for the types of equipment used in cannabis production such as lights, heating units and
pumps (p. 59). In the real world, however, cannabis cultivation does not have a standard
cultivation method.
The lack of standardization presents challenges in estimating load demand for
cannabis production. With no standard method for cultivation, some operations will be
much more energy intensive than others. To better estimate future load demand and
identify energy conservation and efficiency potential, a broader range of operations need
to be analyzed for their methods and corresponding energy consumption patterns.
16
Table 2.1.1: Mills’ (2012) electrical energy model for cannabis production (p. 65).
Ta
ble
A3
En
erg
ym
od
el.
ELE
CT
RIC
ITY
En
erg
yty
pe
Pen
etra
tio
nR
atin
g(W
atts
or
%)
Nu
mb
ero
f4!
4!
8-f
tp
rod
uct
ion
mo
du
les
serv
ed
Inp
ut
ener
gy
per
mo
du
leU
nit
sH
ou
rs/d
ay(l
eaf
ph
ase)
Ho
urs
/day
(flo
wer
ph
ase)
Day
s/cy
cle
(lea
fp
has
e)D
ays/
cycl
e(fl
ow
erp
has
e)k
W/h
/cy
cle
kW
/h/y
ear
per
pro
du
ctio
nm
od
ule
Lig
ht
Lam
ps
(HP
S)el
ect
10
0%
1,0
00
11
,00
0W
12
60
72
03
,36
9B
alla
sts
(lo
sses
)el
ect
10
0%
13
%1
13
0W
12
60
94
43
8La
mp
s(M
H)
elec
t1
00
%6
00
16
00
W1
81
81
94
91
0B
alla
st(l
oss
es)
elec
t1
00
%0
17
8W
18
18
25
11
8M
oto
rize
dra
ilm
oti
on
elec
t5
%6
10
.3W
18
12
18
60
01
Co
ntr
oll
ers
elec
t5
0%
10
10
1W
24
24
18
60
29
Ven
tila
tio
nan
dm
ois
ture
con
tro
lLu
min
are
fan
s(s
eale
dfr
om
con
dit
ion
edsp
ace)
elec
t1
00
%4
54
10
45
W1
81
21
86
04
72
22
Mai
nro
om
fan
s—
sup
ply
elec
t1
00
%2
42
83
0W
18
12
18
60
31
14
5M
ain
roo
mfa
ns
—ex
hau
stel
ect
10
0%
24
28
30
W1
81
21
86
03
11
45
Cir
cula
tin
gfa
ns
(18
’’)el
ect
10
0%
13
01
13
0W
24
24
18
60
24
21
,13
4D
ehu
mid
ifica
tio
nel
ect
10
0%
1,0
35
42
59
W2
42
41
86
04
84
2,2
67
Co
ntr
oll
ers
elec
t5
0%
10
10
1W
24
24
18
60
29
Spac
ehea
to
rco
oli
ng
Res
ista
nce
hea
to
rA
C[w
hen
lig
hts
off
]9
0%
1,8
50
10
16
7W
61
21
86
01
38
64
5C
arb
on
dio
xid
eIn
ject
edto
Incr
ease
foli
age
Par
asit
icel
ectr
icit
yel
ect
50
%1
00
10
5W
18
12
18
60
52
4A
C(s
eeb
elo
w)
elec
t1
00
%In
-lin
eh
eate
rel
ect
5%
11
51
00
.6W
18
12
18
60
13
Deh
um
idifi
cati
on
(10
%ad
der
)el
ect
10
0%
10
40
26
W1
81
21
86
02
71
26
Mo
nit
or/
con
tro
lel
ect
10
0%
50
10
5W
24
24
18
60
94
4O
ther
Irri
gat
ion
wat
erte
mp
erat
ure
con
tro
lel
ect
50
%3
00
10
15
W1
81
21
86
01
98
9R
ecir
cula
tin
gca
rbo
nfi
lter
[sea
led
roo
m]
elec
t2
0%
1,4
38
10
29
W2
42
41
86
05
42
52
UV
ster
iliz
atio
nE
lect
90
%2
31
02
.1W
24
24
18
60
41
8Ir
rig
atio
np
um
pin
gel
ect
10
0%
10
01
01
0W
22
18
60
27
Fum
igat
ion
elec
t2
5%
20
10
1W
24
24
18
60
14
Dry
ing
Deh
um
idifi
cati
on
elec
t7
5%
1,0
35
10
78
W2
47
13
61
Cir
cula
tin
gfa
ns
elec
t1
00
%1
30
52
6W
24
74
20
Hea
tin
gel
ect
75
%1
,85
01
01
39
W2
47
23
10
9E
lect
rici
tysu
bto
tal
elec
t2
,17
41
0,1
71
Air
-co
nd
itio
nin
g1
04
20
W5
83
2,7
26
Lig
hti
ng
load
s1
0W
25
91
,21
2Lo
ads
that
can
be
rem
ote
del
ect
10
0%
1,2
77
10
W2
39
1,1
19
Load
sth
atca
n’t
be
rem
ote
del
ect
10
0%
45
21
0W
85
39
6C
O2
-pro
du
ctio
nh
eat
rem
ov
alel
ect
45
%1
,11
81
7W
18
12
18
60
——
Ele
ctri
city
To
tal
elec
t3
,22
5W
2,7
56
12
,89
8
FUE
LU
nit
sT
ech
no
log
yM
ixR
atin
g(B
TU
/h)
Nu
mb
ero
f4!
4!
8-f
tp
rod
uct
ion
mo
du
les
serv
ed
Inp
ut
ener
gy
per
mo
du
leH
ou
rs/d
ay(l
eaf
ph
ase)
Ho
urs
/day
(flo
wer
ph
ase)
Day
s/cy
cle
(lea
fp
has
e)D
ays/
cycl
e(fl
ow
erp
has
e)G
Jo
rk
gC
O2/c
ycl
eG
Jo
rk
gC
O2/
yea
r
On
-sit
eC
O2
pro
du
ctio
nE
ner
gy
use
pro
pan
e4
5%
11
,17
61
77
07
kJ/
h1
81
21
86
00
.31
.5C
O2
pro
du
ctio
n–4
emis
sio
ns
kg
/CO
22
09
3E
xte
rnal
lyp
rod
uce
dIn
du
stri
alC
O2
5%
10
.00
3li
ters
CO
2/h
r1
81
21
86
00
.62
.7
Wei
gh
ted
-av
erag
eo
n-s
ite/
pu
rch
ased
kg
CO
22
10
E. Mills / Energy Policy 46 (2012) 58–67 65
17
Indoor cannabis agriculture has been classified as one of the “most energy
intensive industries in the U.S.” (Warren, 2015 p. 386). The U.S. Department of Energy
places agriculture as a whole second only to mining in the energy intensity required by
non-manufacturing industries (Belzer, 2014). According to Mills (2012), all cannabis
production accounts for 1% of energy consumption in the United States4 (p. 58). A
Seattle utility reported an estimated 3% expected load growth from recreational cannabis
operations alone (Bade, 2015). Consumption rates could even be much higher in certain
areas. For example, Humboldt County, California, experienced a 50% increase in
electricity consumption after indoor production of cannabis for medical purposes began
in 1996 (Mills, 2012 p. 59). Mills (2012) describes the energy consumption of indoor
cannabis production:
Specific energy uses include high-intensity lighting, dehumidification to remove water vapor and avoid mold formation, space heating or cooling during non-illuminated periods and drying, pre-heating of irrigation water, generation of carbon dioxide by burning fossil fuel, and ventilation and air-conditioning to remove waste heat [generated by the lights] (p.59).
Different climates also affect indoor cannabis production since “space-
conditioning” needs will vary based on the energy demands required to keep the
cultivation space a consistent temperature and humidity (Mills, 2012 p. 59). The concern
of “winter peak demand5” has also been discussed by Jourabchi (2014), who analyzed the
4 Based on official U.S. total cannabis production estimates of 10,000 metric tons annually, one third of which is produced indoors, and Mills’ (2012) model of cannabis production including 4x4x8 cubic foot modules for indoor cultivation producing 4-5 pounds of cannabis and consuming 13,000 kWh per module annually (Mills, 2012 pp. 58-59). The resulting calculations come to just under 20 TW/h/year (terawatts per hour per year), or approximately 1% of national electricity consumption (Mills, 2012 p. 59). 5 “Winter peak demand” refers to the phenomenon where energy consumption rises to meet the heating needs of indoor spaces during the winter months.

18
load demand of one cannabis producer over 24 hours and noted large variations even
from hour to hour, which could be attributed to temperature changes outside throughout
the day, requiring more heating or cooling inside to keep a consistent temperature.
Further energy demand for illegally grown cannabis arises from “noise and odor
suppression” and the use of diesel generators to avoid plugging into the grid, where
energy consumption could be tracked and become conspicuous (Mills, 2012 p.59). Based
on the conditions described above, Mills (2012) estimates the energy intensity of
cannabis production to be 2000 watts per square meter, similar to computer data centers
(p.59). Mills (2012) estimates electrical energy needs to be around 13,000 kWh per year
to produce just 4-5 pounds of (final product) cannabis, which equates to the same amount
of electricity consumed by 29 refrigerators (Mills, 2012 p. 59). The financial cost of such
high energy consumption would seem to be of some concern, but this becomes a moot
point for the growers in the face of high profits6 per pound of harvested cannabis (Morris,
2015).
Energy Efficiency in Indoor Agriculture
Legal production of recreational cannabis on a commercial scale may bring higher
electrical demand, but it would also allow for more precise demand projections. BC
Hydro in British Columbia, Canada, reported 2,618 cases of “electricity theft” between
2006 and 2010, many associated with cannabis cultivation (Warren, 2015 p. 410). Other
6 From January to May 2016, the average wholesale price per pound of cannabis in Washington State ranged from just under $1,600 to $1,800 per pound of cannabis (Cannabis Benchmarks, 2016). At the end of 2015, the average wholesale price per pound of indoor grown cannabis hovered just under $2,000 (Cannabis Benchmarks, 2015).

19
illegal cannabis growers use diesel generators to provide the electricity needed for their
operations. Legal cannabis production, such as that allowed through I-502, eliminates the
need for secrecy and provides growers the opportunity to legitimately connect to the grid
and avoid the use of generators powered by fossil fuels (Warren, 2015 p. 387). I-502 also
allows these operations to be recognized as commercially-operated businesses.
Commercial operations normally have the opportunity to participate in utility-funded
energy efficiency programs. For cannabis producers, however, the situation becomes
complicated.
The assumption that commercial cannabis growers would have access to energy
efficiency programs has one underlying problem: federal dollars often fund many of these
programs. In Washington State, for example, utility run energy efficiency programs often
receive funding from the Bonneville Power Administration, a federal entity. Since
Washington State cannabis growers’ activities remain illegal on the federal level, utilities
may be unable to offer them the benefits of federally-funded energy efficiency programs
(Bade, 2015; Morris, 2015). Utility employees themselves have even expressed concerns
about working with cannabis growers directly for fear of federal repercussions (Walton,
2014). Technically, as a federal agency, Bonneville Power Administration should not
even provide power to a utility that may be used for cannabis production.
Efficiency itself will need to be approached in a specialized way for cannabis
production, as some of the normal strategies for lowering energy consumption could
prove counterproductive. Reducing illumination levels, for example, could result in lower
harvest yields and require more growth cycles to produce the same amount of product.
The result could be no change, or even an increase in energy intensity by weight of

20
cannabis (Mills, 2012). Warren (2015) suggests utilities include growers in energy
efficiency education programs and work to convert their high-intensity lighting to light
emitting diode (LED) bulbs, which provides “three times more light per watt” (p. 411).
Unfortunately, Warren’s suggestion proves problematic. Many growers resist the idea of
LED conversion because they feel the bulbs do not offer the same light penetration into
the cannabis canopy as high-intensity lighting and produce an inferior cannabis product
(Morris, 2015). To attract growers, the benefits of LED grow lamps would need to be
proven.
Another way to conserve energy would be to increase a cannabis grow operation’s
overall production efficiency, not only in equipment but also in cultivation methods and
genetic selection of mother plants. Mills (2012) suggests this based on the observation
that reduced growth cycles may result in lowered overall energy intensity (Mills, 2012
p.59). Vanhove (2011) discovered that indoor cannabis yield depends most significantly
on three factors: plant density, light intensity and variety. While Vanhove (2011) cites
genetic pre-disposition as the most important of these three factors, a grower can
influence their harvest yield to a certain degree with light. A less densely-packed
cannabis canopy, with plants farther apart, allows greater access to light for the whole
plant, increasing photosynthesis rates and resulting in greater production overall. Even
greater yields can be obtained by increasing light levels (Vanhove, 2011 p. 162).
Manipulating lighting will only go so far, however. First and foremost, genetics
determine yield. Vanhove’s (2011) study also found THC concentrations can be
primarily linked to cannabis variety as opposed to cultivation method, with the highest
yielding varieties also producing the highest concentrations of THC (Vanhove, 2011

21
p.162). Vanhove’s (2011) findings contradict popular attitudes among growers and
consumers, who have long felt indoor growing methods with high-intensity discharge
lamps produce the highest THC levels (Mills, 2012 p. 62-63; Morris, 2015). Vanhove
(2011) also agrees the best way for a cannabis producer to increase harvest yield would
be to selectively cultivate the genetically-superior plants for this purpose, as seen with the
sinsemilla technique. Focusing on the importance of genetics could make the argument
for conversion to more energy efficient lighting stronger. A pragmatist would look to
maximize profits by lowering overhead, and if genetics play a larger role in yield, more
efficient lighting may lower costs without impacting yield.
LEDs in particular have select advantages over high intensity discharge (HID)
lamps. LEDs use much less energy than HID lamps, offering the most lumens7 per watt
of any lighting type. LEDs optimized for agriculture can also produce Photosynthetic
Active Radiation8 (PAR) similar to HID lamps, and have a spectral variability the latter
does not (Yeh, 2009 & Morrow, 2008). Normally, a combination of red, blue and green
light spectrums would be used to create the appearance of white light (Yeh, 2009 p.
2176). Plants, however, require only a combination of red and blue light for
photosynthesis. LEDs used in agriculture can be set to produce only these two spectrums
(Yeh, 2009 & Morrow, 2008). Although LEDs already represent the most efficient
lighting type available, those producing only two light spectrums, as opposed to three,
consume even less electricity than full spectrum white lights (Yeh, 2009 p. 2177 &
Morrow, 2008 p. 1948).
7 Units of Measure for visible light or brightness (Energy Star, n.d.). 8 Photosynthetic Active Radiation8 (PAR) can be understood as the light energy absorbed by vegetation for the process of photosynthesis (Gitelson, Peng, Arkebauer, & Suyker, 2015 p. 101).
22
Indoor agricultural operations that utilize spectrally-optimized LED lamps have
sometimes been dubbed “pinkhouses” due to the pinkish hue emitted from the mixing of
red and blue light (Dougcleff, 2013; Meinhold, 2013 & Mitchell, 2014). One such
pinkhouse built by Caliber Biotherapeutics in Texas cultivates expensive crops used for
drugs and vaccines. The fully indoor and tightly controlled operation limits the crop’s
exposure to disease and contamination (Doucleff, 2013). Another pinkhouse in Japan
operated by Toshiba uses similar conditions in an attempt to create the “world’s highest-
quality lettuce.” Toshiba notes their crop also does not require pesticides, since indoor
cultivation allows it to be free of insects (Mitchell, 2014). As commercial cannabis
producers cultivate an expensive crop meant for human consumption, limiting pests,
disease and contamination would be highly valued. All of the operations mentioned here
rely on the energy efficiency and spectral flexibility of LED lamps to make their
operations financially viable. Due to the significantly higher energy requirements of HID
lamps over LED and the financial costs associated with high electrical energy
consumption, the return on investment for the crops in these examples would not be
nearly as high if HID lamps had been used (Dougcleff, 2013; Meinhold, 2013 &
Mitchell, 2014).
Aside from energy efficiency, LED lamps also offer benefits important to indoor
agriculture such as low operating temperatures. LEDs produce much less radiant heat
than HID lamps, which allows them to be placed much closer to the plants themselves
with lower risk of damaging plant tissues. They can even be placed within the plant
canopies, creating better light penetration of the cannabis canopy (Dougcleff, 2013;
Morris, 2015 & Morrow, 2008 p. 1948). As mentioned previously, maximum
23
productivity of the entire plant requires good light penetration of the canopy. LEDs also
have a considerably longer operating life when compared to incandescent bulbs such as
HID lamps (Yeh, 2009 p. 2176 & Morrow, 2008 p. 1949). Despite the higher initial costs
often associated with installing an LED system, the longer lifespan of LEDs still creates a
high return on initial investment when combined with the reduced energy costs.
With any business, reducing operating costs such as those associated with energy
consumption becomes important in the pursuit of maximizing net profit. Based on
estimates found in the available literature, lighting used for indoor cannabis production
may account for up to 86% of total energy consumption required for such an operation
(Arnold, 2013; Mills, 2012 & Jourabchi, 2014). While energy efficiency measures could
be targeted at any of the equipment used in cannabis production, due to its high
percentage of overall energy consumption, focusing on grow lighting would most likely
result in the greatest reduction in electrical energy consumption for these operations. If
cannabis producers in Washington State switched to LED systems, not only would they
stand a greater chance of increasing their profit, but the electrical load demand within the
state could be significantly lowered. The significance of this possibility becomes clear
when framed by the importance of energy conservation goals set forth by the Washington
State Legislation, which will be discussed in more detail in the next section.

24
2.2 WASHINGTON STATE ENERGY LEGISLATION & PLANNING
Significance of Energy Conservation
Amid growing concerns relating to anthropogenic climate change, lowering CO2
emissions has become vital. If the state takes no action, the Washington State Department
of Ecology estimates managing the impacts of climate change will cost Washingtonians
nearly $10 billion annually by the year 2020 as a result of “increased health costs, storm
damage, coastal destruction, rising energy costs, increased wildfires, drought, and other
impacts” (Washington State Department of Ecology, 2012, p. 3). In 2015, the U.S.
generated 67% of its power from fossil fuels, emitting still more CO2 into the atmosphere
(U.S. Energy Information Administration, 2016). In contrast, Washington State generates
just over 70% of its power from hydroelectricity alone and only about 11% from fossil
fuels9 (U.S. Energy Information Administration, State Energy Data System, 2016). Based
on these percentages, using electricity more efficiently may not curb CO2 emissions in
Washington State as much as in other areas of the country, but efficiency remains vital
for managing load demand.
The Pacific Northwest relies heavily on the acquisition of energy efficiency, cited
as the “single largest contributor to meeting the region’s future electricity needs”
(Northwest Power and Conservation Council, 2016 p. 1-1 )10. As electrical load demand
grows, energy efficiency helps to balance the load by doing more with less, reducing the
need for increased generation capacity. Energy efficiency also remains the most
9 At time of this writing in 2016. 10 Includes Washington, Oregon, Idaho & Montana in the context of the Northwest Power and Conservation Council’s Seventh Power Plan (Northwest Power and Conservation Council, 2016).

25
cost-effective method of meeting load demand, costing half of any other resource11
(Northwest Power and Conservation Council, 2016 p. 1-7). For all the reasons cited
above, many utilities have invested in energy efficiency within their service territory for
some time. Initiative 937 (the Washington State Energy Independence Act) helps to
further drive energy efficiency through conservation (defined as reduced consumption
resulting from the increases in the efficiency of energy use, production or distribution)
and increased power generation from renewable resources (Energy Independence Act, I-
937, 2006).
The Washington State Energy Independence Act: Initiative 937
The Washington State Energy Independence Act (I-937) focuses primarily on the
17 largest utilities in Washington State, which provide 81% of the state’s electricity to
date (Energy Independence Act, I-937, 2006). Initiative 937 seeks to increase the
electricity derived from new renewable resources within Washington State to 15% by the
year 2020. Under this Act, renewable resources can be defined as water, wind, solar,
geothermal, landfill/sewage treatment gas, wave, ocean or tidal power and biodiesel “not
derived from crops raised on land cleared from old growth or first-growth forests”
(Energy Independence Act, I-937, 2006 pp. 3-4). Because a major portion of electricity
generation in Washington state originates from hydroelectric dams (US Energy
Information Administration, 2013), additional definitions for “eligible renewable
resource” have been included in the Energy Independence Act. Renewable energy must
not be from a facility powered by fresh water except in the form of improvements to
11 The Northwest Power and Conservation Council considers the acquisition of energy efficiency a “resource” in meeting load demand just they consider the generation capacity of natural gas, wind, solar or geothermal resources (Northwest Power and Conservation Council, 2016).

26
existing hydroelectric projects resulting in increased electricity generation (Energy
Independence Act, I-937, 2006 pp. 2-3).
Initiative 937 also requires qualifying utilities to complete, and make publicly
available, biennial conservation potential assessments and set energy conservation goals
for the succeeding two years (Energy Independence Act, I-937, 2006 pp. 2-3). Under I-
937, “conservation” has been defined as “any reduction in electric power consumption
resulting from the increases in the efficiency of energy use, production or distribution”
(RCW Chapter 19.285.030, 2006). Conservation methods must also be “cost effective
and achievable,” meaning they must not cost more than they save (Energy Independence
Act, I-937, 2006 pp. 4). Failure to meet conservation goals will result in an administrative
penalty of $50 per megawatt hour shortfall (adjusted annually for inflation). Utilities who
suffer the penalty will also be required to notify their customers of the size of the
financial fine and reasons the penalty was incurred (Energy Independence Act, I-937,
2006 p. 8). The requirements and penalties handed down by I-937 help drive energy
conservation and acquisition of renewable resources in Washington. The context in which
the goals of I-937 must be met, however, will always be in a state of flux. The energy
needs of Washington State, as with that of every region, shift over time. For this reason,
the Northwest Power and Conservation Council creates the Pacific Northwest region’s
energy plan to take into account current and projected conditions.
The Northwest Power and Conservation Council’s Seventh Power Plan
In 1980, the U.S. Congress passed the Northwest Power Act, which resulted in the
formation of the independent Northwest Power and Conservation Council (NWPCC).

27
The NWPCC works to create a Pacific Northwest power plan to help ensure the stability
of the region’s power supply (in its seventh iteration at the time of this writing) that
extends to the states of Washington, Oregon, Idaho and Montana. (Northwest Power and
Conservation Council, 2015 p. 4). The Northwest Power Act also set a priority for energy
efficiency, deeming it an important resource in meeting load demand. Under the
NWPCC’s power plans, through energy efficiency, utilities in the region have gained the
“equivalent of more than 5,900 average megawatts of electricity,” tantamount to the
power needed for “five cities the size of Seattle” (Northwest Power and Conservation
Council, 2015 p. 4). To continue making such impressive efficiency gains, the NWPCC
must constantly weigh all potential causes for increases in load demand. Different types
of load can necessitate different strategies for conservation; adding insulation to a home,
for example, would not reduce electricity consumed by lighting. The NWPCC must also
consider how new industries will affect load and what conservation strategies may work
for that particular industry. Not surprisingly, load growth related to “indoor agriculture”
appeared in the Seventh Power Plan as a response to the legalization of commercial
cannabis markets in Washington and Oregon. It had been absent in all prior plans
(Northwest Power and Conservation Council, 2016 p. 2-6)
The NWPCC estimates electrical load demand increases of 100-200 megawatts12
over twenty years due to the legalization of cannabis production in these two states
(Northwest Power and Conservation Council, 2016 p. 2-6). As discussed earlier, a
minimal amount of data regarding the energy intensity of cannabis production exists. In
light of this, the 12 In 2014, the average residential home in Washington State consumed about 12MW of electricity for the year (U.S. Energy Information Administration, 2015).

28
Seventh Power Plan does not offer guidance for reducing the energy consumption of
these operations, but rather states the NWPCC will simply monitor and work to forecast
future loads and develop “best practice guides” for increasing efficiency in indoor
agriculture (Northwest Power and Conservation Council, 2016. p. 17-4). The hedged
language regarding cannabis production within the Seventh Power Plan may be due to the
fact that, while legal in Oregon and Washington, recreational cannabis production
remains illegal in Idaho and Montana, the two other states covered by the Northwest
Power and Conservation Council, as well as at the federal level.
2.3 RECREATIONAL CANNABIS LEGISLATION: THE FEDERAL STANCE VS. WASHINGTON STATE
Federal Stance Regarding Recreational Cannabis
Officially, at the time of this writing, the U.S. Federal government still considers
cannabis a schedule 1 drug, defined as having “a high potential for abuse” with no
“accepted medical use” and “lack of accepted safety for use…under medical supervision”
(United States Code, 2006). As of today, close to half of U.S. states have legalized or
decriminalized “cannabis-related conduct.” The Federal government has responded by
removing funding for enforcement of federal laws against those acting within legal
grounds according to their state (Warren, 2015 p. 398). Despite this, the U.S. Department
of Justice maintains the ability to prosecute anyone participating in the production,
consumption or distribution of cannabis. In 2013, in light of state initiatives legalizing
marijuana and regulating its production, processing and sale, Deputy Attorney General

29
James Cole of the U.S. Department of Justice issued a memo to provide further guidance
regarding marijuana laws. The memo lists eight priorities for enforcement:
1. Preventing the distribution of marijuana to minors;
2. Preventing revenue from the sale of marijuana from going to criminal enterprises, gangs, and cartels;
3. Preventing the diversion of marijuana from states where it is legal under state law in some form to other states;
4. Preventing state-authorized marijuana activity from being used as a cover or pretext for the trafficking of other illegal drugs or other illegal activity;
5. Preventing violence and the use of firearms in the cultivation and distribution of marijuana;
6. Preventing drugged driving and the exacerbation of other adverse public health consequences associated with marijuana use;
7. Preventing the growing of marijuana on public lands and the attendant public safety and environmental dangers posed by marijuana production on public lands; and
8. Preventing marijuana possession or use on federal property.
(U.S. Department of Justice, 2013)
The U.S. Department of Justice has stated that jurisdictions that have allowed
regulation of marijuana activity “must demonstrate the willingness to enforce their laws
and regulations in a manner that ensures they do not undermine federal enforcement
priorities” (Dept. of Justice, p. 2-3 2013). Essentially, rather than micromanaging
marijuana laws, the Federal Government has put enforcement in the hands of states that
legalize and regulate marijuana’s use and production, with the expectation they will not
allow this activity to interfere with federal priorities.

30
Washington State Cannabis Production
The Washington State Liquor and Cannabis Board13 issues licenses for cannabis
producers, obliging them to remain compliant with the state’s Environmental Policy Act.
Cannabis producers must obtain environmental permits for water quality, air quality,
chemigation and fertigation14 as well as the handling of solid and hazardous wastes
(Washington State Liquor Control Board, 2013 Outdoor, Indoor & Greenhouse Producers
guides). Initiative 502 also allows local governments to set even more restrictive zoning
and licensing rules (I-502, 2012), including building codes relating to energy.
(Washington State Liquor Control Board, 2013 Outdoor, Indoor & Greenhouse Producers
guides). Fragmented local regulation provides for some interesting opportunities. For
example, Warren (2015) points out that local governments could require cannabis
producers to use clean energy technology such as solar panels to meet their energy
demands, however, none have done so as of this writing (p. 424).
State energy code, to the contrary, allows an exception for the energy usage of
indoor agricultural lights. Normally, according to code, the square footage and type of
building dictates the sum of watts that can be used for all connected interior lighting in
that space (WAC 51-11 C405.5.1.1- C405.5.1.4 2016). Multiple exceptions exist under
the code, including “task lighting for plant growth or maintenance” that allows
permissible wattage levels to be exceeded in spaces engaging in indoor agriculture (WAC
51-11 C405.5.1, 2016). The exemption for plant growth means spaces used for cannabis
13Originally the Washington State Liquor Control Board, the name was changed to the Washington State Liquor and Cannabis Board following the passage of I-502.14Chemigation and fertigation in this context relates to “the application of fertilizers and/or pesticides through an irrigation water system” (Washington State Liquor Control Board, 2013 Outdoor, Indoor & Greenhouse Producers guides).

31
production have no limitation on energy consumption resulting from agricultural lights.
Summary
Through the reviewing literature relating to the energy intensity of cannabis
production, it becomes apparent that many factors push cannabis producers in the United
States to grow indoors. Justifications arise from all angles: security, the historically
illegal nature of cannabis cultivation, the science of efficient cultivation and the long-held
beliefs of growers about the best way to achieve high THC levels. Indoor cannabis
cultivation also happens to be extremely energy intensive due to the lights and
environmental controls used. Lighting alone appears to account for the largest portion of
this energy intensity (Arnold, 2013 & Jourabchi, 2014). These factors and the limited
data available on the energy intensity of cannabis production underscore the importance
of studying indoor cultivation in terms of its actual energy consumption and energy
efficiency potential.
The available literature has guided the direction of this thesis project toward a
deeper investigation of agricultural lighting used in indoor cannabis production. In an
attempt to advance this pool of knowledge; the following chapters will explore the
lighting used by a select number of commercial cannabis producers in Washington State.
The subsequent section will outline the methods used for this study, including sampling
design, data collection, and overview of analyses preformed. Finally, the results of this
study will be presented, followed by recommendations for energy efficiency and future
research.

32
CH. 3 METHODS
3.1 STUDY OBJECTIVES
The main objective of this thesis has been to better understand the energy intensity
associated with commercial cannabis in Washington State. In reviewing literature relating
to indoor cannabis production, the focus of the research was also guided by a common
thread identifying agricultural lighting as the most energy intensive factor during
cultivation. The secondary objective of this thesis is discovering potential conservation
opportunities in alignment with I-937.
Previous research on the energy intensity of cannabis production was often based
on findings from illegal operations or cultivation for medical use (Arnold, 2013; Mills
2012). Mills (2012) based his estimates on trade media, open literature and interviews
with suppliers of horticultural equipment but did not work with cannabis producers
directly. Arnold (2013) studied medical cannabis producers which obtain licensing per
plant, resulting in much smaller operations than recreational producers who can have up
to 30,000 square feet of cannabis plant canopy depending on their license (Washington
State Liquor and Cannabis Board, 2015). Neither Mills’ (2012) or Arnold’s (2013)
approach adequately addresses large-scale commercial cannabis production. The
intention of this study is to address the commercial scale and to examine variations in
agricultural lighting practices among these cannabis producers.

33
3.2 RESEARCH DESIGN & DATA COLLECTION
To gain initial insight into indoor cannabis agriculture, informal interviews were
conducted with individuals from the Washington State Department of Commerce and the
Northwest Power and Conservation Council (NWPCC). Massoud Jourabchi, Manager of
Economic Analysis for the Northwest Power and Conservation Council, provided
anonymous survey data collected in 2015 about the energy consumption of 17
commercial cannabis producers in Washington. New surveys created for this thesis were
based on Jourabchi’s design in an attempt to generate new data compatible with the
NWPCC data collected in 2015 and to increase the overall sample size. The surveys were
also cleared through The Evergreen State College Human Subjects Review board before
data collection began. Content from both surveys can be found in Appendix A.
The survey sampling frame was generated by retrieving data from the Washington
State Liquor and Cannabis Board’s (WSLCB) map of commercial cannabis producers in
Washington State, to add reassurance that producers surveyed would be legal operations
(Washington State Liquor Board, 2015). Contacts for producers who had previously
participated in the NWPCC survey were removed from the resulting list along with
duplicates, as were those without an email address. The final list consisted of 132
Washington State commercial cannabis producers. Due to time, labor, and funding
constraints, email became the chosen mode of delivery for participation requests.
Surveys developed for this thesis were distributed to these cannabis producers via
the website SurveyMonkey (SurveyMonkey Inc., 2016). A link embedded in the email
sent to prospective participants provided access to the online survey (See Appendix B).
Tools available through the email marketing service MailChimp were used in the design

34
and automated distribution of the emails (MailChimp, 2016). The initial distribution of
emails occurred on Monday, January 18, 2016. A second, reminder email was distributed
on Monday, February 8, 2016. Data collection concluded on February 20, 2016, with a
total of 11 responses out of the132 potential participants who had been sent the survey.
Survey responses remained anonymous in the hope this would put cannabis producers at
ease about revealing their “lighting recipes” – often viewed as a trade secret in this
community (Morris, 2015).
3.3 STUDY OVERVIEW
As illustrated by Mills’ (2012) research, many different components go into indoor
cannabis production including: heating, cooling and ventilation systems; dehumidifiers;
irrigation pumps; CO2 injectors; and, of course, lamps for artificial lighting conducive to
agricultural needs (pp. 60 & 65). The analyses conducted for this thesis focused on the
use of artificial light in particular. Cervantes (2006) demonstrated how producers use
light in cannabis cultivation with a description of the sinsemilla technique as outlined in
Chapter 2.
The sinsemilla technique allows cannabis producers to skip the germination and
seedling growth stages once quality mother plants have been established, since future
crops will be derived from the cuttings of these plants (Cervantes, 2006). The vegetative
and flowering stages will then be the only stages of cannabis growth cycled through by
established producers. Cannabis producers will keep plants in these two stages, separated
due to differing periods of light and darkness or “photoperiods” (Cervantes, 2006 &

35
Morris, 2015). The areas containing plants in either the vegetative or flowering stage will
be referred to as “Vegetative” and “Flowering” rooms respectively. The area square
footage of cannabis itself is referred to as the “canopy,” in alignment with the language
used by the Washington State Liquor and Cannabis Board in their description of producer
licenses (Washington State Liquor Control Board, 2013).
Assumptions used in the analyses of data for this thesis can be found in Appendix
C. These analyses have been broken down into five categories for greater ease of
reporting:
1. Reported types of cannabis production operations. 2. Lighting types used for both Vegetative and Flowering rooms. 3. Photoperiods used for the Vegetative and Flowering cycles. 4. Light density, or number of lights used per square foot of cannabis canopy. 5. Annual energy intensity per square foot of cannabis canopy.
The first category focused on the type of operation: outdoor or indoor. These
samples included 11 responses from surveys collected specifically for this thesis as well
as 14 from the 2015 NWPCC data set. The samples collected for this thesis project did
not specifically exclude any particular operation type, as data retrieved from the WSLCB
website did not identify this information, meaning the sampling frame included all
operation types. Conversely, the NWPCC data collection focused specifically on indoor
cannabis production, although a number of other operation types had been reported such
as outdoor and greenhouse. The mix of multiple operation types reported in a study
focused on indoor operations makes the operation type important data to consider,
because it could mean cannabis producers do not necessarily prefer indoor operations as
the literature suggests. Due to the differing nature of data collection for this thesis project

36
and the NWPCC research, these sample sets have been analyzed separately.
The next category of analysis involved examining lighting types used by each
survey respondent. First, all lighting types were grouped by the room (either Vegetative
or Flowering) as reported by survey respondents. Lights were further organized by basic
type, e.g., High Pressure Sodium (HPS) lights with either magnetic or electronic ballasts
have been placed into the “HPS” category. Ballasts could not be taken into consideration
for this study because too few cannabis producers reported this information. When
producers reported using combinations of lighting types, their samples were tallied under
multiple lighting types as well as the “combination” category. In this way, an accurate
figure as to the proportion of respondents using each lighting type or a combination of
types could be determined. Percentages were calculated to help conceptualize which
portion of the whole sample set use each lighting type.
In addition to lighting types used, photoperiods were also analyzed. Photoperiods
denote the hours per day lights in Vegetative and Flowering rooms run during a crop
cycle. After removing responses containing no or ambiguous photoperiod data, 16
samples remained for Vegetative rooms and 14 for Flowering. Surveys developed for this
thesis project also asked respondents to provide information on the weeks per year (then
converted to days per year for analysis) each photoperiod would be active, thus a portion
of the total samples also include this data (n=5 for Vegetative rooms and n=3 for
Flowering rooms).
Light density was analyzed by comparing reported square foot of cannabis canopy
cover served by each light. Some samples did not directly report this data but did report

37
number of lights used in addition to square foot of canopy cover. From these data, square
foot of canopy cover per light could be calculated. Samples with ambiguous data or
lacking enough data to calculate lighting densities were also removed from the final
sample set. The data was then separated by Vegetative and Flowering rooms and lighting
densities calculated.
Calculating the lighting energy intensity per square foot of cannabis canopy was a
multi-step process. The first step included removing samples from the data set that did
not provide enough data, or contained conflicting/ambiguous information that would not
allow for an Energy Use Intensity calculation15. In the NWPCC data set, numbers of
lamps used by producers were not reported directly but still could be deduced based on
the square footage of cannabis canopy served by each lamp and the total square footage
of said canopy. The number of lamps used was then multiplied by the reported wattage
for each lamp. The resulting number represented the total wattage of lamps used by each
respondent in both Vegetative and Flowering rooms. The NWPCC did not collect
information regarding the number of days per year reported photoperiods were active. To
compensate for this, annual photoperiod lengths have been inferred based on the median
days reported in the data collected from the additional cannabis producers surveyed for
this thesis. Lastly, a canopy cover EUI could be calculated from kWh per year and total
canopy square footage for both Vegetative and Flowering rooms.
15Site energy use intensity or “EUI” is calculated by dividing the total energy consumed by a building in one year by the total square footage of floor area for that building (Energy Star, n.d.).

38
CH. 4 RESULTS & DISSCUSSION
In 2012, voters in Washington voted to legalize the recreational use of cannabis.
With this decision, the state’s commercial cannabis industry was established. The
available literature has shown that, due to the need for specialized equipment,
commercial cannabis production has the potential to be extremely energy intensive. The
overarching goal of this thesis project has been to better understand the energy intensity
of operations in Washington State. Of the equipment used by cannabis producers, the
literature shows a tendency for specialized grow lighting to consume the largest share of
energy. For this reason, this thesis has focused on this particular aspect of cannabis
production.
To investigate the energy intensity associated with grow lighting used in cannabis
production, the data collected for this thesis project has been analyzed in five different
ways. First, variations in the use of indoor, outdoor, greenhouse and combinations of
such operations were explored to better understand the equipment choices made by each
cannabis producer. Next, lighting types used by the respondents were investigated,
followed by reported photoperiods. Finally, the density of lights found serving each
respondent’s canopy cover were identified and an Energy Use Intensity16 (EUI) based on
this density was calculated.
16Site energy use intensity or “EUI” is calculated by dividing the total energy consumed by a building in one year by the total square footage of floor area for that building (Energy Star, n.d.).

39
4.1 VARIATION IN CANNABIS PRODUCTION OPERATIONS
According to the literature reviewed, whether or not a cannabis production
operation utilizes primarily indoor or outdoor cultivation methods can dramatically
impact the energy intensity of the operation. The root of this discrepancy lies in the
equipment needed for each cultivation method. As discussed previously, indoor cannabis
production can be highly energy intensive due to the need for specialized lighting,
heating, cooling, dehumidification and other systems. On the other hand, cannabis
operations that primarily grow outdoors and follow natural seasonal patterns take
advantage of natural light and environmental conditions. The need for the aforementioned
equipment (and the accompanying energy intensity) is virtually removed from the
equation.
While the sample frame developed for this thesis project did not exclude
non-indoor growers due to the inability to filter them out during the development of the
survey recipient list, the participation request letter did reference “grow lighting”
specifically (Appendix B). That reference may have discouraged participation from
non-indoor cannabis producers. While indoor cannabis production operations do
represent the largest portion of respondents (28%, n =11) for this project, combinations of
production operations together represent the majority (54% in total, n = 11). Combination
operations for this sample included cannabis producers growing cannabis in the following
settings: outdoor/indoor (27%), greenhouse/outdoor (9%) and greenhouse/outdoor/indoor
(18%) (Fig. 4.1.1).

40
Fig. 4.1.1: Operation types reported by commercial cannabis producer respondents for this project (n=11).
In contrast to the sample frame developed for this thesis project, the frame
developed by the NWPCC did attempt to focus data collection exclusively on indoor
cannabis producers (Jourabchi, 2014). Unsurprisingly, the majority of respondents
reported exclusively indoor growing practices (65%, n=14). Respondents reporting
growing cannabis in a combination of settings represented 14% (n=14) and were
identified as greenhouse/outdoor/indoor (Fig. 4.1.2). Still others reported strictly outdoor
and greenhouse growing respectively (Fig. 4.1.2).
The variation in these results is noteworthy because even though both studies
focused on indoor cannabis production, outdoor operations and combinations appear in
the data. While not a representative sample, these results raise interesting questions. The
literature implies indoor growing practices dominate, so why the variation in the results?
The legalization of recreational cannabis may influence how the product is grown.
Existing literature discusses cannabis production in the context of illicit operations, which

41
by their nature necessitate the need for secrecy to avoid discovery, often leading to indoor
production. In Washington, legalization may be opening the door to outdoor cultivation
as well as an expansion of indoor production.
Another key point made in the existing literature supporting indoor cannabis
cultivation regards the efficiency of crop production. Indoor production offers the ability
to produce a crop year round. With any business, the push to lower overhead and increase
profits require cost-saving measures. Commercial cannabis production would ostensibly
be no different. The use of natural light could be viewed as one such cost-saving
measure.
Cannabis producers located in regional climates with weather favorable to
agriculture could potentially grow their crop outdoors during the appropriate seasons and
indoors the remainder of the year. A hybrid system would give them the dual benefit of a
year-round crop while still reducing annual total energy consumption. Of course, in some
areas this method would be inappropriate due to a lack of suitable agricultural land,
Fig. 4.1.2 Operation types reported by commercial cannabis producers interviewed by the NWPCC in 2015 (n=14).
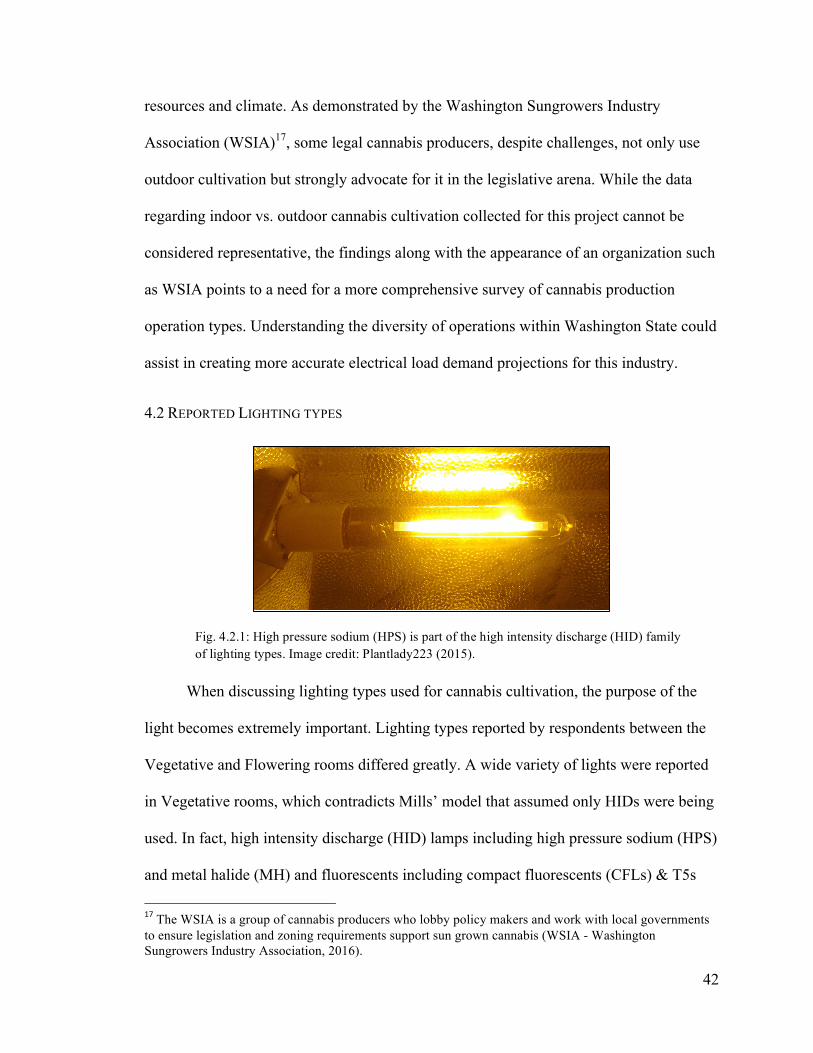
42
resources and climate. As demonstrated by the Washington Sungrowers Industry
Association (WSIA)17, some legal cannabis producers, despite challenges, not only use
outdoor cultivation but strongly advocate for it in the legislative arena. While the data
regarding indoor vs. outdoor cannabis cultivation collected for this project cannot be
considered representative, the findings along with the appearance of an organization such
as WSIA points to a need for a more comprehensive survey of cannabis production
operation types. Understanding the diversity of operations within Washington State could
assist in creating more accurate electrical load demand projections for this industry.
4.2 REPORTED LIGHTING TYPES
When discussing lighting types used for cannabis cultivation, the purpose of the
light becomes extremely important. Lighting types reported by respondents between the
Vegetative and Flowering rooms differed greatly. A wide variety of lights were reported
in Vegetative rooms, which contradicts Mills’ model that assumed only HIDs were being
used. In fact, high intensity discharge (HID) lamps including high pressure sodium (HPS)
and metal halide (MH) and fluorescents including compact fluorescents (CFLs) & T5s
17The WSIA is a group of cannabis producers who lobby policy makers and work with local governments to ensure legislation and zoning requirements support sun grown cannabis (WSIA - Washington Sungrowers Industry Association, 2016).
Fig. 4.2.1: High pressure sodium (HPS) is part of the high intensity discharge (HID) family of lighting types. Image credit: Plantlady223 (2015).

43
were actually being used at an equal rate (50% with each type totaled). Fluorescent T-5
lighting held the highest percentage of use in Vegetative rooms at 38% (n=16). Another
12% (combined) reported using CFLs or simply “fluorescent” and 13% reported using
LEDs (Fig. 4.2.5).
The high usage of T-5 lighting as well as other fluorescents and LEDs could
indicate a willingness to use more efficient lighting types during the vegetative growth
cycle. However, a large number of respondents did report the use of HPS lamps (31%) in
their Vegetative rooms, showing the popularity of more energy intensive lighting still
shows itself in these areas (Fig. 4.2.5). That being said, 25% reported using a
combination of lighting types (Fig. 4.2.5), all of which included a HID type lamp
supplemented with a fluorescent type which could show a desire to reduce overall energy
usage with the use of some energy efficient lighting rather than a full HID system.
Fig. 4.2.2: Metal Halide (MH) lamp halfway through warm up. Photo Credit: David H. (2008)
Fig. 4.2.3: Compact Fluorescent (CFL). Image Credit: Sun Ladder (2012)
Fig. 4.2.4: T5 Fluorescent lamp. Photo Credit: Taube (2006)

44
In contrast to the variety of lighting types used in Vegetative rooms, at 76.92%
(n=13) HPS dominated by far as the primary lighting type used in Flowering rooms (Fig.
4.2.6). Such extreme disparity may exist for several reasons. First, the budding flower of
the cannabis plant is the final crop and therefore the most valuable part of the plant. The
flowering period of the crop cycle can make or break a harvest. The literature reports an
overwhelming preference for HID lamp types in the history of cannabis cultivation.
These lamps have been the tried and true choice of indoor cannabis producers.
Commercial cannabis producers may not be willing to risk their success by
experimenting with other lighting types.
Fig. 4.2.5: Reported lighting types used in sampled Vegetative rooms n=16. Several samples are represented more than once due to the use of multiple lighting types, thus the percentage using a combination of lighting types has also been included.

45
The preference for HID lamps most likely lies in the need for optimal
photosynthetically active radiation (PAR) during flowering. Lamps such as HPS and MH
offer both optimum PAR and luminous efficacy needed for plant growth (Arnold, 2013 p.
77). While more energy efficient than HID lamps, fluorescents offer less luminous
efficacy and PAR than HID lamps (Arnold, p. 55 2013), which may explain their low
usage in Flowering rooms. Despite being the most energy-efficient lighting type, LED
lights offering comparable PAR to HID lamps have become economically viable for less
than a decade (Yeh & Chung, 2009).
At 15%, the reported usage of LED lamps in the data set falls well below that of
HPS lamps. However, they do come in second as the highest reported lighting type (Fig.
Fig. 4.2.6: Reported lighting types used in sampled Flowering rooms n=13. Several samples are represented more than once due to the use of multiple lighting types, thus the percentage using a combination of lighting types has also been included.

46
4.2.6). It would seem some cannabis producers are breaking away from the old standard
of HPS in favor of LEDs. Among survey respondents still resistant to the idea of LEDs,
three cited the high cost of LED systems as a determining factor and two expressed
concern over attempting new strategies that could put their success in jeopardy (n=5).
These statements also echo the findings of Morris (2015). It would appear more time may
be needed to prove the viability of LEDs, and the technology also needs to reach a lower
price point before they will be widely accepted.
4.3 PHOTOPERIODS
Lighting types used by commercial cannabis producers offer only a partial picture
of the energy intensity associated with grow lighting. The photoperiods (light and dark
periods) will determine how much power each lamp will draw daily. If the yearly cycles
are included, an annual kWh consumption can also be calculated. For cannabis
production, the photoperiod will depend on the phase of cultivation: Shorter photoperiods
are needed to mimic fall and induce flowering. Therefore, Vegetative and Flowering
rooms must be analyzed separately.
As outlined in Chapter 2, the vegetative phase generally uses a photoperiod of
16 - 24 hours. In accordance with this, survey respondents for this project as well as the
NWPCC study reported a range of hours from 12 - 24, with a median of 18 hours of light
per day (n=16, Table 4.3.1). The literature review also shows the flowering phase
generally requires 12 hours of light and 12 of darkness, which is in alignment with the
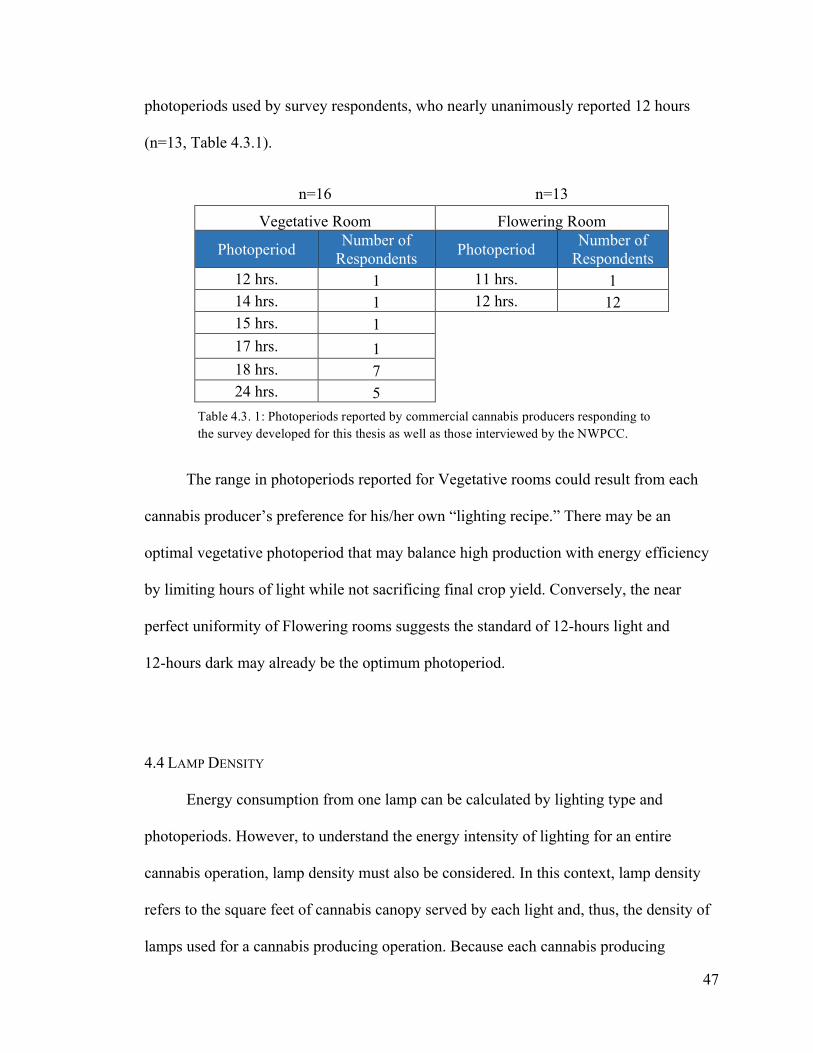
47
photoperiods used by survey respondents, who nearly unanimously reported 12 hours
(n=13, Table 4.3.1).
n=16 n=13
Vegetative Room Flowering Room
Photoperiod Number of Respondents Photoperiod Number of
Respondents 12 hrs. 1 11 hrs. 1 14 hrs. 1 12 hrs. 12 15 hrs. 1
17 hrs. 1 18 hrs. 7 24 hrs. 5
The range in photoperiods reported for Vegetative rooms could result from each
cannabis producer’s preference for his/her own “lighting recipe.” There may be an
optimal vegetative photoperiod that may balance high production with energy efficiency
by limiting hours of light while not sacrificing final crop yield. Conversely, the near
perfect uniformity of Flowering rooms suggests the standard of 12-hours light and
12-hours dark may already be the optimum photoperiod.
4.4 LAMP DENSITY
Energy consumption from one lamp can be calculated by lighting type and
photoperiods. However, to understand the energy intensity of lighting for an entire
cannabis operation, lamp density must also be considered. In this context, lamp density
refers to the square feet of cannabis canopy served by each light and, thus, the density of
lamps used for a cannabis producing operation. Because each cannabis producing
Table 4.3. 1: Photoperiods reported by commercial cannabis producers responding to the survey developed for this thesis as well as those interviewed by the NWPCC.

48
operation varies in size, observing lamp density rather than total number of lamps will
offer more comparative data. Additionally, since Vegetative and Flowering rooms serve
different purposes during the cannabis cultivation process, each has been analyzed and
presented separately.
Vegetative rooms show a range of densities from 3 sq. ft. of cannabis canopy per
light to 50 sq. ft., with a median of 19 sq. ft. per lamp (Fig. 4.4.1, n=8). Of course, the
lighting type and wattage used may greatly influence how many square feet of canopy
lighting can serve, as some fixtures may offer more coverage than others. Even among
respondents utilizing the same lighting types, however, ranges of lamp density can be
wide. The square foot of canopy served by each lamp does not appear to be strictly
contingent upon the lighting type used for this sample.
Fig. 4.4.1: Reported square foot of cannabis canopy cover served by each lamp for Vegetative rooms as reported by survey respondents (n=8). Each bar represents an individual producer’s response.

49
The variation in density among lighting types becomes even more apparent in
Flowering rooms. Densities for Flowering rooms for this sample range from 5 to 110
square foot of cannabis canopy per lamp, with a median of 26 sq. ft. (Fig 4.4.2 n=8). All
but one of the respondents for this sample set reported using HPS lamps. Of the seven
using HPS, five reported using exclusively 1000W lamps and included a range of sq. ft.
served by each lamp from 16 to 110, with a median of 27 sq. ft. (Fig. 4.4.2). The presence
of such variation among lamp density for cannabis Flowering rooms is particularly
interesting, as reported photoperiods and lamp types for this space varied so little. Mills’s
“business as usual” model for cannabis production included the assumption of 16 square
feet of canopy per lamp. Within the sample analyzed for this project, however, there does
not appear to be such a standard.
Fig. 4.4.2: Reported square foot of cannabis canopy cover served by each lamp for Flowering rooms as reported by survey respondents (n=8). Each bar represents an individual producer’s response.

50
The variation in canopy square foot per lamp among similar samples in Flowering
rooms may indicate confounding factors not examined in this project, such as genetic
strain of the cannabis plants grown, distance of lamps from the canopy or the preference
of individual producers, Regardless of the causes, the variation in results suggests the
assumption of 16 square feet as a standard lamp density does not provide a sufficient
baseline. Some producers may be over-lighting their grow rooms, which would present a
significant energy-efficiency opportunity. Still others may be under-lighting rooms,
which could result in smaller harvests that may indirectly impact energy consumption,
since more crop cycles are needed to produce the same results as producers using light
more effectively. A balance among crop productivity and efficient placement of lamps to
avoid over-lighting a space would need to be discovered.
4.5 ENERGY INTENSITY OF LIGHTING
The combination of lighting wattages, photoperiods and lamp density used by a
cannabis producer provide the data needed to calculate the energy intensity that
producer’s grow lighting. Energy use intensity (EUI) provides the standard for expressing
energy usage per square foot per year for most building types (Energy Star, n.d.).
Massoud Jourabchi explained during an interview how this type of EUI will not provide
an accurate measure of energy use intensity for cultivation, as large portions of these
operations may not be devoted strictly to growing (2015). To understand the difference in
energy consumption the commercial cannabis industry presents over other industries, the
cannabis itself must be the focus.

51
Attempts during this thesis project to collect the information needed to calculate a
traditional EUI for both flowering and vegetative, such as total annual energy
consumption, proved unsuccessful. In addition to this, data provided by the NWPCC
from their 2015 survey of commercial cannabis producers did not include the square
footage for these rooms. In both cases, however, respondents reported the cannabis
canopy square footage for each room. Due to the availability of this data and the desire to
provide the most applicable understanding of lighting energy use intensity, the EUI for
each cannabis producer studied for this project has been calculated by square foot of
cannabis canopy rather than building floor area. Because commercial cannabis licenses in
Washington State rely on a “tiered” framework of cannabis canopy square foot, an EUI
based on this measure may also prove more useful when attempting to project potential
peak demand for this industry based on licenses already issued and pending.
As with the previous analysis discussed, the Vegetative and Flowering rooms
have been analyzed separately due to their differing functions. Not surprisingly, due to
the variation in lamp types and density reported for Vegetative rooms, a wide range of
EUIs from 5 kWh to 494 kWh annually per square foot of cannabis canopy exists for this
sample (Fig. 4.5.1). The smallest EUI of 5 kWh belonged to an indoor producer using
54W T-5 fluorescent lamps serving 8 sq. ft. of canopy per lamp (Fig. 4.4.1) and using a
standard18 photo period of 18 hours (Fig. 4.3.1). The 54W T-5 lamps represent the lowest
wattage lamp within this sample set (Fig. 4.5.1). In line with this pattern, the highest
wattage lamp represented for this sample set (1,200W Inductive) also holds the highest
EUI at 494 kWh (Fig. 4.5.1) using the same 18-hour photo period (Fig. 4.3.1) but
18 Standard in terms of the findings within this thesis.

52
servicing a larger area of canopy at 16 sq. ft. per lamp (Fig. 4.4.1). When looking at the
energy intensity per square foot for each arrangement, it becomes apparent that the T-5
fluorescents consume much less energy overall despite each lamp serving a smaller area
of canopy than the 1,200W Inductive lamps. With the variety of lighting types and
wattages used within such a small sample size, it can be difficult to decipher patterns
from the EUI metrics. However, the importance of lamp density can be seen more clearly
within the more homogenous sample set for flowering spaces.
Of the seven commercial cannabis producers represented within the Flowering
room sample set, all but one respondent reported using HPS in their flowering spaces. Of
those using HPS, all but one utilize 1,000W lamps (Fig. 4.5.2 ).
Fig. 4.5.1: Annual lighting energy use intensity per square foot of cannabis canopy cover for Vegetative rooms (n=7).

53
The divergent wattage was 600W and, surprisingly, despite using a lower wattage, this
operation also holds the highest EUI score for this sample set at 453 kWh per square foot
of canopy cover (Fig. 4.5.2). The remaining five samples used 1,000W HPS and have a
range of EUI scores from 35 kWh to 236 kWh (Fig. 4.5.2). The only difference between
these samples lies in the density of lamps used for each flowering space. While lamp
types and wattages used had an obvious impact on the energy intensity of lighting for any
given cannabis producing operation, lamp density appeared to be another important factor
due to the large range of densities within this sample.
The results of this thesis project represent the best approximation with the
available data. In future studies, the available data set could be improved through the data
collection process in several ways. First, multiple approaches of survey delivery could
Fig. 4.5.2: Annual lighting energy use intensity per square foot of cannabis canopy cover for Flowering rooms (n=7).

54
potentially increase the response rate and in turn the sample size. Some surveys for this
project may have ended up in recipients’ junk email or the email addresses may no longer
have been in use. Using multiple forms of contact such as traditional mail and phone calls
in addition to email may increase the likelihood of reaching more participants. For this
thesis, due to time and funding constraints, these additional methods of contact could not
be used. Secondly, more direct data collection with the ability to follow up could be
utilized to clarify ambiguous information. All data for this project has been self-reported
by the cannabis producers to safeguard anonymity, and in some cases unclear or
infeasible data was reported and had to be removed from a data set. These steps could
help produce larger data sets in the future. However, the findings of this thesis represent
an important step in expanding our limited understanding of the energy intensity of
agricultural lighting used in cannabis production.
Originally, this research endeavored to create a baseline for energy use intensity of
grow lighting for commercial cannabis production in Washington State. The results show
that at this early stage in the commercialization of cannabis production, no baseline exits.
Contrary to Mills (2012) standardized “business as usual” model for cannabis production,
variation in lighting types, wattages and lamp density resulted in wide ranges in lighting
EUI. The variation in reported data and resulting EUI scores suggest energy use by
commercial cannabis production needs to be explored further to truly understand the
energy usage by this industry as well as opportunities for efficiency. The following
chapter will discuss suggestions for future research as well as possible avenues for energy
efficiency.

55
CH. 5 CONCLUSIONS & RECOMMENDATIONS
To discover potential paths to energy efficiency for commercial cannabis
production, the current energy intensity of the industry must be addressed. The challenge
in finding opportunities for energy efficiency for cannabis production lies in its fledgling
nature. A reliable baseline for the energy intensity of commercial-scale cannabis grow
operations does not exist at this time. Without an industry baseline, it becomes difficult to
understand the potential benefits of industry-wide energy efficiency measures. The goal
of this thesis project has been to advance understanding of this industry and, in turn,
opportunities for energy efficiency. While the original intent of this project had been to
calculate a baseline of energy intensity per-square foot of grow lighting used in cannabis
production, the lack of standardization across the industry made that impossible. The
findings of this project instead suggest an individualized approach to energy efficiency
would need to be taken in cooperation with each cannabis producer. Furthermore, the
data collected provides an informative glimpse into the variety of operations now serving
Washington State. Future research will be needed to discover optimal methods for
producing cannabis that could balance both energy efficiency and production output.
5.1 RECOMMENDATIONS FOR ENERGY EFFICIENCY GAINS IN GROW LIGHTING
Current literature suggests grow lighting accounts for 38% to 86% of the total
electrical energy consumption used in the production of cannabis (Arnold, 2013;
Jourabchi, 2014 & Mills, 2012). Based on these findings, focusing on the use of
agricultural lighting appears to be the most valuable pursuit for energy efficiency in

56
cannabis production and therefore guided the research for this thesis project. The results
of this project suggest possible energy efficiency gains in several forms: the use of less
artificial light and more natural light, optimized densities for light fixtures in both
vegetative and flowering rooms, adjustments in photoperiods, and the implementation of
more energy-efficient lighting technology.
First and foremost, the reduction or elimination of artificial agricultural lighting
offers the greatest opportunity for decreasing energy consumption. Natural sunlight could
be leveraged more widely via greenhouses or outdoor cultivation to supplement or
replace artificial light. The formation of organizations such as the Washington
Sungrowers Industry Association (WSIA) indicates the use of natural light in cannabis
production as an energy conservation method has support in the public arena. Of course,
the use of natural sunlight exclusively would limit cannabis producers to seasonal growth
cycles, whereas artificial light gives producers the ability to cultivate crops year-round.
The most beneficial arrangement would be to balance the use of natural and artificial
light. During the longer, brighter seasons, natural light could be used to its fullest
potential and supplemented by artificial light when needed in the darker times of the year.
Even in areas where lack of access to agriculturally-appropriate land restricts outdoor
cultivation, greenhouses or the use of daylighting in buildings could be utilized to reduce
the need for artificial light. When circumstances necessitate artificial light, additional
steps can be taken to ensure its use in the most efficient way possible.
The first step in using artificial light efficiently would be to use only as many
fixtures as necessary. The findings of this thesis showed a wide range of lamp densities
being used for cannabis production. Producers using more lamps per square foot of

57
cannabis canopy may be providing more light than needed for optimum production,
driving up their energy usage. Conversely, those who do not provide enough light for
their cannabis plants to flourish may be lowering their final crop yields. These producers
would need to harvest more crop cycles to achieve the same volume of cannabis
compared to those who provided adequate light. As suggested previously in the review of
literature, this could ultimately increase overall energy intensity per pound of product.
Therefore, energy conservation would best be achieved by finding the optimum light
density for cannabis production and not exceeding it. Further research should be
undertaken to find this optimum light density, while also taking into account
photoperiods which further impact the growth of cannabis.
The operations of survey respondents examined for this thesis reported a range of
photoperiods for their vegetative rooms but near uniformity for flowering rooms. The
range of photoperiods for vegetative rooms suggests multiple photoperiods work for the
vegetative stage of cannabis production. Again, as with light density, some producers
may be providing too much light, and others too little. Additional research could help
discover whether or not cutting back on photoperiods in vegetative rooms could lower
energy usage without hindering final crop output. Discovering the optimum photoperiod
for vegetative rooms could help ensure the most efficient use of artificial light in these
areas.
Placing lamps farther apart could be another energy reduction method. Increasing
the square footage of cannabis canopy served by each lamp or reducing photoperiods
represent relatively simple, low-cost or no-cost methods to reduce the energy
consumption of lighting for cannabis production. Another step would be to encourage the

58
use of LED lamps, which offer the most light per watt over highly energy-intensive HID
lamps. This option, however, would be more difficult for cannabis producers to act on
due to up-front cost barriers. At the time of this writing, LED lamps offering optimal
PAR for agricultural use do exist in the market, but at a high price. In fact, of the five
respondents who answered the survey questions relating to the use of LED lighting, three
cited high cost as a barrier to using this lighting type. Arnold (2013) and Morris (2015)
also cited cost concerns of LED lighting as a hurdle to implementation among cannabis
producers. Cost-cutting measures such as utility energy efficiency rebates for LEDs
offering optimal PAR could help reduce the financial burden on cannabis producers and
encourage them to move away from the use of HID lamps.
Many utilities in Washington already offer rebates on efficient lighting to capture
energy savings as required by I-937. A few, like Puget Sound Energy and Seattle City
Light, have started extending these benefits to commercial cannabis producers as well.
Some utilities are still not ready to work with cannabis producers due to concerns over
conflicts with federal law (Morris, 2015; Radil, 2016 & Walton, 2014). Utilities impacted
by I-937 that do not work with cannabis producers could be missing opportunities to
claim significant energy savings toward their biennial goal. For example, by helping a
cannabis producer pay for a switch from HIDs to LEDs through rebates, a utility could
claim the energy saved (measured in kWh) from the switch toward their energy savings
goal. Cannabis producers operating within the service territories of utilities not offering
energy efficiency programs for cannabis production will miss out on assistance, which
could further deter them from the use of expensive LED lamps. Ultimately, in the long
term, the federal versus state legal dichotomy over recreational cannabis needs to be

59
resolved before all Washington State utilities can feel comfortable assisting cannabis
producers with energy efficiency entirely free from the fear of repercussions.
Utilities that do offer energy efficiency assistance to cannabis producers should
prepare their strategies for marketing this service carefully and find effective ways to
model positive outcomes, as producers may be very concerned about risking their
business with a lighting switch. Apprehensive cannabis producers may need to be
convinced to try more efficient lighting types in their vegetative rooms first. The
vegetative rooms examined for this thesis showed a variety of lighting types, as compared
to the nearly exclusive use of HPS in flowering rooms. This suggests other cannabis
producers might be more easily convinced to use energy efficient lighting in vegetative
rooms. If that process succeeds, a better case may be made to do the same for flowering
rooms. Of course, any efforts to encourage cannabis producers to use more efficient
agricultural lighting would need to consider the producer’s needs and ensure their
business would not be negatively impacted in the long term with lower crop yields. Any
negative outcomes might damage the attitudes cannabis producers hold toward new
efficient lighting types and reinforce the old preference for HID lamps.
Other energy-efficient improvements in agricultural lighting may not come from
the lights but from the cannabis plants themselves. One Seattle cannabis producer,
Solstice, recently reported experimenting with preserving the DNA of mother plants in
petri dishes rather than long-term maintenance of the mother plants to produce cuttings
(Radil, 2016). Normally, mother plants would require being kept indoors under lamps,
simulating long summer days, to stop the plant from entering the flowering phase. If
cannabis producers created the clone starts for each crop from preserved DNA in petri

60
dishes, there would be no need to continually maintain mother plants and thus the energy
needed to power their lamps could also be conserved.
While not an energy-efficiency measure, cannabis producers could also install
solar panels to help support their energy requirements. For this to be a cost-effective
endeavor, however, the time required to recoup the costs of installing such a system
(“payback period”) through avoided electricity costs would need to be fairly short. What
would be considered a reasonable amount of time would differ for every producer due to
varying electrical consumption patterns and up-front costs for the required systems.
As mentioned in chapter 2, local regulations could allow certain cities to require
cannabis producers to supplement their energy needs with the use of clean energy
technologies such as solar panels (Warren, 2015 p. 424). Such regulation, however, may
result in driving cannabis producers away from these cities to avoid the financial cost and
inconvenience of such a requirement. Instead, policy mechanisms such as feed-in tariffs
should be used to encourage the use of clean energy rather than enforce. Feed-in tariffs
support clean energy technology by providing financial compensation based on the
energy produced. Production-based incentives could also be combined with rebates to
make installing a solar system even more attainable for cannabis producers. Although
such strategies would not help utilities meet their I-937 conservation goals, it would help
them balance the electrical load demand of the commercial cannabis industry.

61
5.2 SUMMARY OF RECOMMENDATIONS FOR FURTHER STUDY
For any energy efficiency efforts related to cannabis production, further research
will need to be conducted to fully comprehend the impacts on energy consumption from
such measures on this industry. Variation in the results of this thesis research suggests
some cannabis producers may be using less than optimal light densities and photoperiods
in their cultivation methods. More research needs to be conducted to find optimal lighting
conditions to maximize energy savings within the boundaries of optimizing product yield.
Aside from the strategic use of artificial light, the technology of the lamps themselves
also represent important areas of research.
Technological development tends to follow a pattern of improved performance and
falling costs. The evolution of the LED from small instrument indicator lights to the wide
range of uses they provide today indicate lighting technology falls into this pattern as
well. Advances in lighting technology will also benefit the fledgling commercial cannabis
industry. As energy-efficient agricultural lighting continues to improve and become less
expensive, the benefits of such lighting types will begin to strongly outweigh the costs.
Specific focus on providing a high PAR in less costly, energy-efficient light will be
crucial for the cannabis industry.
Due to the importance of THC to the recreational cannabis market as the source of
its psychoactive effects, additional research should also be undertaken to ensure THC
levels will not be negatively impacted from the use of LEDs. While Vanhove (2011)
suggests genetics play the most important role in THC concentrations, the proper use of
light can maximize a strain’s potential. Many in the industry still remain skeptical about
the use of LEDs in cannabis production, citing concerns of THC impacts (Arnold, 2013;

62
Mills, 2012 & Morris, 2015). A well-designed study could put to rest the fears of
cannabis growers and answer questions about the relationship between LEDs and THC in
a variety of strains of plants.
Current research regarding the use of LEDs in agriculture primarily focuses on
food crops such as potatoes and lettuce (Aldos et al, 1996; Bot, 2001; Doucleff, 2013;
Meinhold, 2013; Mitchell, 2014; Morrow, 2008; Yeh, 2009). Since legal recreational
cannabis production began in Washington State, some LED distributers have conducted
case studies on the use of LEDs in cannabis production. One such distributer – Forever
Green Indoors – asserts their case studies to be independent, since cannabis producers
were not compensated for their participation and THC results have been verified by
independent labs (Forever Green Indoors, 2016). To put concerns over negative THC
impacts to rest, truly independent and scientifically-rigorous research will need to be
conducted on the impact of LEDs on cannabis production.
The experimentation of one cannabis producer, Solstice, with preserving the DNA
of mother plants in petri dishes to skip the energy costs of keeping these plants for
cuttings also suggests an interesting avenue for future research in cloning. Other research
relating to cannabis DNA could focus on continuing to increase harvest yields as the
sinsemilla technique has done for generations of cannabis plants. Higher yields would
mean fewer harvest cycles would be needed to generate the same volumes of product
and, in turn, would lower the energy intensity put into each pound of product. Research
on DNA manipulation through genetic selection could also attempt to produce an
“energy-efficient” cannabis strain that requires less light to produce the same yield and
quality as other strains.

63
Whether energy efficiency measures taken by the commercial cannabis industry
fall into the categories of behavioral, technical or biological, a more comprehensive
survey on energy use in cannabis production will be needed. The impacts of such
measures will be difficult to predict without a more thorough understanding of how this
industry uses energy at all stages of production. Understanding the diversity of
commercial cannabis operations would also assist in creating more accurate electrical
load demand projections. At this point in time, only one thing can be certain: due to the
need for artificial light and environmental controls, commercial cannabis grown indoors
suffers from chronically high energy demand. There must be a coordinated effort
between policy makers, utilities and cannabis producers to use energy more wisely in this
burgeoning industry.

64
REFERENCES
Alados, I., I. Y. Foyo-Moreno, and L. Alados-Arboledas.(1996) "Photosynthetically active radiation: measurements and modelling." Agricultural and Forest Meteorology 78.1: 121-131.
Arnold, J. (2013). Energy consumption and environmental impacts associated with cannabis cultivation (Thesis). Humboldt State University. Retrieved Sept. 30, 2015, from http://humboldt-dspace.calstate.edu
Bade, G. (2015). Pot power: How utilities and regulators are dealing with the budding marijuana industry. Utility Dive. Retrieved April 20, 2016, from http://www.utilitydive.com/news/pot-power-how-utilities-and-regulators-are-dealing-with-the-budding-mariju/409172/
Banta-Green, C. (2013). Marijuana Use: Impact in Washington State. Alcohol & Drug Abuse Institute, University of Washington. Retrieved Oct. 28, 2015 from http://adai.uw.edu/pubs/infobriefs/ADAI-IB-2012-05.pdf
Belzer, D. (2014). A Comprehensive System of Energy Intensity Indicators for the U.S.: Methods, Data and Key Trends (No. PNNL-22267). U.S. Department of Energy. Retrieved from Oct. 28, 2015, http://www.pnnl.gov/main/publications/external/technical_reports/PNNL-22267.pdf
Binder, L. C. W., Barcelos, J. K., Booth, D. B., Darzen, M., Elsner, M. M., Fenske, R., … Vano, J. A. (2010). Preparing for climate change in Washington State. Climatic Change, 102(1-2), 351–376. http://doi.org/10.1007/s10584-010-9850-5
Bot, G. P. A. (2001). Developments in indoor sustainable plant production with emphasis on energy saving. Computers and Electronics in Agriculture, 30(1–3), 151–165. http://doi.org/10.1016/S0168-1699(00)00162-9
Bouchard, M. (2008). Towards a realistic method to estimate cannabis production in industrialized countries. Contemporary Drug Problems, 35(2-3), 291-320.
Bonlender, B., Usibelli, T., Blackmon, G., Burrell, A., Moulton, P., Murray, C., Sharp, C. (2014). 2015 Biennial Energy Report and State Energy Strategy Update - Biennial-Energy-Report-2015. Washington Department of Commerce State Energy Office.
Cannabis Benchmarks. (2016). Weekly Report. Retrieved May 19, 2016 from http://www.cannabisbenchmarks.com/weekly-report.html
Cannabis Benchmarks. (2015). US Cannabis Wholesale Price Report. Retrieved from http://www.signalbayinc.com/company-news/us-cannabis-wholesale-price-report/
Carah, J. K., Howard, J. K., Thompson, S. E., Gianotti, A. G. S., Bauer, S. D., Carlson, S. M., … Power, M. E. (2015). High Time for Conservation: Adding the Environment to the Debate on Marijuana Liberalization. BioScience, 65(8), 822–829. http://doi.org/10.1093/biosci/biv083
Cervantes, J. (2006). Marijuana Horticulture: The Indoor/Outdoor Medical Grower’s Bible. Van Patten Publishing.

65
Chadillon-Farinacci, V., Apparicio, P., & Morselli, C. (2015). Cannabis cultivation in Quebec: Between space–time hotspots and coldspots. International Journal of Drug Policy, 26(3), 311–322. http://doi.org/10.1016/j.drugpo.2014.11.006
Decorte, T. (2010). The case for small-scale domestic cannabis cultivation. International Journal of Drug Policy, 21(4), 271–275. http://doi.org/10.1016/j.drugpo.2010.01.009
Department of Justice. (2013). Memorandum for all United States Attorneys: Guidance Regarding Marijuana Enforcement. James M. Cole, Deputy Attorney General. Washington, D.C. Retrieved January 29, 2016, from http://www.justice.gov/iso/opa/resources/3052013829132756857467.pdf
Doucleff, M. (2013). Vertical “Pinkhouses:” The Future Of Urban Farming? [NPR.org]. Retrieved May, 19 2016, from http://www.npr.org/sections/thesalt/2013/05/21/185758529/vertical-pinkhouses-the-future-of-urban-farming
Deyette, J., & Clemmer, S. (2006). The Washington Clean Energy Initiative: Effects of I-937 on Consumers, Jobs and the Economy. Union of Concerned Scientists. Retrieved Sept. 10, 2015, from http://www.ucsusa.org/sites/default/files/legacy/assets/documents/clean_energy/washington-i-937-report-final.pdf
Djevic, M., & Dimitrijevic, A. (2009). Energy consumption for different greenhouse constructions. Energy, 34(9), 1325–1331. http://doi.org/10.1016/j.energy.2009.03.008
El-Ramady, H. R., Alshaal, T. A., Shehata, S. A., Domokos-Szabolcsy, É., Elhawat, N., Prokisch, J., … Marton, L. (2014). Plant Nutrition: From Liquid Medium to Micro-farm. In H. Ozier-Lafontaine & M. Lesueur-Jannoyer (Eds.), Sustainable Agriculture Reviews 14 (pp. 449–508). Springer International Publishing. Retrieved Sept. 10, 2015, from http://link.springer.com/chapter/10.1007/978-3-319-06016-3_12
Energy Independence Act, I-937. (2006). Washington State Legislature. Retrieved Sept. 10, 2015, from http://lawfilesext.leg.wa.gov/biennium/200708/Pdf/Initiatives/Initiatives/INITIATIVE%20937.SL.pdf
Energy Star (n.d.). CFL Glossary. Retrieved May 20, 2016, from https://www.energystar.gov/products/lighting_fans/light_bulbs/cfl_glossary
Forever Green Indoors (2016). Case Studies and Press Retrieved May 22, 2016, from http://forever-green-indoors.myshopify.com/pages/case-studies
Gitelson, A. A., Peng, Y., Arkebauer, T. J., & Suyker, A. E. (2015). Productivity, absorbed photosynthetically active radiation, and light use efficiency in crops: Implications for remote sensing of crop primary production. Journal of Plant Physiology, 177, 100–109. http://doi.org/10.1016/j.jplph.2014.12.015
Green, B., Kavanagh, D., & Young, R. (2003). Being stoned: a review of self-reported cannabis effects. Drug & Alcohol Review, 22(4), 453–460.

66
H. David (2008). Close Up Metal Halide Lamp. Wikimedia Commons. Retrieved May 28, 2016 from, https://commons.wikimedia.org/wiki/File:Closeup_Metal_Halide_Lamp.jpg
Harrison, J. (2008). Megawatt. Retrieved April 15, 2016, from http://www.nwcouncil.org/history/megawatt/
Harrison, J. (2015). Survey: Washington Cannabis Growers Would Like Help with Energy Efficiency. Retrieved October 11, 2015, from https://www.nwcouncil.org/news/blog/cannabis-energy-use-update-august-2015/
Hart, C. L., van Gorp, W., Haney, M., Foltin, R. W., & Fischman, M. W. (2001). Effects of Acute Smoked Marijuana on Complex Cognitive Performance. Neuropsychopharmacology, 25(5), 757–765. http://doi.org/10.1016/S0893-133X(01)00273-1
IPCC (2013): Summary for Policymakers. In: Climate Change 2013: The Physical Science Basis. Contribution of Working Group I to the Fifth Assessment Report of the Intergovernmental Panel on Climate Change [Stocker, T.F., D. Qin, G.-K. Plattner, M. Tignor, S. K. Allen, J. Boschung, A. Nauels, Y. Xia, V. Bex and P.M. Midgley (eds.)]. Cambridge University Press, Cambridge, United Kingdom and New York, NY, USA
Initiative Measure no. 502, I-502. (2012). Washington State Legislature. Retrieved from http://lawfilesext.leg.wa.gov/biennium/2011-12/Pdf/Initiatives/Initiatives/INITIATIVE 502.pdf. Sept. 10, 2015
Jourabchi, M. (2014). Electrical load impacts of indoor commercial cannabis production Retrieved from https://www.nwcouncil.org/media/7130334/p7.pdf
Kalacska, M., & Bouchard, M. (2011). Using police seizure data and hyperspectral imagery to estimate the size of an outdoor cannabis industry. Police Practice & Research, 12(5), 424–434. http://doi.org/10.1080/15614263.2010.536722
Kilmer, B., Caulkins, J. P., & Midgette, G. (2013). Before the Grand Opening : Measuring Washington State’s Marijuana Market in the Last Year Before Legalized Commercial Sales. Santa Monica, CA, USA: Rand. Retrieved from http://site.ebrary.com/lib/alltitles/docDetail.action?docID=10828028
Knight, G., Hansen, S., Connor, M., Poulsen, H., McGovern, C., & Stacey, J. (2010). The results of an experimental indoor hydroponic Cannabis growing study, using the “Screen of Green” (ScrOG) method—Yield, tetrahydrocannabinol (THC) and DNA analysis. Forensic Science International, 202(1–3), 36–44.
Lee, J. C. (1995). U.S. Patent No. 5,440,836. Washington, DC: U.S. Patent and Trademark Office.
MailChimp. (2016). (The Rocket Science Group) Retrieved from MailChimp: http://mailchimp.com
Meinhold, B. (2013). Indoor Vertical Farm “Pinkhouses” Grow Plants Faster with Less Energy [Inhabitat.com]. Retrieved from http://inhabitat.com/indoor-vertical-farm-pinkhouses-grow-plants-faster-with-less-energy/
Mills, E. (2012). The carbon footprint of indoor Cannabis production. Energy Policy, 46, 58–67.

67
Mitchell, B. (2014, July 12). The World’s Largest Indoor Farm Produces 10,000 Heads of Lettuce a Day in Japan | Inhabitat - Green Design, Innovation, Architecture, Green Building. Retrieved from http://inhabitat.com/the-worlds-largest-indoor-farm-produces-10000-heads-of-lettuce-a-day-in-japan/
Morris, J. (2015). Cannabis and Energy Nexus: Emerging Markets and Implications for Energy Efficiency. Tacoma, WA.
Morrow, R. C. (2008). LED Lighting in Horticulture. HortScience : A Publication of the American Society for Horticultural Science. Retrieved from http://agris.fao.org/agris-search/search.do?recordID=US201301566147
NW Power and Conservation Council (2015). Seventh Northwest Conservation and Electric Power Plan Brochure. Retrieved November 13, 2015, from http://www.nwcouncil.org/energy/powerplan/7/home/
Northwest Power and Conservation Council. (2016). Seventh Northwest Conservation and Electric Power Plan seventh Power Plan. Retrieved from http://www.nwcouncil.org/energy/powerplan/7/plan/
NW Power and Conservation Council (2010). Sixth Northwest Conservation and Electric Power Plan. Council Document. Retrieved from https://www.nwcouncil.org/media/6284/SixthPowerPlan.pdf. Sept. 10, 2015.
Pal, J. S., & Eltahir, E. A. B. (2015). Future temperature in southwest Asia projected to exceed a threshold for human adaptability. Nature Climate Change, advance online publication. http://doi.org/10.1038/nclimate2833
Pijlman, F. T. A., Rigter, S. M., Hoek, J., Goldschmidt, H. M. J., & Niesink, R. J. M. (2005). Strong increase in total delta-THC in cannabis preparations sold in Dutch coffee shops. Addiction Biology, 10(2), 171–180. http://doi.org/10.1080/13556210500123217
ENERGY STAR (n.d) Portfolio Manager Technical Reference: U.S. National Energy Use Intensity. Retrieved February 21, 2016, from https://www.energystar.gov/buildings/tools-and-resources/portfolio-manager-technical-reference-us-national-energy-use-intensity
Plantlady223. (2015). HPS (High Pressure Sodium) grow light bulb. Wikimedia Commons. Retrieved May 28, 2016 from, https://commons.wikimedia.org/wiki/File:HPS_(High_Pressure_Sodium)_grow_light_bulb.jpg
Potter, G. R., Barratt, M. J., Malm, A., Bouchard, M., Blok, T., Christensen, A.-S., … Wouters, M. (2015). Global patterns of domestic cannabis cultivation: Sample characteristics and patterns of growing across eleven countries. International Journal of Drug Policy, 26(3), 226–237. http://doi.org/10.1016/j.drugpo.2014.12.007
Radil, A. (2016). Northwest Marijuana Growers Try To Go Green (But It’s Hard). Retrieved April 1, 2016, from http://kuow.org/post/northwest-marijuana-growers-try-go-green-its-hard
RCW Chapter 19.285.030: ENERGY INDEPENDENCE ACT (2006). Retrieved from http://app.leg.wa.gov/rcw/default.aspx?cite=19.285

68
Stern, F. (2013). Peak Demand and Time-Differentiated Energy Savings Cross-Cutting Protocols. National Renewable Energy Laboratory. Retrieved from http://energy.gov/sites/prod/files/2013/11/f5/53827-10.pdf
Sun Ladder. (2010). Spiral CFL Bulb. Wikimedia Commons. Retrieved May 28, 2016, from https://commons.wikimedia.org/wiki/File:04_Spiral_CFL_Bulb_2010-03-08_(gray_50_back).jpg#filelinks
SurveyMonkey Inc. (2016). SurveyMonkey. Retrieved from SurveyMonkey: www.surveymonkey.com
Taube, Christian. (2005). Various Fluorescent Light Bulbs. Wikimedia Commons. Retrieved May 28, 2016, from https://commons.wikimedia.org/wiki/File:Leuchtstofflampen-chtaube050409.jpg
United States Code, (2006) Edition, Supplement 5, Title 21 - FOOD AND DRUGS (2006). Retrieved from http://www.gpo.gov/fdsys/granule/USCODE-2011-title21/USCODE-2011-title21-chap13-subchapI-partB-sec812/content-detail.html
U.S. Energy Information Administration. (2015). How much electricity does an American home use? - FAQ - U.S. Energy Information Administration (EIA): Average Monthly Residential Electricity Consumption, Prices, and Bills by state. Retrieved May 21, 2016, from https://www.eia.gov/tools/faqs/faq.cfm?id=97&t=3
U.S. Energy Information Administration (2016). What is U.S. electricity generation by energy source? - FAQ - U.S. Energy Information Administration (EIA). Retrieved May 21, 2016, from https://www.eia.gov/tools/faqs/faq.cfm?id=427&t=3
U.S. Energy Information Administration, State Energy Data System. (2016). Washington Profile, Retrieved May 19, 2016, from http://www.eia.gov/state/print.cfm?sid=WA
Vanhove, W., Van Damme, P., & Meert, N. (2011). Factors determining yield and quality of illicit indoor cannabis (Cannabis spp.) production. Forensic Science International, 212(1–3), 158–163. http://doi.org/10.1016/j.forsciint.2011.06.006
WAC 314-55 (2015) Marijuana Licences, Application Process, Requirements, and reporting. Retrieved from http://apps.leg.wa.gov/wac/default.aspx?cite=314-55&full=true
WAC 51-11 C405.5.1- C405.5.4 (2016). STATE BUILDING CODE ADOPTION AND AMENDMENT OF THE 2015 EDITION OF THE INTERNATIONAL ENERGY CONSERVATION CODE, COMMERCIAL. Retrieved May 21, 2016, from http://apps.leg.wa.gov/wac/default.aspx?cite=51-11C
WAC 51-11 C405.5.1—Total connected interior lighting power. (2016 ). Retrieved May 21, 2016, from http://apps.leg.wa.gov/wac/default.aspx?cite=51-11C-405051
Walton, R. (2014). “Don”t ask, don’t tell’: How utilities are powering the marijuana industry. Utility Dive. Retrieved from http://www.utilitydive.com/news/dont-ask-dont-tell-how-utilities-are-powering-the-marijuana-industry/322565/

69
Warren, G. (2015). Regulating Pot to Save the Polar Bear: Energy and Climate Impacts of the Marijuana Industry. Columbia Journal of Environmental Law, 40. Retrieved from http://www.columbiaenvironmentallaw.org/articles/regulating-pot-to-save-the-polar-bear-energy-and-climate-impacts-of-the-marijuana-industry
Washington State Department of Ecology. (2012) Preparing for a Changing Climate: Washington State’s Integrated Climate Response Strategy. Publication No. 12-01-0040 (Washington State Department of Ecology, 2012)
Washington State Institute for Public Policy. (2015) I-502 Evaluation Plan and Preliminary Report on Implementation. Retrieved from http://www.wsipp.wa.gov/ReportFile/1616/Wsipp_I-502-Evaluation-Plan-and-Preliminary-Report-on-Implementation_Report.pdf. Sept. 27, 2015
Washington State Liquor Control Board. (2013). GreenhouseMarijuanaProducer-FactSheet.pdf. Retrieved from http://liq.wa.gov/publications/Marijuana/I-502/GreenhouseMarijuanaProducer-FactSheet.pdf
Washington State Liquor Control Board. (2013). Indoor_Marijuana_Producer_guidance_11-19-13.pdf. Retrieved from http://www.liq.wa.gov/publications/Marijuana/I-502/Indoor_Marijuana_Producer_guidance_11-19-13.pdf
Washington State Liquor Control Board. (2013). Outdoor_Marijuana_Producer_guidance_11-19-13.pdf. Retrieved from http://liq.wa.gov/publications/Marijuana/I-502/Outdoor_Marijuana_Producer_guidance_11-19-13.pdf
Washington State Liquor Control Board. (2013). Producer License Descriptions and Fees | Washington State Liquor and Cannabis Board. Retrieved from http://liq.wa.gov/mjlicense/producer_license_discriptions_fees
Washington State Liquor and Cannabis Board. (2015). Producer Processor Map. Retrieved December 10, 2015, from http://wslcb.maps.arcgis.com/apps/webappviewer/index.html?id=57249f926e2442e281691cc649f61d73
WSIA - Washington Sungrowers Industry Association. (2016). Retrieved May 19, 2016, from http://www.washingtonsungrowers.org/
Yeh, N., & Chung, J.-P. (2009). High-brightness LEDs—Energy efficient lighting sources and their potential in indoor plant cultivation. Renewable and Sustainable Energy Reviews, 13(8), 2175–2180. http://doi.org/10.1016/j.rser.2009.01.027

70
APPENDICES
APPENDIX A- SURVEYS Questions from the 2015 NWPCC survey from which this thesis’ survey design has been based.
Growing method for: (Optional/ name of your business): Type of facility
Bld. square footage
Total canopy square footage
Type of lights used: e.g. HPS (specify electronic or
magnetic ballast), MH, CMH, Double ended HPS, LED, Induction, T-5, T-8,
Compact fluorescent)
Square footage of
canopy served by
each fixture
Number of plants
per fixture
Lamp wattage
Photoperiod
Indoor
Vegetative room
Flowering room
Greenhouse
Vegetative room
Flowering room
Outdoors NA NA NA NA
1. Have you experimented with LED lighting or heard feedback from other growers on LED
lighting?
2. Would you consider using LED lighting for any stage of your operation? Why or why not? -Have you considered induction lighting strategies? Why or why not? -Have you considered double ended HPS or plasma lighting?
3. Questions regarding production:
-Roughly how many pounds of product do you harvest per crop cycle?
-What is the average length per crop cycle and how many cycles do you expect each year?
-Annually, how many pounds of product do you produce?
4. Are you currently affected by tiered electricity rates?
Last month Last year
Electric bill ($) Electric KWH
Natural Gas bill ($) If using generator fuel usage in gallons
5. Do you currently grow in soil or grow hydroponically?

71
Survey developed for this thesis. Final surveys administered via “Survey Monkey” through an email link sent to Washington State commercial cannabis growers during data collection.
General Information
1) Name of business and/or license number. *Answering this is optional.
2) Type of Operation: a) Indoor b) Outdoor c) Greenhouse d) Combination e) Other
3) If you answered “combination” or “other” above, please describe briefly:
4) Type of Cannabis Business:
a) Producer b) Processor c) Producer/Processor
Lighting
Indoor Growing Vegetative Room
Flowering Room
Building square footage
Total square footage of cannabis canopy
Type of lights used: e.g. HPS (specify electronic or magnetic ballast), MH, CMH, Double ended HPS,
LED, Induction, T-5, T-8, CFL)
Wattage used per lamp
Number of lamps used
Number of plants per lamp
Hours on per day and for how many weeks per year

72

73

74
APPENDIX B-CORRESPONDENCE Sample participation request email:
Graduate student from the Evergreen State College needs the participation of cannabis growers for thesisresearch!
Study of Energy ConsumptionAssociated with Grow Lighting Utilized
in Commercial Cannabis Cultivation
Dear Cannabis Producer, You are being asked to participate in a study of energy consumptionassociated with cannabis cultivation, an industry for which little is known bypolicymakers or the general public. Washington State is leading the way incannabis law and will be looked to by others considering similar policies. Forthis reason, it is imperative we generate new research to inform ourselves aswell as others. In addition to this, utilities must meet new electrical load demand fromthe commercial cannabis industry. In order to understand this new demand,research is needed to create a baseline for expected electrical consumption. Itis my hope that such a baseline could be used for planning by policy makersas well as utilities. The purpose of this study is to determine the electricalenergy intensity for grow lighting used in cannabis cultivation. Previousstudies have shown grow lighting to be the largest contributing factor in theoverall energy consumption for cannabis production; hence, the focus of mystudy. The study will be conducted by myself, Sarah Sweet, a graduatestudent in the Master of Environmental Studies (MES) program at TheEvergreen State College and supervised by Kathleen Saul who specializes inenergy and energy policy. Data from collected surveys will be stored in apassword protected spread sheet. For the purpose of anonymity, raw dataand results will not include your business name or license number.
If you are willing to participate in this study, please do so by Feb. 20th2016.
If you have any questions, please contact me via the information providedbelow. Thank you! Sarah SweetGraduate Student; Master of Environmental StudiesThe Evergreen State [email protected]
Click Here to Participate!
Survey powered by SurveyMonkey
Copyright © 2016 Sarah Sweet, All rights reserved.
unsubscribe from this list | update subscription preferences
Subscribe Share Past Issues RSSTranslate

75
Sample participation request reminder email:
Graduate student from the Evergreen State College still needs theparticipation of cannabis growers for thesis research!
Is this email not displaying correctly?View it in your browser.
Study of Energy ConsumptionAssociated with Grow Lighting Utilized
in Commercial Cannabis Cultivation
Dear Cannabis Producer, First off, a sincere thank you to those of you whom have alreadyparticipated in this study! Not only are you helping to make history but you aremaking a graduate student's thesis project possible!
More responses are still needed, so please consider participating if youhave not done so already. Click the yellow button at the bottom of thismessage to participate by Feb. 20th 2016.
As a reminder:
You are being asked to participate in a study of energy consumptionassociated with cannabis cultivation.The purpose of this study is to determinethe electrical energy intensity for grow lighting used in cannabis cultivation.Previous studies have shown grow lighting to be the largest contributing factorin the overall energy consumption for cannabis production; hence, the focusof my study. The study will be conducted by myself, Sarah Sweet, a graduate studentin the Master of Environmental Studies (MES) program at The EvergreenState College and supervised by Kathleen Saul who specializes in energy andenergy policy. Data from collected surveys will be stored in a passwordprotected spread sheet. For the purpose of anonymity, raw data and resultswill not include your business name or license number.
If you have any questions, please contact me via the information provided
below. Thank you! Sarah SweetGraduate Student; Master of Environmental StudiesThe Evergreen State [email protected]
Click Here to Participate!
Survey powered by SurveyMonkey
Copyright © 2016 Sarah Sweet, All rights reserved.You are receiving this email because you are listed as a cannabis producer by theWashington State Liquor and Cannabis Board.Our mailing address is:Sarah SweetP.O. Box [email protected], WA 98419-8833
Add us to your address book
unsubscribe from this list | update subscription preferences
76
APPENDIX C- ASSUMPTIONS
In some cases, survey responses necessitated interpretations to be made about specific samples. In the following list, “NWPCC” denotes a sample collected from the NWPCC. As the NWPCC collected data from 17 cannabis producers, their samples have been numbered 1-17.
1. NWPCC 14 stated "13X HPS [High Pressure Sodium] Fixtures per room" were used. As no confirmation could be made about their use in the reported green house, it has been assumed to mean the Vegetative and Flower rooms.
2. In cases where the number of lamps had not been reported, but lamps per square foot of canopy had been, the number of lamps were inferred based on the latter metric. The number of lamps used in Vegetative rooms were calculated in this manner for samples NWPCC 6, NWPCC 11, NWPCC 12 and NWPCC 16. For Flowering rooms, number of lamps were calculated for samples NWPCC 5, NWPCC 6, NWPCC 11 and NWPCC All other samples used to calculate energy intensity self-reported numbers of lamps used in each room.
3. Canopy Square footage for the indoor Flowering room for sample NWPCC 11 was also inferred based on the total canopy square footage minus the reported canopy square footage reported for their Vegetative room. Square foot canopy cover per fixture and lighting types were reported for this sample’s Flowering room.
4. Length of photoperiod per year was not reported in the NWPCC data. To calculate annual EUI for canopy cover, the median for samples with reported photoperiods including length of photoperiod per year have been used.