
The Ends Justify the Mean: Outcome Measures for Estimating the Value of New Cancer Therapies
12
The Ends Justify the Mean: Outcome Measures for Estimating the Value of New Cancer Therapies Andrew Davies, MSc a , Andrew Briggs, DPhil b , John Schneider, PhD b , Adrian Levy, PhD c , Omar Ebeid, MPH b , Samuel Wagner, PhD d , Srividya Kotapati, PharmD d , Scott Ramsey, MD, PhD e a OXFORD OUTCOMES LTD,OXFORD, UK; b OXFORD OUTCOMES INC., MORRISTOWN, NJ; c OXFORD OUTCOMES INC., TORONTO, ON, CANADA; d ONCOLOGY DIVISION,BRISTOL-MYERS SQUIBB,NEW YORK, NY; AND e FRED HUTCHINSON CANCER RESEARCH CENTER,SEATTLE,WA - ABSTRACT OBJECTIVE: Overall survival is a commonly reported end point in clinical trial publications and a key determinant of therapies’ cost-effectiveness. Patients’ survival times have skewed distributions. Outcomes are typically presented in clinical trials as the difference in median survival times; we compare median survival gain with the measure required for economic evaluation, the mean difference. STUDY DESIGN: We summarize the relationships between median and mean survival in 4 parametric survival distributions and the relationship of the differences in these measures between trial arms and parameterized treatment effects. Parametric estimates of mean survival were compared with median survival in a case study of a recent trial in metastatic melanoma. RESULTS: In a trial of alternative therapies in unresectable metastatic melanoma, median overall survival with ipilimumab alone was 10.1 months versus 6.4 months with gp100-alone (hazard ratio 0.66; P ¼ 0.003). A log-normal parametric survivor function fitted the gp100 Kaplan-Meier function and a time ratio of 1.90 applied only after 90 days gave a suitable fit to the Kaplan-Meier function for ipilimumab, with mean survival difference of 7 months, compared with an estimate of 5.7 months employing a Weibull distribution, and with a 3.7-months median difference. CONCLUSION: Parametric assessment of mean survival gain in clinical trials may indicate potential benefits to patients that observed medians may greatly underestimate. KEYWORDS: Modeling; Oncology; Overall survival; Survival analysis See funding, conflict of interest, and authorship disclosures at the end of this article. Ó 2012 Elsevier Inc. All rights reserved Health Outcomes Research in Medicine (2012) 3, e25-e36 ORIGINAL RESEARCH ARTICLE
-
Upload
andrew-davies -
Category
Documents
-
view
216 -
download
5
Transcript of The Ends Justify the Mean: Outcome Measures for Estimating the Value of New Cancer Therapies

ORIGINAL
RESEARCH
ARTICLE
The Ends Justify the Mean: Outcome
Measures for Estimating the Value of New
Cancer Therapies
Andrew Davies, MSca, Andrew Briggs, DPhilb, John Schneider, PhDb, Adrian Levy, PhDc,Omar Ebeid, MPHb, Samuel Wagner, PhDd, Srividya Kotapati, PharmDd,Scott Ramsey, MD, PhDe
aOXFORD OUTCOMES LTD, OXFORD, UK; bOXFORD OUTCOMES INC., MORRISTOWN, NJ; cOXFORD OUTCOMES INC.,TORONTO, ON, CANADA; dONCOLOGY DIVISION, BRISTOL-MYERS SQUIBB, NEW YORK, NY; AND
eFREDHUTCHINSON CANCER RESEARCH CENTER, SEATTLE, WA
- A B S T R A C T
O B J E C T I V E : Overall survival is a commonly reported end point in clinical trial publications anda key determinant of therapies’ cost-effectiveness. Patients’ survival times have skewed distributions.Outcomes are typically presented in clinical trials as the difference in median survival times; we comparemedian survival gain with the measure required for economic evaluation, the mean difference.
S T U D Y D E S I G N : We summarize the relationships between median and mean survival in4 parametric survival distributions and the relationship of the differences in these measures between trialarms and parameterized treatment effects. Parametric estimates of mean survival were compared with mediansurvival in a case study of a recent trial in metastatic melanoma.
R E S U L T S : In a trial of alternative therapies in unresectable metastatic melanoma, median overallsurvival with ipilimumab alone was 10.1 months versus 6.4 months with gp100-alone (hazard ratio 0.66; P¼0.003). A log-normal parametric survivor function fitted the gp100 Kaplan-Meier function and a time ratio of1.90 applied only after 90 days gave a suitable fit to the Kaplan-Meier function for ipilimumab, with meansurvival difference of 7 months, compared with an estimate of 5.7 months employing a Weibull distribution,and with a 3.7-months median difference.
C O N C L U S I O N : Parametric assessment of mean survival gain in clinical trials may indicatepotential benefits to patients that observed medians may greatly underestimate.
K E Y W O R D S : Modeling; Oncology; Overall survival; Survival analysis
See funding, conflict of interest, and authorship disclosures at the end of this article.� 2012 Elsevier Inc. All rights reserved � Health Outcomes Research in Medicine (2012) 3, e25-e36

T
e26 Outcome Measures for Estimating the Value of New Cancer Therapies
he rapid increase in the cost of cancer therapeutics has renewed interest in methods for assessing the valueof cancer treatments.1-14 The impact of new oncology therapies is evaluated using a variety of end
points, including tumor response, symptom alleviation, and time to treatment failure. In some instances,clinical symptom measures and biomarkers may play a role. Progression-free survival and overall survival areimportant end points.15 The former has the advantage of being able to show significant effects with smallersample sizes and shorter follow-up than is required for overall survival, while overall survival represents a directand universally acceptedmeasure of benefit and has the advantage of being easily and accurately measured.15,16
Both progression-free survival and overall survival benefits are commonly reported in clinical trialpublications as the difference in median survival time between the 2 treatment arms. The use of mediansurvival time is common because it is possible to estimate median survival before all patients have experiencedan event, thereby allowing timelier reporting of estimates of survival gain as important oncology clinical trialresults are disseminated.
Nevertheless, reimbursement authorities around the world are concerned with value for money ofnew oncology products and cost-effectiveness analysis is often employed to provide an estimate of value. Incontrast to clinical evaluation, health economic evaluation is fundamentally interested in the mean costsand effects of treatment. This is because the remit of reimbursement authorities is to maximize total healthgain for a population for a given budget. Only the mean cost and effect, when multiplied by the number ofpatients treated, gives the total cost and overall health gain for that patient group. The incremental cost-effectiveness ratio summarizes the additional value of treatments based on an estimate of the mean cost differ-ence between 2 alternative treatments divided by the difference in their mean effects.17
In this article we explore commonly reported measures of survival in oncology trials with a view tounderstanding how these might differ from the preferred measure for economic evaluation e the meansurvival time. We describe the relationship between the median and mean survival time for popular para-metric survival distributions. Using data from oncology submissions to the UK’s National Institute for Healthand Clinical Excellence (NICE), we compare the ratios of reported median survival times with correspondingCox proportional hazards ratios. Finally, we compare parametric estimates of mean survival with reportedmedian survival in a case study of a recently published trial in metastatic melanoma to illustrate the practicalimportance of the issues.
M E A S U R E S O F S U R V I V A L I N C L I N I C A L A N DE C O N O M I C E V A L U A T I O N
Clinical trials in which the study end point is time to event (for example, disease progression ordeath) involve analysis of survival data typically characterized as containing censored and truncated survivaltimes. Censoring includes administrative censoring due to a single study end date after patients enter the studyat different times, and the loss of patients to follow-up over the course of the trial. Truncation relates to themaximum follow-up of survival times within a given study. Kaplan-Meier (KM) analysis addresses the issue ofcensoring and provides the product-limit estimate of the survivor function up to themaximum follow-up time,based on an assumption of independence between the censoring mechanism and the event of interest. Statis-tical tests such as the log-rank test18 provide P-values for the overall difference between the KM survivorfunctions but do not provide a basis for estimation of mean survival difference which requires an estimateof the area under the complete survival curve. To obtain the area under the complete survival curve, it isalso necessary to deal with the issue of truncation by projecting (extrapolating) beyond the maximum survivaltime in a study.
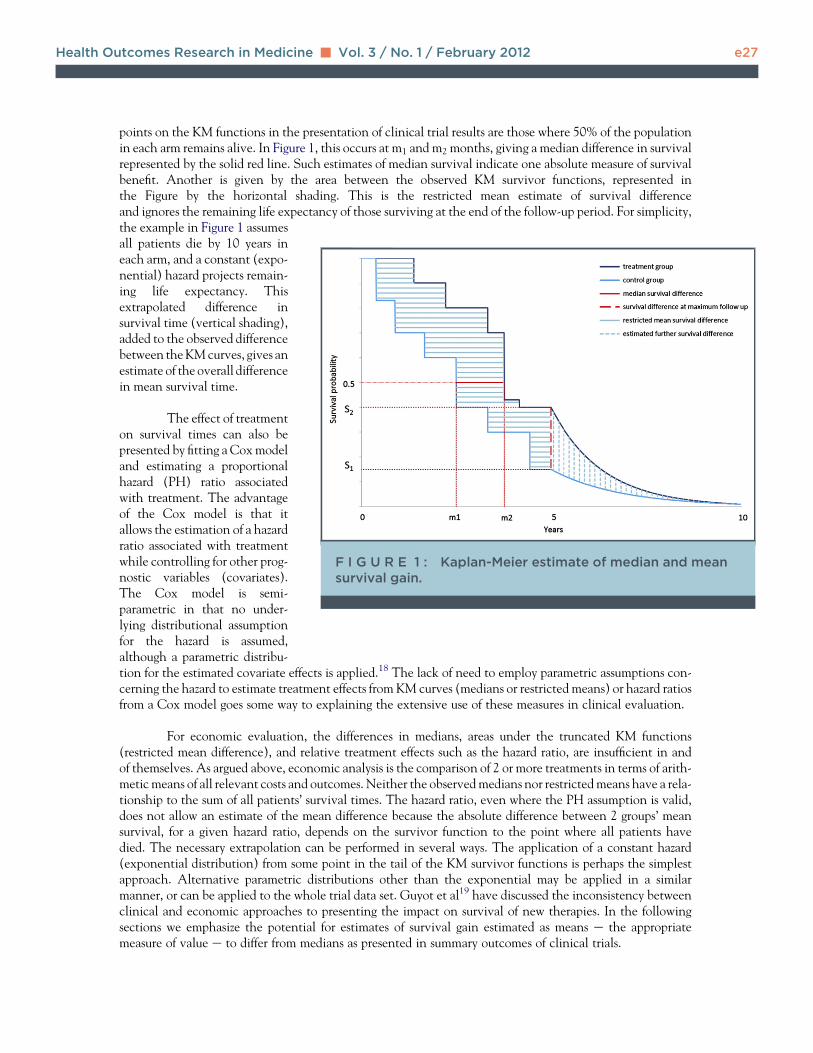
The probability of surviving beyond any time less than the final observation point can be read fromthe KM survivor function. In Figure 1, for example, the final observation point is at 5 years, at which time theproportions of patients surviving in the control and treatment arms are S1 and S2, respectively. Important
Health Outcomes Research in Medicine - Vol. 3 / No. 1 / February 2012 e27
points on the KM functions in the presentation of clinical trial results are those where 50% of the populationin each arm remains alive. In Figure 1, this occurs at m1 and m2 months, giving a median difference in survivalrepresented by the solid red line. Such estimates of median survival indicate one absolute measure of survivalbenefit. Another is given by the area between the observed KM survivor functions, represented inthe Figure by the horizontal shading. This is the restricted mean estimate of survival differenceand ignores the remaining life expectancy of those surviving at the end of the follow-up period. For simplicity,
F I G U R E 1 : Kaplan-Meier estimate of median and meansurvival gain.
the example in Figure 1 assumesall patients die by 10 years ineach arm, and a constant (expo-nential) hazard projects remain-ing life expectancy. Thisextrapolated difference insurvival time (vertical shading),added to the observed differencebetween theKMcurves, gives anestimate of the overall differencein mean survival time.
The effect of treatmenton survival times can also bepresented by fitting a Coxmodeland estimating a proportionalhazard (PH) ratio associatedwith treatment. The advantageof the Cox model is that itallows the estimation of a hazardratio associated with treatmentwhile controlling for other prog-nostic variables (covariates).The Cox model is semi-parametric in that no under-lying distributional assumptionfor the hazard is assumed,although a parametric distribu-
tion for the estimated covariate effects is applied.18 The lack of need to employ parametric assumptions con-cerning the hazard to estimate treatment effects from KM curves (medians or restricted means) or hazard ratiosfrom a Cox model goes some way to explaining the extensive use of these measures in clinical evaluation.For economic evaluation, the differences in medians, areas under the truncated KM functions(restricted mean difference), and relative treatment effects such as the hazard ratio, are insufficient in andof themselves. As argued above, economic analysis is the comparison of 2 or more treatments in terms of arith-metic means of all relevant costs and outcomes. Neither the observedmedians nor restrictedmeans have a rela-tionship to the sum of all patients’ survival times. The hazard ratio, even where the PH assumption is valid,does not allow an estimate of the mean difference because the absolute difference between 2 groups’ meansurvival, for a given hazard ratio, depends on the survivor function to the point where all patients havedied. The necessary extrapolation can be performed in several ways. The application of a constant hazard(exponential distribution) from some point in the tail of the KM survivor functions is perhaps the simplestapproach. Alternative parametric distributions other than the exponential may be applied in a similarmanner, or can be applied to the whole trial data set. Guyot et al19 have discussed the inconsistency betweenclinical and economic approaches to presenting the impact on survival of new therapies. In the followingsections we emphasize the potential for estimates of survival gain estimated as means e the appropriatemeasure of value e to differ from medians as presented in summary outcomes of clinical trials.

e28 Outcome Measures for Estimating the Value of New Cancer Therapies
M E D I A N V E R S U S M E A N S U R V I V A L E S T I M A T I O N :I N S I G H T S F R O M P A R A M E T R I C D I S T R I B U T I O N S
Given truncated survival times, some distributional form for the survivor function is required,whether in order to extrapolate from a point on the KM functions, or to fit parametric functions over thewhole. Many alternative parametric distributions have been proposed for survival data. The exponentialand Weibull are commonly used parametric proportional hazards models in economic evaluation. The log-normal and log-logistic are examples of accelerated failure time (AFT) parametric survivor functions.Whereas PH models are fitted on the log-hazard scale, AFT models use the log failure time. In the PH metric,hazard ratios<1 indicate longer times to death through lower hazards; in the AFTmetric, time ratios<1 indi-cate shorter times to death. The Weibull and exponential can be expressed in both PH and AFT metrics.Other AFT distributions have no PH interpretation, and time ratios are inconsistent with the hazard ratiosderived from the Cox model employed in clinical analyses.
The exponential distribution is one of the simplest distributions, and often approximates remaininglife expectancy very well.20-23
The exponential survivor function can be written:SðtÞ ¼ exp ð � ltÞ;where t is time and l is the failure rate (hazard). The median survival is defined as the point at which thesurvivor function is 50%. Setting S(t) ¼ 0.5 in the equation above and rearranging gives:Median ¼ �Inð0:5Þ=l:The area under the survival curve (integral of the survival function from t ¼ 0 to t ¼ infinity) gives theexpected survival time or mean life expectancy. For the exponential distribution, this simplifies to:Mean ¼ 1=l
As�ln(0.5)<1, the median survival time for the exponential distributionmust be less than the mean survivaltime. Indeed, it is straightforward to show that this is the case for all commonly used parametric survival func-tions, due to the right skewed nature of the distributions. In the particular case of the exponential distribution,the ratio of medians (Md) and means (Mn) is also equal to the hazard ratio (HR)MdAMdB
¼ MnAMnB
¼ lB
lA¼ HRB vs A
for hazards given by l for treatments A and B.
The exponential is a special case of the Weibull (Table), where the shape parameter, g, is 1. Forother values of g, the ratio of medians is also equal to the ratio of means, although the relationship to thehazard ratio is dependent upon g.
MdAMdB
¼ MnAMnB
¼�lB
lA
�1=g
¼ HRB vs A
The ratio of medians and means between arms also equates to the time ratio under the log-normal and log-logistic accelerated failure distributions given common shape parameters, s and g, respectively.MdAMdB
¼ MnAMnB
¼ jB
jA¼ TRA vs B
Note that for the log-logistic, the mean is formally undefined for g >1 (indicating a monotonicallydecreasing hazard), and the relationship only holds for g <1. In practice, log-logistic distributionswith g >1 are unlikely to fit oncology data well and therefore, this restriction is unlikely to be of majorimportance.

Health Outcomes Research in Medicine - Vol. 3 / No. 1 / February 2012 e29
Given a parameterized treatment effect, however, the ratio of the unobserved mean survival differenceto the ratio of the associatedmedians can be considered.With theWeibullg parameter equal to 1 (exponential),the mean survival in each arm is approximately 1.44 (1/�ln[0.5]) times the median. For g<1, the survivor func-
- T A B L E : Commonly used Survival Distributions inEconomic Evaluation
S(t) Mean Median
Exponential expf�ltg 1
l
�Inð0:5Þl
Weibull expf�ltgg 1
l
!1=g
G
1
gþ 1
! "�Inð0:5Þ
l
#1=g
Log-normal 1� f
lnt � ðb0 þ XJ bxÞ
s
!1
jes2=2 1
j
Log-logistic ½1þ fjtg1=g��1 1
j
gp
sinðgpÞ1
j
l¼proportional hazards scale¼ exp (b0þXJ bx); j¼ accelerated failure timescale ¼ exp(�b0 � XJbx); g ¼ shape parameter; G ¼ gamma function; f ¼cumulative standard normal distribution; expression for log-logistic meanapplies to g<1.
tion has a decreasing hazard and theratio of mean to median is >1.44.The top row of Figure 2 depicts thefrequency distributions for survivaltimes with Weibull shape parametersequal to 0.8 (decreasing hazard), 1.00(constant hazard, ie, exponential),and 3.5. As the shape parameterincreases (indicating an increasinghazard function over time), the distri-bution of survival times becomes lessskewed, until with the shape equal to3.5, the distribution of survival timesis approximately normal and themedian survival time is equal to themean. Although the mean need notexceed the median for certain param-eterizations of the Weibull, at thepoint this is true, the distributionbearslittle resemblance to observed survivaltimes in oncology, forwhich the distri-bution is naturally right skewed.
The mean and median ofthe log normal distribution are shown
in the Table in terms ofj and its SD, s. The ratio of the mean tomedian and this case is es22 . As in the case of the
Weibull distribution, the mean approaches the median only as the distribution becomes less skewed (Figure 2,
bottom row). For the log-logistic when g<1,24 the ratio of the mean to the median isgp
sinðgpÞ. Both these distri-butions are characterized by initially increasing, and then decreasing, hazard functions.
E M P I R I C A L D A T A O N T H E R E L A T I O N S H I P B E T W E E NM E D I A N R A T I O S A N D H A Z A R D R A T I O S
Although the mean survival time is rarely observable due to the issue of truncation, mediansurvival times can often be compared against their associated hazard ratios. Figure 3 presents sucha comparison based on clinical trials in a sample25-34 of readily available oncology submissions to theUK’s National Institute of Clinical Excellence. There is a strong positive correlation (0.89), withseveral cases lying on or close to the 45� line. Given the relationship between medians andparametric treatment effects (hazard or time ratios) identified above, this correlation may indicate thatsome form of proportionality between the treatment arms may hold either in terms of a proportionalhazard or constant time ratio.
Care should be taken, however, not to assume proportional treatment effects without assess-ment, for example, through log-cumulative hazard and percentile-percentile (or quantile-quantile)plots for proportional hazards and AFT models, respectively,18 as mean estimates may result that differmarkedly from estimates based on independently fitted distributions for each arm.

F I G U R E 2 : Impact of Weibull shape and log-normal sigma parameters ondistribution of survival times.
e30 Outcome Measures for Estimating the Value of New Cancer Therapies
Hurwitz et al’s (2004)35 comparison of irinotecan, bolus fluorouracil, and leucovorin plus bev-acizumab versus irinotecan, bolus fluorouracil, and leucovorin alone for metastatic colorectal cancer,illustrates, for example, the impact an assumption of proportional hazards may have on mean estimatesof survival. The trial reported a median difference of 4.7 months (ratio of medians 0.79, hazard ratio0.66). The evidence review group (TA11829) fitted independent Weibull distributions to the trial’sKM survivor functions (ie, there was no parameterization of the treatment effect). In fitting indepen-dent Weibulls, the assumption of proportional hazards is rejected. The basis for rejection of the propor-tional hazards assumption was not presented (lack of access to individual trial data may constrainassessment groups) but the fitted survivor functions appeared to fit the data reasonably well. The overallincremental mean survival gain estimated from the assessment group’s Weibull models was 4.9 months,similar to the observed median difference of 4.7 months.
C A S E S T U D Y
Hodi et al (2010)36 reported a trial of alternative therapies in HLA-A*0201-positive patients withunresectable stage III or IV (metastatic) melanoma, whose disease had progressed while they were receiving

Health Outcomes Research in Medicine - Vol. 3 / No. 1 / February 2012 e31
therapy for metastatic disease. There were 403 patients randomized to receive ipilimumab plus gp100(IPIþgp100), 137 to receive ipilimumab alone (IPI), and 136 to receive gp100 alone (gp100). Althoughthe original primary end point was the best overall response rate, this was amended to overall survival on
F I G U R E 3 : Median ratios versus hazard ratios.
the basis of phase 2 data andin alignment with anotherongoing phase 3 trial of ipili-mumab involving patientswith metastatic melanoma.The primary comparison inoverall survival was betweenthe IPIþgp100 group and thegp100-alone group. Prespeci-fied secondary end pointsincluded a comparison of over-all survival between the IPI-alone and the gp100-alonegroups and between the 2 ipili-mumab groups. We consideronly the comparison of IPI-alone and the gp100-alonegroup.
Patients were fol-lowed for up to 55 months.The median overall survivalin the IPI-alone group was10.1 months (95% CI, 8.0-13.8), compared with 6.4months (95% CI, 5.5-8.7) inthe gp100-alone group
(median survival difference 3.7 months; hazard ratio for death with IPI-alone as compared with gp100-alone, 0.66; P ¼ 0.003). The effect of ipilimumab on overall survival was independent of age, sex, baselineserum lactate dehydrogenase levels, metastasis stage of disease, and receipt or nonreceipt of previousinterleukin-2 therapy.The KM estimates of overall survival, restricted to the last observed point of observation, are 11.27and 18.87 months. The restricted mean difference at a common follow-up point of 48 months is 6.3 months,notably higher than the difference based on median survival. The proportions of patients surviving at thepoints the restricted means are calculated were 20.1% and 4.7%, respectively. One approach to estimatingadditional life expectancy beyond the restricted mean is to apply parametric hazard functions from a givenpoint on the KM function. Such an approach is depicted in Figure 4, extrapolating from the KM survivor func-tion at 48 months. Mean overall survival on this basis is 20.95 and 11.6 months for IPI and gp100, respec-tively. This estimate of 9.35 months improvement in overall survival is a further increase compared withthe restricted mean estimate. Although the KM estimate for the IPI arm at month 48 is approximately20%, there remain only 2 patients at risk. A single additional death in the IPI arm at approximately month52 would therefore have resulted in the proportion surviving in this group falling by half, with the resultingmean survival difference then being approximately equal to the restricted mean. This emphasizes how theselection of a suitable point on the KM function from which to extrapolate becomes increasingly arbitraryas the effective sample size decreases.
As the KM estimates in the tail are subject to particular uncertainty as the effective sample sizedecreases, methods of survival estimation based on fitting parametric distributions to the full range of thedata are often preferred. Although individual patient data with which to formally compare alternative

F I G Ucurves
e32 Outcome Measures for Estimating the Value of New Cancer Therapies
distributions’ fit to the data were not available to us, a log-normal distribution for the gp100 arm in Hodi et alwas provided by the trial sponsor, and on visual inspection, this appeared to be a better fit than Weibull orlog-logistic functions that were also supplied. Figure 5 shows the log-cumulative hazard plot, which wouldshow 2 straight parallel lines were the Weibull proportional hazards model a good fit to the data. Thepercentile-percentile plot in Figure 6, however, provides a reasonably straight line supporting an AFT model(as chosen by the sponsor). The slope of approximately 2.00 (when the post-90-days data are plotted)indicates an acceleration factor similar to the factor of 1.90 employed in the illustration below.
R E 4 : Case study showing empiric Kaplan-Meierand exponential extrapolation.
Figure 7 shows a log-normal survivor function thatfits the KM data for the gp100arm well and gives a meansurvival for gp100 of 11.5months. This also shows theIPI survival plotted relative tothat for gp100, assuming thereis no treatment effect in the first90 days, and a time ratio of 1.9thereafter, chosen to give a suit-able fit to the KM data. Themean survival estimated in thisway is 18.5 months. The corre-sponding mean survival differ-ence is 7 months, lower thanboth the restricted mean esti-mate and the estimate basedon appending exponential tailsto the KM curves due to themore conservative modeling ofthe tail of the IPI arm, butsubstantially greater than themedian-based estimate of thesurvival difference. Also shownin Figure 7 is an equivalentWeibull distribution fit to the
gp100 data, with the IPI arm generated by using a hazard ratio of 0.60 post 90 days. TheWeibull model gener-ates a mean difference in survival of 5.7 months, and clearly fits the observed gp100 data less well.
D I S C U S S I O N
In the oncology literature, many different measures are used to summarize study outcomes. Theseinclude median survival time, proportion surviving to a given time point, and the hazard ratio between 2 treat-ments. In particular, median survival time has been very popular in clinical and regulatory studies. This islikely due to an efficiency issue e median survival gives a very clearly defined end point to work towardsthat does not require the whole study sample to experience the event of interest. Nevertheless, there arepotential problems in using median survival time to interpret differences in effects between treatments.The median survival time will underestimate mean survival time for right-skewed data. This is true for allpopular parametric representations of survival, although for observed survival in any given study, the issueis an empirical one e it is possible that (non-parametric) KM functions can represent mean survival differ-ences that are less than the median difference.

Health Outcomes Research in Medicine - Vol. 3 / No. 1 / February 2012 e33
From a theoretical perspective, the ratio of median survival times may be a reasonable approximationto the hazard ratio and, indeed, the ratio of mean survival times between 2 groups. Some empirical support wasfound for this among NICE technology appraisal submissions for cancer. It is important to recognize that ineconomic analysis, it is the absolute benefit rather than the relative benefit that is of interest to decision-
F I G U R E 5 : Log-cumulative hazards (Hodi et al36).
makers e a 50% hazard reduc-tion may mean more in onepopulation than another due todifferences in the baseline riskof death. It may be preciselybecause measures of treatmenteffect such as the hazard ratiocan be difficult to interpret thatthe difference in mediansurvival times remains a popularmode of presentation of clinicaltrial results. In this article, wehave argued that the differencein median survival times willgenerally represent an underesti-mate of the difference in meansurvival for competing thera-pies, and that parametric esti-mates of mean survival can beused to inform comparisonsbased on estimates of the meanthat account for the skewednature of survival times.
Nevertheless, it isimportant to recognize the chal-lenges in estimating mean
survival time. Estimating the overall mean survival gain involves extrapolation beyond the point of thelast observed deaths in each trial arm. This inevitably involves some assumption as to the shape of the hazardfunction in the tail of the distribution and the nature of any treatment effect that may continue to apply. Bothof these assumptions may have significant effects on estimates of difference in mean survival, and cost-effectiveness, especially when relatively large proportions of patients remain alive at study end. Althoughthe mean is the desired result, the median of the survivor distribution may play a valuable role in interpretingparametric estimates. Given that the median can be expected to be a conservative estimate of survival gain,the closer predicted mean differences are to the median, the less is the potential that the assumptionsemployed in estimating the mean will bias the result upwardly.In cancer trials of medical treatments, patients can cross over (switch) from their allocated treatmentto another trial treatment, nontrial treatment, or stop receiving treatment altogether. In the majority of cases,these switches are nonrandom and are related to disease progression, signaling an apparent failure of treat-ment. While this does not cause a problem for regulatory trials that have progression-free survival as theprimary end point, it will bias the assessment of overall survival for reimbursement purposes. In the presenceof crossover from control to active treatment, intention-to-treat analysis may then underestimate the truetreatment effect. The bias can be even greater when a per-protocol analysis approach is used. In a recent simu-lation study for the NICE Decision Support unit, alternative estimators for handling crossover were system-atically explored.37 An approach to adjusting for crossover suggested by Branson and Whitehead38 (anadaptation of the approach suggested by Robins and Tsiatis39), in which each patient’s observed eventtime was related to an event time observed if treatment was not received, was assessed as having performedmost reliably.

F I G U R E 6 : Percentile-percentile plot for Hodi et al.36
F I G U R E 7 : Case study showing empiric Kaplan-Meiercurves and log-normal survivor functions.
e34 Outcome Measures for Estimating the Value of New Cancer Therapies
Where standard para-metric distributions can be em-ployed, the relationshipbetween the mean and mediansurvival differences can be reli-ably estimated, explicitly incor-porating treatment effectsbased on proportional hazardor AFT ratios, and adjustmentssuch as Branson and White-head’s38 employed to addresspotential bias that may resultdue to crossover. Although itmay not always be possible tomake neat parametric assump-tions about baseline (ie, controlarm) survival, or constant rela-tive treatment effects, para-metric models can be modifiedusing explicit assumptions andempirical estimation to capturea variety of survival profiles.
Where baseline (ie,control arm) survival is not
amenable to modeling on the basis of standard parametric survival distributions, more sophisticatedapproaches such as flexible parametric survival functions40,41 can be employed. In our example ofHodi et al,36 however, simply delaying the application of the constant relative treatment effect is sufficientto represent the KM survival functions in the trial. Although the treatment effect employed is not
that reported in the clinicaltrial, the relationship assumedbetween treatment and survivalis explicit, and the resultingsurvival estimates can be in-terpreted accordingly. Esti-mating survival based onparametric functions over theentire period in this case avoidsthe bias that might arise inextrapolating beyond the lastobservation point by app-ending parametric functionsto a point in the tail of theKM functions. In other circum-stances, estimates of survivalgain might be influenced byextrapolation assumptions withimplications that are less clear.
Estimates of meanrather than median overallsurvival are important if theimplications of alternative

1. Di Maiocancer cl67(2):127
2. Hoos A,immunot
3. Huang Lsurvival tbased surular canc
4. Ludbrookpitfalls of
5. Ramsey SOncologis
6. Seppä K,effects fo2781-279
7. TappendeodologicaCancer. 2
8. Ahmed Fodologica
9. Fleming Tand futur
10. Gu Y, Siproportio
11. Kim S, Cdata with
12. Peng Y, Tfailure tim13(3):351
13. Zhang J,Anal. 200
14. Fisher LDhazards re
15. U.S. Deptration. GCancer Distration;
16. McCain J2010;19(5
17. DrummonMethods fUK: Oxfo
Health Outcomes Research in Medicine - Vol. 3 / No. 1 / February 2012 e35
treatments are to be fully evaluated. Although other measures of treatment benefit are important, their impor-tance to patients and other decision-makers is set in the context of expected overall survival gains. Parametricextrapolation of some form is often necessary to estimate expected survival. Uncertainty about the mostappropriate assumptions to employ in performing extrapolation should be recognized and explored in esti-mating mean overall survival gains.
Corresponding Author: Andrew Davies, MSc, Oxford Outcomes Ltd., United Kingdom, Seacourt Tower, West Way,Oxford OX2 0JJ, UK.E-mail address: [email protected] Outcomes Ltd. and Dr. Ramsey received consulting fees from Bristol-Myers Squibb relating to this manuscript.Drs. Wagner and Kotapati are employees of Bristol-Myers Squibb. Bristol-Myers Squibb provided data relating to thestudy by Hodi et al employed as a case study in the manuscript. Mr. Davies and Dr. Briggs co-drafted the first draft ofthe manuscript. The authors report no conflicts of interest.
R E F E R E N C E S
18. Collet D.Chapman
19. Guyot P,randomizefficacy a
20. Huang Xtime-depe
21. Lee J, Kia bivaria119-137.
22. WellnerLifetime D
23. Zisman Avidual sur20(5):136
24. Jenkins Suk/files/te24, 2012.
25. Nationalcapecitabfor metasTA061. A
26. Nationalcapecitabment of lowww.nice
27. Nationalcancer (a(IrinotecaAvailable2012.
28. NationalgemcitabimetastaticAccessed
29. National(metastatcetuximaat: http://
30. National Icell) - pemlung canc24, 2012.
M, Gallo C, De Maio E, et al. Methodological aspects of lunginical trials in the era of targeted agents. Lung Cancer. 2009;-135.Eggermont AM, Janetzki S, et al. Improved endpoints for cancerherapy trials. J Natl Cancer Inst. 2010;102(18):1388-1397., Cronin KA, Johnson KA, Mariotto AB, Feuer EJ. Improvedime: what can survival cure models tell us about population-vival improvements in late-stage colorectal, ovarian, and testic-er? Cancer. 2008;112(10):2289-2300.J, Royse AG. Analysing clinical studies: principles, practice andKaplan-Meier plots. ANZ J Surg. 2008;78(3):204-210.A, Schickedanz A. How should we define value in cancer care?t. 2010;15(Suppl 1):1-4.Hakulinen T, KimHJ, Läärä E. Cure fraction model with randomr regional variation in cancer survival. Stat Med. 2010;29(27):3.n P, Chilcott J, Ward S, Eggington S, Hind D, Hummel S. Meth-l issues in the economic analysis of cancer treatments. Eur J006;42(17):2867-2875.E,Vos PW,Holbert D.Modeling survival in colon cancer: ameth-l review. Mol Cancer. 2007;6:15.R, Lin DY. Survival analysis in clinical trials: past developmentse directions. Biometrics. 2000;56(4):971-983.nha D, Banerjee S. Analysis of cure rate survival data undernal odds model. Lifetime Data Anal. 2011;17(1):123-134.hen MH, Dey DK. A new threshold regression model for survivala cure fraction. Lifetime Data Anal. 2011;17(1):101-122.aylor JMG, Yu B. A marginal regression model for multivariatee data with a surviving fraction. Lifetime Data Anal. 2007;-369.Peng Y. Accelerated hazards mixture cure model. Lifetime Data9;15(4):455-467., Lin DY. Time-dependent covariates in the Cox proportional-gression model. Annu Rev Public Health. 1999;20:145-157.artment of Health and Human Services Food and Drug Adminis-uidance for Industry Clinical Trial Endpoints for the Approval ofrugs and Biologics. Rockville MD: U.S. Food and Drug Admin-2007.A. The ongoing evolution of endpoints in oncology.Manag Care.)(Suppl 1):1-12.d MF, Sculpher MJ, Torrance GW, O’Brien BJ, Stoddart GL.or the Economic Evaluation of Health Care Programmes. Oxford,rd University Press; 2005.
Modelling Survival Data in Medical Research. 2nd ed. London:& Hall; 2003.Welton NJ, Ouwens JN, Ades AE. Survival time outcomes ined, controlled trials and meta-analyses: the parallel universes ofnd cost-effectiveness. Value Health. 2011;14:640-646., Chen S, Soong SJ. Piecewise exponential survival trees withndent covariates. Biometrics. 1998;54(4):1420-1433.m J, Jung SH. Bayesian analysis of paired survival data usingte exponential distribution. Lifetime Data Anal. 2007;13(1):
JA. On an exponential bound for the Kaplan-Meier estimator.ata Anal. 2007;13(4):481-496., Pantuck AJ, Dorey F, et al. Mathematical model to predict indi-vival for patients with renal cell carcinoma. J Clin Oncol. 2002;8-1374.. Survival analysis (2005). Available at: http://www.iser.essex.ac.aching/stephenj/ec968/pdfs/ec968lnotesv6.pdf. Accessed January
Institute for Health and Clinical Excellence. Colorectal cancer -ine and tegafur uracil (TA61). (Capecitabine and tegafur uraciltatic colorectal cancer). Available at: http://www.nice.org.uk/ccessed January 24, 2012.Institute for Health and Clinical Excellence. Breast cancer -ine (TA62). (Guidance on the use of capecitabine for the treat-cally advanced or metastatic breast cancer). Available at: http://.org.uk/TA062. Accessed January 24, 2012.Institute for Health and Clinical Excellence. Colorectaldvanced) - irinotecan, oxaliplatin and raltitrexed (TA93).n, oxaliplatin and raltitrexed for advanced colorectal cancer).at: http://www.nice.org.uk/TA093. Accessed January 24,
Institute for Health and Clinical Excellence. Breast cancer -ne (TA116). (Bevacizumab and cetuximab for the treatment ofcolorectal cancer). Available at: http://www.nice.org.uk/TA116.January 24, 2012.Institute for Health and Clinical Excellence. Colorectal canceric) - bevacizumab and cetuximab (TA118). (Bevacizumab andb for the treatment of metastatic colorectal cancer). Availablewww.nice.org.uk/TA118. Accessed January 24, 2012.nstitute forHealth andClinical Excellence.Lungcancer (non-small-etrexed (TA124). (Pemetrexed for the treatment of non-small-celler). Available at: http://www.nice.org.uk/TA124. Accessed January

31. Nationalpemetrexof mesothJanuary 2
32. Nationalsmall-cellcell lungJanuary 2
33. Nationalcell) - topcell lungJanuary 2
34. Nationalnoma (adcellular cAvailable
35. Hurwitz Hcan, fluorMed. 200
36. Hodi FS,mab in p711-723.
37. Morden Jmethodstrials: a si
38. Bransonstudies in2449-246
39. Robins JMtrials usinTheory M
40. Roystonodds modmodelling2175-219
41. Jackson Cevaluatiostat. 2010
e36 Outcome Measures for Estimating the Value of New Cancer Therapies
R E F E R E N C E S Continued
Institute for Health and Clinical Excellence. Mesothelioma -ed disodium (TA135). (Pemetrexed disodium for the treatmentelioma). Available at: http://www.nice.org.uk/TA135. Accessed4, 2012.Institute for Health and Clinical Excellence. Lung cancer (non-) - erlotinib (TA162). (Erlotinib for the treatment of non-smallcancer). Available at: http://www.nice.org.uk/TA162. Accessed4, 2012.Institute for Health and Clinical Excellence. Lung cancer (small-otecan (TA184). (Topotecan for the treatment of relapsed small-cancer). Available at: http://www.nice.org.uk/TA184. Accessed4, 2012.Institute forHealth andClinical Excellence.Hepatocellular carci-vanced and metastatic) - sorafenib (first line) (TA189). (Hepato-arcinoma (advanced and metastatic) - sorafenib (first line).at: http://www.nice.org.uk/TA189. Accessed January 24, 2012., Fehrenbacher L, Novotny W, et al. Bevacizumab plus irinote-ouracil, and leucovorin for metastatic colorectal cancer. N Engl J4;350(23):2335-2342.
O’Day SJ, McDermott DF, et al. Improved survival with ipilimu-atients with metastatic melanoma. N Engl J Med. 2010;363(8):
P, Lambert PC, Latimer N, Abrams KR, Wailoo AJ. Assessingfor dealing with treatment switching in randomised controlledmulation study. BMC Med Res Methodol. 2011;11:4.M, Whitehead J. Estimating a treatment effect in survivalwhich patients switch treatment. Stat Med. 2002;21(17):
3., Tsiatis AA. Correcting for non-compliance in randomizedg rank preserving structural failure time models. Commun Statethods. 1991;20(8):2609-2631.P, Parmar MK. Flexible proportional-hazards and proportional-els for censored survival data, with application to prognosticand estimation of treatment effects. Stat Med. 2002;21(15):
7., Sharples L, Thompson S. Survival models in health economicns: balancing fit and parsimony to improve prediction. Int J Bio-;6(1). Article 34.