The Empirical Linkages of organizational learning and ...saicon2011.ciitlahore.edu.pk/11-1280 dr....
37
The Empirical Linkages of organizational learning and Competitive advantage Authors Name: 1. Dr. Naveed Akhtar, Assistant Professor, Department of Management Sciences, National University of Modern Languages, Islamabad, Pakistan (Email: [email protected] ) (Corresponding Author) 2. Dr. Rasheed Ahmed Khan, Dean Department of Management Sciences, National University of Modern Languages, Islamabad, Pakistan
Transcript of The Empirical Linkages of organizational learning and ...saicon2011.ciitlahore.edu.pk/11-1280 dr....

The Empirical Linkages of organizational learning and Competitive advantage Authors Name:
1. Dr. Naveed Akhtar, Assistant Professor, Department of Management Sciences, National University of Modern Languages, Islamabad, Pakistan (Email: [email protected]) (Corresponding Author)
2. Dr. Rasheed Ahmed Khan, Dean Department of Management Sciences, National University of Modern Languages, Islamabad, Pakistan

1. Introduction
To proactively survive and being alive in a world of ever changing scenarios where scarce resources are becoming more and more costly to acquire. This situation of immense competition necessitated the use of these costly resources optimally exploiting their full potential without waste and rework. In Technological changes and changing needs of knowledge-based economy the organizations need not only to adapt quickly to changes but must also develop such mechanisms that help them to be ahead of competitors. Therefore today’s organizations are struggling and should try to have a learning organization culture of creating, acquiring, and transferring knowledge and modifying its behavior to reflect new knowledge and insights (Garvin, 1993). The importance of individual knowledge or building personal knowledge has its own place in the concept of a learning organization. Therefore to develop individuals, and nurture learning a culture of learning organization facilitates the learning process. The learning organization process results in a culture that achieves competitive advantage (De Geus, 1988). The public and private organizations of Pakistan are striving hard to plan and implement strategic efforts to become and remain competitive. Petroleum organizations are the most agile institutions of Pakistan which are always ahead in adapting and proactively searching for new areas to improve and think strategically. There is a need of such dimensions and tools that help organizations to measure, evaluate, and point strategic directions that are necessary to increase the learning and to achieve competitive advantage. It is also important for such organizations, like Petroleum Companies of Pakistan; to measure how successful are their processes and outcomes of their strategic efforts? The normative theories on Organizational learning and learning organization do exist but research in Pakistani context is essential. Extensive literature review on LO points a dire need of empirical work in the area of organizational learning (Huber 1991) as the most of the works like Senge (1990) which provides insights are reflections (Bui and Baruch, 2010) and any empirical work is small (Di Milia & Birdi, 2009). The researcher agrees the philosophy of creating a tool to measure a learning organizations (Garvin et al., 2008; Bui & Baruch, 2010) that enable organizations to identify and facilitate a change in ever-changing and competitive environment. Bui and Baruch (2010) maintain that the quantitative applications in the learning organization literature are far less frequent and the knowledge development and progress in understanding phenomenon may be gained from both qualitative and quantitative methods. The other concept of this study is competitive advantage.
O’Brien defines competitive advantage as, “developing products, services, or capabilities that give a company a superior business position relative to its competition and other competitive forces (O’Brien, 2004, p.G-3). A competitive advantage is achieved from the strategy which is formed in result of the industry analysis, and analysis of internal resources and competencies.
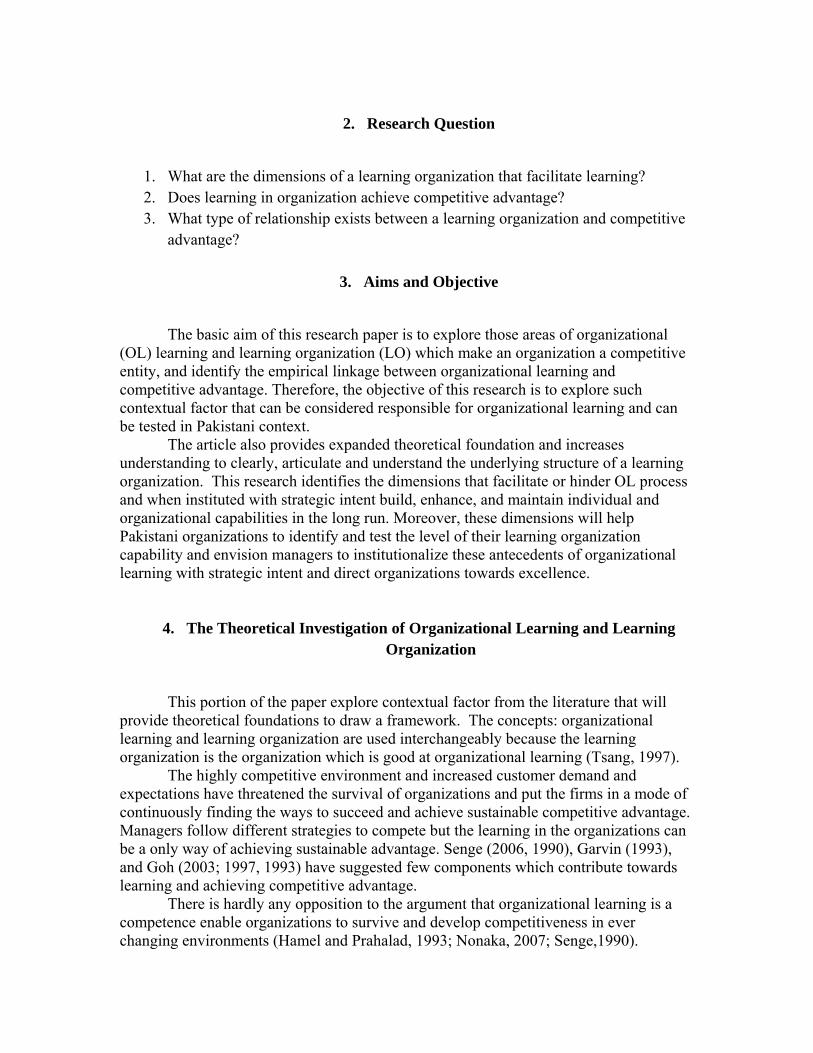
2. Research Question
1. What are the dimensions of a learning organization that facilitate learning? 2. Does learning in organization achieve competitive advantage? 3. What type of relationship exists between a learning organization and competitive
advantage?
3. Aims and Objective
The basic aim of this research paper is to explore those areas of organizational (OL) learning and learning organization (LO) which make an organization a competitive entity, and identify the empirical linkage between organizational learning and competitive advantage. Therefore, the objective of this research is to explore such contextual factor that can be considered responsible for organizational learning and can be tested in Pakistani context. The article also provides expanded theoretical foundation and increases understanding to clearly, articulate and understand the underlying structure of a learning organization. This research identifies the dimensions that facilitate or hinder OL process and when instituted with strategic intent build, enhance, and maintain individual and organizational capabilities in the long run. Moreover, these dimensions will help Pakistani organizations to identify and test the level of their learning organization capability and envision managers to institutionalize these antecedents of organizational learning with strategic intent and direct organizations towards excellence.
4. The Theoretical Investigation of Organizational Learning and Learning Organization
This portion of the paper explore contextual factor from the literature that will provide theoretical foundations to draw a framework. The concepts: organizational learning and learning organization are used interchangeably because the learning organization is the organization which is good at organizational learning (Tsang, 1997). The highly competitive environment and increased customer demand and expectations have threatened the survival of organizations and put the firms in a mode of continuously finding the ways to succeed and achieve sustainable competitive advantage. Managers follow different strategies to compete but the learning in the organizations can be a only way of achieving sustainable advantage. Senge (2006, 1990), Garvin (1993), and Goh (2003; 1997, 1993) have suggested few components which contribute towards learning and achieving competitive advantage. There is hardly any opposition to the argument that organizational learning is a competence enable organizations to survive and develop competitiveness in ever changing environments (Hamel and Prahalad, 1993; Nonaka, 2007; Senge,1990).
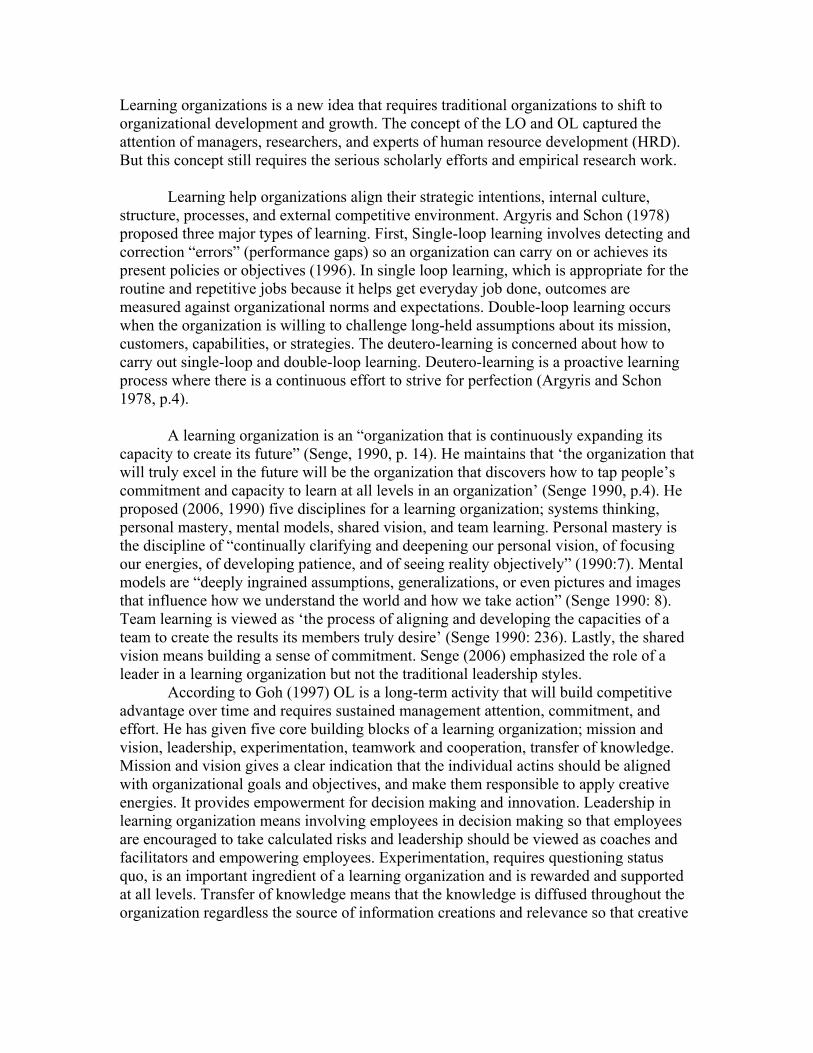
Learning organizations is a new idea that requires traditional organizations to shift to organizational development and growth. The concept of the LO and OL captured the attention of managers, researchers, and experts of human resource development (HRD). But this concept still requires the serious scholarly efforts and empirical research work. Learning help organizations align their strategic intentions, internal culture, structure, processes, and external competitive environment. Argyris and Schon (1978) proposed three major types of learning. First, Single-loop learning involves detecting and correction “errors” (performance gaps) so an organization can carry on or achieves its present policies or objectives (1996). In single loop learning, which is appropriate for the routine and repetitive jobs because it helps get everyday job done, outcomes are measured against organizational norms and expectations. Double-loop learning occurs when the organization is willing to challenge long-held assumptions about its mission, customers, capabilities, or strategies. The deutero-learning is concerned about how to carry out single-loop and double-loop learning. Deutero-learning is a proactive learning process where there is a continuous effort to strive for perfection (Argyris and Schon 1978, p.4).
A learning organization is an “organization that is continuously expanding its capacity to create its future” (Senge, 1990, p. 14). He maintains that ‘the organization that will truly excel in the future will be the organization that discovers how to tap people’s commitment and capacity to learn at all levels in an organization’ (Senge 1990, p.4). He proposed (2006, 1990) five disciplines for a learning organization; systems thinking, personal mastery, mental models, shared vision, and team learning. Personal mastery is the discipline of “continually clarifying and deepening our personal vision, of focusing our energies, of developing patience, and of seeing reality objectively” (1990:7). Mental models are “deeply ingrained assumptions, generalizations, or even pictures and images that influence how we understand the world and how we take action” (Senge 1990: 8). Team learning is viewed as ‘the process of aligning and developing the capacities of a team to create the results its members truly desire’ (Senge 1990: 236). Lastly, the shared vision means building a sense of commitment. Senge (2006) emphasized the role of a leader in a learning organization but not the traditional leadership styles. According to Goh (1997) OL is a long-term activity that will build competitive advantage over time and requires sustained management attention, commitment, and effort. He has given five core building blocks of a learning organization; mission and vision, leadership, experimentation, teamwork and cooperation, transfer of knowledge. Mission and vision gives a clear indication that the individual actins should be aligned with organizational goals and objectives, and make them responsible to apply creative energies. It provides empowerment for decision making and innovation. Leadership in learning organization means involving employees in decision making so that employees are encouraged to take calculated risks and leadership should be viewed as coaches and facilitators and empowering employees. Experimentation, requires questioning status quo, is an important ingredient of a learning organization and is rewarded and supported at all levels. Transfer of knowledge means that the knowledge is diffused throughout the organization regardless the source of information creations and relevance so that creative

thinking is fostered. Teamwork and cooperation brings the individual expertise and skills at one place to solve the problems.
Garvin’s (1993) has stated five activities of the learning organization in his model of organizational learning which are; Systematic Problem-Solving, transfer of knowledge learning form experience and history, learning from others, and experimentation. Systematic Problem-Solving means that the “members of the same department or business-unit team, and the tools are applied to real problems facing the groups” (p.82). This helps provide a common vocabulary for team members while demonstrating and reinforcing a consistent approach to problem solving. Experimentation means systematic and scientific approach to seek knowledge “but unlike problem solving experimentation is motivated by opportunities and expanding horizons, not by current difficulties” (p.82). Learning form experience and history concerns the maintaining and assessment of the company history of success and failure and give employee access to this record. Learning from others perspective gives the opportunity to look outside the organization to see the best practices around the industry and incorporate them into the processes. Transfer of knowledge component stresses the idea of sharing of information across the departments so that maximum benefit can be achieved.
Gephart and Marsick (1996) identified six essential features of a learning
organization: continuous learning at the systems level; knowledge generation and sharing; critical, systemic thinking; a culture of learning; a spirit of flexibility and experimentation; people centred. The systems level continuous learning entails the synthesis of the people’s knowledge and changing it into of the organizational memory. Knowledge generation and sharing from individual employees are encouraged and all employees have access to the strategic information. Critical, systemic thinking means that people are always encouraged to think in new ways and use productive reasoning skills systemically in order to see link and feedback loops, and critically in order to identify assumptions. A culture of learning means a culture of trust and openness which encourages inquiry and dialogue needed to challenge assumptions. Learning and creativity are rewarded, supported, and promoted through various performance systems from the top down. A spirit of flexibility and experimentation means the people are free to take risks, experiment, innovate, explore new ideas, and generate new work processes and products. People centred approach of a learning organization reflects that people are taken care of and every individual is developed and supported and values. They also view that the leadership plays an important role in the learning and development of individuals and teams. They claim an empowered employee instead of only leadership and management.
According to Bennet & O’Brien (1994) the aim of a learning organization is to affect change and improvement in business and the individual employee as well. They have discussed twelve key factors that influence an organizations ability to learn and change. These factors are: strategy/vision; executive practices; managerial practices; climate; organization/job structure; information flow; individual and team practices work processes; performance goals/feedback; training/education; individual/team development; and rewards/recognition.
Garvin, Edmondson and Gino (2008) presented three building blocks for organizational learning and adaptability: a supportive learning environment, concrete learning processes and practices, and leadership behaviour that provides reinforcement. Firstly, a supportive learning environment is further divided into four characteristics i.e. psychological safety, appreciation of differences, openness to new ideas, and time for reflection. Secondly, Concrete learning processes and practices involve the generation, collection, interpretation, and dissemination of information and experimenting with new ideas is encouraged. Concreted learning processes and practices are further divided into five sub-components; Experimentation, Information collection, Analysis, Education and training, Information transfer. Thirdly, leadership that reinforces learning. They noted that organizational learning is strongly influenced by the behaviour of leaders. People feel encouraged to learn when leaders provide opportunities to speak and facilitate the promulgation of ‘dialogue and debate’. This is the job of leaders to entertain different view points to feel employees encouraged present new ideas and options.
Other studies (Lei et al., 1999; Goh & Richards, 1997; Garvin et al., 2008) have on LO are also of the view that there are certain factors that facilitate or hinder learning in the organizations. Lei et al. (1999) proposed few areas to foster learning in organizations: organizational design, organizational structure, decision-making processes, cross-functional teams, reward systems, management development, and corporate culture. They also highlighted the role of senior leadership in the development of organizational environment that facilitates internal change and OL. They think vision and mission an important ingredient to establish a learning, flexible, and responsive culture.
Goh and Richards (1997) identified five organizational characteristics and management practices that promote organizational learning: Clarity of purpose and mission that is understood throughout the organization, and each employee should be committed to these goals; Leadership commitment and empowerment means leaders help employees to identify performance gaps and then help set goals that encourage the search for knowledge to narrow and solve these performance gaps; Experimentation and rewards means experimenting with new ideas must be encouraged, and risk-taking and innovation should be rewarded; Transfer of knowledge means information acquired and distributed should be related with organizational problems and passed onto each unit and function. Communication should be clear, fast and focused; Teamwork and group problem solving means that employees share their knowledge and become aware of needs of others, and nature of work in different parts of the organization. Teams should have the ability to work cross-functionally.
Parek (2003) defines OL as “the process by which an organization acquires, retains, and uses inputs for its development, and the process results in an enhanced capacity for continued self-learning and self-renewal” (p. 657). His framework discusses eight components: Holistic frame which enable managers to think systemically and identify patterns rather than discrete events; Strategic thinking helps managers to view the strategic impact of each activity and to think of consequences of their actions; Shared vision should be inspiring, linked with employee’s goals, and generate commitment; Empowerment is concerned with the appropriate authority, direction, and support to accomplish their task; Information flow means that all critical and authentic information

must be shared at all levels; Emotional maturity means control over most part of ones’ destiny, optimism, self-discipline, commitment, and moderate risk-taking; Learning mean conducive environment that encourages dialogue and discussion, and people can present their ideas; Synergy means collaboration and team work where people are willing to suspend their assumptions and think together, and cross-functional teams are used.
All frameworks discussed directed researcher to choose the most important and
common characteristics of a learning organization. These characteristics of a learning organization are chosen for empirical study: holistic thinking/systems thinking; strategic thinking; strategic learning; synergy; empowerment; knowledge/information flow, and internality.
5. Competitive Advantage
Competitive advantage, a multidimensional concept (Oster, 1999) is achieved through the industry analysis (Porter, 2008), resource-based view (Barney, 1991, Reed & DeFillipi, 1990; Fahy, 2000; Connor, 1985), culture (Grant, 1991; Barney, 1986b), technology (Burgelman & Grove with Mezia, 2006; Porter & Miller, 1985; Powel & Dent-Micalf, 1997), and through competencies (Prahalad & Hamel, 1990; King, Zeithaml, 2001). Competitive analysis (Porter, 1980) provides information about the economic forces operating in the external environment (Porter, 1980, 1985) whereas resource-base view analyzes internal capabilities and strengths possessed by the firm. It can inferred that environment analysis is necessary but the internal resource analysis is inevitable as it provides unique internal organizational information which is not available to other firms(competitors) in the industry and help design a unique strategy that is inimitable and can not be substituted (Barney, 1991). Competitive advantage means achieving better organizational performance than competitors (Porter, 1980) and performing different activities, or performing activities differently than the competitors is the essence of the strategy and is the heart of the competitive advantage (Porter, 1996). According to Barney (1991) a sustained competitive advantage is achieved when a firm is implementing a value creating strategy not simultaneously being implementing by any current or potential competitor and when these other firms are unable to duplicate the benefits of this strategy (Barney 1991, P-102). Literature reveals that achievement of advantage manifest in improved organizational financial performance, reduction in cost, better reputation, and better brand image.
6. Theoretical Framework, Operational definition, and Hypotheses Development:
6.1 Systems Thinking/Holistic Thinking A system thinking is the component which help understand interrelated underlying patterns within business and enable people to see the whole organization instead of focusing on the parts. It gives a holistic picture of the system under study instead of considering just a snapshot. It helps people to solve the problems with a context of a larger scenario instead of fixing the problems as a discrete activity. System

thinker is able to understand the inter interrelationship of activities happening inside the organizations. H 1: Holistic thinking is positively related with competitive advantage
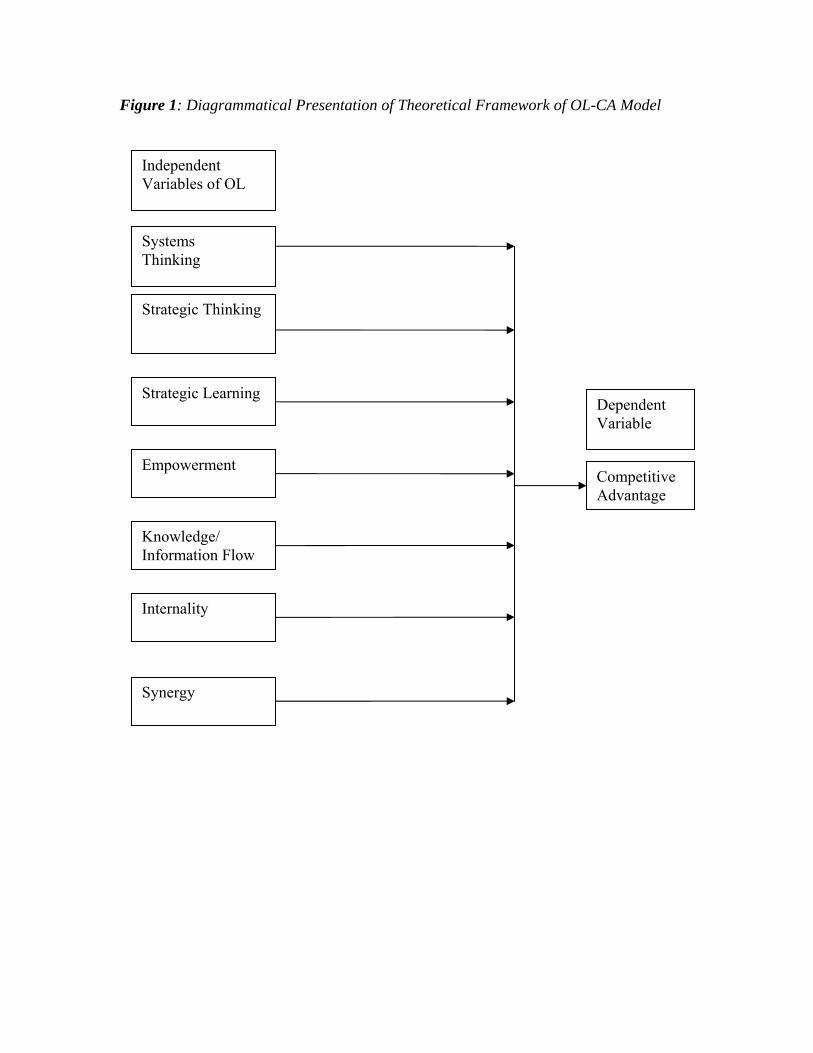
Figure 1: Diagrammatical Presentation of Theoretical Framework of OL-CA Model
Strategic Thinking
Strategic Learning
Empowerment
Knowledge/ Information Flow
Internality
Synergy
Competitive Advantage
Systems Thinking
Dependent Variable
Independent Variables of OL

6.2 Strategic Thinking/Culture The past experiences which form assumptions constitute a picture of the world in our mind and enable us to understand the events and to take actions accordingly. Managers understand the results of their actions and are able prioritize their task as per organizational objectives. Managers provide a conducive environment for learning. H 2: Management encourages employees to take action, present ideas and facilitates participation. Strategic thinking is positively related competitive advantage.
6.3 Strategic Learning/Mission
A shared vision is a common purpose which is understood across the organization and commits employee to the organizational cause. It helps people take initiative and take risk.
H 3: A clear shared vision increases commitment, enhances learning capability, improves performance, and is positively related with the achievement of competitive advantage
6.4 Empowerment/Leadership Empowerment delegates authority and extends responsibility to achieve the organizational objectives. In a learning organization employees feel empowered and their personal goals are aligned with organizational objectives. Leaders create a learning environment where employees can experiment and risk taking is rewarded. People are encouraged to take decisions.
H 4: Leadership provides a learning environment, empowers employees, and is directly related with the competitive advantage
6.5 Knowledge & Information Flow In a learning organization the information flows is quick, and is spread across the departments. Success in a department is shared in other departments. Strategic information is shared with all employees directly.
H 5: Knowledge Flow is useful to the organizational learning and is positively related with competitive advantage
6.6 Internality/Learning
People in the organizations are able to identify the gap between present position
and desired position by seeing current reality more clearly and are aware of their and organizational capabilities. H 6: People are willing to learn and work, and understand what is necessary for organization to improve. Internality is positively related with competitive advantage. 6.7 Synergy A team is a synergistic whole with differing capabilities, directed towards a common goal. Where people feel free to talk and are willing to listen others. The empowered people are free to take decisions. Team members perform coordinated actions, share responsibilities, respect and trust each other.
H 7: Synergy is positively related with competitive advantage
6.8 Competitive advantage Organizations equipped with hi-tech research and development department, having low cost, innovative products. Organizations are enjoying a good reputation and brand image. They are better financial performers as compared to their rivals.
6.9 Organizational Learning and competitive advantage
H8: Organizational learning is taking place in the petroleum organizations of Pakistan and the OL is positively related with the Competitive Advantage
7. Research Design and Methodology
The relationship of two concepts: organizational learning (OL) and competitive advantage (CA) is statistically examined through the following methodology.
Validity and reliability of the instrument was measured. Data was summated before the measuring the reliabilities. Validity is the ability of a research instrument to measure the concept, what it is designed to measure. Validity was established through content validity and face validity. Content validity shows the adequate coverage of the subject matter (Cooper & Schindler, 2006) and is considered good when it represents the sample of the universe of the concept being measured (Sekaran, 2003). Content validity was determined in two steps: By carefully defining the scales; and by showing measurement scale to five academicians, and three Petroleum Company’s expert (Cooper & Schindler, 2006).
The concept is organizational learning and its dimensions are: holistic thinking; strategic thinking/culture; strategic learning/mission; empowerment; knowledge/information flow; internality, and synergy. Each dimension must have its own

identity and should be differentiated from other dimensions distinctly. Each dimension bears its own peculiar name and is operationally defined as a different dimension. It is also powered by the items or statements which are aimed at measuring the specific dimension that is operationally defined. The discriminant validity differentiates each dimension or variable from the other dimensions (Escring-Tena & Bou-Llusar, 2005) in the scale clearly, and is measured through pairwise correlation (Dimovski, 1994; Venkatraman, 1989).
Reliability of the whole instrument is measured through Cronbach’s coefficient alpha which is achieved if respondents attach same overall meaning to each of the item while measuring the same concept.
Multiple regression method was used to test OLCA-model using standard and stepwise method. Multiple regression technique requires testing of assumptions before conducting the analysis (Chatterjee & Hadi, 2006). Henceforth, the analysis of the OLCA model and hypothesis testing was done. 7.1 Test of Assumptions for Regression Analysis
The assumptions of independence of observations, Normality, Linearity and Homoscedasticity, and Multicollinearity was tested.
The normality assumption is concerned with the normality in the data which assumes that all variables are normally distributed. Normality is assumed as the sample size is greater than 100 and it will not affect the regression model (De Vaus in Migdadi, 2002 cited in Ali, 2007). However, Durbin-Watson (range 1.5 to 2.5) test which is a statistical test of independence (Johnson & Wichern, 2006) was performed.
The second assumption is homoscedasticity. The larger sample size also shows that the data is normally distributed and the assumption of linearity and homoscedasticity is meeting. Third assumption is collinearity among the variables. Multicollinearity can be diagnosed through correlation matrix. High correlation among variables (> 0.80) indicates multicollinearity (Garson, 2009).
Multiple regression; Standard and Stepwise techniques were applied to OLCA model. Standard Regression techniques simultaneously evaluate relationship between a set of 7-independent variables of OL and one dependent variable of competitive advantage. To select important predictors that exhibit significant relationship with dependent variables of competitive advantage stepwise regression technique was applied (Jonson & Wichern, 2006).
A summary of the relationship between response (dependent variable) and predictor (dependent) variables (Chatterjee & Hadi, 2006) is shown through regression equation for H8. To estimate y-score, scores of all predictors are taken from the column B under the Unstandardized Coefficients (Garson, 2009; Morgan, Leech, Gloeckner and Barrett; 2004) and are presented through regression equation.
7.2 Research Design
This study is non-contrived (non-experimental), cross-sectional and one-industry
research design. The data was collected from officers of petroleum companies of Pakistan. Independent variable is the organizational learning containing seven dimensions, and dependent variable is the competitive advantage.
6-petroleum companies out 40 (i.e. approximately 15% of the population) were taken through random sampling method (Table 1). These organizations are chosen because of their knowledge-intensive nature and their critical role in the present energy crises of Pakistan. Although employees were hesitant to respond but the researcher adopted snowball sampling techniques (Cooper & Schindler, 2006) to reach the respondents.
Sekaran (2003) found a rule that “… [i]n multivariate research (including multiple regression analysis), the sample size should be several times (preferably 10 times or more) as large as the number of variables in the study” (p.296). Therefore, the sample size was determined keeping in view the number of variables which are eight including 7 independent and one dependent variable. Secondly the sample size larger than 30 and less than 500 is appropriate of most research. Therefore a sample of 200 officers of any gender was taken. 7.3 Questionnaire Development
Commonalities from learning organization frameworks of different scholars were identified through extensive literature review on OL/LO and seven independent variables were decided which makes first part of theoretical framework. All concepts are operationally defined (Sekaran, 2003) and are supported by many authors (see Table 2). The research instrument has three parts. First parts consists of the elements concerning the dimensions of predictor variables (independent variables i.e., organizational learning). Second part contains elements concerned with the criterion variables (competitive advantage). Third part is about the personal information of the respondent.
The questionnaire of Parkek (2003) on organizational learning was adopted. The second part, competitive advantage, was measured through self-developed questionnaire containing eight questions. Second part, response variable, takes support of the authors: Barney (2002; 1991); Porter (2008); Jashapara (2003); Venkatraman and Ramanujam (1986, 1987), and Venkatraman (1989) (see table 3).
Response was measured on 5-point likert scale. First part, starts from fully true (5) to not fully true (1) whereas response (DV) starts very accurate (5) to not at all accurate (1). Data were analyzed using SPSS 13.0 and incomplete questionnaires were discarded and were not used in statistical analysis.
Details of the questionnaire distribute and received back are shown in table 4.

Table 1 Summary of Sample Companies Strata’s of the Petroleum Companies Total No.
of companies No. of
Sample companies % of sample
Exploration and Production Companies
26 3 11.5%
Downstream Companies (Marketing) 10 2 20%Refineries 4 1 25% Total 40 6 15.00%

Table 2 Support for Dimensions of Organizational Learning Dimension (s) of Organizational learning
Supporting Author (s)
Systems Thinking Senge (2006, 1990), Goh (2003,1998), Gephart & Marsick (1996)
Mental Models/Culture Senge (2006, 1990), Garvin et al.(2008), Garvin (1993), Goh (2003,1998)
Shared Vision Senge (2006, 1990), Goh (2003, 1998) Leadership Senge (2006, 1990), Garvin et al.(2008), Garvin
(1993), Goh (2003, 1998) Knowledge/Information Flow
Garvin et al.(2008), Senge (2006, 1990), Goh (2003, 1998), Garvin (1993), Huber (1991)
Personal Mastery Senge (2006, 1990), Goh (2003,1998) Team Learning Senge (2006, 1990), Goh (2003, 1998),

Table: 3 Support for Dimension (item wise) of Competitive Advantage Construct Item (s) of Competitive Advantage
Supporting Author (s)
Reputation Escring-Tena & Bou-Llusar (2005); Escring-Tena, Bou-Llusar & Rua-Puig (2001); Fahy (2000); Barney(1991, 1986)
Brand Image Escring-Tena & Bou-Llusar (2005) Market Share Escring-Tena & Bou-Llusar (2005); Powell (1992);
Bharadwaj, Varadarajan, and Fahy (1993) Cost Escring-Tena & Bou-Llusar (2005); Porter (1980,
1985); Powell (1992); Bharadwaj, Varadarajan, and Fahy (1993)
Research & Development (R & D)/Innovative
Escring-Tena & Bou-Llusar (2005); Powell (1992); Bharadwaj, Varadarajan, and Fahy (1993)
Economic Performance Escring-Tena & Bou-Llusar (2005); Jashapara, A. (2003); Venkatraman, & Ramanujam (1987, 1986), Venkatraman (1989).

Table 4 Detailed Summary of Questionnaires Distributed
Strata’s of the Petroleum Companies
No. of Questionnaires administered
No. of Questionnaires received back
Discarded Responses
% of valid
responses
E & P Companies 100 70 5 65.00% Marketing Companies 50 17 2 30.00% Oil Refineries 50 14 0 28.00%
Total 200 101 7 47.00%
The questionnaire consist of 63 items, out of which 13 items cover demographic data, 42 items are related to independent variables (IVs), 8 items cover dependent variable (DV), three open-ended, and one question was regarding the comments/suggestion. All respondents were coded (Leech, Barrett, & Morgan, 2005). Moreover, all relevant items of a single construct are mentioned under its name and are coded and all data were in numeric form (Leech, Barrett, & Morgan, 2005). First word of the code is capital letter of English alphabet joined with numerical digits in order. First section is dedicated to the concept of organizational learning and has been subdivided into 7 dimensions. Each dimension consists 6 items, except dependent variable that has eight items. Third asks demographic information i.e. organization’s name, and participant’ name, department name, email, gender, designation, education of the employee, management level (upper, middle, lower), age of the organization, total number of the employees in the organization, number of the officers in organization, and experience and age of the employee. Three open-ended questions asked are concerned with training and learning activities in the organization. One question was about the comments/suggestion. 7.4 Data Collection
Data collection was done through personal interview, and mail survey (Cooper & Emory, 1995). Few questionnaires were self-administered and collected, and few were collected through friends. 200 questionnaires were administered, 101 responses were received back with a response rate of 50%. 94 responses were found complete and used in the final study. 7.5 Hypotheses Testing
Each of the research Hypotheses was tested through regression analysis. Multiple regression analysis (standard and stepwise procedures) was conducted to identify which of the predictors have the most significant contribution in achieving competitive advantage. All the items of each independent variables; systems thinking/ holistic frame (ST), strategic thinking, strategic learning, empowerment, knowledge/information flow, internality, and synergy were summated into single variable, and then all dimensions of organizational learning were further summated into a single independent variable of OL. Dependent variable was regressed with each dimension of OL singly to test hypothesis (H1 to H7). Moreover, the response variable (DV) was regressed on the summated independent variable of organizational learning (OL). This was done to finally check the amount of strength explained by OL to achieve competitive advantage.
8. Data Analysis & Results
Construct validity and Reliability test, and testing of hypotheses H1 to H8 was done. Regression Analysis was applied to test the hypotheses H1 to H8. Finally the results of regression analysis: standard and stepwise are analyzed and explained. H8 which is last and confirmatory hypotheses is also tested in this section along with regression equation to highlight the contribution of each independent variable on the

dependent variable. Stepwise method revealed the independent variables which explain the maximum variance in the dependent variable of competitive advantage.
8.1 Validity & Reliability Assessment
Cronbach’s alpha was determined for seven independent variables (dimensions): systems thinking/holistic frame (ST), strategic thinking, strategic learning, empowerment, knowledge/information flow, internality, and synergy, and one dependent variable of competitive advantage (CA).
Data were summated dimension-wise before running SPSS 13.0 for reliability analysis. Reliabilities over 0.70 are acceptable and over 0.80 are good (Sekaran, 2003). The reliability coefficient of the instrument with seven dimensions (50 items) is 0.927 and of all other constructs (dimensions) was above 0.80 (Table 5).
Content validity was determined in two steps (Cooper and Schindler, 2006); through the supported of literature review, and by showing instrument to five academicians and three experts from the petroleum companies, and changes were made accordingly.
Discriminant validity of all dimensions of OL was determined and found within range proving no collinearity. The cutoff value for discriminant validity is: < 0.85 (Harrington, 2009; Garson, 2008); < 0.60 (Leech et al., 2005); and Dimovski (1994) mention cut-off value for pairwise correlation is < 0.55 significant at < 0.05.
Results (Table 6) indicate the values of 28 pairs: 5 are correlated at ≥0.50, 3 are correlated at ≥ 0.6, 1 is correlated at < 0.7, 9 are correlated at ≥ .40, others are ≥ .30 except one which is correlated at 0.20, and all are significant at p < 0.01. Moreover, it is found that all correlations are positive providing additional proof for construct validity (Vekatraman, 1989). Hence, discriminant validity criteria is satisfied by these variables. This indicates that each dimension is distinctly different from the other dimensions.

Table 5
Inter-Item Consistency
Variables Cronbach’s Alpha (α)
No. of
items
Systems Thinking (ST) 0.836 6 Strategic Thinking/Culture (StLrng) 0.838 6 Strategic Learning (StrLrng) 0.824 6 Empowerment/Leadership (Emp) 0.829 6 Knowledge/Information Flow (KNF)
0.826 6
Internality/Personal Mastery (INT) 0.828 6 Synergy/Team Learning (SYN) 0.843 6 Competitive Advantage (CA) 0.873 6

Table 6
Results of Discriminant Validity - Pairwise correlation (Pearson Correlation)
Constructs Mean Std. Deviation
ST StrTh StrLrng Emp KNF INT SYN CA
ST 15.84 3.089 - StrTh 17.60 3.087 0.48** - StrLrgn 16.29 4.096 0.52** 0.49** - Emp 15.53 3.317 0.52** 0.46** 0.60** - KNF 15.45 4.273 0.22** 0.42** 0.71** 0.60** - INT 15.14 3.530 0.50** 0.42** 0.57** 0.54** 0.64** - SYN 15.51 4.175 0.36** 0.36** 0.49** 0.44** 0.42** 0.44** -CA 24.34 4.990 0.30** 0.48** 0.20** 0.31** 0.18** 0.30** 0.32** -
Note. N= 94. All variables are summated scores of the items that were loaded on a particular construct. **p<0.01 (2-tailed)
8.2 Regression Analysis: Testing of Underlying Assumptions
Before conducting the regression analysis fundamental assumptions were tested (Chatterjee & Hadi, 2006). Durbin-Watson test (Table 7) was performed for OL-CA model to test the independence and was found within the range i.e. between 1.5 and 2.5 (Johnson & Wichern, 2006).
The second assumption is the normality which is tested by checking the normal distribution of residuals, and symmetrical distribution of differences between predicted and obtained scores. As Chatterje and Hadi (2006) recommend with a moderately large sample, these residuals should approximately have a standard normal distribution. Therefore, normality is assumed as the sample size is greater than 100 and it will not affect the regression model (De Vaus in Migdadi, 2002).
Third assumption of Multicollinearity is diagnosed by identifying the values of intercorrelations between the predictor variables (IVs) and Response Variables (DV). This assumption of multicolliearity is also proved through table or correlations (Table 2).
Hypotheses H1 to H7 were tested by performing standard regression analysis to explore the relationship of each dimension of OL with dependent variable of competitive advantage (see figure 1). Stepwise regression method was applied which identified the most significant independent variables which explain the best variance in dependent variable. The validity of regression analysis depends on certain assumptions which are usually made about the data and the model. Henceforth, to test the final hypothesis H8 dependent variable was regressed on independent variable of OL to reveal the impact of independent variable of OL on dependent variable.
The results of linear regression supported the hypotheses H1 to H7. All hypotheses are significant at 0.01 indicating a strong relationship of all independent variables of OL with the dependent variables of CA (Figure 1).

Figure 2. Summary of the research results achieved through regression analysis
Systems Thinking
Strategic Thinking
Strategic Learning
Empowerment
Knowledge/ Information Flow
Internality
Synergy
Competitive Advantage
H2 = **p < .01, ∆R2 = 0.192 2
H3 = **p < .01, ∆R2 = 0.026 2
H4 = **p < .01, ∆R2 = 0.086 2
H5 = **p < .01, ∆R2 = 0.022 2
H7 = **p < .01, ∆R2 = 0.093 2
H6 = **p < .01, ∆R2 = 0.084
H1 = **p < .01, ∆R2 = 0.083
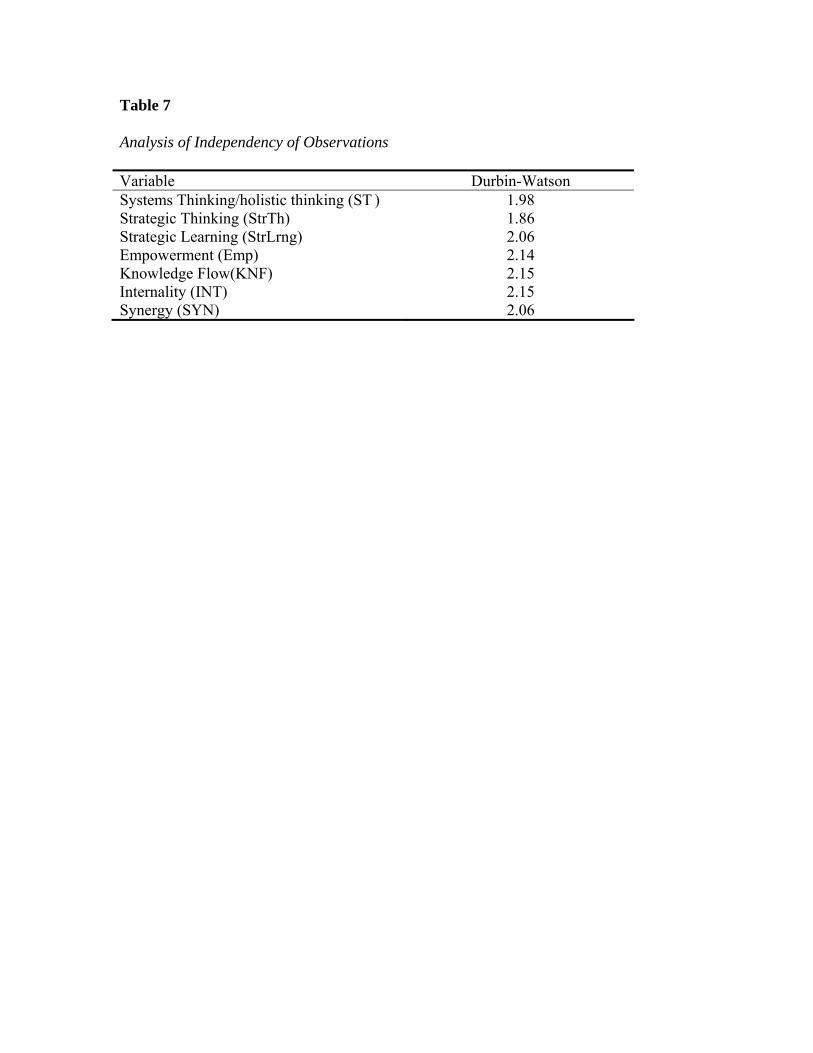
Table 7
Analysis of Independency of Observations
Variable Durbin-Watson Systems Thinking/holistic thinking (ST ) 1.98 Strategic Thinking (StrTh) 1.86 Strategic Learning (StrLrng) 2.06 Empowerment (Emp) 2.14 Knowledge Flow(KNF) 2.15 Internality (INT) 2.15 Synergy (SYN) 2.06
Results of regression analysis depict that all seven independent variables significantly predicted achieving of competitive advantage, F (7, 86) = 4.696 , p < 0.001. The p value depicts the goodness of fit. Table 8 reveals that in case of independent variables of strategic thinking (StrTh) the probabilities of the t statistic (3.236) for the b coefficients provided very strong evidence (p < 0.05) that the slopes associated with Strategic thinking were not equal to zero (b ≠0). The b coefficients associated with Strategic thinking (0.592, p< 0.05), was positive, indicating direct relationships with Competitive Advantage. strategic thinking explained 59.2% of variance in achievement of Competitive Advantage.
For independent variable of synergy the probabilities of the t statistic (1.702) for the b coefficients provided strong evidence (p < 0.1) that slopes associated with Synergy were not equal to zero (b ≠0). The b coefficient associated with synergy (0.223, p < 0.1), was positive, indicating direct relationship with competitive advantage. Synergy explained 22.3% of variance in achievement of competitive advantage.
For the independent variables of systems thinking (ST), strategic learning (StLrng), empowerment (Emp), knowledge/information flow (KNF), and Synergy (SYN) the probabilities of t statistic are( .796,-1.386, .992, -0.876, and 1.154) for the b coefficients provided little or no real evidence (p > 0.1) that the slopes related to ST, StLrng, Emp, KNF, and SYN are not equal to zero.
The probability of the t statistic (2.691) for the b coefficients provided real evidence (p < 0.001) that the intercept was not equal to zero (b ≠ 0). However, the coefficient associated with the intercept (8.203) indicated direct relationships with Competitive Advantage. The intercept represented value of Competitive Advantage when all independent variables were equal to zero. The b coefficients associated with these variables (0.154, -0.247, and 0.192, -0.151, and 0.210 respectively) indicated direct relationships (in case of first, third and fifth variables) and inverse relationships (in case of second, and fourth variable) with Competitive Advantage. Due to their insignificant role, they explained only 15.4%, 24.7%, 19.2%, 15.1%, and 21. % of variation in achieving of Competitive Advantage respectively.

Table 8
Coefficients of OL-CA Model (Standard Regression)
N = 94
(a) B SE Beta t Sig. Constant 8.203 3.049 2.690 0.009** ST 0.154 0.194 0.096 0.796 0.428 StrTh 0.592 0.183 0.366 3.236 0.002* StrLrng -0.247 0.178 -0.203 -1.386 0.169 Emp 0.192 0.193 0.127 0.992 0.324 KNF -0.151 0.172 -0.129 -0.876 0.383 Internality 0.210 0.182 0.149 1.154 0.252 Synergy 0.223 0.131 0.187 1.702 0.092***
Note. R2 = 0.227, F (7, 86) = 4.696 (ps < 0.001)
*p < 0.05; **p <0.01; ***p <0 .1
a. Dependent Variable: CA

The output of standard/simultaneous regression gave the following output.
Regression Equation
Competitive Advantage (CA) = Intercept + Slope1 (Systems thinking) + Slope2 (Mental models/Strategic thinking) + Slope3 (strategic learning) + Slope4 (empowerment) + Slope5 (knowledge/ information flow) + Slope6 (internality) + Slope7 (synerg) + random error
or
CA = β0 + β1ST + β2StrTh + β3StrLrng + β4Emp + β5KNF + β6INT + β7SYN + ε
CA = 8.203+ 0.154ST + 0.592StrTh - 0.247StLrng + 0.192Emp - 0.151KNF + 0.210Int +
0.223SYN + ε
Test of this part of OL-CA model (standard/simultaneous method) shows that comparatively among all independent variables the greatest influence on dependent variable of Competitive Advantage was explained by strategic thinking (β = 0.592), followed by the synergy (β = 0.223) (see Table 8).
8.3 Stepwise Multiple Regression Analysis
Stepwise multiple regression produced one models that significantly predicted the achieving of competitive advantage, F (1, 92) = 23.152, ps < 0.001, and indicates that strategic thinking has the most significant contributions (β = 0.725, P < .05) to the prediction of variance in competitive advantage, as compared to the rest of predicting variables. Table 9 also shows that the probability of t statistic for b coefficient in the model provided strong evidence i.e. t = 4.304, p < 0.001. The results of model indicate that the slope associated with strategic thinking was not equal to zero (b ≠ 0). The b coefficient associated (8.203) with strategic thinking is positive indicating direct relationship with competitive advantage. The intercept represented value of Competitive Advantage when all independent variables were equal to zero. Results also indicate multiple R and adjusted R2 for this model (Multiple R = 0.201 and adjusted R2 = 0.192). Furthermore the Table 9 indicates that 72.5% variance was explained in competitive advantage was explained by strategic thinking in this model .
Table 9 also displays coefficients of intercepts of OL-CA model. The probabilities of the t statistic (4.304) for the b coefficients provided significant (p < 0.01) evidence that the intercept were not equal to zero (b ≠ 0).
Since, stepwise indicates contributions of one IV resultantly, six independent variables were excluded from model because of little or no relationship with DV (competitive advantage) in presence of all other independent variables. These excluded variables are presented in Table10 with their relevant values.
The collective analysis (stepwise) of all variables under OL-CA model reveals that strategic thinking alone has the positive and significant contributions. Therefore, results indicate that the strategic thinking must be focused while designing organizational strategies, organizational management development programs.
Regression Equation (stepwise)
CA = β0 + β1ST + β2StrTh + β3StrLrng + β4Emp + β5KNF + β6INT + β7SYN + ε
Model of Stepwise result
CA = 11.584 + 0.725 StrTh

Table 9
Stepwise Multiple Regression Analysis of OL-CA Model
(a) Unstandardized coefficients
Standardized Coefficients
T
B (b) SE Beta (β) Step 1 (Constant) 11.584 2.691 4.304** ST 0.725 0.151 0.448 4.812*
Note. ∆R2 = 0.192
*p < 0.05; **p < 0.01
a. Dependent Variable: CA

Table 10
Excluded Variables of OLCA Model (Stepwise)
Model Independent Variables Beta In t Sig. Step 1 Systems Thinking(ST ) .112 1.054 .295 Strategic Learning
(StrLrng) -.041 -.383 .703
Empowerment (EMP) .131 1.254 .213 Knowledge Flow(KNF) -.010 -.099 .921 Internality (INT) .140 1.363 .176 Synergy (SYN) .183 1.852 .067 Team Learning (TL) 0.083(b) 0.998 0.320
a. Predictors in the Model: (Constant), strategic thinking (StrTh)
b. Dependent Variable: Competitive Advantage (CA)

8.4 Regression Analysis of OL-CA Model
To observe and analyze the direct relationship of Organizational Learning (IV) with dependent variable of Competitive advantage (CA). The CA was regressed on OL. The results show that OL predicts the achieving of competitive advantage, F (1, 92) = 15.213, p < .001, and the significance level depicts that the model is fit. Results reveal a significant relationship between the independent variable of OL and the dependent variable of CA (R² ≠ 0). The values of multiple R (.142) and adjusted R2 (.133) indicate that organizational learning have good relationship with DV, and will explain 13.3% of the variance in competitive advantage (DV).
The probability of t statistic for b coefficient provides strong evidence i.e. t = 4.844, p < 0.001, and indicates that the slope associated with Organizational Learning was not equal to zero (b ≠ 0) (see table 11). The b coefficient associated with Organizational Learning (0.677) with adjusted R2 = 0.133 was positive indicating direct relationship with Competitive Advantage (CA). Organizational Learning explained 67.7% of variance in Competitive Advantage. The b coefficient associated with the intercept (13.573) indicated direct relationship with Competitive Advantage. The intercept represented the value of Competitive Advantage when independent variable of Organizational Learning was equal to zero.
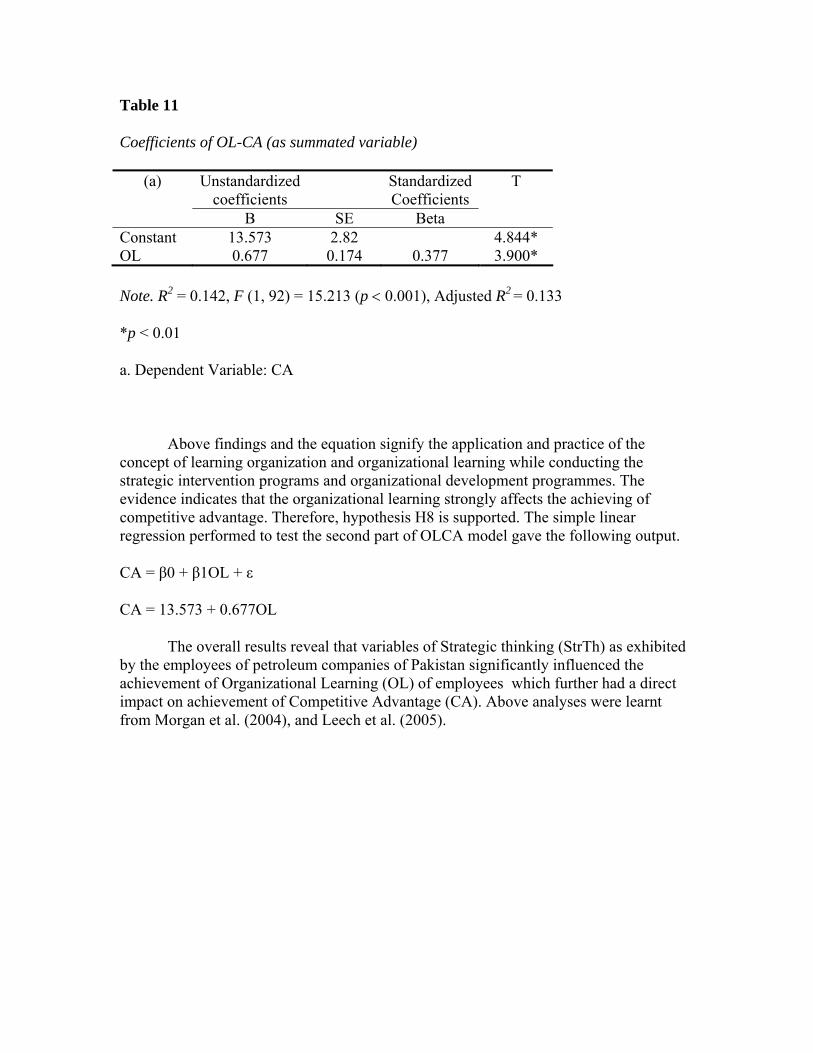
Table 11
Coefficients of OL-CA (as summated variable)
(a) Unstandardized coefficients
Standardized Coefficients
T
B SE Beta Constant 13.573 2.82 4.844* OL 0.677 0.174 0.377 3.900*
Note. R2 = 0.142, F (1, 92) = 15.213 (p < 0.001), Adjusted R2 = 0.133
*p < 0.01
a. Dependent Variable: CA
Above findings and the equation signify the application and practice of the concept of learning organization and organizational learning while conducting the strategic intervention programs and organizational development programmes. The evidence indicates that the organizational learning strongly affects the achieving of competitive advantage. Therefore, hypothesis H8 is supported. The simple linear regression performed to test the second part of OLCA model gave the following output.
CA = β0 + β1OL + ε
CA = 13.573 + 0.677OL
The overall results reveal that variables of Strategic thinking (StrTh) as exhibited by the employees of petroleum companies of Pakistan significantly influenced the achievement of Organizational Learning (OL) of employees which further had a direct impact on achievement of Competitive Advantage (CA). Above analyses were learnt from Morgan et al. (2004), and Leech et al. (2005).

9. Conclusions & Recommendations
The study was aimed to test the theoretical underpinning that organizational
learning is related with the competitive advantage (Goh, 1997). 9.1 Conclusions
Empirical findings show that theoretically assumed dimensions of the learning
organization and the organizational learning contribute significantly towards achieving the competitive advantage. Research findings of the regression analysis revealed the impact of each component (independent variable) of a learning organization on achieving the competitive advantage. All hypotheses H1 to H7 are significant at < 0.01.
Multiple regression standard model was found fit showing significant relationship (R² ≠ 0) between 7 independent variables and dependent variables of competitive advantage (i.e. F (7, 86) = 4.696, p < 0.001). The Value of adjusted R2 is 0.227, shows a significant strong relationships. However, the most significant independent variable found are strategic thinking, and team learning which explained 59.2%, 22.3%, of variance respectively in achieving competitive advantage.
Stepwise method revealed single variable with a significant relationship (R² ≠ 0) between independent variable of strategic thinking and dependent variable of competitive advantage (i.e. F (1,92) = 23.152, ps < 0.001). Multiple R (0.201) and R2 (0.192) characterized a significantly strong relationship. Flexibility to change in any organization is considered a most important ingredient of a learning organization. Empirical findings reveal that the concept of OL does exist in the petroleum organizations of Pakistan the management can institutionalize the components of a learning organization strategically in their training programs as an important step to become a learning organization and to achieve excellent performance. Findings point the importance of strategic thinking and synergy. The organizational culture should give prime support to these disciplines along with other disciplines of OL while preparing organizational improvement activities. The habit of strategic thinking will inculcate the habit of challenging the basic assumption (Argyris & Schon, 1978) and will foster generative learning in the employees. Th generative learning or double-loop learning modify the existing rules, policies and manifest in creative and innovative products, processes, and services achieving competitive advantage.
9.2 Recommendations
Statistical results reveal that the organizations should nurture a learning culture
where employee are willing to experiment, and participate in decision making. They are committed to achieve the organizational objective along with their own objectives. Training in the discipline of strategic thinking is recommended, along with the focus of building synergy by making teams in the organizations.

9.3 Future Research Areas
Research revealed some other areas that should be investigated. OL itself has few peculiar characteristics i.e. flexibility to change, ability to create and innovate. Therefore researcher and academicians should study these areas. 9.4 Managerial Implications The results indicate that the main contributors are the strategic thinking and synergy. Strategic thinking and synergy are the variables which should be practices to further take the advantage of these capabilities. Other areas of OL should be focused i.e. empowerment, knowledge flow, systems thinking, strategic learning, and internality should be incorporated in the training programmes to optimally utilize the potential of the employees.
References
References Ali, B. (2007). Critical Success Factors for Effective Knowledge Management in Corporate Sector (Pakistan). Doctoral dissertation. National University of Modern Languages, Islamabad. Pakistan. Argyris, C. and Schön, D. (1996). Organizational learning II: Theory, method and practice, Reading, Mass: Addison Wesley. Argyris, C., & Schön, D. (1978) Organizational learning: A theory of action perspective, Reading, Mass: Addison Wesley. Barney, Jay B. (1986b). Organizational Culture: Can it be a source of sustained competitive advantage. The Academy of Management Review, 11(30, 656-665. July 1986. Barney, Jay B. (1991). Firm Resources and Sustained Competitive Advantage. Journal of Management, 17(1), 99-120. Bharadwaj, Sundar G., Varadargan P. R., Fahy, John. (1993). Sustainable Competitive Advantage in Service Industries: A Conceptual Model and Research Propositions. Journal of Marketing, Vol. 57, No. 4, 83-99. Bui, Hong and Baruch, Yehuda (2010). Creating learning organizations: a systems perspective. The Learning Organization, 17(3). 208-227. Burgelman, Robert A., Maidique, Modesta A., Wheelright, Steven C. (1995). Strategic Management of Technology and Innovations (second edition). Irwin McGraw Hill. USA. Chatterjee, S & Hadi, A. S. (2006). Regression Analysis by Example (4th ed). New York: John Wiley and Sons. Connor, Katheleen R. (1991). A Historical Comparison of Resource-Based Theory and Five Scholls of Thoughts Within Industrial Organization Economics: Do we have a new theory of the Firm. Journal of Management, 17(1), 121-154. Cooper, D. R., Schindler, P. S. (2006). Business Research Methods (9th ed.). The Mc- Graw-Hill Companies New Delhi, India. De Geus, Arie P. (1988). Planning as Learning. Harvard Business Review, March-April. Di Milia, L., Birdi, K. (2009). The relationship between multiple levels of learning practices and objectives and subjective organizational financial performance. Journal of Organizational Behaviour. Retrieved on 17th August 2009 from Blackwell Synergy (www.interscience.wiley.com). Dimovski, Vlado (1994). Organizational Learning and Competitive Advantage: A theortical and Empirical Analysis. Doctoral dissertation. Cleveland State University. Retrieved on 21st July 2008 from http:// www.cek.ef.uni- lj.si/dodtor/dimovski.pdf (Received on personal request from Professor Dr. Vlado Dimovski. Escring-Tena, Ana Belen, Bou-Llusar, Juan Carlos (2005). A Model for Evaluating Organizational Competencies: An Application in the Context of Quality Management Initiatives. Decision Science, 36(2). 221-257. Escring-Tena, Ana Belen, Bou-Llusar, Juan Carlos, Roca-Puig, Vicente (2001). Measuring the relationship between total quality management and sustainable

competitive advantage: A resource-based view. Total Quality Management, 12 (7 & 8), 932-938. Fahy, John (2000). Section 1: A Capabilities driven perspective. The resource-based view of the firm: Some stumbling blocks on the road to understanding sustainable competitive advantage. Journal of European Industrial Training, 24(2/3/4), 94- 104. Garson, D. (2009). Testing of Assumptions: Statnotes from North Carolina State University. Public administration Program. (http://faculty.chass.ncsu.edu/garson/PA765/assumpt.htm). Retrieved on October 2009. Garvin, D. (1993). Building a learning organization. Harvard Business Review, 71(4), 78-92. Garvin, D., Edmondson, Amy C., Gino, Francesca (2008). Is Yours a Learning Organization. Harvard Business Review, March. 109-116. Gephart, M. A., and V. J.Marsick (1996). Learning organizations come alive. Training & Development, 50 (12): 34-44. Goh, Swee C. (2003). Improving Organizational Learning Capability: lessons from two case studies. The Learning Organization, 10(4). Goh, Swee C. (1993). Towards a Learning Organization: The Strategic Building Blocks. SAM Advanced Management Journal, 63(2). Spring 1998 Goh, S.C., Richards, G. (1997).Benchmarking the Learning Capability of Organizations. European Management Journal, 15(5), pp. 575-583, I997 Grant, Robert M. (1991). The Resouce-Based Theory of Competitive Advantage: Implications for Strategy Formulation. California Management Review, 33(3), 114-135. Hamel, Gary, Prahalad, C.K. (1993). Strategy as Stretch and Leverage. Harvard Business Review.March-April 1989. Harrington, D. (2009). Confirmatory Factor Analysis: Pocket Guides to Social Work Research Methods. Oxford University Press, New York. Huber, G.P. 1991. “Organizational learning: The contributing processes and the literatures”. Organization Science, 2(1):88-115. Jashapara, Ashok (2003). Cognition, Culture and Competition: an empirical test of the learning organization. The Learning Organization, 10(1), 31-50. Johnson, R. A., & Wichern, D. W. (2006). Applied Multivariate Statistical Analysis. (5th ed.). Pearson Prentice-Hall. USA. King, A.W., Zeithaml, Carl P. (2001). Competencies and Firm Performance: Examining the Causal Ambiguity Paradox. Strategic Management Journal, 22:75-99. Leech, N. L., Barrett, K. C., Morgan, G. A., (In collaboration with Clay, J. N., & Quick, D) (2005). SPSS for Intermediate statistics: Use and interpretation (2nd ed.), Mahwah, New Jersey: Lawrence Erlbaum. Lei, D., Slocum, J. W., Pitts R. A. (1999). Designing Organizations for Competitive Advantage: The Power of Unlearning and Learning. Organizational Dynamics, Morgan, G. A., Leech, N. L., Goeckner, G. W., Barrett, K. C., (In collaboration with Clay, J. N., Jensen, L., Quick, D.) (2004). SPSS for Introductory statistics: Use

and interpretation. (2nd ed.). Lawrence Erlbaum Associates, Publishers. Mahwah New Jersey. Nonaka, I. (2007). The Knowledge-Creating Companny. Harvard Business Review, July- August, 162-171. O’Brien, James A. (2004). Management Information Systems: Managing information technology in business enterprise (Sixth Edition). McGraw-Hill, Boston. Oster, Sharon M. (1999). Modern Competitive Analysis, Oxford University Press, Oxford. Parek, Udai. (2003).Training Instruments in HRD and OD (Second Edition). Tata McGraw-Hill Publishing Company Limited, New Delhi, India. Porter, Michael E. (2008). The Competitive Forces that Shape Strategy. Harvard Business Review, January 2008. Porter, Michael E., Miller, Victor E. (1985). How information gives you competitive Advantage. Harvard Business Review, July-August. Porter, Michael E. (1985). Competitive Advantage: Creating and Sustaining Superior Performance. The Free Press. New York. Porter, Michael E. (1980). Competitive Strategy: Techniques for analyzing industries and competitors. The Free Press. London. Powell, Thomas C., Dent-Micallef, Anne (1997). Information Technology as Competitive Advantage: The role of human, business and technology resources. Strategic Management Journal, 18(5). 375-405. Prahalad, C.K., Hamel, Gary (1990). The Core Competence of the Corporation. Harvard Business Review, May-June 1990. Reed, Richard; Defillipi, Robert J. (1990). Causal Ambiguity, Barriers to Imitation, and Sustainable Competitive Advantage. The Academy of Management Review, 15(1), 88-102. Sekaran, U. (2003).Research Methods for Business: A skill building approach (4th ed.). New York, John Wiley. Senge, P. M. (1990). The Fifth Discipline: The Art & Practice of the Learning Organization. New York Doubleday. Senge, P.M. (2006). The Fifth Discipline: The Art and Practice of the Learning Organization. Currency Doubleday, New York. Tsang, Eric W.K. (1997). Organizational Learning and the Learning Organization: A dichotomy between descriptive and prescriptive research. Human Relations, 50 (1). Venkatraman, N. (1989). Strategic Orientation of Business Enterprisses: The Construct, Dimensionality, and Measurement. Management Science, 35(8), 942-962. Venkatraman, N., Ramanujam, V. (1986). Measurement of Business Performance in Strategy Research: A comparison of Approaches. The Academy of Management Review, 11(4), October 1986, 801-914. Venkatraman, N., Ramanujam, V. (1987). Measurement of Business Economic Performance: An Examination of Method Convergence. Journal of Management, 13(1), 109-122.