
The Emerging Markets investment universe - Ashmore … Aug 15 EM... · Across the corporate and...
10
1 This is the fourth annual review of the Emerging Markets (EM) investment universe. We provide an overview of tradable debt and domestic credit markets in 54 EM countries as well as the large cap, small cap and Frontier Markets for equities. We compare debt statistics with similar metrics for developed economies to place EM in the global context. We highlight trends and discuss EM indices, the effect of regulation and USD strength, the rise of corporate bond markets, the likely implications of Fed hikes and other relevant aspects. We look towards the horizon of fixed income markets, including the growing Sukuk universe, the opening of China’s bond market, etc. We also peer into the future of EM equity markets, including the opening of markets in China, Saudi Arabia and Iran. Continued overleaf Size and structure of global fixed income and domestic credit 1 As of the end of 2014, global tradable debt and domestic private sector credit was USD 197trn, or 255% of global GDP. Global domestic credit to the private sector stood at USD 84trn, while global tradable debt was USD 113trn. Emerging Markets (EM) countries account for about 13% of the world’s tradable debt (USD 14.8trn) and 31% of the global domestic credit to the private sector (USD 26trn). Developed economies have issued 87% of the world’s tradable debt (USD 98trn) and 69% of the world’s global credit (USD 58trn). Given that EM countries now account for 57% of global GDP on a purchasing power parity (PPP) basis, according to the IMF’s April 2015 World Economic Outlook, it is clear that developed countries are orders of magnitude more indebted than EM countries (Figure 1). Fig 1: Global finance – by type and issuer The tradable EM debt universe The tradable EM corporate debt universe is now exactly the same size as the EM sovereign debt universe (USD 7.4trn each). Within the corporate debt universe, 83% of bonds are in local currency (USD 6.1trn), while foreign currency denominated corporate bonds make up the balance (17%, or USD 1.3trn). The EM sovereign bond market is also dominated by local currency instruments, which now make up USD 6.7trn, or 89% of total EM government debt. The USD denominated government bond universe is USD 0.8trn, or 11% of total EM government debt. Across the corporate and government bond markets, local currency instruments therefore make up 86% of total tradable debt. The local currency share of total EM financing rises to 95% when domestic credit to the private sector is included in the total (Figure 2). Fig 2: Structure of EM fixed income USD trillion 2000 2005 2010 2014 % of EM finance EM tradable debt 2.4 5.4 11.8 14.8 36% EM corporate 0.7 2.2 5.6 7.4 18% Local corporate 0.5 1.8 4.9 6.1 15% External corporate 0.2 0.4 0.7 1.3 3% EM sovereign 1.6 3.2 6.2 7.4 18% Local sovereign 1.3 2.7 5.6 6.7 16% External sovereign 0.4 0.5 0.6 0.8 2% EM domestic credit 3.7 7.1 17.7 26.4 64% Total incl. credit 6.2 12.5 29.5 41.2 100% Source: Ashmore, Bloomberg, World Bank, IMF, BAML. THE EMERGING VIEW August 2015 The Emerging Markets investment universe By Jan Dehn and Joana Arthur 1 For a full list of countries analysed, definitions and data sources see the ‘Notes’ in the appendix. EM countries now account for 57% of global GDP on a purchasing power parity basis, but only around 20% of total debt and credit 80 USD trn % 100 120 Tradable bonds (LHS) 60 20 40 0 180 140 160 30 60 70 10 0 100 80 90 40 50 20 Developed Markets Emerging Markets Source: Ashmore, Bloomberg, World Bank, IMF, BAML. Domestic credit (LHS) Region as % of Global GDP (RHS)
Transcript of The Emerging Markets investment universe - Ashmore … Aug 15 EM... · Across the corporate and...
1
This is the fourth annual review of the Emerging Markets (EM) investment universe. We provide an overview of tradable debt and domestic credit markets in 54 EM countries as well as the large cap, small cap and Frontier Markets for equities. We compare debt statistics with similar metrics for developed economies to place EM in the global context. We highlight trends and discuss EM indices, the effect of regulation and USD strength, the rise of corporate bond markets, the likely implications of Fed hikes and other relevant aspects. We look towards the horizon of fixed income markets, including the growing Sukuk universe, the opening of China’s bond market, etc. We also peer into the future of EM equity markets, including the opening of markets in China, Saudi Arabia and Iran.
Continued overleaf
Size and structure of global fixed income and domestic credit1
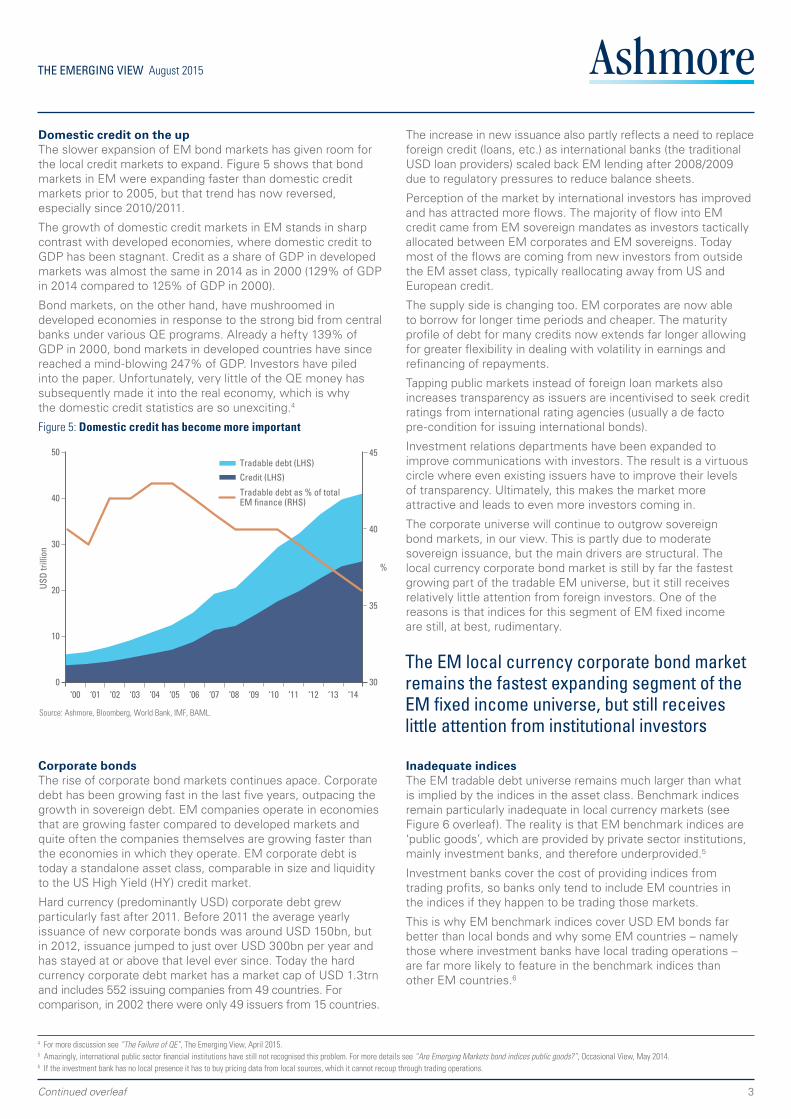
As of the end of 2014, global tradable debt and domestic private sector credit was USD 197trn, or 255% of global GDP. Global domestic credit to the private sector stood at USD 84trn, while global tradable debt was USD 113trn.
Emerging Markets (EM) countries account for about 13% of the world’s tradable debt (USD 14.8trn) and 31% of the global domestic credit to the private sector (USD 26trn). Developed economies have issued 87% of the world’s tradable debt (USD 98trn) and 69% of the world’s global credit (USD 58trn).
Given that EM countries now account for 57% of global GDP on a purchasing power parity (PPP) basis, according to the IMF’s April 2015 World Economic Outlook, it is clear that developed countries are orders of magnitude more indebted than EM countries (Figure 1).
Fig 1: Global finance – by type and issuer
The tradable EM debt universeThe tradable EM corporate debt universe is now exactly the same size as the EM sovereign debt universe (USD 7.4trn each).
Within the corporate debt universe, 83% of bonds are in local currency (USD 6.1trn), while foreign currency denominated corporate bonds make up the balance (17%, or USD 1.3trn).
The EM sovereign bond market is also dominated by local currency instruments, which now make up USD 6.7trn, or 89% of total EM government debt. The USD denominated government bond universe is USD 0.8trn, or 11% of total EM government debt.
Across the corporate and government bond markets, local currency instruments therefore make up 86% of total tradable debt. The local currency share of total EM financing rises to 95% when domestic credit to the private sector is included in the total (Figure 2).
Fig 2: Structure of EM fixed income
USD trillion 2000 2005 2010 2014% of EMfinance
EM tradable debt 2.4 5.4 11.8 14.8 36%
EM corporate 0.7 2.2 5.6 7.4 18%
Local corporate 0.5 1.8 4.9 6.1 15%
External corporate 0.2 0.4 0.7 1.3 3%
EM sovereign 1.6 3.2 6.2 7.4 18%
Local sovereign 1.3 2.7 5.6 6.7 16%
External sovereign 0.4 0.5 0.6 0.8 2%
EM domestic credit 3.7 7.1 17.7 26.4 64%
Total incl. credit 6.2 12.5 29.5 41.2 100%
Source: Ashmore, Bloomberg, World Bank, IMF, BAML.
THE EMERGING VIEW August 2015
The Emerging Markets investment universe By Jan Dehn and Joana Arthur
1 For a full list of countries analysed, definitions and data sources see the ‘Notes’ in the appendix.
EM countries now account for 57% of global GDP on a purchasing power parity basis, but only around 20% of total debt and credit
80USD
trn
%100
120
Tradable bonds (LHS)
60
20
40
0
180
140
160
30
60
70
10
0
100
80
90
40
50
20
Developed MarketsEmerging Markets
Source: Ashmore, Bloomberg, World Bank, IMF, BAML.
Domestic credit (LHS)
Region as % of Global GDP (RHS)

2
THE EMERGING VIEW August 2015
Within the tradable corporate debt universe, 68% of index bonds are investment grade with the bulk of bonds clustered around the BBB rating. About 70% of bonds emanate from the financial, telecommunications, oil & gas and utilities sectors. Asian and Eastern European issuers account for just over 70% of all the bonds that feature in the main EM corporate bond index (Figure 3).
Fig 3: EM corporate index bonds by rating, region and sector
By rating
%
Investment Grade 68
AAA 0
AA 7
A 20
BBB 41
Non Investment Grade 32
BB 15
B 7
C 3
NR 6
Source: JP Morgan, Ashmore.
By region
%
Asia 38
Latin America 29
CEEMEA 33
Middle East 15
Central and Eastern Europe 12
Africa 6
Source: JP Morgan, Ashmore.
By sector
%
Financial 33
Telecommunications 14
Oil & Gas 14
Utilities 10
Consumer 7
Metals & Mining 6
Industrial 5
Real Estate 4
Diversified 4
Pulp & Paper 1
Infrastructure 1
Transport 1
Source: JP Morgan, Ashmore.
Recent trends
Slower expansionIn 2014 the tradable EM fixed income asset class expanded at the slowest pace since 2000. Figure 4 shows that EM issuance trends in USD terms have been on the decline since 2010.
The rate of growth of the asset class was just 1.5% in USD terms in 2014 compared to an average growth rate of 14% per year between 2000 and 2014. Due to the slow rate of growth, EM’s share of global tradable debt was unchanged from 2013 at 13%. The corporate bond universe – both local and USD – expanded by 3% in USD terms in 2014. This means that the EM local currency corporate bond market remains the fastest expanding segment of the EM fixed income universe (after adjusting for FX effects). Local currency government bond markets did not grow at all in USD terms in 2014, while the sovereign bond markets in foreign currency expanded about 1% in USD terms last year.
Figure 4: Growth of EM fixed income
Currency effects Why the slower growth? Part of the reason is simply currency effects. With nearly 90% of all tradable debt in EM denominated in local currency the value of this segment declines in USD terms when the USD appreciates.2 In 2014 alone, the USD appreciated 10% on average against the currencies in our sample (6% at the median).3 To illustrate the magnitude of the FX impact, we estimate that if exchange rates had remained constant between 2013 and 2014 the EM tradeable fixed income universe would have been about USD 15.6trn, or about 6% larger in USD terms. This means that markets continued to grow in local currency terms, albeit at a slower 6% pace.
Regulation and other dragsWhy has market growth been slower even correcting for currency effects. The most likely reason is more negative sentiment towards EM, a slowdown in flows and regulatory changes that have been outright hostile to EM bond markets. Poor indices and the indirectly adverse impact on EM countries not being targeted by QE flows have also played a part.
Continued overleaf
2 The reason for the USD appreciation is that since 2011 developed market central banks have ploughed trillions of USD of Quantitative Easing (QE) money into buying exclusively developed market assets. Global investors have largely jumped on the band wagon, many funding their purchases by reducing exposure to EM. Within developed markets, the USD has been the currency of choice resulting in a 40% appreciation versus other major currencies and EM currencies over the past four years. For more discussion of the technical bid for developed market assets due to QE please see “EM traffic light: Red, Amber, Green”, The Emerging View, July 2015.
3 The only way to directly compare various EM markets is to measure them in the same currency. There is considerable variety in the extent of recent USD appreciation across EM countries. Converting estimates of local market size to USD using standard EM FX indices can therefore be quite misleading. For example, using a simple EM spot FX index such as the JP Morgan EM spot FX index (FXJPEMCS Index) would tend to overstate the impact of USD strength. In the current analysis, we use the specific FX rates of each of 54 EM countries in the sample. The FXJPEMCS index covers only 10 mainly floating EM currencies – BRL, CLP, CNH, HUF, INR, MXN, RUB, SGD, TRY and ZAR.
70
30
% c
hang
e, y
oy
2001 2002 2003 2004 2005 2006 2010 2011 2012200920082007 2013 2014
Source: Ashmore, Bloomberg, World Bank, IMF, BAML.
-10
0
40
50
60
10
20
EM sovereignEM corporateTotal tradable
3
THE EMERGING VIEW August 2015
Domestic credit on the upThe slower expansion of EM bond markets has given room for the local credit markets to expand. Figure 5 shows that bond markets in EM were expanding faster than domestic credit markets prior to 2005, but that trend has now reversed, especially since 2010/2011.
The growth of domestic credit markets in EM stands in sharp contrast with developed economies, where domestic credit to GDP has been stagnant. Credit as a share of GDP in developed markets was almost the same in 2014 as in 2000 (129% of GDP in 2014 compared to 125% of GDP in 2000).
Bond markets, on the other hand, have mushroomed in developed economies in response to the strong bid from central banks under various QE programs. Already a hefty 139% of GDP in 2000, bond markets in developed countries have since reached a mind-blowing 247% of GDP. Investors have piled into the paper. Unfortunately, very little of the QE money has subsequently made it into the real economy, which is why the domestic credit statistics are so unexciting.4
Figure 5: Domestic credit has become more important
Corporate bondsThe rise of corporate bond markets continues apace. Corporate debt has been growing fast in the last five years, outpacing the growth in sovereign debt. EM companies operate in economies that are growing faster compared to developed markets and quite often the companies themselves are growing faster than the economies in which they operate. EM corporate debt is today a standalone asset class, comparable in size and liquidity to the US High Yield (HY) credit market.
Hard currency (predominantly USD) corporate debt grew particularly fast after 2011. Before 2011 the average yearly issuance of new corporate bonds was around USD 150bn, but in 2012, issuance jumped to just over USD 300bn per year and has stayed at or above that level ever since. Today the hard currency corporate debt market has a market cap of USD 1.3trn and includes 552 issuing companies from 49 countries. For comparison, in 2002 there were only 49 issuers from 15 countries.
The increase in new issuance also partly reflects a need to replace foreign credit (loans, etc.) as international banks (the traditional USD loan providers) scaled back EM lending after 2008/2009 due to regulatory pressures to reduce balance sheets.
Perception of the market by international investors has improved and has attracted more flows. The majority of flow into EM credit came from EM sovereign mandates as investors tactically allocated between EM corporates and EM sovereigns. Today most of the flows are coming from new investors from outside the EM asset class, typically reallocating away from US and European credit.
The supply side is changing too. EM corporates are now able to borrow for longer time periods and cheaper. The maturity profile of debt for many credits now extends far longer allowing for greater flexibility in dealing with volatility in earnings and refinancing of repayments.
Tapping public markets instead of foreign loan markets also increases transparency as issuers are incentivised to seek credit ratings from international rating agencies (usually a de facto pre-condition for issuing international bonds).
Investment relations departments have been expanded to improve communications with investors. The result is a virtuous circle where even existing issuers have to improve their levels of transparency. Ultimately, this makes the market more attractive and leads to even more investors coming in.
The corporate universe will continue to outgrow sovereign bond markets, in our view. This is partly due to moderate sovereign issuance, but the main drivers are structural. The local currency corporate bond market is still by far the fastest growing part of the tradable EM universe, but it still receives relatively little attention from foreign investors. One of the reasons is that indices for this segment of EM fixed income are still, at best, rudimentary.
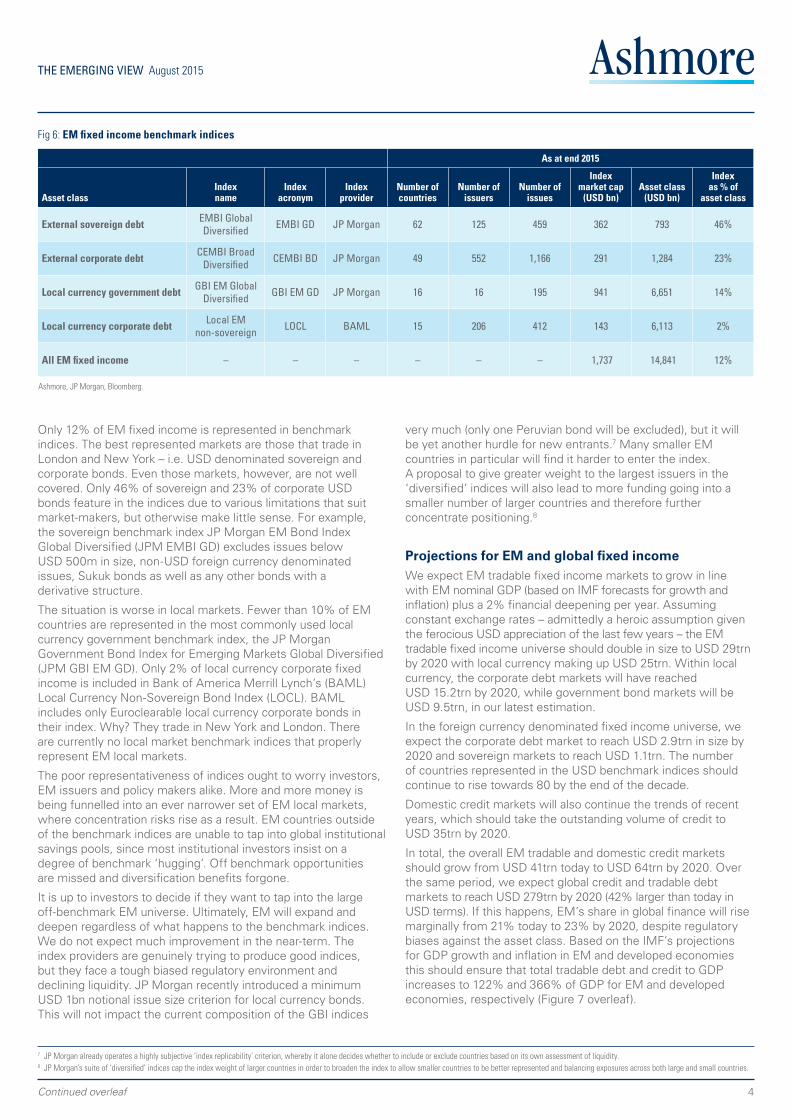
Inadequate indicesThe EM tradable debt universe remains much larger than what is implied by the indices in the asset class. Benchmark indices remain particularly inadequate in local currency markets (see Figure 6 overleaf). The reality is that EM benchmark indices are ‘public goods’, which are provided by private sector institutions, mainly investment banks, and therefore underprovided.5
Investment banks cover the cost of providing indices from trading profits, so banks only tend to include EM countries in the indices if they happen to be trading those markets.
This is why EM benchmark indices cover USD EM bonds far better than local bonds and why some EM countries – namely those where investment banks have local trading operations – are far more likely to feature in the benchmark indices than other EM countries.6
Continued overleaf
4 For more discussion see “The Failure of QE”, The Emerging View, April 2015. 5 Amazingly, international public sector financial institutions have still not recognised this problem. For more details see “Are Emerging Markets bond indices public goods?”, Occasional View, May 2014. 6 If the investment bank has no local presence it has to buy pricing data from local sources, which it cannot recoup through trading operations.
The EM local currency corporate bond market remains the fastest expanding segment of the EM fixed income universe, but still receives little attention from institutional investors
50
USD
trilli
on
‘01‘00 ‘02 ‘03 ‘04 ‘05 ‘06 ‘10 ‘11 ‘12‘09‘08‘07 ‘13 ‘14
Source: Ashmore, Bloomberg, World Bank, IMF, BAML.
0 30
35
%
40
45
20
30
40
10
Credit (LHS) Tradable debt (LHS)
Tradable debt as % of total EM finance (RHS)
4
THE EMERGING VIEW August 2015
Only 12% of EM fixed income is represented in benchmark indices. The best represented markets are those that trade in London and New York – i.e. USD denominated sovereign and corporate bonds. Even those markets, however, are not well covered. Only 46% of sovereign and 23% of corporate USD bonds feature in the indices due to various limitations that suit market-makers, but otherwise make little sense. For example, the sovereign benchmark index JP Morgan EM Bond Index Global Diversified (JPM EMBI GD) excludes issues below USD 500m in size, non-USD foreign currency denominated issues, Sukuk bonds as well as any other bonds with a derivative structure.
The situation is worse in local markets. Fewer than 10% of EM countries are represented in the most commonly used local currency government benchmark index, the JP Morgan Government Bond Index for Emerging Markets Global Diversified (JPM GBI EM GD). Only 2% of local currency corporate fixed income is included in Bank of America Merrill Lynch’s (BAML) Local Currency Non-Sovereign Bond Index (LOCL). BAML includes only Euroclearable local currency corporate bonds in their index. Why? They trade in New York and London. There are currently no local market benchmark indices that properly represent EM local markets.
The poor representativeness of indices ought to worry investors, EM issuers and policy makers alike. More and more money is being funnelled into an ever narrower set of EM local markets, where concentration risks rise as a result. EM countries outside of the benchmark indices are unable to tap into global institutional savings pools, since most institutional investors insist on a degree of benchmark ‘hugging’. Off benchmark opportunities are missed and diversification benefits forgone.
It is up to investors to decide if they want to tap into the large off-benchmark EM universe. Ultimately, EM will expand and deepen regardless of what happens to the benchmark indices. We do not expect much improvement in the near-term. The index providers are genuinely trying to produce good indices, but they face a tough biased regulatory environment and declining liquidity. JP Morgan recently introduced a minimum USD 1bn notional issue size criterion for local currency bonds. This will not impact the current composition of the GBI indices
very much (only one Peruvian bond will be excluded), but it will be yet another hurdle for new entrants.7 Many smaller EM countries in particular will find it harder to enter the index. A proposal to give greater weight to the largest issuers in the ‘diversified’ indices will also lead to more funding going into a smaller number of larger countries and therefore further concentrate positioning.8
Projections for EM and global fixed incomeWe expect EM tradable fixed income markets to grow in line with EM nominal GDP (based on IMF forecasts for growth and inflation) plus a 2% financial deepening per year. Assuming constant exchange rates – admittedly a heroic assumption given the ferocious USD appreciation of the last few years – the EM tradable fixed income universe should double in size to USD 29trn by 2020 with local currency making up USD 25trn. Within local currency, the corporate debt markets will have reached USD 15.2trn by 2020, while government bond markets will be USD 9.5trn, in our latest estimation.
In the foreign currency denominated fixed income universe, we expect the corporate debt market to reach USD 2.9trn in size by 2020 and sovereign markets to reach USD 1.1trn. The number of countries represented in the USD benchmark indices should continue to rise towards 80 by the end of the decade.
Domestic credit markets will also continue the trends of recent years, which should take the outstanding volume of credit to USD 35trn by 2020.
In total, the overall EM tradable and domestic credit markets should grow from USD 41trn today to USD 64trn by 2020. Over the same period, we expect global credit and tradable debt markets to reach USD 279trn by 2020 (42% larger than today in USD terms). If this happens, EM’s share in global finance will rise marginally from 21% today to 23% by 2020, despite regulatory biases against the asset class. Based on the IMF’s projections for GDP growth and inflation in EM and developed economies this should ensure that total tradable debt and credit to GDP increases to 122% and 366% of GDP for EM and developed economies, respectively (Figure 7 overleaf).
Continued overleaf
Fig 6: EM fixed income benchmark indices
As at end 2015
Asset classIndex name
Index acronym
Index provider
Number ofcountries
Number ofissuers
Number ofissues
Index market cap
(USD bn)Asset class
(USD bn)
Index as % of
asset class
External sovereign debt EMBI Global Diversified EMBI GD JP Morgan 62 125 459 362 793 46%
External corporate debt CEMBI Broad Diversified CEMBI BD JP Morgan 49 552 1,166 291 1,284 23%
Local currency government debt GBI EM Global Diversified GBI EM GD JP Morgan 16 16 195 941 6,651 14%
Local currency corporate debt Local EM non-sovereign LOCL BAML 15 206 412 143 6,113 2%
All EM fixed income – – – – – – 1,737 14,841 12%
Ashmore, JP Morgan, Bloomberg.
7 JP Morgan already operates a highly subjective ‘index replicability’ criterion, whereby it alone decides whether to include or exclude countries based on its own assessment of liquidity.8 JP Morgan’s suite of ‘diversified’ indices cap the index weight of larger countries in order to broaden the index to allow smaller countries to be better represented and balancing exposures across both large and small countries.

5
THE EMERGING VIEW August 2015
Fig 7: Forecasts to 2020
2014(USD trillion)
2020(USD trillion) % of GDP
Global credit and tradable debt 197 279 251%
Developed Markets 156 215 366%
Emerging Markets 41 64 122%
Total tradeable 15 29 55%
EM corporate 7 18 34%
Local corporate 6 15 29%
External corporate 1 3 6%
EM sovereign 7 11 20%
Local sovereign 7 10 18%
External sovereign 1 1 2%
Domestic credit to private sector 26 35 67%
Source: Ashmore.
EM fixed income in economic termsHow will EM cope with Fed hikes? There are two parts to the question: (a) how will rate hikes impact markets? And (b) how will rates impact fundamentals?
(a) Expected impact on marketsThe run-up to the start of rate hikes tends to be unambiguously negative for EM due to rising uncertainty. Each time the Fed delays rate hikes the uncertainty is extended. EM countries suffer under this uncertainty, as indeed they have done since the start of the Taper Tantrum in May 2013.
Early rate hikes, once they arrive, tend to be positive for credit, including EM. They signal greater confidence in the economy and remove the uncertainty surrounding where the yield curve is going to be anchored while the marginal cost of finance is still immaterial. Indeed, EM is trading at spreads and yields that currently imply that significant hikes have already been priced in. Within EM, local currency bonds and corporate HY bonds tend to perform best following rates hikes.
Finally, late stage hikes can cause significant damage, but our view is that the hiking cycle will be very drawn out, so this is not going to weigh on the markets anytime soon.9
(b) Expected impact on fundamentalsEM will prove fundamentally resilient to anything the Fed will throw at the world in the foreseeable future. EM’s indebtedness is very manageable (Figure 8). Total EM tradable debt and domestic credit was 118% of GDP in 2014, up by only a cumulative 35% of GDP since 2000. Over the same period, developed countries increased their overall indebtedness by 113% of GDP to an unprecedented 377% of GDP.10
Fig 8: Indebtedness – developed and Emerging Markets (% of GDP)
Emerging Markets 2014 2007 2000Change
since 2000Change
since 2007
Total 118% 103% 83% 35% 15%
Credit 67% 59% 48% 19% 8%
Tradeable debt 51% 44% 34% 17% 7%
External 18% 13% 13% 5% 4%
Local 33% 30% 20% 13% 3%Developed Markets
Total 377% 360% 263% 113% 17%
Credit 129% 140% 125% 5% -10%
Tradeable debt 247% 220% 139% 108% 27%
External 69% 58% 26% 43% 11%
Local 178% 162% 112% 66% 16%Source: World Bank, BAML, Bloomberg, Ashmore.
Should investors be concerned about the average increase of 35% of GDP in total EM indebtedness since 2000? We think not. Debt levels are sustainable in most countries. EM countries have grown their debt and credit markets from low levels. Between 2000 and 2014, EM debts increased at an average rate of 2.5% of GDP per year. Since 2007, this rate of increase has declined to 2.1% of GDP per year. Much of this reflects financial deepening and broadening, the emergence of brand new asset classes, establishment of yield curves, development of pension funds, etc. rather than simply greater leverage.
It is difficult to explain the increase in indebtedness in the already mature developed markets in the same terms. Rather, the build-up of debt here has created genuine debt overhangs, culminating in the crisis of 2008/2009. Instead of deleveraging since the crisis, developed economies have continued to lever up after the crisis and done so at a faster pace than EM countries. This implies greater fundamental vulnerability to tighter monetary policies in developed countries.
Differences in the composition of finance also matter. The rise in the share of domestic credit as part of total EM financing probably reduces sensitivity to Fed hikes. By contrast, the massive increase in outstanding tradable bonds in developed countries in recent years clearly increases sensitivity to Fed hikes. See Figure 9 for more details.
Fig 9: EM financing by region and type (% of GDP)
EM – by region and type Credit External Local Total
All EM 67% 18% 33% 118%
Latin America 45% 18% 35% 97%
Asia 95% 12% 49% 156%
Emerging Europe 70% 27% 24% 121%
Africa and Middle East 61% 15% 25% 101%
Source: World Bank, BAML, Bloomberg, Ashmore.
There are important differences within both developed and EM countries. Not all rich countries are over-indebted. Not all EM countries have healthy debt positions. Germany is only half as indebted as the Netherlands. US tradeable debt and domestic private sector credit exceeds 400% of GDP, which is not very different from Japan, but the balance between private and public sector debt is very different in the two countries.
Continued overleaf
9 See “The looming Fed lift-off and interest rate volatility: considerations for fixed income and EM debt”, Market Commentary, June 2015. 10 JP Morgan’s suite of ‘diversified’ indices cap the index weight of larger countries in order to broaden the index to allow smaller countries to be better represented and balancing exposures across both large and small countries.
The increase of 35% of GDP in total EM debt and credit since 2000 is mainly due to structural change – such as financial deepening and broadening, including the emergence of brand new asset classes. In contrast the increase in already developed markets largely reflects the establishment of the debt overhang that culminated in the crisis of 2008/2009.
EM tradeable universe is expected to reach USD 29trn by 2020 with local currency making up USD 25trn. Within local currency, corporate debt markets are expected to total USD 15.2trn

6
Asian countries are typically more developed and consequently have larger overall leverage levels (156% compared to the EM average of 118%). Credit markets are far more important in Asia than in either Latin America or Africa and the Middle East. Local bond markets play a bigger role than external debt markets in all regions except Emerging Europe, where external debt is larger than local bond markets. Latin America is noticeably less dependent on credit markets than bond markets compared to other EM regions.
At country level there are even larger variations. Some Asian economies – Hong Kong, South Korea, Malaysia and Thailand – have larger domestic credit markets than some developed economies in percentage of GDP terms though in most cases overall indebtedness levels are materially lower.11 Elsewhere in Asia financial markets are much smaller than the EM average, including the Philippines, Pakistan, Sri Lanka, Kazakhstan, India and Indonesia. Similar variations exist within other EM regions, though they are less extreme than in Asia. The implication is very clear: Do not look at EM on a regional basis. Look at countries on an individual basis regardless of where they are. The appendix shows how much private credit and tradable debt each country has issued.
Looking over the horizon…
Sukuk The market for Sharia compliant finance (‘Sukuk’) has grown 40% per annum since 2000. This is more than three times faster than EM fixed income over the same period, albeit from a low base. The asset class is now USD 322bn or 2.2% of total EM fixed income. Some 75% of Sukuks are in local currency with the balance in USD. Nine issuers dominate the Sukuk market, led by Malaysia (56% of total outstanding), Saudi Arabia (10%), UAE (9%), Indonesia (7%) and Qatar (5%). Turkey, Pakistan, Bahrain and Supranational issuers are also significant. Annual issuance is about USD 100bn (2014). Government Sukuk is 47% of the market. Malaysian Sukuk is now part of the Barclays Global Aggregate Index as of March 2015, while Malaysian Sukuk is benchmarked to the AIBIM Bursa Malaysia Sovereign Sharia Index – BMSSITR Index). Dow Jones and Reuters publish USD Sukuk indices.
Fig 10: Sukuk
USD billion
Total 322
% of total EM fixed income 2%
Government 151
Corporate 171
Local currency 242
USD denominated 81
Major issuers
Malaysia 180
Saudi Arabia 32
UAE 29
Indonesia 23
Qatar 16
Supranationals 13
Turkey 10
Pakistan 6
Bahrain 3
Others 10
Source: HSBC, Ashmore, BAML.
China China is transforming its economy away from export-led growth towards consumption-led growth. This involves the opening of China’s capital account, including global access to its USD 4.5trn domestic fixed income market. It is, quite simply, the biggest ‘big bang’ in world history. Moreover, the RMB looks set to achieve global reserve currency status in 2016, which means that China’s central government bond market increasingly will be seen as a ‘risk free’ market. China’s bond market will ultimately compete directly with developed market bonds, in our view. The RMB will appreciate strongly when QE becomes inflationary in the current reserve currencies, so investors can look forward to not just high real yields, but also to currency appreciation.
Within the China fixed income story, we think the municipal bond market is particularly interesting. Chinese banks sit on some RMB 11trn of loans to local governments that have been issued to finance infrastructure investment. These loans are in the process of being swapped to tradable bonds, which will form the backbone of China’s municipal bond market. So far RMB 2trn has been swapped to 1-year, 3-year, 5-year and 7-year benchmark bonds. This market will become central to monetary policy transmission and will support the expansion of the asset management and mutual fund industry in China. It will also provide an important source of fixed income for China’s savers. At inception, the Chinese municipal bond market in China is likely to be USD 1.7trn, making it the second largest of its kind in the world (after the US) and 30% larger than the entire USD denominated EM corporate debt market.
India India continues to take tentative steps towards opening its capital account for fixed income investors. Quotas are being increased gradually and the domestic bond market is being moved to Euroclear settlement. The government is recapitalising domestic banks, which is necessary in order to have solid market makers. China’s path of capital account liberalisation and eventual global reserve currency status will focus minds in India on the potential benefits of greater openness. India’s currency too is destined to become a global reserve currency. Local bond market capitalisation is USD 939bn, or 7% of the total outstanding EM local currency universe.
Chile Chile is in the process of consolidating its domestic government bonds into larger and more liquid bond issues in order to qualify for inclusion in the JPM GBI EM GD index. Over time, larger benchmark issues will replace Chile’s myriad smaller, illiquid bonds. Beyond the ability to tap passive money, Chile will benefit from its status as a ‘safe-haven’ country within the Latin American region due to its strong governance. Hence, during periods of risk aversion investors will increase their exposure to Chile’s bonds, which is advantageous to Chile because risk aversion often coincides with lower commodity prices.
THE EMERGING VIEW August 2015
11 Hong Kong, Malaysia, South Korea, Thailand and Singapore.
Continued overleaf
The RMB looks set to achieve global reserve currency status in 2016. In our view, China’s bond markets will ultimately compete directly with developed market bonds

7
THE EMERGING VIEW August 2015
Current fixed income valuationsFour years of QE targeted at developed market assets have pushed valuations of EM fixed income assets towards 3-year wide levels (Figure 11). Local fixed income is particularly cheap relative to both developed markets and compared to past valuations. The outlook for currencies matters critically to this asset class. Massive purchases of developed market assets through central bank sponsored QE programs have supported QE currencies, while sapping the sponsorship of EM currencies. However, to the extent that QE eventually turns into inflation and currency weakness, we think the current weakness in EM currencies versus the USD is a temporary phenomenon.
Fig 11: Valuations for EM fixed income
Spreads (bps) Yields
EM FI Duration Last 3 Yr High 3 Yr Low 3 Mth Change Last 3 Yr High 3 Yr Low 3 Mth Change
EMBI G. Div 6.8 359 406 237 34 5.8% 6.3% 4.3% 0.4%
IG 7.7 227 266 143 28 4.6% 5.3% 3.3% 0.3%
HY 5.3 590 717 390 35 8.0% 9.1% 5.8% 0.4%
CEMBI B. Div 4.9 354 395 274 26 5.6% 6.1% 4.4% 0.3%
IG 5.2 242 289 193 21 4.5% 5.2% 3.7% 0.3%
HY 4.2 570 705 439 38 7.7% 8.5% 6.4% 0.4%
GBI EM GD 4.9 – – – – 6.8% 7.2% 5.2% 0.2%
LOCL 3.7 – – – – 8.1% 8.9% 5.4% -0.2%
Source: Ashmore JP Morgan, BAML.
The EM equity universeBased on statistics from the World Federation of Exchanges the EM equity universe topped USD 17.4trn at the end of 2014, with China’s domestic exchanges leading, followed by India, South Korea, South Africa and Taiwan Figure 12). EM countries such as China (Shanghai and Shenzhen), India and Qatar had the largest increase in market cap on a year-on-year basis, finishing a year when domestic participation in the local markets as well as political changes, economic reforms and increased government infrastructure spending were drivers in these markets.
Fig 12: Top 10 EM exchanges by market cap
Exchange Dec 2014 % change / Dec 2013 (in USD)
Shanghai SE 3 932 527.7 57.5%
Shenzhen SE 2 072 420.0 42.7%
BSE India 1 558 299.7 36.8%
National Stock Exchange India 1 520 925.1 36.7%
Korea Exchange 1 212 759.5 -1.8%
Johannesburg SE 933 930.7 -0.9%
Taiwan SE Corp. 850 943.1 3.4%
BM & FBOVESPA 843 894.2 -17.3%
Saudi Stock Exchange – Tadawul 483 115.5 3.4%
Mexican Exchange 480 245.3 -8.7%
Source: World Federation of Exchanges, Domestic market capitalisation (USD millions).
China’s rise up the leader board was driven primarily by increased local participation on the domestic exchanges as well as the increase in avenues to invest, e.g. IPOs.
However, of more interest is the continued opening up of the domestic exchanges to foreign participation via the RQFII quota system as well as the so-called Shanghai-Hong Kong Stock Connect scheme. These initiatives increase the institutional investor base in the markets.
The market declines in June and July 2015 and subsequent measures to stabilise the markets are only temporary set-backs to the overall goal of capital market reforms and opening of the domestic markets. Chinese equity markets will dominate the EM universe in terms of market cap especially as the domestic (A share) markets become more and more accessible to foreign participation and index providers include them in EM indices. FTSE has already begun this exercise, providing EM investors with a FTSE EM China A Inclusion Index series, with or without quota restrictions.
A fully accessible Chinese equity market has significant implications for asset allocation for EM investors. Per FTSE, with no quota restrictions, China’s weight in the FTSE EM Index was about 45% as at 31 July 2015. MSCI’s EM plus China A index has China at 48% as at 31 July 2015 (Figure 13).
EM equity investors, in fact most global equity investors, will have to have a China strategy, one that not only looks at China as a constituent of the EM universe, but likely as an asset class segment. Just as an investor may make decisions around how to play the US market – large cap, small cap, SMID, etc., we believe this decision-making process will also have to be applied to the China opportunity set sooner rather than later.
Fig 13: China composition in FTSE and MSCI
Index % of Index
MSCI EM 23.9%
MSCI EM + China A 48.2%
FTSE EM 27.0%
FTSE EM China A Inclusion (no quota) 45.5%
FTSE EM China A Inclusion 30.8%
Source: MSCI, FTSE as at 31 July 2015.
Continued overleaf
Chinese equity markets will dominate the EM universe in terms of market cap especially as the domestic markets become more accessible

8Continued overleaf
THE EMERGING VIEW August 2015
Within the overall EM equity universe, investors have been able to segment the opportunity set on the basis of country, region, market cap and level of discovery, e.g. Frontier Markets, and index providers have been happy to oblige. According to MSCI, the EM small cap universe grew to USD 580bn in 2014, with the number of constituents remaining largely unchanged at 1,803. Frontier Markets, as defined by MSCI, grew in market cap to USD 97bn in 2014.
Frontier Markets have been impacted in a bi-polar way by price declines in the commodity/energy sector – some countries, such as Pakistan, are expected to benefit while most in the Middle East and some in Africa are expected to be negatively affected. Regardless of this clash of sentiments, Frontier Markets continue to intrigue EM investors given the still lack of discovery, focus and research that beset stocks within this universe. Correlation of Frontier Markets to other asset classes remains low.
More interestingly, a number of the markets in this segment, especially in Frontier Africa, exhibit negative correlations amongst each other, which provides a strong platform for building diversified portfolios with good expected returns with not much higher risk (Figures 14 and 15).
The universe of countries that make up Emerging and Frontier Markets (FM) are still young in terms of how much they represent of their respective countries’ productive output. Reviewing a metric favoured by Warren Buffet, it seems most of EM and FM companies’ earnings are well below their respective countries’ economic output (Figure 16).
Fig 16: Market cap to GDP basis
2014 (Nominal GDP)(USD billion) Market cap
China* 10,331 79%
India 2,073 45%
Brazil 1,830 28%
Korea 1,403 60%
Mexico 1,245 23%
Russia 1,092 31%
Indonesia 851 25%
Turkey 788 18%
Taiwan 531 117%
Poland 518 21%
Colombia 421 13%
UAE** 402 28%
Thailand 381 67%
South Africa 367 111%
Greece 337 4%
Malaysia 327 87%
Egypt 324 3%
Philippines 285 59%
Chile 247 49%
Peru 232 15%
Qatar** 212 60%
Czech Republic 205 10%
Hungary 126 11%
Source: JP Morgan, World Bank. *Shanghai and Shenzhen markets. **World Bank database, data as at December 2014.
Fig 14: Correlation Matrix – Emerging and Frontier Markets vs other indices
MSCI FM
MSCI ACWI
MSCI US
S&P 500
MSCI EAFE
MSCI EM
MSCI EM SC
MSCI FM 1.00
MSCI ACWI 0.61 1.00
MSCI US 0.54 0.96 1.00
S&P 500 0.54 0.96 1.00 1.00
MSCI EAFE 0.62 0.98 0.89 0.89 1.00
MSCI EM 0.59 0.90 0.79 0.79 0.89 1.00
MSCI EM SC 0.60 0.87 0.76 0.75 0.87 0.96 1.00
Source: Ashmore, Morningstar.
Fig 15: Correlation matrix: African countries* 2009 - 2014
Botswana Egypt Ghana Kenya Mauritius Morocco Namibia Nigeria Tunisia Zambia
Botswana 100% 13% 0% 37% 42% 34% 56% 14% 33% 24%
Egypt 100% 0% 34% 31% 42% 45% 27% 29% -1%
Ghana 100% 20% -1% -6% -13% 3% -14% 2%
Kenya 100% 55% 12% 30% 18% 8% 26%
Mauritius 100% 13% 25% 23% 25% 46%
Morocco 100% 53% 39% 22% 20%
Namibia 100% 17% 39% 11%
Nigeria 100% 2% 43%
Tunisia 100% 0%
Zambia 100%
Source: *S&P Custom Africa Index. The Custom Index includes all constituents of the S&P Pan-Africa Index, excluding companies domiciled in South Africa. The index is market-cap weighted with no country exceeding 20% of the overall weighting and is rebalanced on a quarterly basis.
9
THE EMERGING VIEW August 2015
What is on the horizon for EM equity markets? The most exciting development in the EM/FM universe, outside of the possible China A share market inclusion, is the potential presented by the opening up of the equity market in Saudi Arabia. The country opened its +USD 500bn equity markets to Qualified Foreign Investors with effect from 15 June 2015. In the run up to the event, Saudi markets had performed exceptionally well (at one stage the Saudi markets were amongst the top three best performing markets globally). While the exuberance of local investors hoping for big foreign inflows may have been misplaced in the short term, in the long term, once the market access process is refined, this would be too formidable a market to ignore.
Factors that will temper international investor appetite in the short term are the onerous registration process, understanding the new independent custody model and practical issues of managing a pre-funded market (T+0 settlements). Index providers have been cautious as to when and where (EM or FM) the market
would be included in indices. However, given the size, scale and liquidity of the Saudi market, it would not be far-fetched to see the market categorised in the EM indices category, in our view.
Further out on the horizon is Iran. The deal between Iran and the West, if implemented, could be a precursor to the opening up of the country’s equity market to foreign participation. With a market cap of about USD 100bn which trades about USD 100m a day this market compares favourably with many EM and FM countries.
The EM and FM equity universe continues to evolve as the global environment seeks its economic footing. Active investing in our view is going to be key in picking through the winners and losers. Being part of an EM or FM index, as a country or stock, while helpful, does not present investors with the full picture; the EM/FM universe includes many more countries and stocks than what appears in the indices.
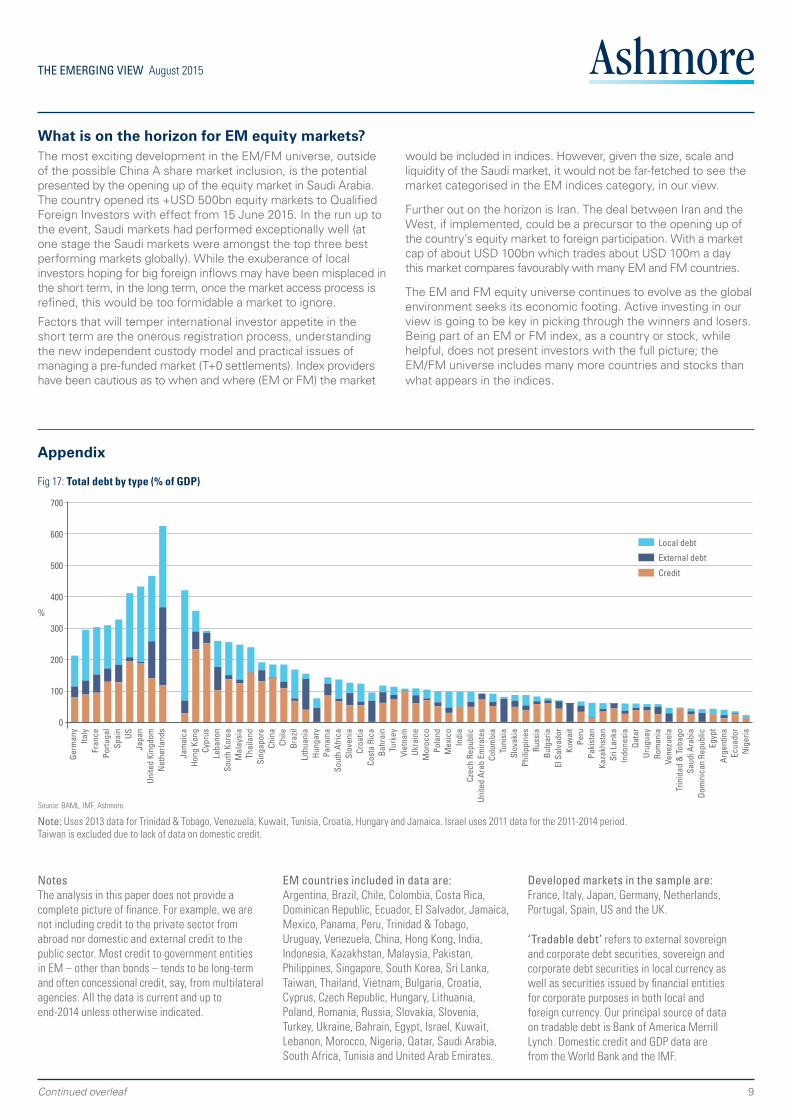
NotesThe analysis in this paper does not provide a complete picture of finance. For example, we are not including credit to the private sector from abroad nor domestic and external credit to the public sector. Most credit to government entities in EM – other than bonds – tends to be long-term and often concessional credit, say, from multilateral agencies. All the data is current and up to end-2014 unless otherwise indicated.
EM countries included in data are: Argentina, Brazil, Chile, Colombia, Costa Rica, Dominican Republic, Ecuador, El Salvador, Jamaica, Mexico, Panama, Peru, Trinidad & Tobago, Uruguay, Venezuela, China, Hong Kong, India, Indonesia, Kazakhstan, Malaysia, Pakistan, Philippines, Singapore, South Korea, Sri Lanka, Taiwan, Thailand, Vietnam, Bulgaria, Croatia, Cyprus, Czech Republic, Hungary, Lithuania, Poland, Romania, Russia, Slovakia, Slovenia, Turkey, Ukraine, Bahrain, Egypt, Israel, Kuwait, Lebanon, Morocco, Nigeria, Qatar, Saudi Arabia, South Africa, Tunisia and United Arab Emirates.
Developed markets in the sample are: France, Italy, Japan, Germany, Netherlands, Portugal, Spain, US and the UK.
‘Tradable debt’ refers to external sovereign and corporate debt securities, sovereign and corporate debt securities in local currency as well as securities issued by financial entities for corporate purposes in both local and foreign currency. Our principal source of data on tradable debt is Bank of America Merrill Lynch. Domestic credit and GDP data are from the World Bank and the IMF.
Appendix
Continued overleaf
Fig 17: Total debt by type (% of GDP)
Note: Uses 2013 data for Trinidad & Tobago, Venezuela, Kuwait, Tunisia, Croatia, Hungary and Jamaica. Israel uses 2011 data for the 2011-2014 period. Taiwan is excluded due to lack of data on domestic credit.
1 2 3 10 11 12 13 14 15 16 17
4 5 6 18 19 20 21 22 23 24 25
7 26 27 28 29 30 31 32 338 9
65%
40%
100%
100
%
200
300
700
400
500
600Local debt
0
Source: BAML, IMF, Ashmore.
External debt
Germ
any
Italy
Fran
cePo
rtuga
lSp
ain
USJa
pan
Unite
d Ki
ngdo
mN
ethe
rland
s
Jam
aica
Hong
Kon
gCy
prus
Leba
non
Sout
h Ko
rea
Mal
aysi
aTh
aila
ndSi
ngap
ore
Chin
aCh
ileBr
azil
Lith
uani
aHu
ngar
yPa
nam
aSo
uth
Afric
aSl
oven
iaCr
oatia
Cost
a Ri
caBa
hrai
nTu
rkey
Viet
nam
Ukra
ine
Mor
occo
Pola
ndM
exic
oIn
dia
Czec
h Re
publ
icUn
ited
Arab
Em
irate
sCo
lom
bia
Tuni
sia
Slov
akia
Phili
ppin
esRu
ssia
Bulg
aria
El S
alva
dor
Kuw
ait
Peru
Paki
stan
Kaza
khst
anSr
i Lan
kaIn
done
sia
Qata
rUr
ugua
yRo
man
iaVe
nezu
ela
Trin
idad
& T
obag
oSa
udi A
rabi
aDo
min
ican
Rep
ublic
Egyp
tAr
gent
ina
Ecua
dor
Nig
eria
Credit
10
No part of this article may be reproduced in any form, or referred to in any other publication, without the written permission of Ashmore Investment Management Limited © 2015.
Important information: This document is issued by Ashmore Investment Management Limited (‘Ashmore’) which is authorised and regulated by the UK Financial Conduct Authority and which is also, registered under the U.S. Investment Advisors Act. The information and any opinions contained in this document have been compiled in good faith, but no representation or warranty, express or implied, is made as to their accuracy, completeness or correctness. Save to the extent (if any) that exclusion of liability is prohibited by any applicable law or regulation, Ashmore and its respective officers, employees, representatives and agents expressly advise that they shall not be liable in any respect whatsoever for any loss or damage, whether direct, indirect, consequential or otherwise however arising (whether in negligence or otherwise) out of or in connection with the contents of or any omissions from this document. This document does not constitute an offer to sell, purchase, subscribe for or otherwise invest in units or shares of any Fund referred to in this document. The value of any investment in any such Fund may fall as well as rise and investors may not get back the amount originally invested. Past performance is not a reliable indicator of future results. All prospective investors must obtain a copy of the final Scheme Particulars or (if applicable) other offering document relating to the relevant Fund prior to making any decision to invest in any such Fund. This document does not constitute and may not be relied upon as constituting any form of investment advice and prospective investors are advised to ensure that they obtain appropriate independent professional advice before making any investment in any such Fund. Funds are distributed in the United States by Ashmore Investment Management (US) Corporation, a registered broker-dealer and member of FINRA and SIPC.
Head office
Ashmore Investment Management Limited61 Aldwych, London WC2B 4AE
T: +44 (0)20 3077 6000
@AshmoreEM
www.ashmoregroup.com
BeijingT: +86 10 5764 2601
BogotaT: +57 1 347 0649
JakartaT: +6221 2953 9000
IstanbulT: +90 212 349 40 00
MumbaiT: +91 22 6608 0000
New YorkT: +1 212 661 0061
RiyadhT: +966 11 483 9100
SingaporeT: +65 6580 8288
TokyoT: +81 03 6860 3777
WashingtonT: +1 703 243 8800
Other locationsShanghai
Bloomberg pageAshmore <GO>
Fund priceswww.ashmoregroup.com Bloomberg FT.com Reuters S&P Lipper
Contact
THE EMERGING VIEW August 2015