©THE ELWAY POLL 7 APR 17 7 APRIL 17 Mapping Washington’s Attitudinal Terrain ... · Mapping...
6
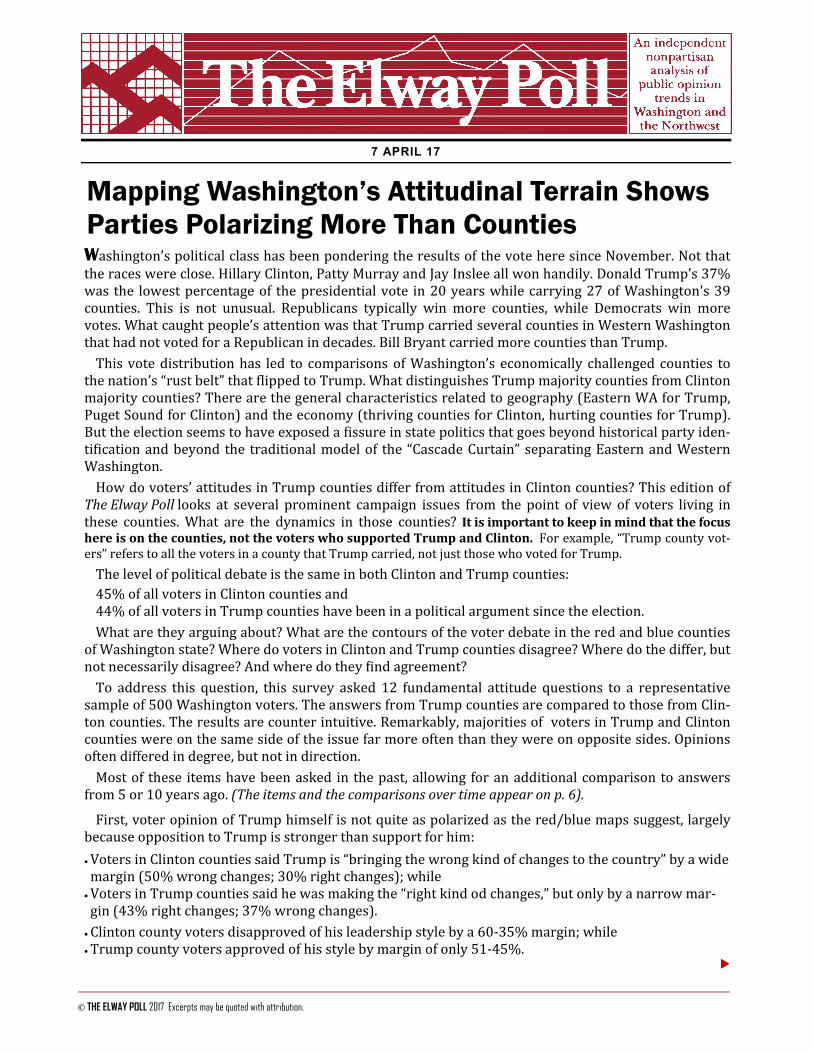
©THE ELWAY POLL 7 APR 17 7 APRIL 17 © THE ELWAY POLL 2017 Excerpts may be quoted with attribution. Mapping Washington’s Attitudinal Terrain Shows Parties Polarizing More Than Counties Washington’s political class has been pondering the results of the vote here since November. Not that the races were close. Hillary Clinton, Patty Murray and Jay Inslee all won handily. Donald Trump’s 37% was the lowest percentage of the presidential vote in 20 years while carrying 27 of Washington's 39 counties. This is not unusual. Republicans typically win more counties, while Democrats win more votes. What caught people’s attention was that Trump carried several counties in Western Washington that had not voted for a Republican in decades. Bill Bryant carried more counties than Trump. This vote distribution has led to comparisons of Washington’s economically challenged counties to the nation’s “rust belt” that ϐlipped to Trump. What distinguishes Trump majority counties from Clinton majority counties? There are the general characteristics related to geography (Eastern WA for Trump, Puget Sound for Clinton) and the economy (thriving counties for Clinton, hurting counties for Trump). But the election seems to have exposed a ϐissure in state politics that goes beyond historical party iden- tiϐication and beyond the traditional model of the “Cascade Curtain” separating Eastern and Western Washington. How do voters’ attitudes in Trump counties differ from attitudes in Clinton counties? This edition of The Elway Poll looks at several prominent campaign issues from the point of view of voters living in these counties. What are the dynamics in those counties? It is important to keep in mind that the focus here is on the counties, not the voters who supported Trump and Clinton. For example, “Trump county vot- ers” refers to all the voters in a county that Trump carried, not just those who voted for Trump. The level of political debate is the same in both Clinton and Trump counties: 45% of all voters in Clinton counties and 44% of all voters in Trump counties have been in a political argument since the election. What are they arguing about? What are the contours of the voter debate in the red and blue counties of Washington state? Where do voters in Clinton and Trump counties disagree? Where do the differ, but not necessarily disagree? And where do they ϐind agreement? To address this question, this survey asked 12 fundamental attitude questions to a representative sample of 500 Washington voters. The answers from Trump counties are compared to those from Clin- ton counties. The results are counter intuitive. Remarkably, majorities of voters in Trump and Clinton counties were on the same side of the issue far more often than they were on opposite sides. Opinions often differed in degree, but not in direction. Most of these items have been asked in the past, allowing for an additional comparison to answers from 5 or 10 years ago. (The items and the comparisons over time appear on p. 6). First, voter opinion of Trump himself is not quite as polarized as the red/blue maps suggest, largely because opposition to Trump is stronger than support for him: • Voters in Clinton counties said Trump is “bringing the wrong kind of changes to the country” by a wide margin (50% wrong changes; 30% right changes); while • Voters in Trump counties said he was making the “right kind od changes,” but only by a narrow mar- gin (43% right changes; 37% wrong changes). • Clinton county voters disapproved of his leadership style by a 60-35% margin; while • Trump county voters approved of his style by margin of only 51-45%.
Transcript of ©THE ELWAY POLL 7 APR 17 7 APRIL 17 Mapping Washington’s Attitudinal Terrain ... · Mapping...
©THE ELWAY POLL 7 APR 17
7 APRIL 17
© THE ELWAY POLL 2017 Excerpts may be quoted with attribution.
Mapping Washington’s Attitudinal Terrain Shows Parties Polarizing More Than Counties Washington’spoliticalclasshasbeenponderingtheresultsofthevoteheresinceNovember.Notthattheraceswereclose.HillaryClinton,PattyMurrayandJayInsleeallwonhandily.DonaldTrump’s37%wasthe lowestpercentageof thepresidentialvote in20yearswhilecarrying27ofWashington's39counties. This is not unusual. Republicans typically win more counties, while Democrats win morevotes.Whatcaughtpeople’sattentionwasthatTrumpcarriedseveralcountiesinWesternWashingtonthathadnotvotedforaRepublicanindecades.BillBryantcarriedmorecountiesthanTrump.Thisvotedistributionhas led to comparisonsofWashington’seconomically challengedcounties tothenation’s“rustbelt”that lippedtoTrump.WhatdistinguishesTrumpmajoritycountiesfromClintonmajoritycounties?Therearethegeneralcharacteristicsrelatedtogeography(EasternWAforTrump,PugetSoundforClinton)andtheeconomy(thrivingcountiesforClinton,hurtingcountiesforTrump).Buttheelectionseemstohaveexposeda issureinstatepoliticsthatgoesbeyondhistoricalpartyiden-ti icationandbeyondthe traditionalmodelof the “CascadeCurtain”separatingEasternandWesternWashington.Howdovoters’attitudesinTrumpcountiesdifferfromattitudesinClintoncounties?ThiseditionofTheElwayPolllooks at several prominent campaign issues from the point of viewof voters living inthese counties.What are the dynamics in those counties? Itisimportanttokeepinmindthatthefocushereisonthecounties,notthevoterswhosupportedTrumpandClinton.Forexample,“Trumpcountyvot-ers”referstoallthevotersinacountythatTrumpcarried,notjustthosewhovotedforTrump.ThelevelofpoliticaldebateisthesameinbothClintonandTrumpcounties:45%ofallvotersinClintoncountiesand44%ofallvotersinTrumpcountieshavebeeninapoliticalargumentsincetheelection.Whataretheyarguingabout?WhatarethecontoursofthevoterdebateintheredandbluecountiesofWashingtonstate?WheredovotersinClintonandTrumpcountiesdisagree?Wheredothediffer,butnotnecessarilydisagree?Andwheredothey indagreement?To address this question, this survey asked 12 fundamental attitude questions to a representativesampleof500Washingtonvoters.TheanswersfromTrumpcountiesarecomparedtothosefromClin-toncounties.Theresultsarecounterintuitive.Remarkably,majoritiesofvotersinTrumpandClintoncountieswereonthesamesideoftheissuefarmoreoftenthantheywereonoppositesides.Opinionsoftendifferedindegree,butnotindirection.Mostof these itemshavebeenasked in thepast,allowing foranadditionalcomparisontoanswersfrom5or10yearsago.(Theitemsandthecomparisonsovertimeappearonp.6).First,voteropinionofTrumphimselfisnotquiteaspolarizedasthered/bluemapssuggest,largelybecauseoppositiontoTrumpisstrongerthansupportforhim:• VotersinClintoncountiessaidTrumpis“bringingthewrongkindofchangestothecountry”byawidemargin(50%wrongchanges;30%rightchanges);while• VotersinTrumpcountiessaidhewasmakingthe“rightkindodchanges,”butonlybyanarrowmar-gin(43%rightchanges;37%wrongchanges).• Clintoncountyvotersdisapprovedofhisleadershipstylebya60-35%margin;while• Trumpcountyvotersapprovedofhisstylebymarginofonly51-45%.
©THE ELWAY POLL 7 APR 17
2
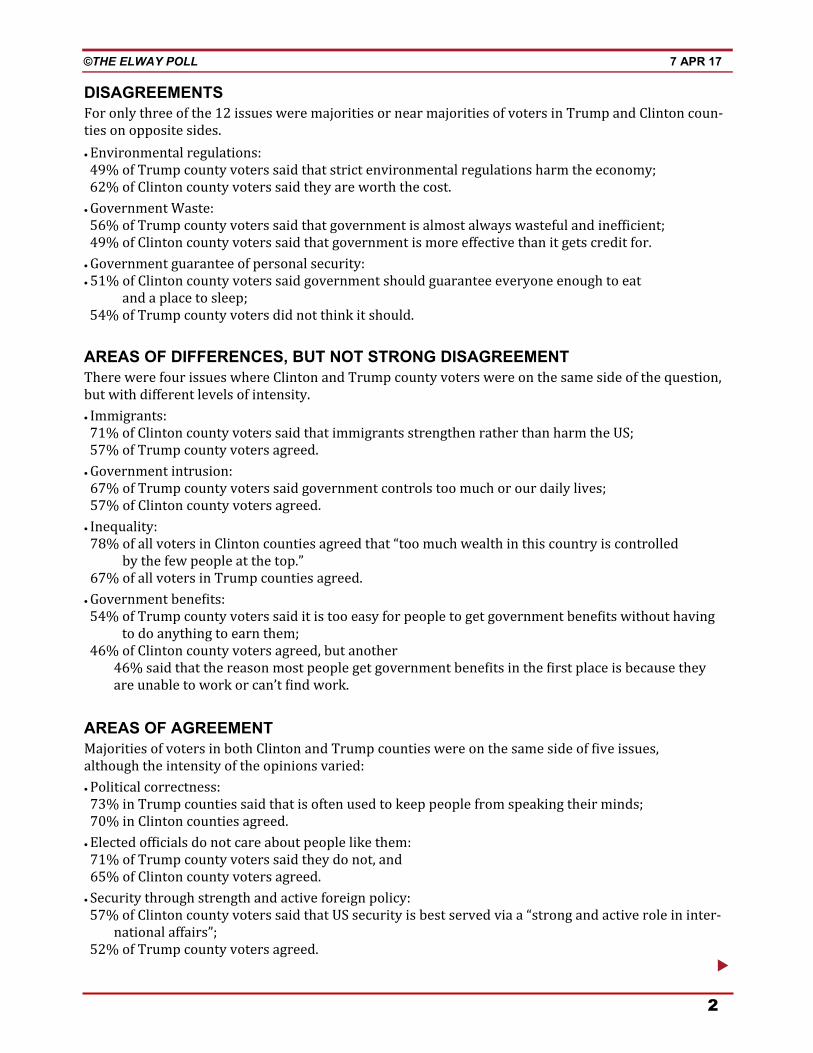
DISAGREEMENTS Foronlythreeofthe12issuesweremajoritiesornearmajoritiesofvotersinTrumpandClintoncoun-tiesonoppositesides.• Environmentalregulations:49%ofTrumpcountyvoterssaidthatstrictenvironmentalregulationsharmtheeconomy;62%ofClintoncountyvoterssaidtheyareworththecost.• GovernmentWaste:56%ofTrumpcountyvoterssaidthatgovernmentisalmostalwayswastefulandinef icient;49%ofClintoncountyvoterssaidthatgovernmentismoreeffectivethanitgetscreditfor.• Governmentguaranteeofpersonalsecurity:• 51%ofClintoncountyvoterssaidgovernmentshouldguaranteeeveryoneenoughtoeatandaplacetosleep;54%ofTrumpcountyvotersdidnotthinkitshould.AREAS OF DIFFERENCES, BUT NOT STRONG DISAGREEMENT TherewerefourissueswhereClintonandTrumpcountyvoterswereonthesamesideofthequestion,butwithdifferentlevelsofintensity.• Immigrants:71%ofClintoncountyvoterssaidthatimmigrantsstrengthenratherthanharmtheUS;57%ofTrumpcountyvotersagreed.• Governmentintrusion:67%ofTrumpcountyvoterssaidgovernmentcontrolstoomuchorourdailylives;57%ofClintoncountyvotersagreed.• Inequality:78%ofallvotersinClintoncountiesagreedthat“toomuchwealthinthiscountryiscontrolledbythefewpeopleatthetop.”67%ofallvotersinTrumpcountiesagreed.• Governmentbene its:54%ofTrumpcountyvoterssaiditistooeasyforpeopletogetgovernmentbene itswithouthavingtodoanythingtoearnthem;46%ofClintoncountyvotersagreed,butanother46%saidthatthereasonmostpeoplegetgovernmentbene itsinthe irstplaceisbecausetheyareunabletoworkorcan’t indwork. AREAS OF AGREEMENT MajoritiesofvotersinbothClintonandTrumpcountieswereonthesamesideof iveissues,althoughtheintensityoftheopinionsvaried:• Politicalcorrectness:73%inTrumpcountiessaidthatisoftenusedtokeeppeoplefromspeakingtheirminds;70%inClintoncountiesagreed.• Electedof icialsdonotcareaboutpeoplelikethem:71%ofTrumpcountyvoterssaidtheydonot,and65%ofClintoncountyvotersagreed.• Securitythroughstrengthandactiveforeignpolicy:57%ofClintoncountyvoterssaidthatUSsecurityisbestservedviaa“strongandactiveroleininter-nationalaffairs”;52%ofTrumpcountyvotersagreed.
©THE ELWAY POLL 7 APR 17
3
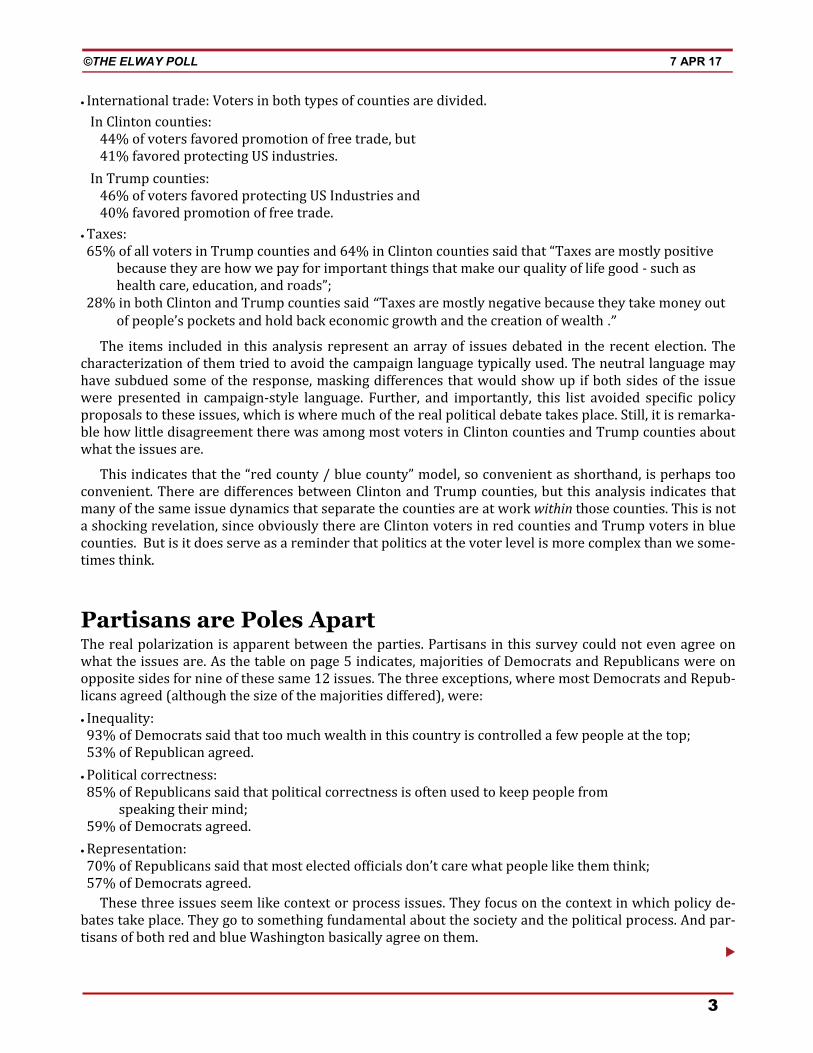
• Internationaltrade:Votersinbothtypesofcountiesaredivided.InClintoncounties:44%ofvotersfavoredpromotionoffreetrade,but41%favoredprotectingUSindustries.InTrumpcounties:46%ofvotersfavoredprotectingUSIndustriesand40%favoredpromotionoffreetrade.• Taxes:65%ofallvotersinTrumpcountiesand64%inClintoncountiessaidthat“Taxesaremostlypositivebecausetheyarehowwepayforimportantthingsthatmakeourqualityoflifegood-suchashealthcare,education,androads”;28%inbothClintonandTrumpcountiessaid “Taxesaremostlynegativebecausetheytakemoneyoutofpeople’spocketsandholdbackeconomicgrowthandthecreationofwealth .” The items included in thisanalysisrepresentanarrayof issuesdebated in therecentelection.Thecharacterizationofthemtriedtoavoidthecampaignlanguagetypicallyused.Theneutrallanguagemayhavesubduedsomeoftheresponse,maskingdifferencesthatwouldshowupifbothsidesoftheissuewere presented in campaign-style language. Further, and importantly, this list avoided speci ic policyproposalstotheseissues,whichiswheremuchoftherealpoliticaldebatetakesplace.Still,itisremarka-blehowlittledisagreementtherewasamongmostvotersinClintoncountiesandTrumpcountiesaboutwhattheissuesare.Thisindicatesthatthe“redcounty/bluecounty”model,soconvenientasshorthand,isperhapstooconvenient.TherearedifferencesbetweenClintonandTrumpcounties,butthisanalysisindicatesthatmanyofthesameissuedynamicsthatseparatethecountiesareatworkwithinthosecounties.Thisisnotashockingrevelation,sinceobviouslythereareClintonvotersinredcountiesandTrumpvotersinbluecounties.Butisitdoesserveasareminderthatpoliticsatthevoterlevelismorecomplexthanwesome-timesthink. Partisans are Poles Apart Therealpolarizationisapparentbetweentheparties.Partisansinthissurveycouldnotevenagreeonwhattheissuesare.Asthetableonpage5indicates,majoritiesofDemocratsandRepublicanswereonoppositesidesfornineofthesesame12issues.Thethreeexceptions,wheremostDemocratsandRepub-licansagreed(althoughthesizeofthemajoritiesdiffered),were:• Inequality:93%ofDemocratssaidthattoomuchwealthinthiscountryiscontrolledafewpeopleatthetop;53%ofRepublicanagreed.• Politicalcorrectness:85%ofRepublicanssaidthatpoliticalcorrectnessisoftenusedtokeeppeoplefromspeakingtheirmind;59%ofDemocratsagreed.• Representation:70%ofRepublicanssaidthatmostelectedof icialsdon’tcarewhatpeoplelikethemthink;57%ofDemocratsagreed.Thesethreeissuesseemlikecontextorprocessissues.Theyfocusonthecontextinwhichpolicyde-batestakeplace.Theygotosomethingfundamentalaboutthesocietyandthepoliticalprocess.Andpar-tisansofbothredandblueWashingtonbasicallyagreeonthem.
©THE ELWAY POLL 7 APR 17
4
Sample Prof i le
T h e E l w a y P o l l
S e a t t l e , W A 2 0 6 / 2 6 4 - 1 5 0 0 F A X : 2 6 4 - 0 3 0 1
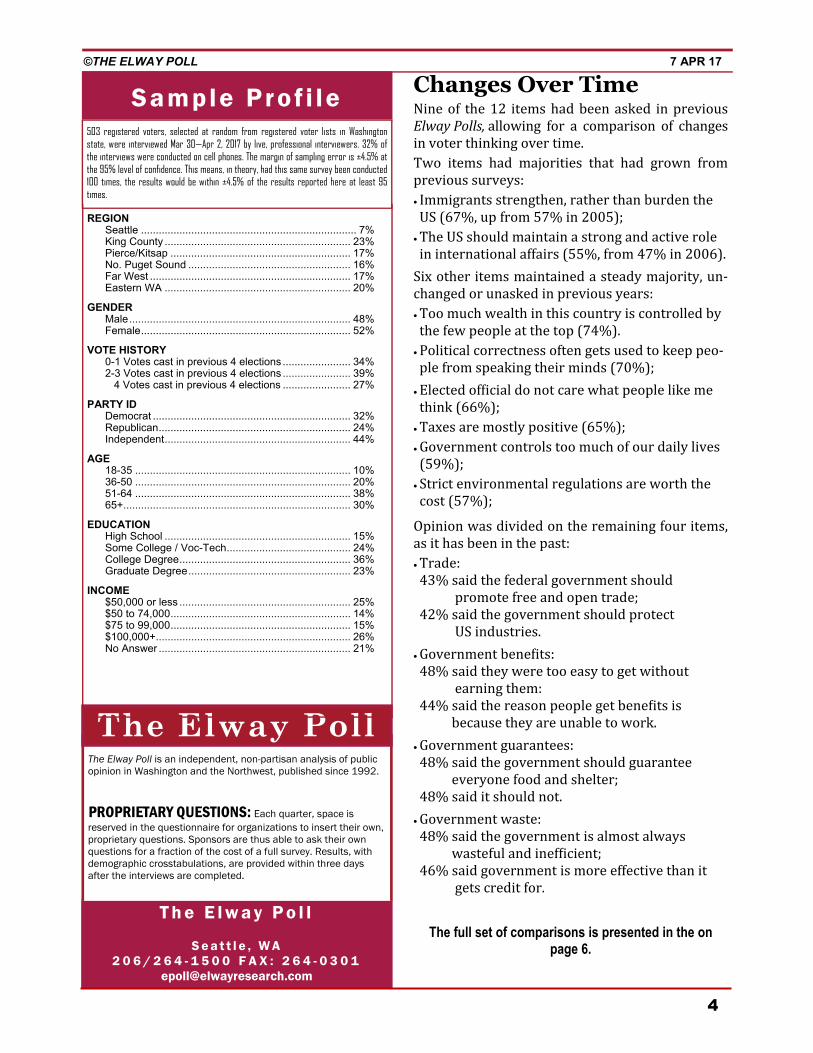
503 registered voters, selected at random from registered voter lists in Washington state, were interviewed Mar 30—Apr 2, 2017 by live, professional interviewers. 32% of the interviews were conducted on cell phones. The margin of sampling error is ±4.5% at the 95% level of confidence. This means, in theory, had this same survey been conducted 100 times, the results would be within ±4.5% of the results reported here at least 95 times.
The Elway Poll is an independent, non-partisan analysis of public opinion in Washington and the Northwest, published since 1992.
PROPRIETARY QUESTIONS: Each quarter, space is reserved in the questionnaire for organizations to insert their own, proprietary questions. Sponsors are thus able to ask their own questions for a fraction of the cost of a full survey. Results, with demographic crosstabulations, are provided within three days after the interviews are completed.
The Elway Poll
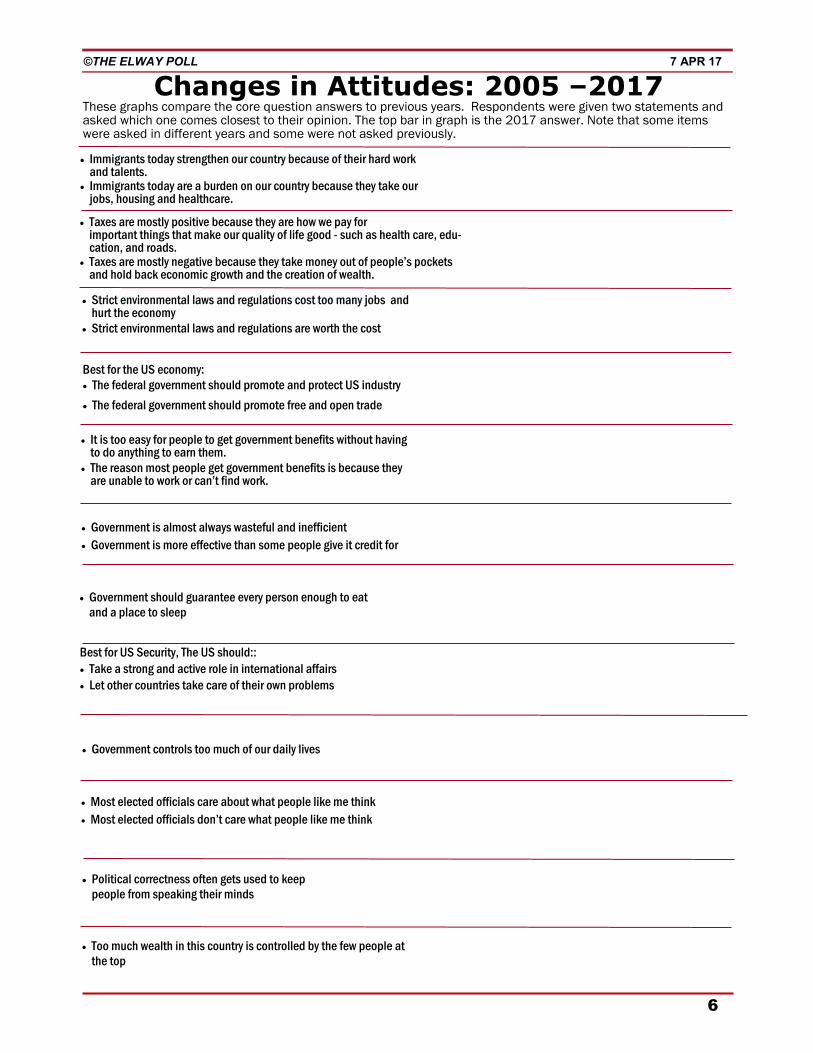
Changes Over Time Nineof the12 itemshadbeenasked inpreviousElwayPolls,allowing for a comparison of changesinvoterthinkingovertime.Two items had majorities that had grown fromprevioussurveys:• Immigrantsstrengthen,ratherthanburdentheUS(67%,upfrom57%in2005);• TheUSshouldmaintainastrongandactiveroleininternationalaffairs(55%,from47%in2006).Sixotheritemsmaintainedasteadymajority,un-changedorunaskedinpreviousyears:• Toomuchwealthinthiscountryiscontrolledbythefewpeopleatthetop(74%).• Politicalcorrectnessoftengetsusedtokeeppeo-plefromspeakingtheirminds(70%);• Electedof icialdonotcarewhatpeoplelikemethink(66%);• Taxesaremostlypositive(65%);• Governmentcontrolstoomuchofourdailylives(59%);• Strictenvironmentalregulationsareworththecost(57%);Opinionwasdividedontheremainingfouritems,asithasbeeninthepast:• Trade:43%saidthefederalgovernmentshouldpromotefreeandopentrade;42%saidthegovernmentshouldprotectUSindustries.• Governmentbene its:48%saidtheyweretooeasytogetwithoutearningthem:44%saidthereasonpeoplegetbene itsisbecausetheyareunabletowork.• Governmentguarantees:48%saidthegovernmentshouldguaranteeeveryonefoodandshelter;48%saiditshouldnot.• Governmentwaste:48%saidthegovernmentisalmostalwayswastefulandinef icient;46%saidgovernmentismoreeffectivethanitgetscreditfor.
The full set of comparisons is presented in the on page 6.
REGION Seattle ......................................................................... 7% King County ............................................................... 23% Pierce/Kitsap ............................................................. 17% No. Puget Sound ....................................................... 16% Far West .................................................................... 17% Eastern WA ............................................................... 20%
GENDER Male ........................................................................... 48% Female ....................................................................... 52%
VOTE HISTORY 0-1 Votes cast in previous 4 elections ....................... 34% 2-3 Votes cast in previous 4 elections ....................... 39% 4 Votes cast in previous 4 elections ....................... 27%
PARTY ID Democrat ................................................................... 32% Republican ................................................................. 24% Independent ............................................................... 44%
AGE 18-35 ......................................................................... 10% 36-50 ......................................................................... 20% 51-64 ......................................................................... 38% 65+ ............................................................................. 30%
EDUCATION High School ............................................................... 15% Some College / Voc-Tech .......................................... 24% College Degree .......................................................... 36% Graduate Degree ....................................................... 23%
INCOME $50,000 or less .......................................................... 25% $50 to 74,000 ............................................................. 14% $75 to 99,000 ............................................................. 15% $100,000+.................................................................. 26% No Answer ................................................................. 21%
©THE ELWAY POLL 7 APR 17
5
DEMs REPs • Immigrants today strengthen our country because of their hard work
and talents. • Immigrants today are a burden on our country because they take our
jobs, housing and healthcare.
90 6
42
41
• Taxes are mostly positive because they are how we pay for important things that make our quality of life good - such as health care, educa-tion, and roads.
• Taxes are mostly negative because they take money out of people’s pockets and hold back economic growth and the creation of wealth.
89 9
42
41
• Strict environmental laws and regulations cost too many jobs and hurt the economy
• Strict environmental laws and regulations are worth the cost
11
86
71
21
Best for US economy: • The federal government should promote and protect US industry
• The federal government should promote free and open trade
33 50
54 32
• It is too easy for people to get government benefits without having to do anything to earn them.
• The reason most people get government benefits is because they are unable to work or can’t find work.
26
65
77
15
• Government is almost always wasteful and inefficient • Government is more effective than some people give it credit for
31 61
65 26
• Government should guarantee every person enough to eat and a place to sleep [% who agreed]
70 20
Best for US Security. The US should: • Take a strong an active role in international affairs • Let other countries take care of their own problems
72 23
45 47
• Government controls too much of our daily lives [% who agreed] 35 81
• Most elected officials care about what people like me think • Most elected officials don’t care what people like me think
38 57
24 70
• Political correctness often gets used to keep people from speaking their minds [% who agreed}
59 85
• Too much wealth in this country is controlled by the few people at the top [% who agreed]
93 53
INDs 64
23
59
34
36
56
42 44
47
43
49 45
49
50 42
65
24 71
72
74
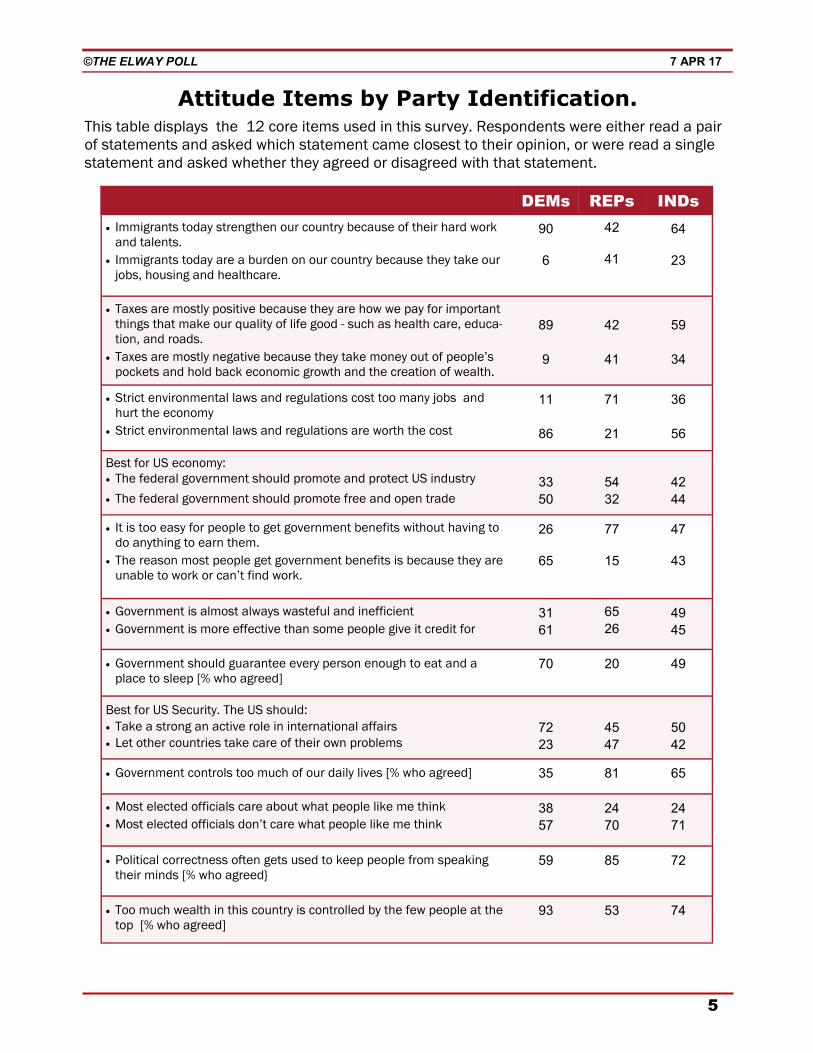
Attitude Items by Party Identification. This table displays the 12 core items used in this survey. Respondents were either read a pair of statements and asked which statement came closest to their opinion, or were read a single statement and asked whether they agreed or disagreed with that statement.
©THE ELWAY POLL 7 APR 17
6
• It is too easy for people to get government benefits without having to do anything to earn them.
• The reason most people get government benefits is because they are unable to work or can’t find work.
• Most elected officials care about what people like me think • Most elected officials don’t care what people like me think
• Government is almost always wasteful and inefficient • Government is more effective than some people give it credit for
• Taxes are mostly positive because they are how we pay for important things that make our quality of life good - such as health care, edu-cation, and roads.
• Taxes are mostly negative because they take money out of people’s pockets and hold back economic growth and the creation of wealth.
• Strict environmental laws and regulations cost too many jobs and hurt the economy
• Strict environmental laws and regulations are worth the cost
• Immigrants today strengthen our country because of their hard work and talents.
• Immigrants today are a burden on our country because they take our jobs, housing and healthcare.
• Political correctness often gets used to keep people from speaking their minds
• Too much wealth in this country is controlled by the few people at the top
• Government controls too much of our daily lives
• Government should guarantee every person enough to eat and a place to sleep
Best for the US economy: • The federal government should promote and protect US industry
• The federal government should promote free and open trade
Best for US Security, The US should:: • Take a strong and active role in international affairs • Let other countries take care of their own problems
Changes in Attitudes: 2005 –2017 These graphs compare the core question answers to previous years. Respondents were given two statements and asked which one comes closest to their opinion. The top bar in graph is the 2017 answer. Note that some items were asked in different years and some were not asked previously.