
The Effects of Two Types of Hypnotic Suggestions on ...
96
Western Michigan University Western Michigan University ScholarWorks at WMU ScholarWorks at WMU Master's Theses Graduate College 12-1991 The Effects of Two Types of Hypnotic Suggestions on Analgesic The Effects of Two Types of Hypnotic Suggestions on Analgesic Responding in Moderately Hypnotizable Subjects Responding in Moderately Hypnotizable Subjects Gloria M. Haddad Follow this and additional works at: https://scholarworks.wmich.edu/masters_theses Part of the Psychoanalysis and Psychotherapy Commons Recommended Citation Recommended Citation Haddad, Gloria M., "The Effects of Two Types of Hypnotic Suggestions on Analgesic Responding in Moderately Hypnotizable Subjects" (1991). Master's Theses. 962. https://scholarworks.wmich.edu/masters_theses/962 This Masters Thesis-Open Access is brought to you for free and open access by the Graduate College at ScholarWorks at WMU. It has been accepted for inclusion in Master's Theses by an authorized administrator of ScholarWorks at WMU. For more information, please contact [email protected].
Transcript of The Effects of Two Types of Hypnotic Suggestions on ...

Western Michigan University Western Michigan University
ScholarWorks at WMU ScholarWorks at WMU
Master's Theses Graduate College
12-1991
The Effects of Two Types of Hypnotic Suggestions on Analgesic The Effects of Two Types of Hypnotic Suggestions on Analgesic
Responding in Moderately Hypnotizable Subjects Responding in Moderately Hypnotizable Subjects
Gloria M. Haddad
Follow this and additional works at: https://scholarworks.wmich.edu/masters_theses
Part of the Psychoanalysis and Psychotherapy Commons
Recommended Citation Recommended Citation Haddad, Gloria M., "The Effects of Two Types of Hypnotic Suggestions on Analgesic Responding in Moderately Hypnotizable Subjects" (1991). Master's Theses. 962. https://scholarworks.wmich.edu/masters_theses/962
This Masters Thesis-Open Access is brought to you for free and open access by the Graduate College at ScholarWorks at WMU. It has been accepted for inclusion in Master's Theses by an authorized administrator of ScholarWorks at WMU. For more information, please contact [email protected].

THE EFFECTS OF TWO TYPES OF HYPNOTIC SUGGESTIONS ON ANALGESIC RESPONDING IN MODERATELY
HYPNOTIZABLE SUBJECTS
by
Gloria M. Haddad
A Thesis Submitted to the
Faculty of The Graduate College in partial fulfillment of the
requirements for the Degree of Master of Arts
Department of Psychology
Western Michigan University Kalamazoo, Michigan
December 1991
Reproduced with permission of the copyright owner. Further reproduction prohibited without permission.

THE EFFECTS OF TWO TYPES OF HYPNOTIC SUGGESTIONS ON ANALGESIC RESPONDING IN MODERATELY
HYPNOTIZABLE SUBJECTS
Gloria M. Haddad, M.A.
Western Michigan University, 1991
This study assessed the effects of two hypnotic suggestions on hypnotic
performance in medium hypnotizable subjects. Subjects were exposed at separate
intervals to either an hypnotic suggestion patter containing specific imagery or
alternatively to a suggestion patter that provided only general problem-solving
direction. Hypnotic performance was assessed using tolerance and threshold measures
on a cold-pressor test.
The problem-solving suggestions were shown to increase both threshhold and
tolerance of noxious stimulation. The imagery suggestions proved to be effective only
for the threshhold measure.
These findings are discussed in terms of their implications for the use of
hypnosis with subjects who do not show high hypnotizability when traditional hypnotic
suggestions are used. In addition, implications for the classification of subjects along
hypnotizability dimensions are discussed. Further research is recommended to clarify
the impact of these experimental conditions on low hypnotizable subjects. Information
gathered from this study may contribute to the development of more effective hypnotic
suggestions for use with moderately hypnotizable individuals in clinical settings.
Reproduced with permission of the copyright owner. Further reproduction prohibited without permission.

ACKNOWLEDGEMENTS
I would like to extend my sincere thanks to those who have assisted me
throughout this project, especially Dr. C. Richard Tsegaye-Spates. I would also like to
thank, Lisa Largo, Amy Ryzenga, Carman Stark, and Dale Taggett. In addition, I
thank my parents for their encouragement and support.
Gloria M. Haddad
ii
Reproduced with permission of the copyright owner. Further reproduction prohibited without permission.

INFORMATION TO USERS
This manuscript has been reproduced from the microfilm master. UMI films the text directly from the original or copy submitted. Thus, some thesis and dissertation copies are in typewriter face, while others may be from any type of computer printer.
The quality of this reproduction is dependent upon the quality of the copy submitted. Broken or indistinct print, colored or poor quality illustrations and photographs, print bleedthrough, substandard margins, and improper alignment can adversely affect reproduction.
In the unlikely event that the author did not send U M I a complete manuscript and there are missing pages, these will be noted. Also, if unauthorized copyright material had to be removed, a note will indicate the deletion.
Oversize materials (e.g., maps, drawings, charts) are reproduced by sectioning the original, beginning at the upper left-hand corner and continuing from left to right in equal sections with small overlaps. Each original is also photographed in one exposure and is included in reduced form at the back of the book.
Photographs included in the original manuscript have been reproduced xerographically in this copy. Higher quality 6" x 9" black and white photographic prints are available for any photographs or illustrations appearing in this copy for an additional charge. Contact UMI directly to order.
University Microfilms International A Bell & Howell Information C om pany
3 0 0 North Z eeb Road. Ann Arbor. Ml 4 8 1 0 6 -1 3 4 6 USA 3 1 3 /7 6 1 -4 7 0 0 8 0 0 /5 2 1 -0 6 0 0
Reproduced with permission of the copyright owner. Further reproduction prohibited without permission.

Reproduced with permission of the copyright owner. Further reproduction prohibited without permission.

Order Num ber 1S4705S
The effects of two types o f hypnotic suggestions on analgesic responding in m oderately hypnotizable subjects
Haddad, Gloria M., M.A.
Western Michigan University, 1991
U MI300 N. Zeeb Rd.Ann Arbor, MI 48106
Reproduced with permission of the copyright owner. Further reproduction prohibited without permission.

Reproduced with permission of the copyright owner. Further reproduction prohibited without permission.

TABLE OF CONTENTS
ACKNOWLEDGEMENTS................................................................................. ii
LIST OF TABLES.............................................................................................. v
LIST OF FIGURES........................................................................................... vii
CHAPTER
I. INTRODUCTION.............................................................................. 1
Review of the Literature.............................................................. 1
Focus of Study........................................................................... 13
II. METHOD........................................................................................... 14
Subjects.................................................................................... 14
Setting........................................................................................ 14
Materials...................................................................................... 15
Design........................................................................................ 15
Procedures.................................................................................. 16
III. RESULTS.......................................................................................... 20
Preliminary Analyses.................................................................. 20
Visual Inspection of the Data................................................ 21
Statistical Analysis...................................................................... 43
Within Group Analysis............................................................... 44
Summary.................................................................................... 51
IV. DISCUSSION................................................................................... 56
APPENDICES
A. Criteria for Participation Form........................................................... 64
B. Conversation Topics for Control Subjects......................................... 66
iii
Reproduced with permission of the copyright owner. Further reproduction prohibited without permission.
Table of Contents—Continued
APPENDICES
C. Subject Recruitment Form................................................................... 68
D. Informed Consent for Participation in an Investigation...................... 71
E. Instructions for Observers.................................................................. 74
F. Data Recording Form.................................................................. 77
D. Approval Letter From the Human SubjectsInstitutional Review Board................................................................ 79
BIBLIOGRAPHY............................................................................................ 81
iv
Reproduced with permission of the copyright owner. Further reproduction prohibited without permission.

LIST OF TABLES
1. Overall 2-Factor Repeated Measures Analysis of Variancefor Threshold............................................................................................... 43
2. Overall 2-Factor Repeated Measures Analysis of Variancefor Tolerance............................................................................................... 44
3. Control Group Repeated Measures Analysis of Variancefor Threshold............................................................................................... 45
4. Imagery Group Repeated Measures Analysis of Variancefor Threshold............................................................................................... 45
5. Problem-Solving Group Repeated Measures Analysisof Variance for Threshold............................................................................ 46
6. Control Group Repeated Measures Analysis of Variancefor Tolerance............................................................................................. 46
7. Imagery Group Repeated Measures Analysis of Variancefor Tolerance........................................................................................... 47
8. Problem-Solving Group Repeated Measures Analysis ofVariance for Tolerance............................................................................. 47
9. Control Group Means by Phases for Phases 1 Through 4for Threshold............................................................................................ 48
10. Control Group Simple Effects Comparison BetweenPhases for Threshold............................................................................... 48
11. Imagery Group Simple Effects Comparison BetweenPhases for Threshold............................................................................... 49
12. Problem-Solving Group 1-Factor Repeated Measures Analysis of Variance Comparison Between Phases for Threshold............................. 49
13. Problem-Solving Group 1-Factor Repeated Measure Analysis ofVariance Comparison Between Phases for Tolerance........................... 52
14. Imagery Group Means by Phases for Phases 1 Through 4for Threshold............................................................................................ 52
15. Problem-Solving Group 1-Factor Repeated Measure Analysis of Variance for Phases 1 Through 4 for Threshold.............................. 53
v
Reproduced with permission of the copyright owner. Further reproduction prohibited without permission.

List of Tables—Continued
16. Control Group 1-Factor Repeated Measures Analysis ofVariance for Phases 1 through 4 f or Tolerance........................................ 53
17. Control Group 1-Factor Repeated Measures Analysis of Variance Comparison Between Phases for Tolerance..................................... 53
18. Imagery Group 1 -Factor Repeated Measure Analysis ofVariance for Phases 1 Through 4 for Tolerance....................................... 54
19. Imagery Group 1 -Factor Repeated Measure Analysis ofVariance Comparison Between Phases for Tolerance........................ 54
20. Problem-Solving Group 1-Factor Repeated Measure Analysis ofVariance for Phases 1 Through 4 for tolerance........................................ 55
vi
Reproduced with permission of the copyright owner. Further reproduction prohibited without permission.

LIST OF FIGURES
1. Summary of Data for All Subjects (Duration by Phase)........................... 22
2. Summary of Data for All Subjects in Control Group(Duration by Phase)................................................................................ 24
3. Summary of Data for Subjects in Problem-Solving Condition................. 25
4. Overall Summary of Data for Subjects in Imagery Group Condition(Duration by Phase)................................................................................ 27
5. Threshold and Tolerance Data for Subject #4 (Control)........................... 30
6. Threshold and Tolerance Data for Subject #6 (Control)........................... 31
7. Threshold and Tolerance Data for Subject #9 (Control)........................... 32
8. Threshold and Tolerance Data for Subject #12 (Control)................... 33
9. Threshold and Tolerance Data for Subject #1 (Problem-Solving) 34
10. Threshold and Tolerance Data for Subject #3 (Problem-Solving) 35
11. Threshold and Tolerance Data for Subject #7 (Problem-Solving) 36
12. Threshold and Tolerance Data for Subject #10 (Problem-Solving) 37
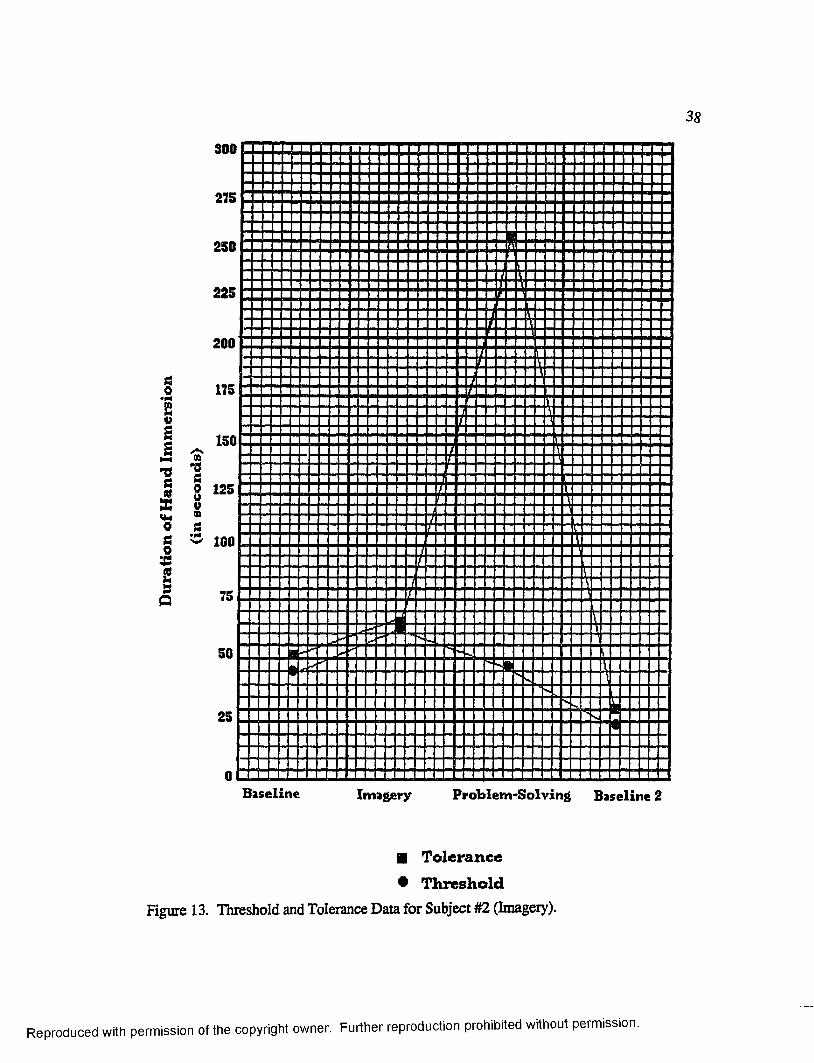
13. Threshold and Tolerance Data for Subject #2 (Imagery).......................... 38
14. Threshold and Tolerance Data for Subject #5 (Imagery).......................... 39
15. Threshold and Tolerance Data for Subject #8 (Imagery)......................... 40
16. Threshold and Tolerance Data for Subject #11 (Imagery)........................ 41
Reproduced with permission of the copyright owner. Further reproduction prohibited without permission.

CHAPTER I
INTRODUCTION
Review of the Literature
Hypnotic induction can be defined as a behavioral process whereby a listener is
conditioned to respond in a somewhat precise and extreme fashion to the verbal
stimulation of the speaker (Skinner, 1957) sometimes leading to stable and lasting
performance after the formal induction ceremony has ended. Beyond this, many other
features of the hypnotic process remain controversial or not well studied, i.e., whether
"trance" is necessary to accomplish hypnotic performance or to explain it (Barber,
1979; Spanos & Chaves, 1989); whether many of the test suggestions often found in
the standard hypnotic induction ceremonies are essential (Spanos & Chaves, 1989) or
merely historical artifacts passed down through the ages; whether "depth" of trance has
any bearing on post hypnotic performance (Weitzenhoffer, 1989). Further, the specific
role played by much of the standard induction patter remains to be researched and better
articulated as to whether it is essential.
Evidence suggests that the listener, under proper circumstances, can be
conditioned to respond differentially to a variety of vocal and non-vocal stimulation
arising from the speaker or from the listener's own behavioral and physiological
activity if properly manded (Farthing, Venturino, & Brown, 1984; Spanos, Kennedy,
& Gwynn, 1984; Spanos, Radtke-Bodorik, Ferguson, & Jones, 1979). Clues about
the nature of these "proper circumstances" can be derived from experimental and
1
Reproduced with permission of the copyright owner. Further reproduction prohibited without permission.

2
descriptive research on hypnotic performance. First, however, it is important to
distinguish between the listener's behavior during that phase typically referred to as the
hypnotic induction or "ceremony" and the listener's (hypnotically relevant) behavior
during the post-induction phase.
For hypnotically naive subjects, the evidence suggests that the listener's
behavior during the induction ceremony proper is comprised of arbitrary responses
evoked directly by the verbal stimulation of the speaker in a process designed to
establish strong control of the listener’s performance by the speaker (Skinner, 1957).
The arbitrary nature of these early responses is suggested by the great variation in
response requirements associated with the various types of induction ceremonies. The
common characteristics of the responses evoked are that they (a) have little to no
practical utility, (b) can be initiated and terminated within the ceremony proper, (c)
often require visible motoric movements by the listener (facilitating operator knowledge
of whether compliance has occurred), and (d) can be included as part of a single
induction ceremony (therefore practice in operator-induced control of the listener can be
accomplished). In addition, it is often the case that responses are evoked which
comprise activity across multiple sense organs and system, i.e., behavioral activity
involving both receptors and effectors are evoked, respondents as well as operants are
elicited, and visual, auditory, cognitive, motoric, emotional, and olfactory response
systems are utilized during the induction ceremony and presumably play important roles
in accomplishing suggested performance. Although the significance of this latter
observation has not been thoroughly researched, it is assumed that certain characteristic
hypnotic reactions owe to the evocation of behavioral activity across these multiple
response channels and at least may play a role in convincing some subjects and
operators of the extensiveness of the range of hypnotic control.
Reproduced with permission of the copyright owner. Further reproduction prohibited without permission.

3
That control by the speaker is the primary aim in utilizing these arbitrary
responses in the early phase is further indicated insofar as no further use is made of the
topographies thus generated, yet a great deal is made of the fact that the subject
responds at all. In fact, it is on the basis of the subject’s tendency to respond during
this phase that conclusions are drawn regarding the listener's hypnotizability.
The scientific and clinical literature in the field suggest that some listeners on
first presentation respond more readily to the speaker's verbal stimulation than others,
i.e., are more hypnotizable (Barber, 1979; E. R. Hilgard, 1965; J. R. Hilgard, 1977).
Further, it is clear that even though a listener responds to the speaker's verbal
stimulation, what is most important during the induction phase is that such responding
occurs in direct reaction to the speaker's stimulation, i.e., under control of the
speaker's verbal behavior (Spanos & Chaves, 1989; Weitzenhoffer, 1989). That is to
say, if the subject merely complies, but does not do so in a manner indicative of point-
to-point correspondence with the speaker's stimulation or themes arising out of such
stimulation, then control has not been established and the listener is said to be at best in
a light trance or to be only low to moderately hypnotizable. Those listeners responding
with clear indications of correspondence with the speaker's stimulation, are said to
achieve a "deep trance" and referred to as highly hypnotizable.
It can be provisionally concluded that the early phase of hypnotic induction is
designed to achieve functional control of a listener’s behavior by the speaker's verbal
stimulation. The manner in which such control is established (or which hypnotic
induction technique is used) is less important than the fact that such control occurs
before hypnosis can be said to have been induced. Thus there exists a large variety of
induction ceremonies all seeking to establish this type of listener-speaker relationship.
Some are highly standardized with explicit assessment procedures "built in" (e.g., The
Reproduced with permission of the copyright owner. Further reproduction prohibited without permission.

4
Harvard Group Scale of Hypnotic Susceptibility, Form A, Shor & Qme, 1962; The
Stanford Scale of Hypnotic Susceptibility, Forms A & B, Weitzenhoffer & Hilgard,
1959). Others are tailored to a specific listener within a broad framework that is
assumed to comprise an hypnotic induction (e.g., The Creative Imagination Scale,
Barber & Wilson, 1979). Some are brief, taking just 15-20 minutes (e.g., The
Hypnotic Induction Scale, Spiegel & Spiegel, 1978; The Stanford Hypnotic Clinical
Scale, Morgan & Hilgard, 1978-1979). Others require more time, sometimes 60-90
minutes (e.g., The Stanford Scale of Hypnotic Susceptibility, Form C, Weitzenhoffer
& Hilgard, 1962).
Given the characteristic situation under which hypnosis is employed
experimentally and clinically, typical induction ceremonies have evolved with several
additional features as standard accompaniments. While the utility of each component
included has not always been experimentally investigated, several features that appear
across a large number of different types of induction ceremonies have received limited
empirical support. These include the listener being stimulated to relax (Mitchell &
Lundy, 1986); providing the listener with favorable information about hypnosis in a
pre-induction discourse (Bates & Brigham, 1990; Spanos et al., 1983; Spanos,
Robertson, Menary, & Brett, 1986); the listener being given verbal stimulation to sleep
(Barber & De Moor, 1972); defining the situation as hypnosis (Barber & De Moor,
1972; Spanos, Kennedy, & Gwynn, 1984); and strongly soliciting cooperation from
the listener (Barber & De Moor, 1972; Spanos et al., 1979). This evidence arises from
the research of Clark Hull (1933), Theodore Barber (1979) and others who have taken
an empirical stance regarding much that has historically been regarded as the mystique
of hypnosis.
Reproduced with permission of the copyright owner. Further reproduction prohibited without permission.

5
In addition to the above referenced features of the verbal stimulation supplied by
the speaker in the induction ceremony, several characteristics of the behavior of highly
hypnotizable listeners also have been identified. These characteristics refer to the
hypnotically-relevant repertoires these subjects seem to bring to the induction
ceremony. In behavioral terms these are repertoires for which the specific listener's
natural environment has provided reinforcement, and that are therefore evoked with
considerable facility. They are utilized during the induction ceremony toward the
principal objective of establishing speaker control. It has been empirically established
that persons bringing strong repertoires of this type to the induction ceremony will
make better subjects (Lynn & Rhue, 1986, 1987; Nash, Lynn, & Givens, 1984;
Spanos, Kennedy, & Gwynn, 1984; Wilson & Barber, 1981). They respond more
readily to the speaker's verbal stimulation and as a consequence, their behavior easily
enters the desired relation with the speaker. Included in such repertoires are (a) the
propensity for spending great amounts of time under the control of private events or
fantasy proneness (Lynn & Rhue, 1986,1987,1988); (b) the tendency to observe and
respond differentially to private events as if they comprised similar events taking place
at a public level or imaginative involvement (Hilgard, 1979); (c) the tendency to behave
with respect to direction from others without particular concern, worry or fear. This
repertoire is called trust and might be established when the verbal community provides
positive reinforcement for behavior consistent with following directions provided by
others (Spanos & Chaves, 1989); and (d) the demonstration of a specialized repertoire
consisting of focusing attention on a single object, event, or activity for prolonged
periods under the control of the given stimulus situation. This repertoire might be
referred to as concentration (Farthing el al., 1984; Spanos, McNeil, Gwynn, & Stam,
1984; Spanos et al., 1979). These individuals also are highly motivated to do well in
Reproduced with permission of the copyright owner. Further reproduction prohibited without permission.

6
the hypnotic situation, an orientation that is systematically established as a function of
the speaker's preparatory remarks prior to the induction proper (Spanos & Chaves,
1989). One important part of the speaker's preparatory remarks strongly solicits the
subject's cooperation with the hypnotic process and no doubt has a direct influence on
the subject's motivation in this respect (Spanos, Brett, Menary, & Cross, 1987;
Spanos, Cross, Menary, Brett & De Groh, 1987). In all instances of the above
referenced repertoires the role played by the listener's natural environment is clear.
Except for the subject's natural environment having already strengthened any given
repertoire, the mere instruction to activate it, whether provided by the operator or the
subject (as in self-hypnosis) is unlikely to be effective. When these repertoires are
strong and available, the evidence suggests that a subject can easily be hypnotized
through the special arrangement of suggestions known as the induction ceremony.
When these repertoires are weak or absent, induction is at best made difficult and is
probably unlikely. These response classes can be assessed independently and prior to
an attempt at induction to determine their relative strength. This is accomplished
through use of special scales called suggestibility or hypnotizability scales. They
consist largely of preparatory remarks and hierarchies of test suggestions which are
monitored by the operator to determine the level of subject responsiveness. These
observations are reduced to quantitative scores indicating how well the subject complied
with and subjectively experienced the operator's suggestions.
In most hypnotic situations, all of the operator and subject activity during the
ceremony is usually oriented toward achieving some designated or agreed upon
performance by the subject after the ceremony has ended. This is universally the case
in the clinical context and most often the case in the experimental context. Both
instances involve the use of post-hypnotic suggestions designed to bring about this
Reproduced with permission of the copyright owner. Further reproduction prohibited without permission.

7
influence on the subject's behavior. This post-hypnotic performance may be called for
immediately after the ceremony, or at a later time, and/or under special circumstances
(Crassilneck & Hall, 1985).
Some investigators have raised the question of whether it is useful to consider
as hypnosis the instances where the above referenced repertoires are very strong and
available to the subject naturally, and where the hypnotist merely instructs the subject to
perform. In Hilgard's terms in such instances "the experience of hypnosis resembles in
a number of respects experiences of everyday life outside hypnosis" (Hilgard, 1970,
p. 45). Hull (1933) commented on the same observation and concluded "the mere
susceptibility to prestige suggestion, no matter in what degree, is not hypnosis” (p.
392). Finally, Barber (Wilson & Barber, 1981) has made similar observations within
the context of a study on highly-hypnotizable subjects. He concluded that these
subjects are fully capable of submitting to ostensibly extreme control by the hypnotist,
and as well, can demonstrate self-induced hypnotic-like performance of an extreme
degree. He documented positive and negative hallucinations, pain tolerance, and
numerous other hypnotic-like performances by these subjects. He concluded that the
contribution of the hypnotic ceremony in these instances is very minor and consists
only in giving subjects an opportunity to "do for us what they can do independently of
us in their daily lives" (p. 143). The fine line between making use of a subject's
already strongly conditioned repertoires to demonstrate operator control, and using the
hypnotic induction ceremony to strengthen such repertoires under conditions where
they are relatively weak or even non-existent has been the target of much research in
recent years. This line of research has concerned the modification of hypnotizability in
otherwise low hypnotizable subjects (Spanos, Kennedy, & Gwynn, 1984; Spanos,
McNeil, Gwynn, & Stam, 1984; Spanos et al., 1979,1983, 1986).
Reproduced with permission of the copyright owner. Further reproduction prohibited without permission.

8
The standard protocol entails first assessing hypnotizability, using one of the
afore-referenced scales to determine status (i.e., low, high, or moderate). Selected
variables, believed to directly influence hypnotizability, are then isolated and the
subjects are introduced experimentally to this variable in order to maximize hypnotic
performance. A control group of similarly low hypnotizables is exposed to an
innocuous procedure (not containing elements of the experimental variable thought to
influence hypnotizability) of the same duration and interpersonal structure as the
experimental group. Subject performance is monitored before the experimental and
control procedures on a laboratory task selected because it lends itself to direct
observation and quantitative measurement and not simply subject report of private
events. This pre-test usually reveals only low level performance for both the
experimental and control subjects. The experimental procedure is then introduced to the
experimental group and the control procedure is introduced to the control group. Their
performance is again monitored using the laboratory task and scored in a post-test
phase. The pre-test and post-test phases often consist of a single trial and the
differences between scores (often consisting of subject ratings of one kind or another)
at these points are used to assess the significance of experimental effects.
Exemplary of the experimental procedure outlined above is work by Nicholas
Spanos and colleagues. Using this procedure Spanos (e.g., Spanos, Barber, & Lang,
1974; Spanos et al., 1979) has demonstrated that when subjects are given suggestions
for analgesia they invariably report a reduction of pain. This appears consistent in both
hypnotic and non-hypnotic cases. It has been found (Spanos, Kennedy, & Gwynn,
1984) that this relationship between hypnotic susceptibility and analgesia appears to be
influenced by the “attitudes and expectancies” (p. 285) of subjects when engaged in a
situation associated with hypnosis.
Reproduced with permission of the copyright owner. Further reproduction prohibited without permission.

9
In one study (Spanos, Kennedy, & Gwynn, 1984) the Carleton University
Responsiveness to Suggestion Scale (i.e, CURSS; Spanos et al., 1983) was
administered to seventy-five undergraduate subjects who were then assigned to groups
of low, medium, or high hypnotizables based upon the scores received on this scale.
Within these three susceptibility levels, subjects were randomly assigned to one of three
experimental conditions: (1) a hypnosis-plus-instruction treatment where they were
given a ten minute induction ceremony and analgesia instructions which asked them to
"do whatever you can to reduce pain" (p. 288); (2) an instructions-alone treatment
which was the same as that administered to the first group, except that no reference was
made to hypnosis; and (3) a group (the control group) who did not receive any
intervention or suggestions.
For all subjects, pre-test data were obtained by exposing them to a cold-pressor
apparatus and asking them to report on a scale of zero (no pain) to twenty (the most
intense pain ever experienced) the amount of pain felt. They were asked to report this
twice, once at thirty seconds and again at sixty seconds, just prior to removal of the
hand from the water. Subjects were again tested after the experimental intervention in
the same manner. After both trials were completed, subjects were asked to complete
two questionnaires. One questionnaire asked for a subjective report of the amount of
time spent thinking about the pain and the aversive aspects of the situation prior to the
hand immersion; the other asked for a subjective report of the amount of time
preceding the immersion that was spent thinking about events inconsistent with the
pain.
It was found that in the hypnosis-plus-instructions group the amount of pain
reduction reported was related to the subjects' pre-session level of hypnotizability.
That is, the high-hypnotizable subjects reported higher levels of pain reduction than the
Reproduced with permission of the copyright owner. Further reproduction prohibited without permission.

10
low-hypnotizable subjects. In the instructions-alone condition, no difference was
found between amount of pain reported and hypnotizability. The high-hypnotizable
subjects receiving the hypnotic treatment did not differ from any of the other groups
(high, medium, or low hypnotizables) in the amount of pain reduction reported. The
low susceptible subjects who were given the instructions alone treatment reported larger
amounts of pain reduction than equally susceptible subjects given hypnosis-plus-
instructions. Thus it was concluded that "there was no significant relationship between
susceptibility level and degree of pain reduction" (p. 291). Low-hypnotizable subjects
who are able to divert attention during the aversive situation reported pain reductions to
the same degree as the high hypnotizable subjects who were given a specific analgesia
suggestion. These findings contradict earlier reports (e.g., Hilgard, 1977) that low
hypnotizable subjects are unable to reduce pain to the same degree as high hypnotizable
subjects. Spanos and colleagues speculated that defining a situation as "hypnosis"
clearly affects the amount of pain reported.
In another study (Spanos, McNeil, Gwynn, & Stam, 1984) eighty-four
undergraduates, high and low in hypnotizability (as indicated by the CURSS:0), were
tested on a cold-pressor task. Within each of the susceptibility levels, the subjects were
randomly assigned to one of three treatment conditions with equal numbers of high and
low hypnotizables in each group. One group was instructed to employ a distraction
task; the second group was asked to imagine that their hand felt "like a piece of rubber"
(p. 279); and the third group, who served as control subjects, received no special
directives. The subjects were all instructed to report the amount of pain felt (on a scale
from 0 to 20) every fifteen seconds that the hand was in the cold water. Pre-test and
post-test trials were administered for each subject. After each immersion subjects
responded to two questionnaires intended to yield a "coping score."
Reproduced with permission of the copyright owner. Further reproduction prohibited without permission.

11
The results indicated that in the group given the suggestion to imagine the hand
as a "piece of rubber" the high-hypnotizable subjects showed reduced pain ratings; the
low-hypnotizable subjects did not report reduced pain. The low susceptible subjects
given a distraction task reported reduced pain perception to a degree similar to the high
hypnotizable subjects who were given the analgesia suggestions. Thus, it was
concluded that the low hypnotizable subjects are as proficient as high hypnotizable
subjects in reducing pain when "encouraged to employ the cognitive strategies that
resonate with their abilities" (p. 282), supporting the social-cognitive view that low and
high hypnotizable subjects differ not in their ability to "dissociate" the pain (as
proposed by Hilgard & Hilgard, e.g., 1975), but in their tendency to employ skills that
have previously been successful in reducing pain. These results indicate that given
"permission" to employ the relevant repertoires, the low-hypnotizable subjects report as
much of a reduction in pain as high-hypnotizable subjects (p. 278).
This latter study is significant insomuch as it raises the question of how
hypnotizability is assessed. Standard hypnotizability scales rely heavily on suggestions
that are rich in imagery-based verbal stimulation. The findings from this study call into
question the utility of this approach in assessing hypnotizability. Subjects without a
strongly established imagery-based repertoire might well score low on such scales, but
can clearly demonstrate hypnotic performance. Future research in this area should
attempt to determine if low or moderate hypnotizable subjects are merely those who do
not bring a strong imagery repertoire to the hypnotic situation, but who are still
responsive when the situation is recast, via suggestion, into one that calls forth more of
a problem-solving or other alternative strategy to assist performance. Additionally,
future research should seek to examine the relationship between pre-established
hypnotically relevant repertoires and hypnotizability. For these purposes
Reproduced with permission of the copyright owner. Further reproduction prohibited without permission.

12
hypnotizability should be assessed using well formulated test suggestions, i.e
.susceptibility scales, that place equal emphasis on pre-established capacity to respond
to verbal stimuli that instruct the subject to make use of visual imagery, distraction from
an ongoing task and problem-solving abilities.
In a more recent study (Spanos, Perlini, & Robertson, 1989) the relationship
between hypnotic suggestions, non-hypnotic suggestions, and placebo effects was
examined with experimental (ischemic) pain reduction. Undergraduate subjects were
administered the CURSS and degree of hypnotizability was assessed. A total of
ninety-six subjects, high and low in hypnotizability were selected and randomly
assigned to one of three treatment conditions: a baseline/hypnosis/placebo condition; a
baseline/placebo/hypnosis condition; or a no treatment/control condition. In the first
two situations, baseline data were obtained and subjects were then exposed to a five
minute induction procedure followed by a forty-five second analgesia suggestion that
instructed them that their hand was "becoming numb, dull, and insensitive and felt like
it had been placed in a thick glove" (p. 287). Following this exposure to pain, and
prior to the re-administration of another trial, the subjects were asked to rate the degreetto which they felt the hypnotic treatment would be effective. The groups were then
given a placebo "anesthetic" composed of colored water and ethyl alcohol. They were
again asked to report the degree to which they expected this treatment to be effective.
The only difference between groups one and two was the order in which the procedures
were administered.
It was found that the high hypnotizable subjects reported a larger amount of
pain reduction in the hypnotic trial compared to the placebo trial. The low hypnotizable
subjects, on the other hand, showed no difference between hypnotic analgesia and
placebo. Further, their scores on the expectation measure showed that "expectations"
Reproduced with permission of the copyright owner. Further reproduction prohibited without permission.

13
have a significant effect in "suggestion-induced" pain reduction (p. 288). In a related
experiment within this same study, the results were replicated. However, in this case,
subjects who reported a reduction of pain engaged in "cognitive coping and less
catastrophizing" (p. 285) than those who did not report such a decrement in pain
perception.
The work by Spanos and colleagues described above is empirically based and
framed in a social psychological context. However, because of reliance on
intrapersonal variables, such as "expectancies," "cognitive attributes," and "attitudes,"
it is felt that the general theoretical posture is weakened. An explanation that relies
more heavily on manipulable variables in the current environment, or which points to
such variables in the past history of the subject is more desirable. Such an analysis
would also clarify the limits of the hypnotic ceremony in its capacity for conditioning,
i.e. shaping, hypnotically relevant repertoires when they are weak or absent.
Focus of Study
The analysis presented here offers a view of hypnotic performance based upon
a radical behavioral conceptual framework. According to that framework hypnosis
might best be understood in terms of the effects of a speaker on a listener and as such
the interactional framework offered by Spanos and colleagues holds great promise in
assisting such an analysis. By examining the effects of two types of hypnotic
suggestions, both designed to enhance hypnotic performance in moderately
hypnotizable subjects, the present investigation sought to clarify the role of traditional
and non-traditional hypnotic suggestions on cold-pressor performance when such
suggestions were superimposed upon a stable performance baseline.
Reproduced with permission of the copyright owner. Further reproduction prohibited without permission.

CHAPTER n
METHOD
Subjects
Subjects were recruited for participation from Western Michigan University
undergraduate psychology courses. Twelve subjects were selected and screened from a
pool of qualified participants, all of whom scored in the medium nypnotizability range
(based on The Harvard Group Scale of Hypnotic Susceptibility, Form A, Shor & Orne,
1962). Subjects included only females, eighteen to twenty-six years of age who
volunteered for participation in the study. All subjects received course credit for their
full participation. Subjects who had any previous contact with hypnosis or who were
presently receiving psychotherapy of any kind were excluded from the study.
Setting
The research setting was the Psychology Clinic located in Wood Hall at
Western Michigan University. The room used was furnished with a large easy chair in
which the subject sat with her back to a one-way mirror. The principal experimenter sat
behind the subject as the hypnotic suggestions were administered. The lighting
consisted of standard fluorescent lighting, and the sound was attenuated appropriate to
a standard therapy room. There were one to two observers present during all sessions
to collect reliability, tolerance and/or threshold data. The observers sat behind two way
mirrors during data collection.
14
Reproduced with permission of the copyright owner. Further reproduction prohibited without permission.

Materials
The materials used in this study included a cold-pressor apparatus which
consisted of a cubical shaped Styrofoam tank measuring 35 cm. x 35 cm. x 37 cm.
used to hold ice and water. The water was maintained between zero and two degrees
Celsius and was circulated after each immersion. The amount of time that a subject
maintained her hand in the water was measured by a hand-held stopwatch (adapted
from Spanos, Kennedy, & Gwynn, 1984). A separate stopwatch was used to
measure the amount of time that a subject maintained her hand in the cold water prior to
reporting any subjective discomfort
Design
The design employed was an ABCA "crossover" design that allowed for
between group experimental comparisons in addition to each subject serving as her own
control. A "free operant" level of cold-pressor performance was obtained for each
subject over six trials of hand immersion, following which each experimental subject
was exposed to a common hypnotic induction, followed by one of two hypnotic
suggestions designed to enhance cold-pressor performance. After experimental phase
one, each subject was exposed to the alternate experimental manipulation (type of
hypnotic suggestion), followed by a return to baseline condition. The hypnotic
suggestions being tested were administered just prior to each immersion. The control
group was instructed to immerse their hands in ice water across four phases and for the
same number of trials within each phase as the experimental groups. The control group
was not exposed to any hypnotic induction or hypnotic suggestions. As described
below, they were exposed to conversational contact during the comparable period (and
for an equivalent time duration) to that in which hypnotic instructions were provided for
Reproduced with permission of the copyright owner. Further reproduction prohibited without permission.

16
the experimental groups. The independent variable consisted of the type of hypnotic
suggestion administered (i.e., problem-solving vs. imagery-based). The major
dependent variables consisted of two duration measures: (1) tolerance of noxious
stimulation, as measured by the amount of time in seconds the hand was immersed in
cold water, and (2) pain threshold, as measured by the amount of time in seconds after
the hand was in cold water to the point where pain was reported.
Procedures
Subjects were screened and selected for participation based on scores on the
Harvard Group Scale of Hypnotic Susceptibility: A (Shor & Qrne, 1962). Only
subjects whose scores on the Harvard Scale ranged between 4 and 7 were continued
through the screening procedure. Subjects were also screened using the Social
Desirability Scale (Crowne & Marlowe, 1960), and subjects who scored twenty or
greater were excluded. In addition, the Hostility Inventory (Buss & Durkee, 1957)
was used to further screen subjects where subjects who scored three or above on the
"negativity" subscale and six or more on the "suspiciousness" subscale were excluded
from participation in this study. Finally, subjects were excluded from participation if
(a) they had any previous experience with hypnosis; and/or (b) were receiving
counseling services during the course of this study.
The twelve subjects were randomly assigned to three groups of four subjects
each, a control group and two experimental groups. Baseline data were collected for
subjects in all conditions. The following instructions were given: "immerse your hand
in the water for as long as you can" and indicate when "you first feel pain" by signaling
the experimenter with the index finger of the hand not immersed in the water. These
data comprised the threshold measure and were collected by one to two observers
Reproduced with permission of the copyright owner. Further reproduction prohibited without permission.

17
behind the one-way mirror through the use of a standard stopwatch. The total amount
of time that a subject maintained her hand in the ice water comprised the tolerance
measure and these data were also collected by observers behind the one-way mirror
through the use of this same stopwatch.
Alternate hands were employed during successive trials ,and no subject was
allowed to submerge her hand longer than five minutes. There was a three-minute
waiting period between each consecutive right and left hand immersion. These
procedures were repeated in all phases of the study.
Baseline performance was obtained over six trials for all subjects; and once
obtained, the second phase of the study was initiated. In the second phase,
experimental subjects were exposed to the first experimental condition and were
exposed to a hypnotic induction (adapted from The Stanford Scale of Hypnotic
Susceptibility Scale, Form C, Weitzenhoffer & Hilgard, 1962) followed by either a
problem-solving suggestion (adapted from Spanos, Kennedy, & Gwynn, 1984) or an
imagery based suggestion (adapted from Cooke & Van Vogt, 1965; and Evans & Paul,
1970). During phase three, subjects were exposed to the same hypnotic induction but
provided the suggestion not administered during phase two. Specifically, subjects who
were first exposed to the problem-solving suggestion were given the imagery-based
suggestion (following administration of the hypnotic induction), and subjects who were
first exposed to the imagery-based suggestion were given the problem-solving
suggestion (following administration of the hypnotic induction). Subjects in the control
condition did not receive a hypnotic induction but were engaged in conversation with
the experimenter for the same amount of time that subjects in the experimental condition
spent listening to the induction ceremony. Control subjects were administered a
repetition of this "contact" procedure across both of these phases.
Reproduced with permission of the copyright owner. Further reproduction prohibited without permission.

18
A return to baseline phase followed the second experimental phase, where all
subjects received the following instruction: "Immerse your hand in the ice-water for as
long as you can without the use of hypnotic suggestions." The control subjects also
were asked to immerse "your hand in the ice-water for as long as you can"; however,
no reference was made to hypnosis.
For purposes of clarification, note that subject selection was based upon (a) a
HGSHS:A score between four and seven, (b) a Social Desirability Scale score of 19 or
less, and (c) a score of 2 or less on the "negativity" subscale and a score of 5 or less on
the "suspiciousness" subscale in regards to the "Negativity" and "Suspiciousness"
subscales of the Hostility Inventory.
A total of 12 subjects were selected and assigned to one of the following three
conditions:
1. Four subjects were assigned to the control condition in which no induction
patter nor hypnotic suggestions were given. Conversational contact was provided
during phases 2 and 3. In phase 4, subjects were asked to immerse the hand in ice-
water without conversational contact or hypnotic suggestions.
2. Four subjects were assigned to the problem-solving condition first, then
given the imagery-based suggestion in the next phase that involved SHSS + problem
solving suggestion followed in next phase by SHSS + imagery-based suggestion.
Phase 4 consisted of a return to baseline condition where subjects were asked to
immerse the hand in ice-water without hypnotic instructions or suggestions.
3. Four subjects were assigned to the imagery-based condition first, then given
the problem-solving suggestion in the next phase: SHSS + imagery-based suggestion
followed in next phase by SHSS + problem-solving suggestion. Phase 4 consisted of
Reproduced with permission of the copyright owner. Further reproduction prohibited without permission.

19
a return to baseline condition where subjects were asked to immerse the hand in ice-
water without hypnotic instructions or suggestions.
Reproduced with permission of the copyright owner. Further reproduction prohibited without permission.

CHAPTER HI
RESULTS
Preliminary Analyses
Preliminary analyses were conducted to assess for equality of initial
performance between groups. Lateral dominance of participants was analyzed to
determine if subject handedness provided a possible explanation for the findings. In
addition the data were analyzed for effects due to the hand immersed in the water (left /
right position).
These analyses (analysis of variance with repeated measures where lateral
dominance was the between group variable and phases was the repeated measure; and
the same analysis where hand immersion served as the between group variable and
phases as the repeated measure) revealed no main or interaction effects due to lateral
dominance. There was a main effect for hand immersed, however. The right hand
consistently outperformed the left hand irrespective of group assignment or
experimental phase. This was true for both tolerance and threshold. An analysis of
variance for initial baseline performance of subjects across experimental groups on both
tolerance and pain threshold was conducted to evaluate for any initial differences in
performances. The results revealed no significant differences between groups at initial
baseline for either dependent variable.
A final preliminary analysis concerned inter-observer reliability on the
independent variables to assure that experimental conditions were being implemented as
planned and assessment of inter rater agreement on the subjects' performance on the20
Reproduced with permission of the copyright owner. Further reproduction prohibited without permission.

21
dependent variables. Two observers simultaneously and independently rated the
performance (both threshold and tolerance) of subjects across 54% of the trials, evenly
distributed across phases. Recorded times were within one second of each other or
identical in 98.4% of the trials observed. The inter-observer reliability on independent
variable implementation was 100% between the experimenter and an independent
observer. These analyses suggest that any remaining differences were most likely due
to the experimental manipulations arranged by the design of the study.
Visual Inspection of the Data
The results are first graphically displayed with a frequency polygon reflecting
the mean tolerance and threshold data for all subjects' for each phase, first irrespective
of group assignment, and second as a function of group assignment. Visual analyses
can be performed on both dependent variables (threshold and tolerance). Secondly,
each subject's individual data are similarly presented graphically. Third, a two factor
repeated measures analysis of variance was performed on each of the dependent
variables (experimental condition as the between factor and phases as the within factor).
Finally, simple effects analyses were conducted, where appropriate, to permit an
examination of specific effects due either to group assignment and experimental phase.
Figure 1 presents a graphic summary of data for all subjects across phases. In
general, visual comparisons of changes between phase 1 (baseline 1) and phase 2 (the
first experimental phase) revealed an increase in performance on tolerance. Subjects'
performance rose from an average of 48 to 60 seconds of tolerance. This suggest a
marginal effect due to the experimental manipulations. Similarly, visual inspection of
change between phases 2 and 3 revealed a substantial elevation in performance.
Subjects' performance rose from an average of 60 seconds to an average
Reproduced with permission of the copyright owner. Further reproduction prohibited without permission.

22
Go« * d
2V££
TJS4
X0G0
sgs
Q
300
275
250
225
200
175
150/—V
00•VG§ 125«00G
^ 100
75
50
25
-
s✓ s,
/■
V,
1 a~ i
* 1B
- 1
PHASE 1 PHASE 2 PHASE 3 PHASE 4
■ = Tolerance
• “T hreshold
Figure 1. Summary of Data for All Subjects (Duration by Phase).
Reproduced with permission of the copyright owner. Further reproduction prohibited without permission.

23
of 106 seconds of tolerance in phase three. Finally, visual inspection comparing phase
3 and phase 4 (the return to baseline phase) revealed a relative drop in performance.
Subjects' performance decreased from 106 seconds of tolerance in phase 3 to an
average of 37 seconds of tolerance in phase four. These data represent average
performance across 72 trials (12 subjects over 6 trials each) for each comparison.
Observation of the same figures reveals a similar pattern of responses for the
threshold dependent variable for phases one and two (means were 28 and 46 seconds
for each phase respectively); however, during phase three, the relative rise in threshold
is proportionately less than the rise for tolerance (mean rose from 46 to 50 seconds).
This would suggest that for phase three, subjects' report of pain perception was
essentially unchanged by the collective experimental conditions, while overall tolerance
was clearly affected. The threshold variables showed a return to baseline during phase
four (from 50 to 27 seconds).
Figure 2 displays a summary of data for subjects in the control group across
phases. These data reveal that performance is relatively stable across phases. The
average tolerance was 49 seconds, with a range of 41 and 56 seconds. From the same
graph it can be seen that data on the control group revealed stable threshold
performance across phases as well. These data indicate that the average threshold was
36 with a range of 32 to 41 seconds. These subjects who did not receive an hypnotic
intervention and who instead were simply asked to keep their hands in the water for as
long as they could did not evidence a significant decrease or increase in either measure
of response duration over repeated trials.
Figure 3 displays summary data for subjects in the problem-solving condition
(those subjects who received both experimental interventions, but who received the
Reproduced with permission of the copyright owner. Further reproduction prohibited without permission.

Dur
atio
n of
Han
d Im
mer
sion
24
300
275
250
225
200
175
150to
*3A0ovtoa•m
125
100
PHASE 4PHASESPHASE 1 PHASE 2
■ Tolerance
• T hresholdFigure 2. Summary of Data for All Subjects in Control Group (Duration by Phase).
Reproduced with permission of the copyright owner. Further reproduction prohibited without permission.

PHASE 1 PHASE 2 PHASES PHASE 4
■ Tolerance
• T hreshold
Figure 3. Summary of Data for Subjects in Problem-Solving Condition.
Reproduced with permission of the copyright owner. Further reproduction prohibited without permission.

26
problem-solving hypnotic suggestions first in sequence, followed by the imagery-based
condition). It can be seen that between phases one and two, subjects showed an
average change in tolerance of 44 seconds (changing from 25 seconds in baseline to 69
seconds in phase two). In phase three subjects in this group were administered the
imagery-based hypnotic suggestions and they showed a further increase in
performance, moving from 69 seconds of tolerance to 86 seconds on average. Finally,
subjects in this condition demonstrated a return to baseline in that their performance
dropped from an average of 86 seconds in phase three to an average of 34 seconds in
phase four. These data suggest a clear effect due to the experimental manipulations.
The data with respect to threshold follow the pattern described for tolerance with
slightly less absolute values, as can be seen from the same figures. The means for
respective phases on the threshold measure were 19, 65, 82, and 32. In this group,
subjects pain perception seems to have been affected by the experimental conditions in
ways similar to their overall tolerance of noxious stimulation.
Figure 4 displays an overall summary of data for subjects in the imagery-based
group. Subjects in this group received the imagery hypnotic suggestion first, followed
by the problem-solving suggestion. It can be seen that when given the imagery
suggestion in phase two, subjects' performance on tolerance dropped slightly below the
baseline level. Subjects went from 64 seconds of tolerance in baseline to 60 seconds
during phase two. In phase three when subjects received the problem-solving hypnotic
suggestion, performance rose (from 60 seconds) to 192 seconds on average. Finally,
during phase four, these subjects demonstrated a return to baseline by a drop in
performance, from 192 seconds to 33 seconds. These data suggest relatively stable
(although actually a marginal decrease in) performance between phases one and two,
and an appreciable increase in performance during phase three, when the problem-
Reproduced with permission of the copyright owner. Further reproduction prohibited without permission.

PHASE 1 PHASE 2 PHASES PHASE 4
Figure 4.
B Tolerance
• ThresholdOverall Summary of Data for Subjects in Imagery Group Condition (Duration by Phase).
Reproduced with permission of the copyright owner. Further reproduction prohibited without permission.

28
solving hypnotic suggestions were administered. The pattern described above for
tolerance was generally replicated for the threshold-dependent variable (means for
phases one through four, respectively were 23, 33, 33, and 15) with one important
exception. That exception was during phase three (problem-solving suggestion
period), where subjects' report of pain perception did not show a rise which was
proportionate to the rise in tolerance. This suggests that the experimental condition
entailing the problem-solving suggestion did not produce an effect on pain perception
although it did produce an appreciable effect on pain tolerance. This latter finding,
with respect to the desynchrony in the relationship between threshold and tolerance for
subjects in this group during phase three will be highlighted still further by examination
of individual subject data below.
Figures 5 through 16 present graphic displays of data for individual subjects,
grouped according to experimental condition. First, it can be seen that those subjects in
the control group (Figures 5 through 8) showed stable performance across all phases.
The mean performance for each subject (over the six trials within each phase) is
designated on each graph. This pattern of stable performance is true for each subject.
This pattern of response between phases is generally true for both tolerance and
threshold variables.
Figures 9 through 12 presents a display of subjects who received the problem
solving suggestion first. An analysis of individual cases, as was the case for the group
data, also suggested a selective influence of the specific experimental conditions. For
subjects who received the problem-solving suggestion first, 3 out of 4 showed the
greatest change in performance after exposure to the problem-solving intervention in
phase two. During phase three, these subjects showed either (a) slight further
improvement with the additional intervention (imagery suggestions) provided (S# 1,3
Reproduced with permission of the copyright owner. Further reproduction prohibited without permission.

and 7), or (b) actually showed a decrement in performance (S# 10). One subject
showed only a marginal increase from baseline to first exposure to the problem-solving
intervention (S# 7) and greater gains during exposure to the "imagery" condition.
These data would indicate that problem-solving suggestions had an appreciable effect
on both tolerance and threshold performance by subjects who received this intervention
first in sequence. There is further suggestion that the imagery condition either
maintained the gains produced by the earlier intervention with problem-solving
suggestions or actually produced a further rise in performance on both dependent
variables (S# 1, 3, and 7). Only one subject (S# 10) showed a reduction in
performance during the imagery condition when it followed the problem-solving
condition.
Figures 13 through 16 display the data for subjects in the imagery group; those
who received the imagery suggestions first in the sequence of hypnotic suggestions. It
can be seen that after introduction of the imagery suggestions in phase 2, three of the
four subjects in this condition showed at least a marginal rise in performance on both
tolerance and threshold dependent variables. The fourth subject (S# 11) actually
showed an appreciable reduction in performance with respect to tolerance, but not
threshold. More noticeable, however, is the visually significant rise in performance
from phase 2 to phase 3 for subjects in this group. All subjects showed an increase in
performance during the problem-solving suggestion, but three out of four showed
dramatic increases in performance on tolerance, while their report of pain perception
remained relatively stable. All subjects in this group showed a return to baseline during
phase four. The problem-solving suggestions clearly produced an experimental effect
for subjects in this group especially on tolerance.
Reproduced with permission of the copyright owner. Further reproduction prohibited without permission.

30
a.22VS5
*0an
60&or2sQ
300
275
250
225
200
175
150
to1 125 0oVtoss too•X
75
50
25
“ "“ “■“ “ ““ “""■ ““ m m■“ ““
m Dm m“m“ m“" ™mm _ _a,__ - . _ ____ _ . i i z _ mI wt- . I I I z z - - - z Z -
- m- - - - “ “- “““ ““• “_"■““■■■“ “““ “““ m m ““““■"“ “
- - - - - - - - - - - - - - - - - - - - - - - “-"
- - - - - - - - - - - - - - - - - - -31- - - - - - - - - - - - - - - - - - - - “ - - - - - - - - - - - - - - - - - - -
“"- - - - - - - - - - - - - - - - - - - - - - - - - -
"- - ~- - - - - - - - - - - - - -
"-"- - - - - - - - - - - - - - - - - - - - - I - - - - - - - - - - - - - - - - -
“ —“- - - - ~- - ~ - - ~ - - - - - - - - - - - - - - - - ~- - - - - - - - - - - - - - -- - - - - - M- - - - - - - - - - - “- m- - “ - - - - - - - - - - - - - -
- - - - aa - - : : - - - - - - - - - - - - - “- - - - - -- - - - - - - " m- ■- - - - - - - - - - - - - ■n- - “ - - - M- ma- - - - - “- - -
" “ ■■ **— : ■■ : : _ _- - “- “ ■" - “ “"""“ M■—• ■“ “• M“ " “
“ *m— “*" _""■ —_
"" —
- _ n“ m mm“"1""“ "W**“■■ ti* 90
/“—“ ”" “ ' ✓
"" " ft i A ✓“ “" "
— _ __«•_ _ - . ——- - m. - • - - -- - : -
■- - - - - —-
m9mm " *- * • "““■"■ "■ "1_ ■*- - - - B - - - “ “ - “ 1 “ “ - “ - ——- —— — — ——“ —“
"" "“
- - - - - - - - - - - - - - - - - - - - - - - - - - - - - - - - - - - “"- "; : -Baseline No Intervention No Intervention Baseline 2
■ Tolerance
• Threshold
Figure 5. Threshold and Tolerance Data for Subject #4 (Control).
Reproduced with permission of the copyright owner. Further reproduction prohibited without permission.

31
S3o•Navs sN4■oS3«2Eoc0r2sQ
30C
275
250
225
200
175
150coTJS30wv09
S3• P4
125
100
No Intervention No Intervention Baseline 2Baseline
Tolerance
T hreshold
Figure 6. Threshold and Tolerance Data for Subject #6 (Control).
Reproduced with permission of the copyright owner. Further reproduction prohibited without permission.

32
2vagt—ITJfl0s0aoV2sQ
uVOQa
•«4
300
275
250
225
200
175
150
fi° 125
100
75
50
25f r
Baseline No Intervention No Intervention Baseline 2
■ Tolerance
• T hreshold
Figure 7. Threshold and Tolerance Data for Subject #9 (Control).
Reproduced with permission of the copyright owner. Further reproduction prohibited without permission.

33
300
275
250
225
200
sio«NevSsN*
175
150
«4*0fl0r&3Q
2- 100
No Intervention No Intervention Baseline 2Baseline
■ Tolerance
• ThresholdFigure 8. Threshold and Tolerance Data for Subject #12 (Control).
Reproduced with permission of the copyright owner. Further reproduction prohibited without permission.

Baseline Problem -Solving imagery Baseline 2
■ Tolerance
• T hresholdFigure 9. Threshold and Tolerance Data for Subject #1 (Problem-Solving).
Reproduced with permission of the copyright owner. Further reproduction prohibited without permission.

Baseline Problem -Solving Imagery Baseline 2
■ Tolerance
• ThresholdFigure 10. Threshold and Tolerance Data for Subject #3 (Problem-Solving).
Reproduced with permission of the copyright owner. Further reproduction prohibited without permission.

Baseline Problem -Solving Imagery Baseline 2
B Tolerance
• ThresholdFigure 11. Threshold and Tolerance Data for Subject #7 (Problem-Solving).
Reproduced with permission of the copyright owner. Further reproduction prohibited without permission.

Dur
atio
n of
Han
d Im
mer
sion
37
300
275
250
225
200
175
15000 "8g 125o v00£ 100
75
50
25
0Baseline P roblem -Solving Imagery Baseline 2
■ Tolerance• Threshold
Figure 12. Threshold and Tolerance Data for Subject #10 (Problem-Solving).
isJ
I
Reproduced with permission of the copyright owner. Further reproduction prohibited without permission.
38
fSo•n2i>Ss
MX
■sc*SB0
0r2sQ
300
275
250
225
200
175
150(0•9fi0 125yVnS• M
100
75
50
25
r
/ \f
ti \! \
i \f \\j/yi
i( “1
/ I<i/
/\
i \/ |p*d \
'n -■ ■-:i -- • \
V. i
Baseline Imagery Problem -Solving Baseline 2
■ Tolerance
• ThresholdFigure 13. Threshold and Tolerance Data for Subject #2 (Imagery).
Reproduced with permission of the copyright owner. Further reproduction prohibited without permission.

Dur
atio
n of
Hand
Im
mer
sion
300
275
250
225
200
175
150mTJ0 125oV»
» 100
75
50
25
V :
t
I
s
39
Baseline Imagery Problem -Solving Baseline 2
B Tolerance
• Threshold
Figure 14. Threshold and Tolerance Data for Subject #5 (Imagery).
Reproduced with permission of the copyright owner. Further reproduction prohibited without permission.

40
fi0■N2 . SJ! US'TJ 15« sV*0s 0 *r2 s Q
siouvwS•M
300
275
250
225
200
175
150
125
100
75
50
25
Baseline Imagery P roblem -Solving Baseline 2
■ Tolerance • Threshold
Figure 15. Threshold and Tolerance Data for Subject #8 (Imagery).
Reproduced with permission of the copyright owner. Further reproduction prohibited without permission.

Dur
atio
n of
Han
d Im
mer
sion
(in
seco
nds)
41
300
275
250
225
200
175
150
125
100
75
50
25
0Baseline Imagery Problem -Solving Baseline 2
■ Tolerance
• ThresholdFigure 16. Threshold and Tolerance Data for Subject #11 (Imagery).
fth \
- i -ih - ■V
H
-- t - -A-
- 1 -■ ■/hT
'V■ 1
*-•- v - V
- t t " I
- V Ls
•r■ v
ft1i
1
I■ ' 1 l “ ‘ = i -
- h. H
Reproduced with permission of the copyright owner. Further reproduction prohibited without permission.

42
Taken together, these data suggest that the performance of individual subjects
demonstrated an overall effect associated with the experimental manipulations when
compared to the control group. The pattern of effect was the same for both threshold
and tolerance measures, in general. Further, the experimental effects were selective and
for the most part revealed greatest gains in tolerance of noxious stimulation during the
problem-solving suggestions. The problem-solving condition seemed to produce the
greatest change whenever it was introduced (compared to the imagery condition), and
this was especially noticeable in the change between experimental phases (phases two
and three), as compared to change between baseline and phase one. Thus when
problem-solving suggestions followed the imagery suggestion in the crossover, subject
performance uniformly increased to a visually appreciable degree. The increase under
these circumstances was of a magnitude of an order of 3 in most cases. The increase
for the "imagery" group between the first and second experimental phases (between
baseline and imagery exposure) was much smaller on average. This comparatively
smaller increase for the imagery condition was also the case for both threshold and
tolerance between phases two and three. It was further observed that when the
problem-solving suggestion followed the imagery condition, there was a break in the
relationship between threshold and tolerance for the phase in which problem-solving
suggestions were administered. This latter observation suggests that the experimental
manipulation affected tolerance without altering subjects’ pain perception. In most
other phases, report of pain perception closely paralleled that of tolerance in terms of
the basic pattern of performance, though in lesser absolute values.
Reproduced with permission of the copyright owner. Further reproduction prohibited without permission.

Statistical Analysis
Tables 1 and 2 display the results of an overall repeated measures analysis of
variance (for threshhold and tolerance respectively), which partitioned the variance on
dependent variables into one between factor consisting of group assignment, and one
within factor consisting of experimental phases.
The purpose of this analysis was to determine if there was a significant group
by phase interaction, thus permitting a more detailed analysis of the data in such a
manner as to reduce the chances of a Type II error. No main effect for groups was
anticipated since both experimental groups received all treatment conditions.
Table 1 displays the results of this analysis for threshhold. It can be seen that a
significant interaction, F (6, 27) = 3.356, p< 0.013 was found. Also, a main effect for
the repeated measure was found, F (3,27) = 5.646, p< 0.039. This main effect for
phases only suggests that the treatment conditions differed from the control condition or
from each other.
Table 1
Overall 2-Factor Repeated Measures Analysis of Variance for Threshold
Source: df Sum of Squares Mean Square F-test P-value
Experimental Condition (A) 2 4377.04 2188.52 1.15 .3589
Subjects within Groups 9 17117.87 1901.99 N/A N/A
Repeated Measure (B) 3 5108.75 1702.92 5.65 .0039
AB 6 6073.12 1012.19 3.36 .013
B x Subjects within Groups 27 8143.12 301.60 N/A N/A
Reproduced with permission of the copyright owner. Further reproduction prohibited without permission.

44
Table 2 displays the summary table for the comparable analysis on tolerance,
and also identifies significant group by phase interactions, F (6, 27) =5.91, p< 0.005;
as well as a significant main effect for phases, F (6,27) =10.16, p< 0.0001. It can be
seen that no significant main effects were due to group assignment, F (2, 27) = 1.259,
p< 0.3294. These analysis suggested that further examination of the data would reveal
important differences within phases when groups are considered.
Table 2
Overall 2-Factor Repeated Measures Analysis of Variance for Tolerance
Source: df Sum of Squares Mean Square F-test P-value
Experimental Condition (A) 2 13919.54 6959.77 1.26 .3294
Subjects within Groups 9 49735.12 5526.12 N/A N/A
Repeated Measure (B) 3 33086.17 11028.72 10.16 .0001
AB 6 38491.96 6415.33 5.91 .0005
B x Subjects within Groups 27 29309.87 1085.55 N/A N/A
Within Group Analysis
An analysis of variance for each of the experimental groups with the
corresponding simple effects analysis are shown in Tables 3, 4, and 5, for threshold
and 6,7 ,and 8 for tolerance. This basic repeated measures analysis identified within
each group the existence of significant effects due to treatment conditions, i.e., type of
suggestions administered in relation to each other and in relation to the baseline
conditions. No such effects were identified for the control group.
Reproduced with permission of the copyright owner. Further reproduction prohibited without permission.

Table 3
Control Group Repeated Measures Analysisof Variance for Threshold
Source: df Sum of Squares Mean Square F-test P-value
Between Subjects 3 2358.69 786.23 8.00 .0034
Within Subjects 12 1179.25 98.27 N/A N/A
Treatments 3 189.69 63.23 .575 .65
Residual 9 989.56 109.95 N/A N/A
Total 15 3537.94 N/A N/A N/A
Table 4
Imagery Group Repeated Measures Analysis of Variance for Threshold
Source: df Sum of Squares Mean Square F-test P-value
Between Subjects 3 3033.69 1011.23 7.62 .0041
Within Subjects 12 1592.25 132.69 N/A N/A
Treatments 3 860.19 286.73 3.52 .0618
Residual 9 732.06 81.34 N/A N/A
Total 15 4625.94 N/A N/A N/A
Specifically, there was no significant effect for treatments as a within subjects source of
variance for the control group. There was a significant between subjects effect,
however this finding is likely to have resulted from increased variability due to the
small sample size. It has no importance for the meaningful interpretation of treatment
effects (except in general to reduce the likelihood of finding them, which was not the
Reproduced with permission of the copyright owner. Further reproduction prohibited without permission.

46
Table 5
Problem-Solving Group Repeated Measures Analysisof Variance for Threshold
Source: df Sum of Squares Mean Square F-test P-value
Between Subjects 3 11725.50 3908.50 2.833 .0831
Within Subjects 12 16553.50 1379.46 N/A N/A
Treatments 3 10132.00 337.33 4.733 .0301
Residual 9 6421.50 713.50 N/A N/A
Total 15 38279.00 N/A N/A N/A
Table 6
Control Group Repeated Measures Analysis of Variance for Tolerance
Source: df Sum of Squares Mean Square F-test P-value
Between Subjects 3 2002.25 667.42 4.266 .0288
Within Subjects 12 1877.50 156.46 N/A N/A
Treatments 3 548.25 182.75 1.237 .3521
Residual 9 1329.25 147.69 N/A N/A
Total 15 3879.75 N/A N/A N/A
outcome in this instance). This suggests that the exposure to conventional intervention
had no impact on cold pressor performance in the control group (see Tables 3, 9 and
10).
For the subjects in the imagery group, there was only a trend towards
significance (p< 0.061) in the basic repeated measures ANOVA for this group.
Reproduced with permission of the copyright owner. Further reproduction prohibited without permission.

47
Table 7
Imagery Group Repeated Measures Analysis of Variancefor Tolerance
Source: df Sum of Squares Mean Square F-test P-value
Between Subjects 3 36874.69 12291.56 1.79 .2027
Within Subjects 12 82436.25 6869.69 N/A N/A
Treatments 3 61004.69 20334.90 8.539 .0053
Residual 9 21431.56 2381.28 N/A N/A
Total 15 119310.94 N/A N/A N/A
Table 8
Problem-Solving Group Repeated Measures Analysis of Variance for Tolerance
Source: df Sum of Squares Mean Square F-test P-value
Between Subjects 3 10858.19 3619.40 2.62 .0988
Within Subjects 12 16574.25 1381.19 N/A N/A
Treatments 3 10025.19 3341.73 4.59 .0326
Residual 9 6549.06 727.67 N/A N/A
Total 15 27432.44 N/A N/A N/A
Therefore, any subsequent findings of significance which revealed (see Table 11) must
be interpreted cautiously, as they may have resulted from a Type II error. Two such
significant findings emerged from this analysis.
The repeated measures ANOVA on threshold for subjects in the problem
solving group revealed a significant treatment effect F (3, 15) = 4.733 p< 0.03. This
Reproduced with permission of the copyright owner. Further reproduction prohibited without permission.
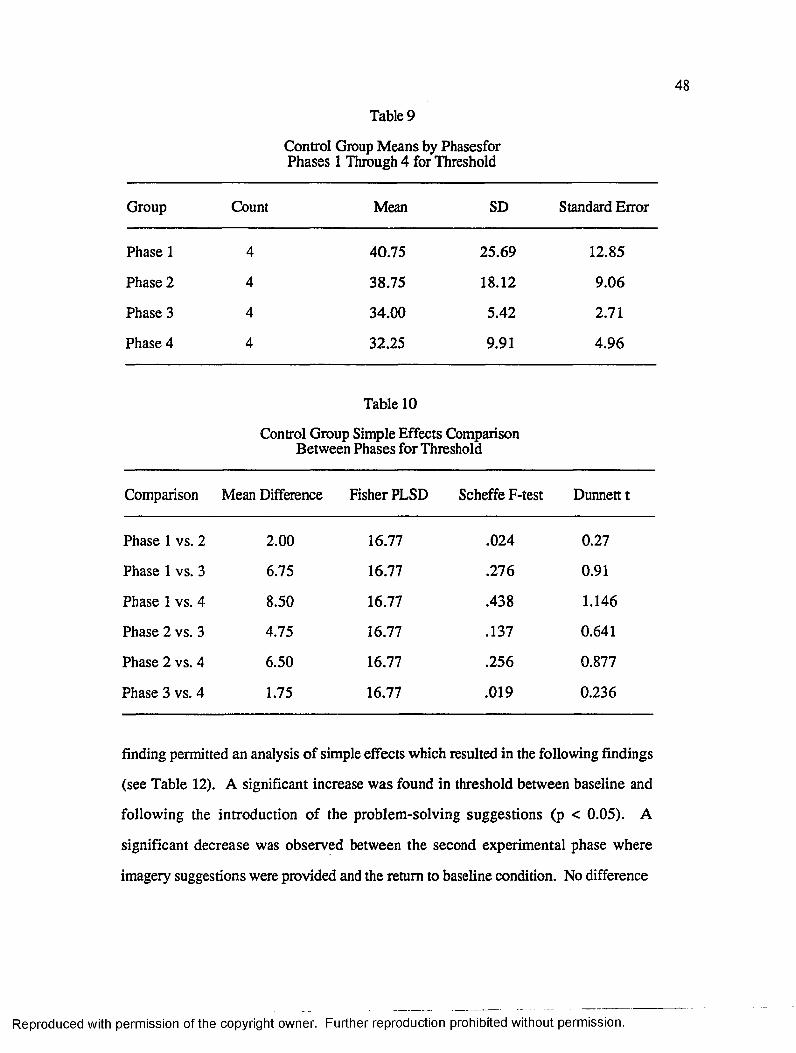
Table 9
Control Group Means by Phasesfor Phases 1 Through 4 for Threshold
Group Count Mean SD Standard Error
Phase 1 4 40.75 25.69 12.85
Phase 2 4 38.75 18.12 9.06
Phase 3 4 34.00 5.42 2.71
Phase 4 4 32.25 9.91 4.96
Table 10
Control Group Simple Effects Comparison Between Phases for Threshold
Comparison Mean Difference Fisher PLSD Scheffe F-test Dunnett t
Phase 1 vs. 2 2.00 16.77 .024 0.27
Phase 1 vs. 3 6.75 16.77 .276 0.91
Phase 1 vs. 4 8.50 16.77 .438 1.146
Phase 2 vs. 3 4.75 16.77 .137 0.641
Phase 2 vs. 4 6.50 16.77 .256 0.877
Phase 3 vs. 4 1.75 16.77 .019 0.236
finding permitted an analysis of simple effects which resulted in the following findings
(see Table 12). A significant increase was found in threshold between baseline and
following the introduction of the problem-solving suggestions (p < 0.05). A
significant decrease was observed between the second experimental phase where
imagery suggestions were provided and the return to baseline condition. No difference
Reproduced with permission of the copyright owner. Further reproduction prohibited without permission.
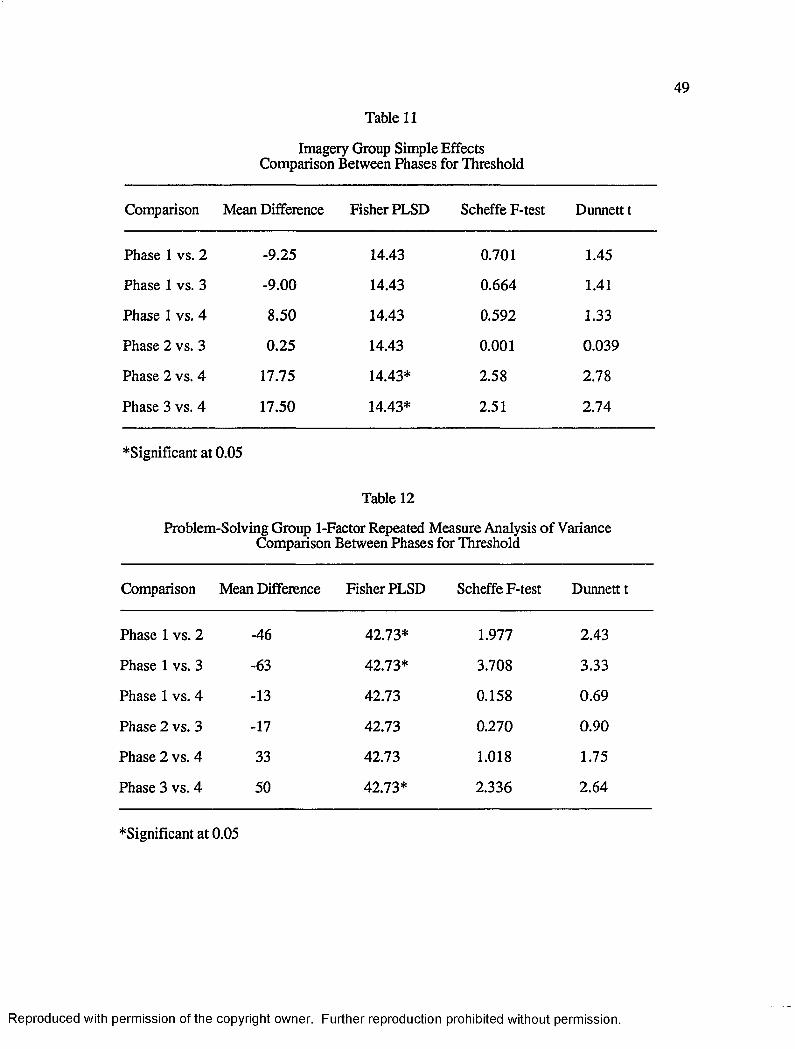
49
Table 11
Imagery Group Simple EffectsComparison Between Phases for Threshold
Comparison Mean Difference Fisher PLSD Scheffe F-test Dunnett t
Phase 1 vs. 2 -9.25 14.43 0.701 1.45
Phase 1 vs. 3 -9.00 14.43 0.664 1.41
Phase 1 vs. 4 8.50 14.43 0.592 1.33
Phase 2 vs. 3 0.25 14.43 0.001 0.039
Phase 2 vs. 4 17.75 14.43* 2.58 2.78
Phase 3 vs. 4 17.50 14.43* 2.51 2.74
♦Significant at 0.05
Table 12
Problem-Solving Group 1-Factor Repeated Measure Analysis of Variance Comparison Between Phases for Threshold
Comparison Mean Difference Fisher PLSD Scheffe F-test Dunnett t
Phase 1 vs. 2 -46 42.73* 1.977 2.43
Phase 1 vs. 3 -63 42.73* 3.708 3.33
Phase 1 vs. 4 -13 42.73 0.158 0.69
Phase 2 vs. 3 -17 42.73 0.270 0.90
Phase 2 vs. 4 33 42.73 1.018 1.75
Phase 3 vs. 4 50 42.73* 2.336 2.64
♦Significant at 0.05
Reproduced with permission of the copyright owner. Further reproduction prohibited without permission.

50
was found between the two experimental phases. Pain perception as measured by the
threshold measure in this analysis was therefore observed to change as a function of the
two types of suggestions administered.
The repeated measures ANOVA on tolerance for subjects within the control
group revealed no significant treatment effect. There was a significant difference
between subjects effect, which as the case for threshold, indicates variability likely due
to the small sample size. Table 6 displays the results of this analysis. This suggests
that the conversational intervention had no effect on tolerance in this group.
The repeated measures ANOVA on tolerance for subjects in the imagery group
revalued a significant treatment effect, but no significant between subjects effect. The
significant treatment effect, F (3,15) = 8.59, p < .0053, suggests that the experimental
conditions produced important differences from baseline conditions or between
themselves. Simple effects analysis revealed further, that the problem-solving
intervention at phase 2 for this group produced a significant increases in tolerance,
although the imagery suggestions at phase 1 did not produce significant differences a
phase 2. It was further revealed that there were no differences between the first and
second baseline conditions. There was a significant difference between phase 2 and 3,
indicating that the problem-solving intervention further tolerance significantly beyond
that produced by the imagery suggestion (which was actually comparable to the
baseline condition). Finally, the data analysis indicates that the subjects demonstrated a
return to baseline condition bat phase 4, in that a significant reduction in tolerance was
revealed.
A similar repeated measures analysis of variance for subjects in the problem
solving group revealed a significant treatment effect, F (3,15)= 4.59, p< .032. Simple
effects analysis demonstrated that both of the experimental interventions produced
Reproduced with permission of the copyright owner. Further reproduction prohibited without permission.

51
significant increases in tolerance in comparison to the baseline condition (see Table 12).
It was also revealed that subjects showed a return to baseline at phase 4, in as much as
the comparison between phases 3 and 4 revealed a significant reduction.
Summary
The results of the overall repeated measures analysis of variance indicate a
significant increase in performance between groups and as a result, follow-up analysis
was conducted. Specifically, analysis of variance with repeated measures for each of
the groups was separately performed.
The location within the data array of significant findings as suggested by F,
(i.e., at what phases and within which groups are there important differences.) was
summarized.
With regards to threshold, Table 3 presents the data for the control group; table
4 presents the data for the imagery group; and Table 5 presents the data for the
problem-solving group. In regards to the tolerance data, Table 6 presents the data for
the control group; Table 7 presents the data for the imagery group; and finally, Table 8
presents the data for the problem-solving group.
The results of the analysis described in Tables 9 through 20 yield pairwise
comparisons among phases, which take into account the group’s error term (or, the
within group variance). Such analysis reduces the likelihood of error due to false
detection of significant effects when none are in fact present. This is accomplished
because at each phase of the analyses, the relevant within group error term is used in
calculating the resulting F ratio. This is in contrast to using simple pairwise t-tests
which only consider the error term for the comparison analyzed.
Reproduced with permission of the copyright owner. Further reproduction prohibited without permission.

Table 13
Problem-Solving Group 1-Factor Repeated Measure Analysis of Variance Comparison Between Phases for Tolerance
Comparison Mean Difference Fisher PLSD Scheffe F-test Dunnett t
Phase 1 vs. 2 -44.75 43.15* 1.835 2.35
Phase 1 vs. 3 -61.50 43.15* 3.465 3.22
Phase 1 vs. 4 -10.00 43.15 0.092 0.520
Phase 2 vs. 3 -16.75 43.15 0.257 0.880
Phase 2 vs. 4 34.75 43.15 1.106 1.820
Phase 3 vs. 4 51.50 43.15* 2.43 2.700
Table 14
Imagery Group Means by Phases for Phases 1 Through 4 for Threshold
Group Count Mean SD Standard Error
Phase 1 4 24.00 22.52 11.26
Phase 2 4 33.25 23.13 11.56
Phase 3 4 33.00 11.16 5.58
Phase 4 4 15.5 9.40 4.70
In general, the treatments (types of suggestions) had specific effects depending
upon the order in which they were administered. Subjects in both experimental
conditions showed a return to baseline performance. Finally, control subjects showed
stable performance across phases.
Reproduced with permission of the copyright owner. Further reproduction prohibited without permission.

53
Table 15
Problem-Solving Group 1-Factor Repeated Measure Analysis of Variance for Phases 1 Through 4 for Threshold
Group Count Mean SD Standard Error
Phase 1 4 19.25 8.81 4.40
Phase 2 4 65.25 43.58 21.79
Phase 3 4 82.25 58.40 29.20
Phase 4 4 32.25 25.72 12.85
Table 16
Control Group 1-Factor Repeated Measure Analysis of Variance for Phases 1 Through 4 for Tolerance
Group Count Mean SD Standard Error
Phase 1 4 56.00 24.37 12.19
Phase 2 4 52.25 10.78 5.39
Phase 3 4 41.00 4.76 2.38
Phase 4 4 45.25 19.43 9.71
Table 17
Control Group 1-Factor Repeated Measure Analysis of Variance Comparison Between Phases for Tolerance
Comparison Mean Difference Fisher PLSD Scheffe F-test Dunnett t
Phase 1 vs. 2 3.75 19.44 0.063 0.436
Phase 1 vs. 3 15.00 19.44 1.106 1.148
Reproduced with permission of the copyright owner. Further reproduction prohibited without permission.

Table 17-Continued
Comparison Mean Difference Fisher PLSD Scheffe F-test Dunnett t
Phase 1 vs. 4 10.75 19.44 0.522 1.251
Phase 2 vs. 3 11.25 19.44 0.571 1.309
Phase 2 vs. 4 7.00 19.44 0.221 1.815
Phase 3 vs. 4 -4.25 19.44 0.082 0.495
Table 18
Imagery Group 1-Factor Repeated Measure Analysis of Variance for Phases 1 iWmgh 4 for Tolerance
Group Count Mean SD Standard Error
Phase 1 4 63.75 71.71 35.86
Phase 2 4 59.75 32.62 16.31
Phase 3 4 192.00 112.06 56.03
Phase 4 4 32.75 25.91 12.96
Table 19
Imagery Group 1-Factor Repeated Measure Analysis of Variance Comparison Between Phases for Tolerance
Comparison Mean Difference Fisher PLSD Scheffe F-test Dunnett t
Phase 1 vs. 2 4.00 78.067 0.004 0.116
Phase 1 vs. 3 -128.25 78.067* 4.605* 3.717
Phase 1 vs. 4 31.00 78.067 0.269 0.898
Phase 2 vs. 3 -132.25 78.067* 4.897* 3.833
Reproduced with permission of the copyright owner. Further reproduction prohibited without permission.

55
Table 19—Continued
Comparison Mean Difference Fisher PLSD Scheffe F-test Dunnett t
Phase 2 vs. 4 27.00 78.067 0.204 0.782
Phase 3 vs. 4 159.25 78.067* 7.10* 4.615
Table 20
Problem-Solving Group 1-Factor Repeated Measure Analysis of Variance for Phases 1 Through 4 for Tolerance
Group Count Mean SD Standard Error
Phase 1 4 24.75 11.61 5.81
Phase 2 4 69.50 41.25 20.63
Phase 3 4 86.25 57.80 28.90
Phase 4 4 34.75 25.00 12.50
Reproduced with permission of the copyright owner. Further reproduction prohibited without permission.

CHAPTER IV
DISCUSSION
Previous studies in this area report that when subjects are given analgesic
suggestions, they tend to indicate a reduction of pain independent of the subject’s level
of hypnotizability (Spanos, Kennedy, & Gwynn 1984). In addition, it has been shown
that a strong differential relationship exists between the type of suggestions given to
subjects and hypnotizability as assessed on standard scales (e.g., Spanos, Kennedy, &
Gwynn, 1984; Spanos et al., 1989). That is, a subject's degree of hypnotizability may
be related to his or her capacity for imagery, i.e., subjects who are more "imaginative"
tend to be more hypnotizable than subjects who possess less imaginative ability, as
rated on the standard scales. Because subjects chosen for this study were all medium in
hypnotic susceptibility, it was deduced that they would also be “medium” with respect
to imaginative ability, given the nature of the test suggestions found in the
hypnotizability scales utilized. In this study, the presence of non-imagery-based
suggestion (i.e., problem-solving suggestion) was shown to increase hypnotic
performance as indicated by tolerance and threshold measures of noxious stimulation.
This finding, at least as it pertains to threshold, is consistent with previous research and
with the analysis of hypnotically-relevant repertories provided earlier. Pain perception
seems to be affected by the type of suggestion provided, and traditional hypnotizability
scales may not predict this relationship for low or medium hypnotizable subjects.
Previous studies have failed to evaluate differences in pain perception due to the
laterality of the hand immersed. Given the frequent use of the alternating hand
56
Reproduced with permission of the copyright owner. Further reproduction prohibited without permission.

57
procedure summarized with respect to the work by Spanos et al,. (e.g., Spanos,
Kennedy, & Gwynn, 1984; Spanos, Me Neil, Gwynn, & Stamm, 1984) examination
of the data for possible differences in this respect seems critical. In fact, there was a
clear and significant difference favoring right hand performance in both tolerance and
threshold in this study. This finding was consistent across trials and phases and was
not contingent upon lateral dominance. The implications are that in future studies,
especially those using alternate hand procedures, researchers should insure at least that
pre- and post-test immersions are counterbalanced with equal numbers of left and right
hand immersions on both trials. It is recommended, however, that repeated trials for
each hand is the best procedure for ruling out instability in the data due to the hand
immersed.
This study assessed the effects of hypnotic suggestions on two duration
measures, tolerance and threshold, of hand immersion in cold water. The research
questions addressed included the following:
1. What are the effects of hypnotic suggestions on pain tolerance in medium
hypnotizable subjects?
2. What are the effects of hypnotic suggestions on pain perception in medium
hypnotizable subjects? and finally
3. What are the differential effects of standard versus non-standard hypnotic
suggestions on pain tolerance and pain perception?
In general, subjects in this study demonstrated an increase in performance
when provided with the experimental interventions. The effect was evident in an
overall sense during the change between the first phase and phase 2 for both threshold
and tolerance. The within group analyses revealed that the effect was weakened in the
imagery group for the change between phase 2 and phase 3 for the threshold, but
Reproduced with permission of the copyright owner. Further reproduction prohibited without permission.

58
showed still greater change in tolerance. It is possible that the change observed for
tolerance between phases one and two were mediated by the change in pain perception
as indicated by the proportionate rise in threshold. This seemed likely for phases one
and two, but was not the case for the change between phases two and three, with only a
slight further rise in threshold. There was a considerable rise in tolerance in phase
three. Given the emphasis in both types of hypnotic suggestions on pain perception,
i.e., reduction of pain, one might wonder why there was no further rise in threshold
during phase three. It may be possible that pain perception is less modifiable beyond
certain limits, irrespective of change in tolerance. Future studies should address this
question more explicitly. Overall, the subjects demonstrated a return to baseline
performance in both tolerance and threshold. This provides clear evidence that, at least
with respect to the combined experimental interventions, subjects demonstrated no
"carry-over" effects when specifically instructed to keep their hand immersed without
the use of hypnosis.
It was of particular interest in this study to examine performance under
conditions of no experimental intervention (i.e., subjects being asked merely to
immerse their hand for as long as possible). This manipulation has never been tried in
the published hypnosis literature concerned with pain perception and tolerance. Aside
from the value of information derived from directly observing this effect, Hull (1939)
recognized that it is against this baseline that any "hypnotic effects" should be
measured. The evidence from this study reveals that there were no “practice effects”
due to repeated exposure of this type of noxious stimulation.
It should be noted that subjects in the control condition were not engaged in a
distraction task during the time the hand was immersed in the water. However, in
order to control for contact time with the experimenter, the control subjects were
Reproduced with permission of the copyright owner. Further reproduction prohibited without permission.

59
engaged in conversation for the same duration as the experimental subjects spent
receiving the hypnotic induction. The hands were not immersed during this
conversational contact; nor were they during the comparable period of hypnotic
induction for the experimental subjects.
Subjects who were exposed to the problem-solving suggestion first (followed
by the imagery-based suggestion in phase three) demonstrated an overall increase in
threshold and tolerance from phase one to phase two, and from phase two to phase
three. As indicated by the changes in performance, it can be seen that threshold
increased uniformly with tolerance. In the return to baseline condition, the threshold
measure decreased correspondingly with the tolerance measure to near baseline
conditions. This pattern of performance would argue well for the position that pain
tolerance is mediated by the rise and fall in pain perception. There appears to be almost
a one-to-one correspondence between threshold and tolerance. Nevertheless, it can be
seen that threshold and tolerance were affected by the experimental manipulations.
These findings are consistent with those reported in previous studies indicating that
non-imaginal strategies are effective in reducing report of pain in both low and high
hypnotizable subjects.
In contrast to the imagery group (i.e., subjects who received the imageiy-based
suggestion prior to receiving the problem-solving suggestion), threshold and tolerance
for the problem-solving group did not seem to have the same one-to-one
correspondence reported earlier. From phase one to phase two, there was a marginal
increase in threshold and a slight decrease in tolerance. However, from phase two to
phase three, the threshold measure remained at approximately the same level. This
occurred while the tolerance measure increased at least three fold and as much as five
fold. In the fourth phase, threshold and tolerance decreased to pre-baseline levels. In
Reproduced with permission of the copyright owner. Further reproduction prohibited without permission.

60
contrast to the problem-solving group, the imagery group demonstrated minimal
threshold changes across phases. It is only in this group that threshold and tolerance
seem to have not been.
The results of the present study suggest that moderately hypnotizable subjects
may significantly increase level of hypnotic performance when exposed to problem
solving suggestions. This group of subjects was more responsive to problem-solving
suggestion than to imagery-based suggestion. Irrespective of when introduced,
previous research would indicate that there would not be a significant effect for imagery
suggestions for moderately hypnotizable subjects. At best, only moderate increases in
hypnotizability would be expected with this group when given the imagery-based
suggestion. If highly hypnotizable subjects had been employed it is hypothesized that
they would be more responsive to the imagery-based suggestion. In comparing the
performance of the two experimental groups it would seem that the problem-solving
suggestion clearly added incrementally to the subjects’ level of tolerance and threshold.
During the imagery suggestion conditions, these subjects were being asked to respond
to verbal stimuli which they had indicated, during screening, would be of limited
effectiveness.
This study differs from those described in the literature in several important
respects. Unique to this study is that subjects were given the opportunity to respond to
noxious stimulation over repeated trials. Specifically, in each phase of the study,
subjects alternately immersed their right and left hands on three separate occasions or a
total of six hand immersions per phase. This resulted in twenty-four separate
immersions over the course of the study. This is an important addition as previous
studies have measured only pre and post single hand immersions. Specifically, a
subject is typically asked to immerse one hand in the cold water, hypnotizability or
Reproduced with permission of the copyright owner. Further reproduction prohibited without permission.

61
hypnotic performance assessed; then he or she would be given a hypnotic suggestion,
then the alternate hand would be immersed and hypnotizability or performance
reassessed. The present study indicates that the alternate hand immersion procedures
typical of these studies may be suspect as a difference in tolerance and threshold
measures was found when the right hand was immersed as compared to when the left
hand. The majority of the subjects were able to maintain the right hand in cold water
longer than the left hand.
Finally, in relation to the findings which suggest that non-imagery based
suggestions may have produced a differential effect on threshold and tolerance, there
are several implications for the use of standard hypnotizability scales in assessing
suggestibility. First at the theoretical level, it is quite possible that such scales only
assess pre-existing imagery related repertoires. That such repertoires are directly
related to hypnotizability is unquestioned. However their failure to assess for
"problem-solving" repertoires may lead to an unnecessary restriction in our
understanding of who makes a good hypnotic subject. In other words the present
study offers the possibility that medium hypnotizables can demonstrate very high
performance under proper suggestive conditions. Because the present study did not
make use of high hypnotizable subjects, no comparison can be made as to the relative
magnitude of this performance. But it is clear that within the context of the present
investigation, such performance of "problem solving" subjects, significantly surpassed
that of "imagery subjects." Imagery may in fact provide only one channel for
successful hypnotic performance. At least one other non-specific repertoire (referred to
in this study as problem solving) may comprise an equally effective channel.
At a practical level, decisions are made within a clinical context to treat or not
treat using hypnotic interventions based upon standard scales of suggestibility which
Reproduced with permission of the copyright owner. Further reproduction prohibited without permission.

62
are heavily based on imagery instructions. Such decisions lead to the rejection of
persons who fail to respond to test suggestions formulated to increase performance
based upon a subject's ability to react to verbal stimulation rich in imagery. Yet these
subjects may well have shown higher levels of responsiveness had another formulation
of test suggestions (more permissive or indirect) been utilized. Thus the clinical
decision to reject such persons, may be biased in the direction of over exclusion, when
these individuals could in fact benefit from hypnotic treatment (Barber, 1980). The
problem solving suggestions in the present study meet the criteria as permissive and
indirect as described by Barber.
Hart (1985) takes a similar position with respect to the use of indirect and direct
suggestions.
I believe that the controversy outlined above has been very helpful in elucidating the nature of the patient/procedure interaction in hypnotic suggestion for analgesia and can probably be extrapolated to other conditions as well. That is, the research suggests that hypnotizability is a valid concept in that it can guide the therapist to use the most efficacious type of suggestion. High hypnotizables tend to respond well to direct suggestion; low hypnotizables appear to respond just as well to indirect, permissive suggestion. Hypnotizability scores can thus become even more useful in helping to tailor hypnotic treatment to a relevant subject characteristic (p. 91).
Barber takes the same perspective in his claim that hypnotizability does not
predict response to hypnotic analgesia via indirect suggestion, and that indirect
suggestion is a viable alternative to direct suggestion for low hypnotizable subjects
(Barber, 1977). This seems a reasonable argument with respect to moderately
hypnotizable subjects in the present study.
There are limitations of this study that need to be addressed. One is that the
small sample size employed restricts the external validity of the findings. In addition,
reliability regarding the basic findings with regard to the unusual pattern of performance
in phase three of the problem-solving group is open to questioned, and certainly further
Reproduced with permission of the copyright owner. Further reproduction prohibited without permission.

63
investigation. A larger sample size would increase confidence that this is a stable
feature of subject performance.
Thic oomo nrA PO /liira Ka ronooto/1 iw itli 1nti» OflH h i ffllAlUk) kJWtAAW pIVVl/UHIV tMiVUiU l/V 1V|/WU»VU *TAUt IW U ) AA* ; -. - ■ U
hypnotizable subjects to further support the related hypothesis that conventional
inductions primarily rely on imagery-based suggestions. After the completion of each
experimental condition, the subjects could be asked the extent to which they followed
the suggestions given by the experimenter or used other self derived strategies (e.g.,
Spanos, McNeil, Gwynn, & Stamm, 1984).
Additional studies in this area should employ a similar design, with the addition
of a baseline phase between the two experimental phases to more clearly determine
whether a hypnotic effect occurs as a result of the hypnotic suggestions given.
Finally, in order to assess whether a subject’s level of hypnotizability changed
as a result of exposure to these procedures, the HGSHS:A should be administered at
the end of the study.
Reproduced with permission of the copyright owner. Further reproduction prohibited without permission.

Appendix A
Criteria for Participation Form
64
Reproduced with permission of the copyright owner. Further reproduction prohibited without permission.
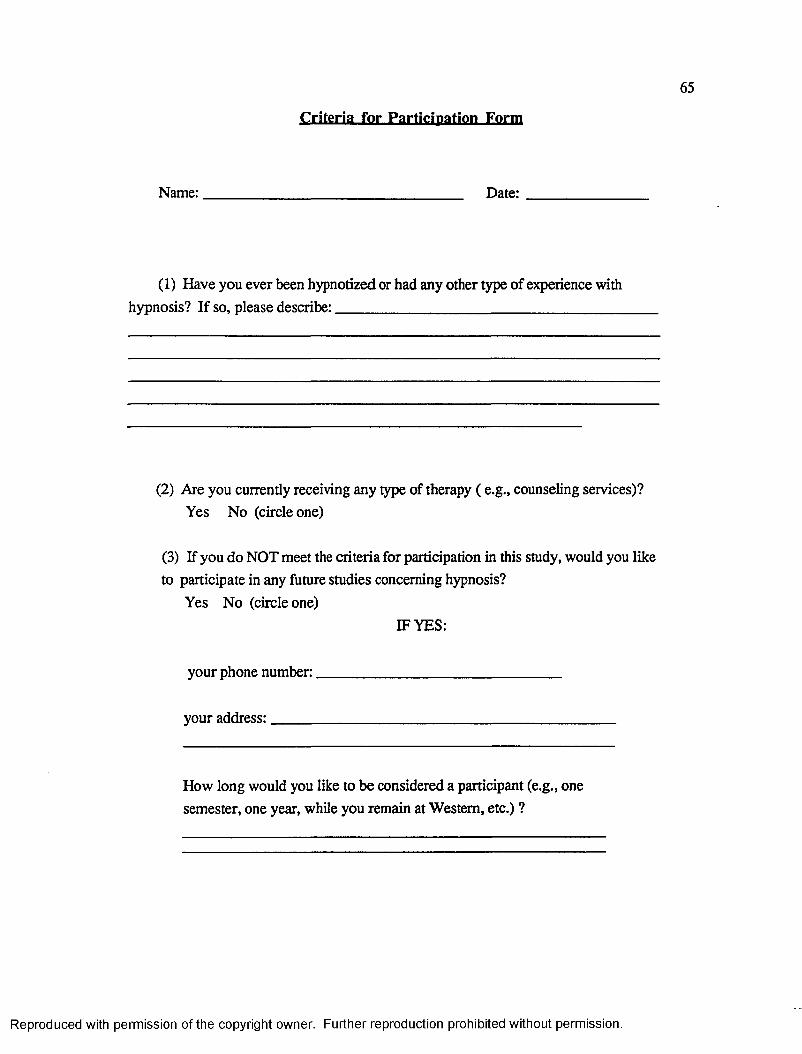
Criteria for Participation Form
Name:__________________________________ Date:
(1) Have you ever been hypnotized or had any other type of experience with hypnosis? If so, please describe:_____________________________________
(2) Are you currendy receiving any type of therapy ( e.g., counseling services)? Yes No (circle one)
(3) If you do NOT meet the criteria for participation in this study, would you like to participate in any future studies concerning hypnosis?
Yes No (circle one)IF YES:
your phone number:________________________________
your address:_____________________________________________
How long would you like to be considered a participant (e.g., one semester, one year, while you remain at Western, etc.) ?
Reproduced with permission of the copyright owner. Further reproduction prohibited without permission.

Appendix B
Conversation Topics for Control Subjects
66
Reproduced with permission of the copyright owner. Further reproduction prohibited without permission.

Conversation Topics for Control Subjects
MajorYear at WMUWhy they chose to attend WMUAttendance at any other UniversitiesInvolvement in SororitiesClasses currently being takenPlans after graduationHobbiesSportsWeatherFamilyRecent movies seen Recent books read Vacation plans
Reproduced with permission of the copyright owner. Further reproduction prohibited without permission.

Appendix C
Subject Recruitment Form
68
Reproduced with permission of the copyright owner. Further reproduction prohibited without permission.

Subject Recruitment Form
You are invited to participate in a research study intended to measure the effects
of verbal instructions on suggestibility.
In order to participate in the study, you must be female and at least eighteen
years old. An initial screening session will be scheduled which will require your
involvement in one group session intended to assess your current level of
suggestibility, and then the completion of two short questionnaires. After this initial
screening, you will be contacted and informed if you are eligible for further
participation.
As a participant, you will be asked to immerse your hand in cold (0 to 2 degrees
Celsius) water for as long as you can, but no longer than five minutes. A total of four
sessions will be scheduled, each of which is not expected to exceed one hour. The
entire study is expected to last no more than one month.
Participation in this study is voluntary and you are encouraged to participate for
the entire duration, although you may withdraw at any time. You will receive 1.0 credit
hour for your complete participation in this project. You will be financially responsible
for paying the tuition cost associated with this one credit hour.
As a participant, no identifying information will be collected and only minimal
information pertaining uniquely to you will be obtained.
If you are interested in participation in this study or have any questions
regarding your role as a participant, please fill out the form below and return to me; or,
you may reach me, Gloria Haddad, at 349-5198. Thank you for your interest in this
study.
Your name:____________________________________ Age:_______
Phone Number:______________________________
Reproduced with permission of the copyright owner. Further reproduction prohibited without permission.

Other Phone Number:__
Best day and time to call:
Reproduced with permission of the copyright owner. Further reproduction prohibited without permission.

Appendix D
Informed Consent for Participation in an Investigation
71
Reproduced with permission of the copyright owner. Further reproduction prohibited without permission.

Informed Consent for Participation in an Investigation
I understand that I am agreeing to participate in a research study entitled “The Effects of Two Types of Hypnotic Suggestions on Analgesic Responding in Medium Hypnotizable Subjects.” This study will examine the effects that two different types of hypnotic instructions have on analgesia responding.
I understand that I will be asked to participate in an initial selection process which involves a group session intended to measure suggestibility and the completion of two very brief questionnaires entitled “the social desirability scale” and “the hostility inventory.” Based upon the responses obtained from these preliminary screening instruments, I may be asked to continue participation in this study. If I do not meet criteria for participation, I will be notified and discontinued.
Continued participation will require that I alternately immerse my right and left hands in cold (0 to 2 degrees Celsius) for as long as I can. I understand that I will not be allowed to maintain my hand in the cold water for more than five minutes.
I understand that the duration of each session is not expected to exceed sixty minutes and I will be asked to participate in a total of four session. The fourth and last session will occur within one month of the first session, thus the duration of this investigation is not expected to exceed one month.
I understand that if I meet all the criteria, am selected, and participate fully, I am eligible to receive 1.0 credit hour for my participation in this study. I understand that I will be financially responsible for paying the tuition associated with this one credit hour.
Participation in this study is voluntary. Although it is strongly recommended that commitment be for the full length of the study, I will be free to discontinue participation at any time. My participation in this study will in no manner affect my relations with Western Michigan University. There will be no identifying information collected and only minimal demographic data will be gathered which will be kept confidential.
Questions or complaints regarding this research or your rights as a participant may be directed to Gloria M. Haddad, M.A. at 349-5198. If the response is unsatisfactory, you may contact Richard Tsegaye-Spates, Ph.D., at 387-4496 or 387- 4482.
Reproduced with permission of the copyright owner. Further reproduction prohibited without permission.

My signature below indicates that this statement has been explained to me and I understand the above information, and have decided to participate.
Signature of Subject Date and Time
Signature of Investigator Signature of Witness
Reproduced with permission of the copyright owner. Further reproduction prohibited without permission.

Appendix E
Instructions for Observers
74
Reproduced with permission of the copyright owner. Further reproduction prohibited without permission.

Instructions for Observers
Once the instructions have been completed, the subject will be asked to “Now immerse your hand in the water for as long as you can.” (A compressor apparatus will be positioned in proximity to the subject so that the hand can be immersed with ease.) As soon as the hand is immersed in the cold water, the timing by the observers will begin.
One to two volunteer observers will collect data as the procedures are implemented by the principal investigator. They will be positioned behind a one-way mirror so as not to interfere with the subject’s performance. Observers one and two will perform the same duties and collect the same data. The results obtained will be compared and checked against each other for reliability. Each observer will be equipped with a standard hand-held stopwatch that will be used to measure the amount of time that a subject maintains her hand in the water and indicates pain.
The observers will be responsible for taking two different duration measures: tolerance and threshold. The tolerance measure will constitute the total amount of time that a subject maintains her hand in the cold water. That is, from the second that the subject immerses her hand to the second that she takes it out.
The threshold measure will constitute the amount of time that a subject maintains her hand in the cold water up to the point where she signals that pain is being felt. The subject will signal die observers by raising the index finger on the hand not immersed in the water. Thus, observers will record the time between the second that the subject immerses her hand in the water and the second that the index finger is raised to indicate pain.
Both observers will also be responsible for reporting which of the two suggestions are administered to the subject: the problem-solving suggestion or the imagery-based suggestion. The observers will be provided with a written copy of both suggestions against which to check which was administered to the subject. The observers will be present for at least twenty-five percent of the total sessions to assure that contact was made with the independent variable.
Reproduced with permission of the copyright owner. Further reproduction prohibited without permission.
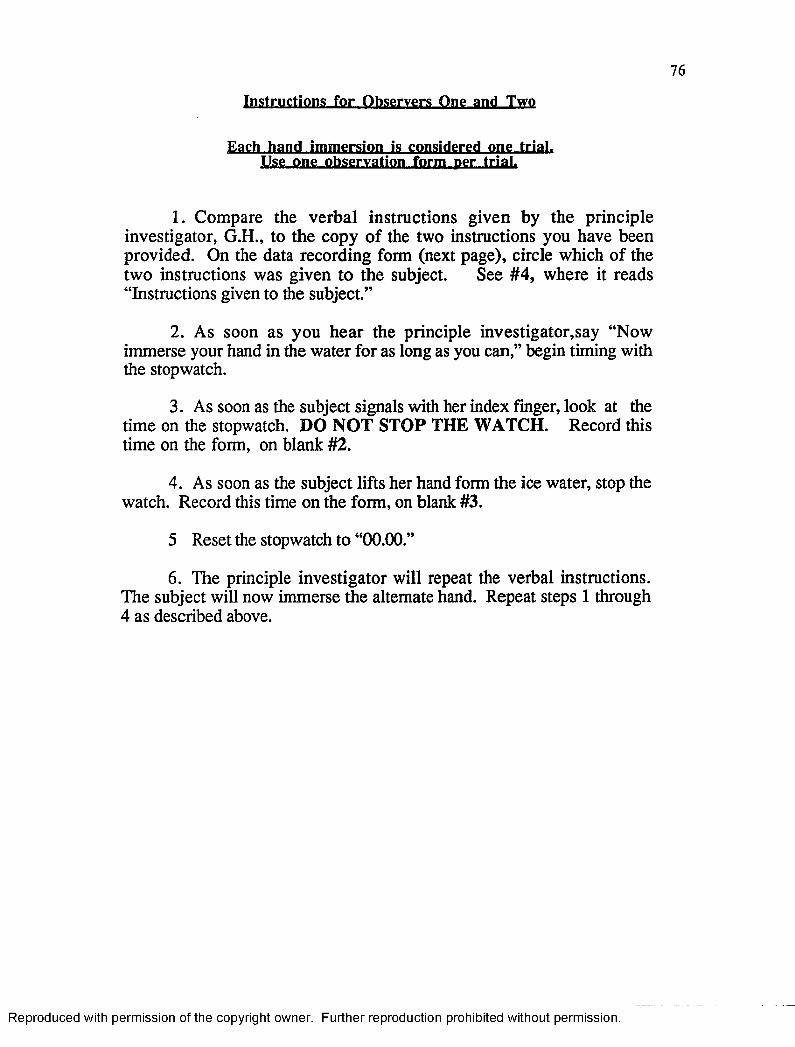
Instructions for Observers One and Two
Each hand immersion is considered one trial. Use one observation form per trial.
1. Compare the verbal instructions given by the principle investigator, G.H., to the copy o f the two instructions you have been provided. On the data recording form (next page), circle which o f the two instructions was given to the subject. See #4, where it reads “Instructions given to the subject.”
2. As soon as you hear the principle investigator,say “Now immerse your hand in the water for as long as you can,” begin timing with the stopwatch.
3. As soon as the subject signals with her index finger, look at the time on the stopwatch. DO N O T STOP THE WATCH. Record this time on the form, on blank #2.
4. As soon as the subject lifts her hand form the ice water, stop the watch. Record this time on the form, on blank #3.
5 Reset the stopwatch to “00.00.”
6. The principle investigator will repeat the verbal instructions. The subject will now immerse the alternate hand. Repeat steps 1 through 4 as described above.
Reproduced with permission of the copyright owner. Further reproduction prohibited without permission.

Appendix F
Data Recording Form
77
Reproduced with permission of the copyright owner. Further reproduction prohibited without permission.

78
Data Recording Form
Subject # _____________ Session # _____________ Date:______________
Observer’s name:_________________________________
T r ia l# _______
Hand Immersed: Right or left (circle one).
#2 Amount of time the hand is immersed in the water up to the point where pain is repo rted :______________ .
#3 Total amount of time the hand is immersed in the water:______________ .
#4. Suggestion given to the subject: Imagery-based or Problem-solving (circle one)
Compare to the copy you have been provided.
Any comments:
Reproduced with permission of the copyright owner. Further reproduction prohibited without permission.

Appendix G
Approval Letter From the Human Subjects Institutional Review Board
79
Reproduced with permission of the copyright owner. Further reproduction prohibited without permission.
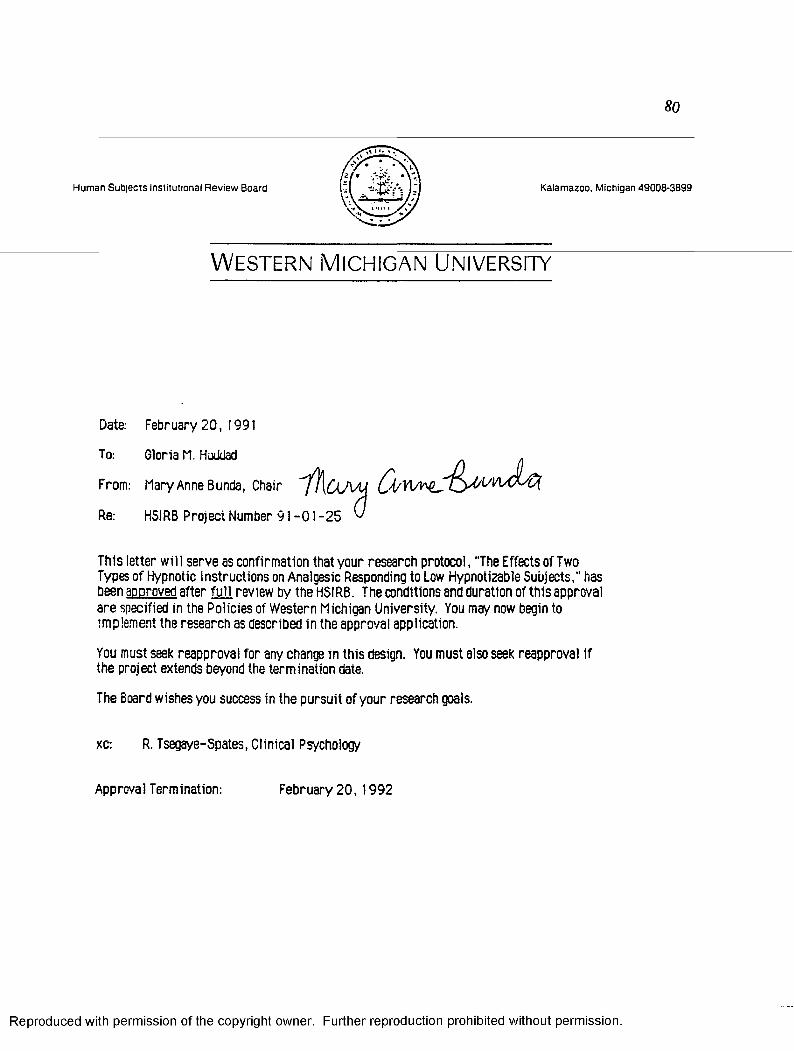
80
H u m an S u b je c ts Institu tiona l R ev iew B oard K alam azoo . M ichigan 4 9 0 0 8 -3 8 9 9
W estern M ic h ig a n u n iver sity
Date: February 20, 1991
To: Gloria M. Huddad .
From: Mary Anne Bunda, Chair
Re: HSIRB Project Number 91-01 -25 J
This letter w ill serve as confirmation that your research protocol, "The Effects of Two Types of Hypnotic Instructions on Analgesic Responding to Low Hypnotizable Subjects," has been approved after full review by the HSIRB. The conditions and duration of this approval are specified in the Policies of Western Michigan University. You may now begin to implement the research as described in the approval application.
You must seek reapproval for any change in this design. You must also seek reapproval if the project extends beyond the termination date.
The Board wishes you success in the pursuit of your research goals,
xc: R. Tsegaye-Spates, Clinical Psychology
Approval Termination: February 20, 1992
Reproduced with permission of the copyright owner. Further reproduction prohibited without permission.

BIBLIOGRAPHY
Barber, J. (1980) Hypnosis and the unhypnotizable. American Journal of Clinical Hypnosis. 23(11), 4-9.
Barber, T. X. (1979). Suggested ("hypnotic") behavior: The trance paradigm versus an alternative paradigm. In E. Fromm & R. E. Shor (Eds.) Hypnosis: Developments in research and new perspectives (2nd ed., pp. 217-271). Chicago: Aldine.
Barber, T. X., & De Moor, W. (1972). A theory of hypnotic induction procedures. The American Journal of Clinical Hypnosis. 15(21.112-135.
Barber, T. X., & Wilson, S. C. (1979). The Barber Suggestibility Scale and the Creative Imagination Scale: Experimental and clinical applications. American Journal of Clinical Hypnosis. 21. 84-108.
Bates, B. L., & Brigham, T. A. (1990). Modifying hypnotizability with the Carleton Skill Training Program: A partial replication and analysis of components. The International Journal of Clinical and Experimental Hypnosis. 3.183-195.
Buss, A. H., & Durkee, A. (1957). An inventory for assessing the different kinds of hostility. Journal of Consulting Psychology. 21(41.524.
Cooke, C. E., & Van Vogt, A.E. (1965). The hypnotism handbook. Alhambra, CA: Borden.
Crassilneck, H. B„ & Hall, J. A. (1985). Clinical hypnosis: Principles and applications (2nd edition). Orlando, FL: Grune & Stratton.
Crowne, D. & Marlowe, D. (1960). A new scale of social desirability independent of pathology. Journal of Consulting Psychology, 24. 351.
Evans, M.B. & Paul, G.L. (1970). Effects of hypnotically suggested analgesia on physiological and subjective responses to cold pressor pain. Journal of Consulting and Clinical Psychology. 35.362-371.
Farthing, G. W., Venturino, M., & Brown, S. W. (1984). Suggestion and distraction in the control of pain: Test of two hypotheses. Journal of Abnormal Psychology. 21(3), 266-276.
Hart, B. B. (1985) Type of suggestion and hypnotizability in clinical work. British Journal of Experimental and Clinical Hypnosis. 2(2), 89-93.
Hilgard, E. R. (1965). Hypnotic susceptibility. New York: Harcourt, Brace & World.
81
Reproduced with permission of the copyright owner. Further reproduction prohibited without permission.
Hilgard, E. R., & Hilgard, J.R. (1975). Hypnosis in the relief of pain. Los Altos, CA: Kaufman.
Hilgard, J. R. (1970). Personality and hypnosis: A study of imaginative involvement. Chicago: Chicago University Press.
Hilgard, J. R. 1977). Divided consciousness: Multiple controls in human thought and action. New York: Wiley-Interscience.
Hilgard, J. R. (1979). Imaginative involvement: Some characteristics of the highly hypnotizable and the non-hypnotizable. The International Journal of Clinical and Experimental Hypnosis. 2.138-156.
Hull, C. L. (1933). Hypnosis and suggestibility: An experimental approach. New York: Appleton-Century-Crofts.
Lynn, S. J., & Rhue, J. W. (1986). The fantasy-prone person: hypnosis,imagination and creativity. Journal of Personality and Social Psychology. 51(2), 404-408.
Lynn, S. J., & Rhue, J. W. (1987). Hypnosis, imagination and fantasy. Journal of Mental Imagery. 11(2). 101-110.
Lynn, S. J., & Rhue, J. W. (1988). Fantasy proneness: Hypnosis, developmental antecedents and psychopathology. American Psychologist. 43fl). 35-44.
Mitchell, G. P., & Lundy, R. M. (1986). The effects of relaxation and imagery inductions on responses to suggestions. The International Journal of Clinical and Experimental Hypnosis. 2.98-109.
Morgan, A. H., & Hilgard, A. J. (1978-1979). The Stanford Hypnotic Clinical Scale for Adults. American Journal of Clinical Hypnosis. 2 1 , 134-147.
Nash, M. R., Lynn, S. J., & Givens D. L. (1984). Adult hypnotic susceptibility, childhood punishment and child abuse: A brief communication. The International Journal of Clinical and Experimental Hypnosis. 22(6), 6-11.
Shor, R. E., & Ome, E. C. (1962). Harvard Group Scale of Hypnotic Susceptibility: Form A. Palo Alto, CA: Consulting Psychologists Press.
Skinner, B. F. (1957). Verbal behavior. Englewood Cliffs, NJ: Prentice Hall.
Spanos, N. P., Barber, T. X., & Lang, G. (1974). Cognition and self-control: Cognitive control of painful sensory input. In H. London & R.E. Nesbitt (Eds.), Thought and feeling: Cognitive alteration of feeling states (pp. 141-158). Chicago: Aldine.
Spanos, N. P., Brett, P. J., Menaiy, E. P., & Cross, W. P. (1987). A measure of attitudes toward hypnosis: Relationships with absorption and hypnotic susceptibility. American Journal of Clinical Hypnosis. 30.139-150.
Reproduced with permission of the copyright owner. Further reproduction prohibited without permission.

Spanos, N. P., & Chaves, J. F. (1989). Hypnosis: The cognitive-behavioral perspective. New York: Prometheus.
Spanos, N. P., Cross, W. P., Menary, E. P., Brett, P. J., & De Groh, M. (1987). Attitudinal and imaginal ability predictors of social cognitive skill-training enhancements in hypnotic susceptibility. Personality and Social Psychology Bulletin. 13. 379-398.
Spanos, N. P., Kennedy, S. K., & Gwynn, M. I. (1984). Moderating effects of contextual variables on the relationship between hypnotic susceptibility and suggested analgesia. Journal of Abnormal Psychology. 93(3). 285-294.
Spanos, N. P., McNeil, C., Gwynn, M. I. & Stam, H.J. (1984). Effects of suggestion and distraction on reported pain in subjects high and low on hypnotic susceptibility. Journal of Abnormal Psychology. 93(31.277-284.
Spanos, N.P., Perlini, A. H., & Robertson, L.A. (1989). Hypnosis, suggestion and placebo in the reduction of experimental pain. Journal of Abnormal Psychology. 2&(3), 285-293.
Spanos, N. P., Radtke-Bodorik, H. L., Ferguson, J.D., & Jones, B. (1979). The effects of hypnotic susceptibility, suggestions for analgesia, and the utilization of cognitive strategies on the reduction of pain. Journal of Abnormal Psychology. M 3 ), 282-292.
Spanos, N. P., Radtke, H. L., Hodgins, D. C., Bertrand, L.D., Stam, H.J., & Moretti, P. (1983). The Carleton University Responsiveness to Suggestion Scale: Relationship with other measures of hypnotizability. Psychological Reports. 543. 723-734.
Spanos, N. P., Robertson, L.A., Menary, E. P., & Brett, P.J. (1986). Component analysis of cognitive skill training for the enhancement of hypnotic susceptibility. Journal of Abnormal Psychology. 95.350-357.
Spiegel, H., & Spiegel, S. (1978). Trance and treatment: Clinical uses of hypnosis. New York: Basic Books.
Weitzenhoffer, A. M. (1989). The practice of hypnotism: Traditional and semi- traditional techniques and phenomenology. (Vols. 1 and 2). New York: Wiley & Sons.
Weitzenhoffer, A. M., & Hilgard, E. R. (1959). The Stanford Scale of Hypnotic Susceptibility: Forms A & B. Palo Alto, CA: Consulting Psychologists Press.
Weitzenhoffer, A. M., & Hilgard, E. R. (1962). The Stanford Scale of Hypnotic Susceptibility: FormC. Palo Alto, CA: Consulting Psychologists Press.
Wilson, S. C., & Barber, T. X. (1981). Vivid fantasy and hallucinatory abilities in the life histories of excellent hypnotic subjects ("somnambules"): Preliminary report with female subjects. In E. IGinger (Ed.). Imagery volume 2: Concepts, results, and applications (pp. 133-145). New York: Plenum Press.
Reproduced with permission of the copyright owner. Further reproduction prohibited without permission.


![[Product Monograph Template - Standard] · The hypnotic-sedative effects of benzodiazepines are rapidly reversed by flumazenil. However, the residual effects may reappear gradually](https://static.fdocuments.in/doc/165x107/5c9ccb5088c993ab348ba42c/product-monograph-template-standard-the-hypnotic-sedative-effects-of-benzodiazepines.jpg)
