The Effects of Time Delay in Reciprocity Games fileThe Effects of Time Delay in Reciprocity Games...
43
The Effects of Time Delay in Reciprocity Games Wei Siong Neo, Michael Yu, Roberto A. Weber, Cleotilde Gonzalez Department of Social and Decision Sciences Carnegie Mellon University August 13, 2012 Corresponding Author: Cleotilde Gonzalez, [email protected] *Title page with author details
Transcript of The Effects of Time Delay in Reciprocity Games fileThe Effects of Time Delay in Reciprocity Games...

The Effects of Time Delay in Reciprocity Games
Wei Siong Neo, Michael Yu, Roberto A. Weber, Cleotilde Gonzalez
Department of Social and Decision Sciences
Carnegie Mellon University
August 13, 2012
Corresponding Author: Cleotilde Gonzalez, [email protected]
*Title page with author details

1 2 3 4 5 6 7 8 9 10 11 12 13 14 15 16 17 18 19 20 21 22 23 24 25 26 27 28 29 30 31 32 33 34 35 36 37 38 39 40 41 42 43 44 45 46 47 48 49 50 51 52 53 54 55 56 57 58 59 60 61 62 63 64 65
Abstract
Reciprocity is common in economic and social domains, and it has been widely
documented in the laboratory. While positive and negative reciprocity are observed in
investment and ultimatum games, respectively, prior laboratory studies often neglect the effect of
time delays that are common in real-world interactions. This research investigates the effect of
time delays on reciprocity in the investment and ultimatum games. We manipulate the time delay
after second movers have been informed about the first movers’ decisions. We find that a delay
is correlated with fewer rejections in the ultimatum game, but we find no effect of delays in the
investment game. A follow-up study explores some of the processes that occur during time delay
in the ultimatum game. We find delays correlated to increased reported feelings of satisfaction
and decreased reported feelings of disappointment. Increased satisfaction is correlated to an
increased probability of rejection, while disappointment has a more complex relationship to the
probability of rejection.
Keywords: reciprocity; time delay; ultimatum game; investment game; emotions
Index Classification: reciprocity, game theory
PsycINFO Classification: 3020
JEL-Classification: C70, D63
*Manuscript without author identifiersClick here to view linked References

1 2 3 4 5 6 7 8 9 10 11 12 13 14 15 16 17 18 19 20 21 22 23 24 25 26 27 28 29 30 31 32 33 34 35 36 37 38 39 40 41 42 43 44 45 46 47 48 49 50 51 52 53 54 55 56 57 58 59 60 61 62 63 64 65
1
1. Introduction
Over the last 20 years, many studies have found evidence of behaviors consistent with
reciprocity – the act of responding to perceived kindness with kindness and perceived
unkindness with retaliation (Fehr & Fischbacher, 2002; Cox, Friedman, & Gjerstad, 2007).
Economists have studied its role in sustaining social norms, enforcing incomplete contracts, and
producing downward wage rigidity (Fehr & Gächter, 2000). In the field, psychologists found that
a waitress with a broad smile receives greater tips (Tidd & Lockard, 1978), while economists
have found that kind acts are rewarded in the context of charitable donations (Falk, 2007). Both
economists and psychologists have also found negative reciprocity, for example, in the context
of wage cuts (Greenberg, 1990; Kube, Marechal & Puppe, 2010). Several theoretical models
complement these investigations (e.g., Cox et al., 2007; Dufwenberg & Kirchsteiger, 2004; Falk
& Fischbacher, 2006). These models capture the idea of reciprocity and predict behavior
consistent with observations in these experiments.
In the laboratory, the investment game (IG) is often used to study positive reciprocity.
The first move, known as the sender, chooses how much money to give to the second mover,
known as the receiver. Any money sent is increased by the experimenter. The responder then
decides whether to return any money to the sender. Backward induction predicts that the
responder will return nothing and thus the sender should send nothing. However, numerous
studies show that most responders provide positive returns after reciving positive transfers from
senders (Berg, Dickhaut & McCabe, 1995).
The ultimatum game (UG) is often used to study negative reciprocity. The first mover,
known as the proposer, offers a division of money between herself and the second mover, known

1 2 3 4 5 6 7 8 9 10 11 12 13 14 15 16 17 18 19 20 21 22 23 24 25 26 27 28 29 30 31 32 33 34 35 36 37 38 39 40 41 42 43 44 45 46 47 48 49 50 51 52 53 54 55 56 57 58 59 60 61 62 63 64 65
2
as the responder. The responder either accepts or rejects the offer. If the responder accepts, the
money is split according to the proposal; if the responder rejects, the proposer and the responder
both receive nothing. Backward induction predicts that the responder should accept any positive
offer and thus the proposer should offer the smallest possible positive amount. However,
numerous studies demonstrate that most proposers offer 25% to 50% of the money, and that
responders reject proposals half of the time when the offers are less than 20% of the money
being divided (see Camerer, 2003, for a review).
In this paper, we explore one aspect often found in the field, but not in the laboratory,
time delay. We study its effects by varying whether the responders’ decisions in the IG and UG
are made either immediately after finding out the first movers’ decisions or waiting until after
finding out the first movers’ decision before making their own. We address several questions
relating to the influence of time delay and reciprocity. First, does time delay have any effect on
second movers’ strategic behavior in the IG and UG? Second, do first movers anticipate potential
effects of time delay and adapt their strategic behavior accordingly? Finally, what processes
during the time delay cause these effects? These questions are answered in three experiments. In
Section 2, we briefly summarize the related literature. Section 3 describes how time delay may
affect reciprocity and explains our predictions. In Sections 4, 5, and 6, we present the design,
procedures, and results of our IG and UG experiments. Section 7 discusses our empirical
findings, highlights some future research directions, and concludes.
2. Time delay in reciprocity games
To the best of our knowledge, only three studies have empirically examined time delay in
reciprocity games. First, Bosman, Sonnemans, and Zeelenberg (2001) conjectured that time

1 2 3 4 5 6 7 8 9 10 11 12 13 14 15 16 17 18 19 20 21 22 23 24 25 26 27 28 29 30 31 32 33 34 35 36 37 38 39 40 41 42 43 44 45 46 47 48 49 50 51 52 53 54 55 56 57 58 59 60 61 62 63 64 65
3
delay would lead responders in the UG to experience less intense negative emotions when
making their decisions, which would be reflected in a lower rejection rate. In both baseline and
“cool-off” treatments, proposers suggested how to divide 20 Dutch guilders; responders in the
former treatment decided whether to accept or reject their offers immediately after being
informed, whereas responders in the latter treatment decided whether to accept or reject their
offers an hour after being informed. In the basic treatment, 3 out of 16 offers (18.8%) were
rejected; in the cool-off treatment, 2 out of 22 offers (9.1%) were rejected. When analyses were
restricted to low offers, i.e., offers of less than half the money), 3 out of 10 offers (30.0%) were
rejected; in the cool-off treatment, 2 out of 19 (10.5%) were rejected. Although it was in the
hypothesized direction, the decreased rejection rate in the cool-off treatment was not statistically
significant, regardless of the types of offers considered. This led the authors to conclude that
time delay had no significant effect on the responders’ behavior in the UG.
Second, Oechssler, Roider, and Schmitz (2008) predicted that time delay would result in
a lower rejection rate in the UG. In the cash (lottery) treatment, proposers suggested how to
divide 10 euros (lottery tickets – each with an equal probability of winning 500 euros); they
could either offer 5 euros (tickets) or 2 euros (tickets) to responders. In both cash and lottery
treatments, responders decided whether to accept or reject their offers immediately after being
informed about them. After making their decisions, however, responders were notified that they
would have an opportunity to revise their initial decisions. Twenty-four hours later, responders
made their final decisions to accept or reject their offers. In the cash treatment, 45 out of 300
offers (15.0%) were initially rejected and 40 offers (13.3%) were rejected 24 hours later; in the
lottery treatment, 36 out of 325 offers (11.1%) were initially rejected and 25 offers (7.7%) were

1 2 3 4 5 6 7 8 9 10 11 12 13 14 15 16 17 18 19 20 21 22 23 24 25 26 27 28 29 30 31 32 33 34 35 36 37 38 39 40 41 42 43 44 45 46 47 48 49 50 51 52 53 54 55 56 57 58 59 60 61 62 63 64 65
4
rejected 24 hours later. When analyses were restricted to low offers (offers of 2 euros), in the
cash treatment, 40 out of 94 offers (42.55%) were initially rejected and 37 (39.4%) were rejected
24 hours later; in the lottery treatment, 31 out of 112 offers (27.7%) were initially rejected and
23 (20.5%) were rejected 24 hours later. When analyses were restricted to the 2 euros (tickets)
offers, time delay was correlated with significantly fewer rejections for the lottery treatment, but
not for the cash treatment. This led the authors to conclude that time delay had no significant
effect on the responders’ behavior in the UG if low stakes were involved.
Third, Grimm and Mengel (2011) separated two methodological features from Oechssler
et al.'s (2008) study: time delay and initial decisions. Proposers decided how to divide 10 Euros
and the proposal was presented immediately to the responders. In the no delay treatment,
responders could respond immediately to the proposal and then completed an approximately 10
minute questionnaire; in the delay treatment with no initial response, responders observed the
proposal, completed the questionnaire, then decided whether to accept or reject; in the delay
treatment with an initial response, responders observed the proposal, decided whether to accept
or reject, completed the questionnaire, then decided whether to revise their decision. When
restricted to very low offers (1 or 2 Euros), the authors find a significant difference between the
no delay and the delay with no initial response treatments, but not between no delay and delay
with an initial response; although aggregated statistics across all types of offers are not available.
2.1. Contributions of our study
Our first two experiment can be distinguished from the above three studies in two ways.
First, while the previous studies focused only on negative reciprocity in the UG, our study uses
two reciprocity games to test whether time delay has an effect on both positive and negative

1 2 3 4 5 6 7 8 9 10 11 12 13 14 15 16 17 18 19 20 21 22 23 24 25 26 27 28 29 30 31 32 33 34 35 36 37 38 39 40 41 42 43 44 45 46 47 48 49 50 51 52 53 54 55 56 57 58 59 60 61 62 63 64 65
5
reciprocity. Second, while the effect of time delay on proposers’ behaviors was not explicitly
examined, our experiments are designed such that all participants are aware of the time delay so
that changes in the first movers’ behaviors can also be studied.
Additionally, given conflicting results from the previous three studies, our experiments
hope to contribute to a more complete understanding regarding whether or not time delays have
an effect on the UG. In particular, we suggest that the non-significant but directionally consistent
findings of Bosman et al. (2001) and Oechssler et al. (2008) should not be over-interpreted.
Bosman et al.’s (2001) study was limited by a small sample size and included rejection rates
close to zero, over which tests for differences in binary outcomes are weak. With the Oechssler
et al. (2008) study, we suggest that its directionally consistent results not be so quickly dismissed
given the other studies discussed whose results are also directionally consistent. Our study
questions whether these findings will still persist in replication and once one corrects for low
power. First, we employ the IG, where we can test the proportion of money returned by
responders rather than a binary outcome. Second, we employ a variant of the UG with
asymmetric payoffs, where the rejection rate is closer to 50% and where tests of binary outcomes
have more power. Finally, our last experiment extends the work of the first two experiments, by
looking more closely at the processes underlying time delay effects, focusing on measuring the
degree to which reflective processing and emotions contribute to the potential effects of time
delays.
3. Predictions
There are at least three ways in which time delay may influence reciprocity: (1) declining
intensity of emotions, (2) increasing loss aversion, and (3) enhancing reflective processing.

1 2 3 4 5 6 7 8 9 10 11 12 13 14 15 16 17 18 19 20 21 22 23 24 25 26 27 28 29 30 31 32 33 34 35 36 37 38 39 40 41 42 43 44 45 46 47 48 49 50 51 52 53 54 55 56 57 58 59 60 61 62 63 64 65
6
3.1. Emotions
Cox et al. (2007) include an explicit emotional state parameter in their model of
reciprocity, suggesting that emotional states directly affect choice. In the IG, fMRI research has
tied reward processing to benevolent sender’s decisions in the IG (King Casas et al., 2005). In
the UG, rejections are commonly believed to be caused by negative emotions, such as anger
(Pillutla & Murnigham, 1996), which is supported by fMRI research that finds greater activation
in areas linked to processing anger and disgust (Sanfey et al., 2003).
Psychologists and economists have treated affective states as transitory (Forgas, 1991),
and have found them to be subject to adaptation (Frederick & Loewenstein,1999). After a time
delay, responders may experience weaker emotions when making their decisions in the IG and
UG, respectively, thus reducing reciprocal behavior. However, Frijda argues that repetition, not
the passage of time, leads to reduced affective intensity (1988). As such, emotions felt at the time
of the original offer may resurface, sustaining the reciprocal behavior.
3.2. Loss aversion
Loss aversion refers to the phenomenon where the loss of a fixed amount relative to a
reference point is seen as qualitatively larger than gaining a similar amount (Kahneman &
Tversky, 1979). This has been used to explain the endowment effect, where an individual places
a higher value on an object he/she owns compared to an identical object he/she does not own
(Thaler, 1980). Kahneman, Knetsch, and Thaler (1990) presented compelling evidence for an
instant endowment effect where object valuation was increased substantially upon possession
and subsequent research has found that this valuation may increase over time (Strahilevitz &
Loewenstein, 1998).

1 2 3 4 5 6 7 8 9 10 11 12 13 14 15 16 17 18 19 20 21 22 23 24 25 26 27 28 29 30 31 32 33 34 35 36 37 38 39 40 41 42 43 44 45 46 47 48 49 50 51 52 53 54 55 56 57 58 59 60 61 62 63 64 65
7
When responders receive an offer in the IG or are initially given money in the UG, they
may see themselves as possessing that money. As time passes, their valuation of this money may
increase, reducing reciprocal behavior.
3.3. Reflective processing
Dual-processing accounts of human behavior (see Evans, 2008 for a review) suggest that
choice is determined by two distinct processing systems, which can account for economic
behavior (Camerer, Loewenstein, & Prelec, 2005). “System 1” involves automatic and intuitive
processes that proceed relatively rapidly, whereas “System 2” involves controlled and reflective
processes that proceed relatively slowly (Schneider & Shiffrin, 1977; Shiffrin & Schneider, 1977;
Stanovich & West, 2000). Notably “System 1” is associated not only with emotions (Epstein,
1994), but other forms of intuitive processing, such as heuristic reasoning.
Time delays should allow greater time for System 2 processing, thus leading to more
economically rational decisions and reduced reciprocity. Previous research has looked at this
aspect of reciprocity. Rubinstein (2008) found no differences in response times for accepting or
rejecting UG offers, suggesting no differences in processing. However, this may have been
confounded by individual differences. Cappelletti, Güth, and Ploner (2008) imposed exogenous
time constraints, limiting System 2 processing, and found that participants under high time
pressure (30s to respond) were more likely to reject offers than those under low time pressure
(180s to respond).
3.4 Predictions
Overall, we expect that second movers, as a consequence of time delay, may experience
weaker emotions, will be under the influence of stronger loss aversion, and will engage in more

1 2 3 4 5 6 7 8 9 10 11 12 13 14 15 16 17 18 19 20 21 22 23 24 25 26 27 28 29 30 31 32 33 34 35 36 37 38 39 40 41 42 43 44 45 46 47 48 49 50 51 52 53 54 55 56 57 58 59 60 61 62 63 64 65
8
reflective processing. In the IG (UG), we expect that positive (negative) emotions triggered by
trusting behavior (low offers) will diminish, attachment to the money sent (offered) will increase,
and more reflective decisions that are likely to yield the subgame-perfect Nash equilibrium will
be more likely. This translates to a lower proportion of money being returned (reduced likelihood
of offers being rejected) by those responders who are making decisions after a time delay. We
consider predictions for the two games separately, to account for the possibility that some of the
mechanisms influencing IG would be different from those influencing UG.
Hypothesis 1: In the presence of time delay, while holding constant the first mover’s
behavior, a responder will return a lower proportion of money and will be less likely to
reject offers in the IG and UG, respectively.
The above prediction concerns the effect of time delay on second movers’ behavior. How
does time delay influence first movers’ behavior? It is critical to recognize that in contrast to
second movers, time delay does not have an experiential aspect for first movers. Rather, a first
mover’s behavior is affected to the degree that she strategically contemplates whether and how
time delay will influence second movers’ behavior and make adjustments accordingly. In the IG
(UG), we expect that senders (proposers), who are aware that responders are making decisions
after a time delay, will send (offer) less money in response to their expectation that those
responders will return a lower proportion of money (are less likely to reject offers).
Hypothesis 2. When a time delay is involved, senders will send less money and proposers
will offer less money in the IG and UG, respectively.
4. Experiment 1: Positive reciprocity in the investment game (IG)

1 2 3 4 5 6 7 8 9 10 11 12 13 14 15 16 17 18 19 20 21 22 23 24 25 26 27 28 29 30 31 32 33 34 35 36 37 38 39 40 41 42 43 44 45 46 47 48 49 50 51 52 53 54 55 56 57 58 59 60 61 62 63 64 65
9
The IG, often referred to as the “trust game,” was first studied experimentally by Berg et
al. (1995), and Van Huyck, Battalio, and Walters (1995), while a similar game was studied
earlier by Camerer and Weigelt (1988). It is a two-player, sequential game that consists of two
stages. One player is designated as the sender and the other player as the responder. The specific
parameters that we adopted for our IG are described below.
At the beginning of the game, the sender and the responder were each endowed with $5.
In the first stage, the sender chose an integer amount S in [0, 5] to send to the responder. Any
positive amount S was tripled by the experimenter so that the responder received the amount 3S.
In the second stage, the responder decided an integer amount R in [0, 5 + 3S] to return to the
sender. Thereafter, the game concluded and the final payoffs of the sender and the responder
were $(5 – S + R) and $(5 + 3S – R), respectively. The traditional game theoretic prediction
entails that S = R = 0.
4.1. Experimental Design
Our design included two treatments (Immediate and Delay) that differed in terms of when
responders selected how much money to return to their senders. The Immediate treatment
corresponds to how the IG is typically implemented in the laboratory.
At the beginning of the experiment, general and game instructions were read aloud by an
experimenter and simultaneously presented on personal computers in individual cubicles. The
entire experiment was programmed and conducted with the z-Tree software (Fischbacher, 2007).
Participants were randomly assigned to be senders or responders in the IG described above, and
each sender was randomly and anonymously paired with a responder. It was emphasized that all

1 2 3 4 5 6 7 8 9 10 11 12 13 14 15 16 17 18 19 20 21 22 23 24 25 26 27 28 29 30 31 32 33 34 35 36 37 38 39 40 41 42 43 44 45 46 47 48 49 50 51 52 53 54 55 56 57 58 59 60 61 62 63 64 65
10
participants would remain anonymous throughout the experiment and that the experiment
involved a one-shot game.
In the Immediate treatment, the sender decided the integer amount S to send. The
responder was immediately informed of S and 3S, and decided the integer amount R to
immediately return. The sender was immediately informed of R. Individual earnings from the
game were revealed, indicating that the game had concluded. Thereafter, subjects were provided
with 15 minutes of free time. Within the 15-minute period, participants were restricted from
communicating or using any communication devices, but were otherwise not restricted in
activity. When 15 minutes had elapsed, participants completed a questionnaire prior to the
conclusion of the experiment.
In the Delay treatment, the sender decided the integer amount S to send. The responder
was immediately informed of S and 3S, but as explained before the game began, would make his
or her decision after a time delay. Thereafter, both movers were provided with 15 minutes of free
time, as described above. After 15 minutes had elapsed, participants continued with the second
stage of the IG. The responder decided the integer amount R to return. The sender was
immediately informed of R. Individual earnings from the game were revealed, indicating that the
game had concluded. Participants then continued to the questionnaire.
Two aspects of our design warrant further mention. First, we provided participants in the
Immediate treatment with 15 minutes of free time, even though that was not absolutely necessary;
participants could have continued to the questionnaire immediately after playing the IG. This
alternative design, however, implies that participants in the Immediate treatment will spend less
time in the experiment and thus receive their earnings earlier. Our design, therefore, reduces

1 2 3 4 5 6 7 8 9 10 11 12 13 14 15 16 17 18 19 20 21 22 23 24 25 26 27 28 29 30 31 32 33 34 35 36 37 38 39 40 41 42 43 44 45 46 47 48 49 50 51 52 53 54 55 56 57 58 59 60 61 62 63 64 65
11
potential concerns that may interfere with interpreting the contrasting behavior between the
treatments.
Second, our time delay is rather short, and takes place entirely in the laboratory. In real-
world interactions, several days or weeks may transpire and economic players may do many
varied things during that time interval. However, our design is motivated by a desire to prevent
communication between participants, which is difficult to do outside the laboratory. Given our
very short and simple time delay manipulation, one might consider our results as offering the
lower bound on the potential influences of lengthier and more natural time delays.
Participants were mainly students from Carnegie Mellon University and the University of
Pittsburgh. A total of 66 individuals participated in the experiment: 17 and 16 pairs in the
Immediate and Delay treatments, respectively. We conducted a total of four sessions, two for
each treatment, and the number of pairs in a session ranged from seven to nine.
Participants received a show-up payment of $5. In addition to their earnings in the IG,
they also earned an additional $2 for answering the demographics questions and a few
questionnaires. All participants completed the experiment within an hour and earned, on average,
$14.52.
4.2. Results
Figures 1A and 1B depict the decisions of both senders and responders in the Immediate
and Delay treatments, respectively. The data were first sorted by the amount sent by senders in
increasing order, followed by the amount returned by responders in increasing order. The
amounts sent, received, and returned are represented by open circles, vertical bars, and filled
circles, respectively. This presentation of the data from the IG follows Berg et al.'s (1995)

1 2 3 4 5 6 7 8 9 10 11 12 13 14 15 16 17 18 19 20 21 22 23 24 25 26 27 28 29 30 31 32 33 34 35 36 37 38 39 40 41 42 43 44 45 46 47 48 49 50 51 52 53 54 55 56 57 58 59 60 61 62 63 64 65
12
example. As the figures show, the amounts sent and returned in both Immediate and Delay
treatments varied considerably, but there appear to be no substantive differences between the two
treatments.
Table 1 provides the summary statistics that allow a direct comparison between
treatments, as well as information on participant demographics and the activities the participants
reported doing (yes or no) during the 15 minute delay. On average, senders sent slightly more in
the Delay treatment ($2.63) than in the Immediate treatment ($2.41), but this did not differ
significantly. On average, responders returned similar amounts without ($1.76) and with ($1.81)
time delay. The proportion of money returned by responders is defined as the amount returned
divided by the amount received (i.e., R/3S); this statistic is indeterminate for the six responders
whose senders sent nothing. From Table 1, the mean proportions of money returned in both
treatments were nearly identical (0.24 and 0.23 in the Immediate and Delay treatments
respectively), providing further evidence that the responders’ behavior was not influenced by
time delay.
Table 2 reports the OLS regressions of the amount sent (Model 1) and the amount
returned by responders (Models 2 and 3). For the latter two models, only those cases in which
the sender sent a positive amount were used. Model 1 confirms that there was no treatment effect
on the senders’ behavior. In Models 2 and 3, the amount returned is increasing in the amount

1 2 3 4 5 6 7 8 9 10 11 12 13 14 15 16 17 18 19 20 21 22 23 24 25 26 27 28 29 30 31 32 33 34 35 36 37 38 39 40 41 42 43 44 45 46 47 48 49 50 51 52 53 54 55 56 57 58 59 60 61 62 63 64 65
13
received, which provides evidence of reciprocity.1 But the Delay treatment has no effect on the
amount returned.2
These low proportions of money returned implied that senders, on average, were
suffering monetary losses. Table 1 shows that senders in the Immediate and Delay treatments
earned $4.35 and $4.19 respectively, which is less than what they would have earned if they
simply pocketed their $5 endowment at the beginning of the game. On the other hand,
responders in the Immediate and Delay treatments earned $10.47 and $11.06 respectively, which
included their $5 endowment at the beginning of the game. The amounts earned by the two roles
did not differ significantly by treatment.3
4.3. Discussion
Contrary to our hypotheses, we find no effect of a time delay on behavior in the IG. The
amounts sent by responders and the subsequent proportions returned are almost identical
between the two treatments. The null result suggests that time delay – at least as implemented in
this experiment – does not yield the hypothesized behavioral effects. Before drawing this
conclusion, however, we explore behavior in the ultimatum game.
5. Experiment 2: Negative reciprocity in the ultimatum game (UG)
1 An alternative interpretation is that responders are simply able to return more money when they receive more.
However, Figure 1 reveals that none of the responders used in the regressions in Table 2 returned the maximum
amount to the sender. 2 We do not include an interaction term between amount received and Delay treatment because of the high
collinearity between the interaction and the Delay treatment variable (the correlation is 0.76). Including the
interaction term does not substantively change the results. Replacing Delay treatment with the interaction term also
does not change the results. 3 We found no significant relationship between the CRT and ZTPI questionnaire scores and subject behavior.

1 2 3 4 5 6 7 8 9 10 11 12 13 14 15 16 17 18 19 20 21 22 23 24 25 26 27 28 29 30 31 32 33 34 35 36 37 38 39 40 41 42 43 44 45 46 47 48 49 50 51 52 53 54 55 56 57 58 59 60 61 62 63 64 65
14
The UG was first studied experimentally by Güth, Schmittberger, and Schwarze (1982).
It is a two-player, sequential game that consists of two stages. One player is designated the
proposer and the other player is designated the responder. Our specific implementation of the
game involved asymmetric values for the good being divided. The specific parameters that we
adopted are described below.
Our choice of a UG with asymmetric values was intended to circumvent the
aforementioned power concerns in previous studies (Bosman et al., 2001; Oechssler et al., 2008).
Recall that rejection rates in the baseline (no delay) conditions of these prior studies were quite
low, potentially making it difficult to detect the effects of time delay, particularly if they are
likely to reduce the rejection rate as hypothesized. Our design achieves a higher baseline
rejection rate by introducing asymmetric values for the proposer and the responder. The UG used
here is primarily informed by the experiment conducted by Kagel, Kim, and Moser (1996).
Kagel et al. (1996) varied both information and payoff structures to gain insight into the
nature of fairness considerations in the UG. Of particular interest is the treatment where the
proposer and the responder bargained over 100 chips and both had common knowledge that each
chip was worth $0.30 and $0.10 to the proposer and the responder, respectively. Under such
asymmetry, proposers and responders might be motivated by self-serving notions of fairness
(Babcock & Loewenstein, 1997; Thompson & Loewenstein, 1992).4 Participants played that UG
4 In this asymmetric UG, proposers benefit if fairness is interpreted as an equal division of chips rather than an equal
division of money, while responders favor the alternative interpretation. Under an equal division of chips, the
proposer receives 50 chips valued at $15 and the responder receives 50 chips valued at $5. Under an equal division
of money, the proposer receives 25 chips valued at $7.50, while the responder receives equal value from 75 chips.

1 2 3 4 5 6 7 8 9 10 11 12 13 14 15 16 17 18 19 20 21 22 23 24 25 26 27 28 29 30 31 32 33 34 35 36 37 38 39 40 41 42 43 44 45 46 47 48 49 50 51 52 53 54 55 56 57 58 59 60 61 62 63 64 65
15
for 10 periods with perfect stranger matching. The authors reported a rejection rate of 39%
across the 10 periods and a rejection rate of 52% for the first three periods. These rejection rates
are much higher than that in the standard UG.5
5.1. Experimental Design
The procedures were almost identical to those employed for Experiment 1, except that we
used the asymmetric UG described below instead of the IG. The treatment variable, time delay,
was implemented as in Experiment 1.
Following general instructions, participants received instructions describing the UG. The
proposer and the responder were informed that there were 100 chips to be divided between them
and that each chip was worth $0.15 to the proposer and $0.05 to the responder. In the first stage,
the proposer offered an integer number of chips C in [0, 100] to the responder, thereby proposing
to keep the remaining (100 – C) chips. In the second stage, the responder decided either to accept
or reject the offer. If the responder accepted the offer, the proposer received (100 – C) chips
valued at $(15 – 0.15C), and the responder received C chips valued at $0.05C; if the responder
rejected the offer, neither the proposer nor the responder received any chips, and thus received
no earnings. Thereafter, the game concluded.
A total of 86 individuals participated in the experiment: 22 and 21 pairs in the Immediate
and Delay treatments, respectively. A total of six sessions, three for each treatment, was
5 A more recent study, however, found lower rejection rates with the asymmetric UG (Gneezy & Güth, 2003). In one
of their treatments, the proposer and the responder bargained over 100 chips and both had common knowledge that
each chip was worth $0.40 and $0.20 to the proposer and the responder respectively. Participants played that UG
once and only 2 out of 16 offers (12.5%) were rejected. The authors suggested that the dramatically lower rejection
rate might be attributed to the less asymmetric ratio in chip values for their treatment.

1 2 3 4 5 6 7 8 9 10 11 12 13 14 15 16 17 18 19 20 21 22 23 24 25 26 27 28 29 30 31 32 33 34 35 36 37 38 39 40 41 42 43 44 45 46 47 48 49 50 51 52 53 54 55 56 57 58 59 60 61 62 63 64 65
16
conducted and the number of pairs in a session ranged from six to nine. Recruitment and
experimental procedures were identical to those in Experiment 1. We administered the same
questionnaires from Experiment 1. Participants earned, on average, $10.54.
5.2. Results
Figure 2 depicts the decisions by proposers and responders in each pair in the Immediate
(Figure 2A) and Delay (Figure 2B) treatments of the UG. The data were first sorted by the
number of chips offered by proposers in increasing order, followed by the responders’ decisions
with rejections displayed first. Offers accepted and rejected are represented by white and black
vertical bars respectively. A summary of the data, by treatment and role, is presented in Table 3.
The number of chips offered in both Immediate and Delay treatments varied considerably.
Consistent with prior UG experiments and the notion of negative reciprocity, rejections typically
occurred when the number of chips offered was relatively small. Comparing Figures 2A and 2B,
the frequency of rejections, considering all offers, was lower in the Delay treatment (14%) than
in the Immediate treatment (41%), suggesting that the time delay influenced the responders’
behavior as we predicted. The difference in the rejection frequencies is statistically significant in
a non-parametric chi-square test (χ2(1) = 3.79, p = 0.05).
Despite the lower rejection rate given a time delay, proposers offered similar numbers of
chips, on average, in the Immediate (43.50) and Delay (45.81) treatments. Thus, responders did
not appear to adjust for the responders’ increased willingness to accept low offers given a time
delay. This is confirmed in Model 1 of Table 4, which regresses the amount sent by proposers in
the Delay treatment and demographic control variables, finding no significant relationships.

1 2 3 4 5 6 7 8 9 10 11 12 13 14 15 16 17 18 19 20 21 22 23 24 25 26 27 28 29 30 31 32 33 34 35 36 37 38 39 40 41 42 43 44 45 46 47 48 49 50 51 52 53 54 55 56 57 58 59 60 61 62 63 64 65
17
Table 4 also confirms that responders were significantly less likely to reject offers in the
Delay treatment. Models 2 and 3 reports the marginal effects coefficients for a probit regression
of the responders’ decisions to accept or reject. The negative coefficient for chips offered
indicates reciprocity: responders were 1.4% less likely to reject for every additional chip offered.
According to Model 3 and consistent with our hypothesis, responders were 30% less likely to
reject offers in the Delay treatment.6
The lower rejection rates in the Delay treatment suggests that both proposers and
responders might have earned more money, on average, than their respective counterparts in the
Immediate treatment. Table 3 shows that proposers in the Delay treatment earned $2.39 more
than those in the Immediate treatment, and this difference is statistically significant in a non-
parametric rank-sum test (z = 1.95, p = 0.05). Similarly, responders in the Delay condition
earned $0.53 more, on average, but this difference is not statistically significant.
5.3. Discussion
In Experiment 1, we did not find that time delay affected rejection rates in the IG;
however, in Experiment 2, we found that time delay may lead to less rejections in the UG. A
potential concern regarding the exogenously imposed time delay is that second movers in the
Delay treatment may be susceptible to demand effects. In other words, they might wonder why
their decisions were made 15 minutes later and hence reasoned that changes to their behavior
6 As with Table 2, we do not include an interaction term between chips offered and Delay treatment because of the
high collinearity between the interaction and the Delay treatment variable (the correlation is 0.87). Not surprisingly,
including both the interaction term and the Delay treatment variable results in statistical insignificance for both
coefficients. However, if we include only the interaction term (and not the Delay treatment variable), this coefficient
is negative and similar in statistical significance to the Delay treatment variable in Model 3.

1 2 3 4 5 6 7 8 9 10 11 12 13 14 15 16 17 18 19 20 21 22 23 24 25 26 27 28 29 30 31 32 33 34 35 36 37 38 39 40 41 42 43 44 45 46 47 48 49 50 51 52 53 54 55 56 57 58 59 60 61 62 63 64 65
18
were expected. The unintended null finding in the IG guards against this criticism to some extent
because it is reasonable to assume that demand effects should be similar for both reciprocity
games.
Previously, we presented three reasons why time delay might mitigate the tendency to
behave reciprocally in the IG and UG: strengthened loss aversion/endowment effect, declining
intensity of emotions, and reflective processing. The different effects of time delay across these
two games provide stronger support for some of these reasons than others.
There is little reason for supposing that loss aversion/endowment effect’s influence
would differ between the reciprocity games. In both games, the responder should have become
accustomed to a new reference point – possessing the offered money. As we find significant
effects in the UG but not in the IG, we do not find strong support for loss aversion and the
endowment effect.
On the other hand, there is some suggestion that reflective processing may account for
the differences. At face value, responding to an UG offer involves a more straightforward
decision than the IG. Research in the latter has shown that altruism, inequity aversion, and
positive reciprocity all play a significant role in the responders’ behavior (Charness & Haruvy,
2002; Cox, 2004). Social and moral norms that differ across individuals, religions, and cultures
have also been found to substantially influence the responders’ behavior (Camerer, 2003). This
inherent complexity may naturally induce more reflexive processing in the no delay treatment for
IG, but not in the UG – leading to reduced differences in the IG when time delays are enforced.
Our use of the asymmetric UG, under which there are multiple divisions of the initial endowment
that may be considered fair, should increase the complexity of the UG and therefore reduce

1 2 3 4 5 6 7 8 9 10 11 12 13 14 15 16 17 18 19 20 21 22 23 24 25 26 27 28 29 30 31 32 33 34 35 36 37 38 39 40 41 42 43 44 45 46 47 48 49 50 51 52 53 54 55 56 57 58 59 60 61 62 63 64 65
19
differences between our IG and UG experiments. Moreover, Oxoby and McLeish (2004) find no
difference when participants are asked to consider responses to all possible offers prior to
playing the UG (the strategy vector method) and when participants engage in the UG in the
normal sequence; despite the greater reflexive processing imposed by the strategy vector method.
Given these considerations, it seems that reflexive processing alone may not sufficiently explain
our observed results.
Lastly, we find stronger support for the role of emotions. Previous research supports the
hypothesis that the rejections of low offers in the UG are predominantly driven by negative
emotions (Pillutla & Murnighan, 1996; Sanfey et al., 2003); however, the diverse motivations of
the responders’ behavior in the IG just discussed may induce a less affective response. In
addition, since senders are almost certainly sending money as a means to potentially gain more,
some responders may not interpret transfers by senders as trusting behavior and consequently
only experience relatively weak positive emotions, if any at all. Given the assortment of
motivations underlying responder behavior in the IG and the less consequential role of positive
emotions, the non-significant effect of time delay is no longer as perplexing. Moreover, the
emotion explanation is also consistent with Oxoby and McLeish's (2004) study, if participants
can anticipate their emotional responses to hypothetical scenarios (Mellers, Schwartz, & Ritov,
1999; Robinson & Clore 2001). We conjecture that the negative emotions produced by receiving
a low offer in the UG, and which regularly leads to rejection in our Immediate treatment,
diminish when the responder is forced to delay making a choice.
To better understand the contributions of these factors, we attempt to measure these in the
UG in a third experiment.

1 2 3 4 5 6 7 8 9 10 11 12 13 14 15 16 17 18 19 20 21 22 23 24 25 26 27 28 29 30 31 32 33 34 35 36 37 38 39 40 41 42 43 44 45 46 47 48 49 50 51 52 53 54 55 56 57 58 59 60 61 62 63 64 65
20
6. Experiment 3: Processes of negative reciprocity with time delay in the ultimatum game
(UG)
Bosman et al. (2001) found that emotions appeared to play an important role in
ultimatum game rejections. Specifically, negative emotions were correlated with lower offers;
responders who expected higher offers reported more anger, irritation, and envy; and reports of
anger, contempt, irritation, envy, and sadness were correlated with more rejections. However,
they found no evidence of time delay affecting emotions and thus rejected emotional cooling off
as a process that could affect ultimatum game behavior, and noted that emotions may “resurface”
(Frijda, 1988) when responders in the time delay condition are asked to make their final decision.
Evidence from our Experiments 1 and 2 and continued concerns about statistical power
prompted us to rerun the analysis with several modifications. First, we wanted to recruit a
substantially larger sample. Second, we wanted to include emotions believed to be sensitive to
more subtle changes in emotional states. For example, we suspected a scale point difference in
“anger” may represent a bigger change in emotional state than a scale point difference in
“frustration,” and thus lead to reduced measurement precision and increased measurement error.
Finally, research suggests that behavior in the ultimatum game can be affected by incidental
emotions such as sadness (Harlé & Sanfey 2007) and disgust (Bonini et al. 2011). To control for
these effects, we wanted to ask participants to describe both their emotions when making the
decision, as well as emotions experienced in the week prior to the experiment.
In addition, to measure reflective processing we asked responders to explain why they
chose to accept or reject the offer. We use the length of their response in the form of a word
count to assess the responder’s reflective processing.

1 2 3 4 5 6 7 8 9 10 11 12 13 14 15 16 17 18 19 20 21 22 23 24 25 26 27 28 29 30 31 32 33 34 35 36 37 38 39 40 41 42 43 44 45 46 47 48 49 50 51 52 53 54 55 56 57 58 59 60 61 62 63 64 65
21
6.1. Experimental Design
Procedures were similar to the asymmetric UG from Experiment 2. Immediately after
responding to the offer, we asked responders to answer an open-ended question regarding why
they chose to accept or reject the offer. Following the open-ended question, we asked responders
“the extent to which [they] felt the following emotions when deciding how to respond to the
offer” and “over the past week, not including during the survey.” The emotions included: angry,
frustrated, insulted, disappointed, happy, grateful, satisfied, confident, shocked, and surprised.
Responses ranged from 1 (“Not at all”) to 7 (“Extremely”).
In addition, to increase our sample size, we administered the game online through
Amazon mTurk. This required two notable changes in our design. First, while the proposer and
responder were informed that 100 chips were to be divided between them, as before, each chip
was now worth $0.03 to the proposer and $0.01 to the responder. These values were selected to
be in line with the payments commonly given on mTurk. Second, as it was more difficult to
monitor participants online, we provided participants with an unrelated task to perform during
the 15 minute time delay in which participants had to interpret a graph describing the rate of
people entering and leaving a department store. Performance in that task was not incentivized.
A total of 344 individuals completed the experiment: 88 and 84 pairs in the Immediate
and Delay treatments, respectively. Recruitment was performed through Amazon mTurk.
Participants were 53% male, had a median age of 25, and predominantly resided in the United
States (73%) and India (22%). In addition to their earnings in the UG, participants received a
show-up payment of $1. In total, participants earned, on average, $1.63.
6.2. Results

1 2 3 4 5 6 7 8 9 10 11 12 13 14 15 16 17 18 19 20 21 22 23 24 25 26 27 28 29 30 31 32 33 34 35 36 37 38 39 40 41 42 43 44 45 46 47 48 49 50 51 52 53 54 55 56 57 58 59 60 61 62 63 64 65
22
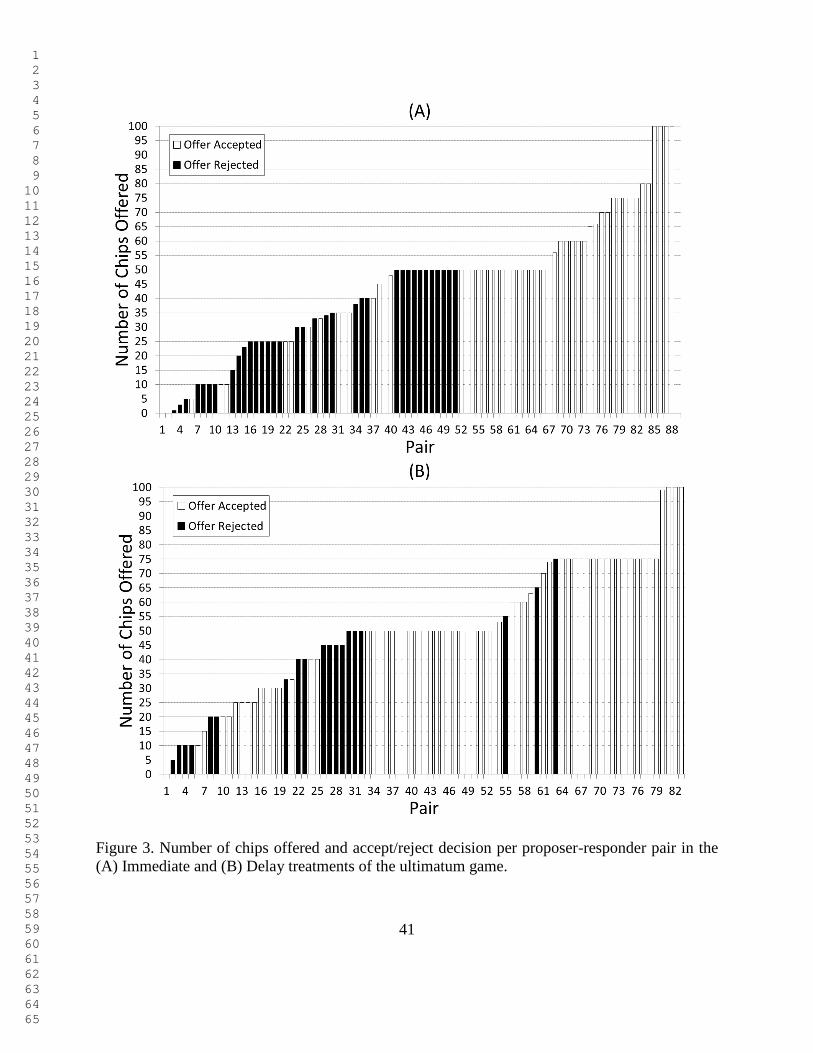
Figure 3 depicts the decisions by proposers and responders in each pair in the Immediate
(Figure 3A) and Delay (Figure 3B) treatments of the UG. Offers accepted and rejected are
represented by white and black vertical bars respectively. A summary of the data, by treatment
and role, is presented in Table 5. Comparing Figures 3A and 3B, the frequency of rejections was
lower in the Delay treatment (25%) than in the Immediate treatment (42%), suggesting that the
time delay influenced the responders’ behavior as predicted. The difference in the rejection
frequencies is statistically significant in a non-parametric chi-square test (χ2(1) = 5.59, p = 0.02).
In this experiment, we do see a suggestion that proposers may offer fewer chips in the
Immediate (44.01) than in the Delay (50.00) treatments, although the significance is low. This
difference is in the opposite direction as we had initially predicted.
In Models 2 and 3 of Table 5, we reproduce our findings that responders were less likely
to reject offers in the Delay treatment, although the significance is lower than observed in
Experiment 2. The negative coefficient for chips offered indicates reciprocity: responders were
1.2% less likely to reject for every additional chip offered. According to Model 3 and consistent
with our hypothesis, responders were 13% less likely to reject offers in the Delay treatment.
Models 4, 5, and 6 consider the contribution of emotion and reflexive processing. Model
4 was developed using all the emotion measures and word count, which we used to measure
reflexive processing. Model 5 and Model 6 were determined using model selection that
minimized AIC and BIC, respectively. Word count does not appear significantly correlated in
Model 4 and the parameter is dropped by the model selection process in Models 5 and 6. Three
emotions appear correlated to rejections across all models: increased reports of insult and of
confidence and decreased reports of satisfaction are correlated with increased rejection. In

1 2 3 4 5 6 7 8 9 10 11 12 13 14 15 16 17 18 19 20 21 22 23 24 25 26 27 28 29 30 31 32 33 34 35 36 37 38 39 40 41 42 43 44 45 46 47 48 49 50 51 52 53 54 55 56 57 58 59 60 61 62 63 64 65
23
Models 4 and 5, decreased reports of disappointment are correlated with increased rejection.
Reports of anger and frustration do not appear to have a significant effect on rejections. The
effect of the delay treatment becomes non-significant in Models 4 and 5, and the delay treatment
is removed as a dependent variable in Model 6.
Due to multicollinearity concerns, we also tested the effect of each emotion
independently using independent probit regressions, with only demographic and treatment
variables as covariates, included in Table 7. We find that increased reports of anger, frustration,
injury, and shock and decreased reports of happiness, gratefulness, and satisfaction are correlated
to increased rejections.
Table 8 considers the relationship between reflective processing and emotions to our
treatments and demographic variables. Using an OLS regression, we find that larger offers are
correlated with decreased reports of feeling angry, frustrated, insulted, disappointed, and shocked;
and increased reports of feeling happy, grateful, satisfied, and surprised. The delay treatment is
correlated with decreased reports of feeling disappointed and surprised; and increased reports of
feeling satisfied. Reported feelings of each of these emotions over the past week are shown to
significantly influence feelings at the time of the decision. Similar findings hold when running
the analysis using an ordered logistic model. We also find that the delay treatment is correlated
with longer explanations in the responders’ decision.
7. Discussion and conclusions
In the IG, we found no significant evidence that time delay was correlated with either the
senders’ or the responders’ behavior. In the UG, we found evidence that time delay was
significantly correlated to decreased rejections by responders, and mixed evidence that time

1 2 3 4 5 6 7 8 9 10 11 12 13 14 15 16 17 18 19 20 21 22 23 24 25 26 27 28 29 30 31 32 33 34 35 36 37 38 39 40 41 42 43 44 45 46 47 48 49 50 51 52 53 54 55 56 57 58 59 60 61 62 63 64 65
24
delay was correlated to more generous offers from the proposer. In the UG, we further found
that time delay was correlated to increased reported satisfaction and decreased reported
disappointment, with reported satisfaction appearing to partially mediate the effect of the
reduced rejection and reported disappointment playing a potentially more complex role. In
particular, disappointment was non-significantly correlated with increased probability of
rejection when analyzed without other emotional covariates but with a decreased probability of
rejection when other emotions were included. We suspect that this arises from two different
sources of disappointment. The first source is from receiving a lower than expected offer and is
captured by the other measures of emotion in our model. The second source is from conceding
to a lower than expected offer.
A post hoc consideration of satisfaction and disappointment suggests an alternative to
how time delay affects emotions. Both emotions are closely linked to meeting or failing to meet
expectations. Bosman et al. (2001) found that responders who had expected higher offers
reported more anger, irritation, and envy, which were all correlated with increased rejections of
offers. In the time delay treatments, increased satisfaction and reduced disappointment may have
resulted from reduced expectations. As such the reduced rejections may be attributed to a change
in the emotional stimulus, rather than the waning of experienced emotions as suggested by
traditional cooling off accounts.
We find little evidence of increased loss aversion or increased reflective processing as
contributing to reduced rejections in the IG. For loss aversion, we would expect time delay to
affect both the IG and UG; however, our experiments find an effect only in the UG, contrary to
loss aversion predictions. For reflective processing, we do find evidence of greater reflective

1 2 3 4 5 6 7 8 9 10 11 12 13 14 15 16 17 18 19 20 21 22 23 24 25 26 27 28 29 30 31 32 33 34 35 36 37 38 39 40 41 42 43 44 45 46 47 48 49 50 51 52 53 54 55 56 57 58 59 60 61 62 63 64 65
25
processing given a time delay in the form of longer explanations; however, longer explanations
do not appear correlated with decreased rejections. Thus more thought about the decision does
not appear to lead to more economically rational behavior.
Regarding the proposer in the UG, we found mixed evidence of the effect of time delay,
with no significant effect in Experiment 2 and a marginally significant effect of more generous
offers in Experiment 3. As such, we cannot conclusively state whether or not proposers change
their behavior when faced with a time delay. If they do, Experiment 3 suggests that they respond
in a way that is inconsistent with increasing their expected outcome.
However, we must be cautious about our conclusions given that our implementation of
the UG and IG differ in more ways than the nature of the reciprocity. For example, the
responders’ decisions in our IG were almost continuous, whereas the responders’ decisions in
our UG were binary. Despite these differences, we believe that selecting variants of the UG and
IG that are similar to previous research allows our findings to be more easily integrated and
applied to what we currently know. With this as a basis, a greater understanding of the
phenomenon can be developed by further varying how they time delay and the strategic games
are implemented.

1 2 3 4 5 6 7 8 9 10 11 12 13 14 15 16 17 18 19 20 21 22 23 24 25 26 27 28 29 30 31 32 33 34 35 36 37 38 39 40 41 42 43 44 45 46 47 48 49 50 51 52 53 54 55 56 57 58 59 60 61 62 63 64 65
26
Acknowledgements
This research was partially supported by the National Science Foundation (Human and Social
Dynamics: Decision, Risk, and Uncertainty, Award number: 0624228) to Cleotilde Gonzalez.
We are especially grateful to John Duffy and the University of Pittsburgh for providing access to
the Pittsburgh Experimental Economics Laboratory (PEEL). Valuable comments by John Miller
and Erte Xiao improved this paper and are much appreciated.

1 2 3 4 5 6 7 8 9 10 11 12 13 14 15 16 17 18 19 20 21 22 23 24 25 26 27 28 29 30 31 32 33 34 35 36 37 38 39 40 41 42 43 44 45 46 47 48 49 50 51 52 53 54 55 56 57 58 59 60 61 62 63 64 65
27
References
Babcock, L., & Loewenstein, G. (1997). Explaining bargaining impasse: The role of self-serving
biases. Journal of Economic Perspectives, 11(1), 109-126.
Berg, J., Dickhaut, J., & McCabe, K. (1995). Trust, reciprocity, and social history. Games and
Economic Behavior, 10(1), 122-142.
Bonini, N., Hadjichristidis, C., Mazzocco, K, Demattè, M., Zampini, L., Massimiliano, S.,
Sbarbati, A., & Magon, S. (2011) Pecunia olet: The role of incidental disgust in the
ultimatum game. Emotion 11(4), 965-969.
Bosman, R., Sonnemans, J., & Zeelenberg, M. (2001). Emotions, rejections, and cooling off in
the ultimatum game. Unpublished manuscript. Retrieved from
http://www1.fee.uva.nl/creed/pdffiles/coolingoff.pdf
Camerer, C. F. (2003). Behavioral game theory: Experiments in strategic interaction. Princeton,
NJ: Princeton University Press.
Camerer, C., Loewenstein, G., & Prelec, D. (2005). Neuroeconomics: How neuroscience can
inform economics. Journal of Economic Literature, 43(1), 9-64.
Camerer, C., & Weigelt, K. (1998). Experimental tests of a sequential equilibrium reputation
model. Econometrica, 56(1), 1-36.
Cappelletti, D., Güth, W., & Ploner, M. (2008). Being of two minds: An ultimatum experiment
investigating affective processes. Jena Economic Research Papers, 2008-048.
Charness, G., & Haruvy, E. (2002). Altruism, equity, and reciprocity in a gift-exchange
experiment: An encompassing approach. Games and Economic Behavior, 40(2), 203-231.
Cox, J. C. (2004). How to identify trust and reciprocity. Games and Economic Behavior, 46(2),
260-281.
Cox, J. C., Friedman, D., & Gjerstad, S. (2007). A tractable model of reciprocity and fairness.
Games and Economic Behavior, 59(1), 17-45.
Dufwenberg, M., & Kirchsteiger, G. (2004). A theory of sequential reciprocity. Games and
Economic Behavior, 47(2), 268-298.
Evans, J. B. T. (2008). Dual-processing accounts of reasoning, judgment, and social cognition.
Annual Review of Psychology, 59, 255-278.
Epstein, S. (1994). Integration of the cognitive and psychodynamic unconscious. American
Psychologist, 49(8), 709-724.
Falk, A. (2007). Charitable giving as a gift exchange: Evidence from a field experiment.
Econometrica, 75(5), 1501-1511.
Falk, A., & Fischbacher, U. (2006). A theory of reciprocity. Games and Economic Behavior,
54(2), 293-315.
Fehr, E., & Fischbacher, U. (2002). Why social preferences matter – The impact of non-selfish
motives on competition, cooperation and incentives. Economic Journal, 112(478), C1-
C33.
Fehr, E., & Gächter, S. (2000). Fairness and retaliation: The economics of reciprocity. Journal of
Economic Perspectives, 14(3), 159-181.
Fischbacher, U. (2007). z-Tree: Zurich toolbox for ready-made economic experiments.
Experimental Economics, 10(2), 171-178.

1 2 3 4 5 6 7 8 9 10 11 12 13 14 15 16 17 18 19 20 21 22 23 24 25 26 27 28 29 30 31 32 33 34 35 36 37 38 39 40 41 42 43 44 45 46 47 48 49 50 51 52 53 54 55 56 57 58 59 60 61 62 63 64 65
28
Forgas, J. P. (1991). Affect and social judgments: An introductory review. In J. P. Forgas (Ed.),
Emotion and social judgments (pp. 3-30). Elmsford, NY: Pergamon Press.
Frederick, S., Loewenstein, G. (1999) Hedonic Adaptation. In D. Kahneman, E. Diener & N.
Schwartz (Eds.) Well-being: The foundations of hedonic psychology. (pp. 302-329). New
York, NY: Russell Sage Foundation.
Frijda, N. (1988). The laws of emotion. American Psychologist, 5, 349-58.
Gneezy, U., & Güth, W. (2003). On competing rewards standards – An experimental study of
ultimatum bargaining. Journal of Socio-Economics, 31(6), 599-607.
Greenberg, J. (1990). Employee theft as a reaction to underpayment inequity: The hidden cost of
pay cuts. Journal of Applied Psychology, 75(5), 561-568.
Grimm, V., & Mengel, F. (2011). Let me sleep on it: Delay reduces rejection rates in ultimatum
games. Economic Letters, 111(2), 113-115.
Güth, W., Schmittberger, R., & Schwarze, B. (1982). An experimental analysis of ultimatum
bargaining. Journal of Economic Behavior and Organization, 3(4), 367-388.
Harlé, K. M. & Sanfey, A. G. (2007). Incidental sadness biases social economic decisions in
ultimatum game. Emotion, 7(4), 876-881.
Kagel, J. H., Kim, C., & Moser, D. (1996). Fairness in ultimatum games with asymmetric
information and asymmetric payoffs. Games and Economic Behavior, 13(1), 100-110.
Kahneman, D., Knetsch, J. L., & Thaler, R. H. (1990). Experimental tests of the endowment
effect and the Coase theorem. Journal of Political Economy, 98(6), 1325-1348.
Kahneman, D., & Tversky, A. (1979). Prospect theory: An analysis of decision under risk.
Econometrica, 47(2), 263-291.
King-Casas, B., Tomlin, D., Anen, C., Camerer, C. F., Quartz, S. R., & Montague, P. R. (2005).
Getting to know you: Reputation and trust in a two-person economic exchange. Science,
308, 78-83.
Kube, S., Marechal, M., & Puppe, C. (2010). Do wage cuts damage work morale: Evidence from
a natural field experiment. Unpublished manuscript. Retrieved from
http://papers.ssrn.com/sol3/papers.cfm?abstract_id=1547823
Lawler, E. J. (2001). An affect theory of social exchange. American Journal of Sociology, 107(2),
321-352.
Lawler, E. J., & Yoon, J. (1998). Network structure and emotion in exchange relations. American
Sociological Review, 63(6), 871-894.
Mellers, B., Schwartz, A., & Ritov, I. (1999). Emotion-based choice. Journal of Experimental
Psychology: General, 128(3), 332-345.
Oechssler, J., Roider, A., & Schmitz, P. W. (2008). Cooling-off in negotiations – Does it work?
Unpublished manuscript. Retrieved from http://www.awi.uni-
heidelberg.de/with2/theorie2/ors_ultimatum.pdf
Oxoby, R. J., & McLeish, K. N. (2004). Sequential decision and strategy vector methods in
ultimatum bargaining: evidence on the strength of other-regarding behavior. Economic
Letters, 84(3), 399-405.
Pillutla, M. M., & Murnighan, J. K. (1996). Unfairness, anger, and spite: Emotional rejections of
ultimatum offers. Organizational Behavior and Human Decision Processes, 68(3), 208-
224.

1 2 3 4 5 6 7 8 9 10 11 12 13 14 15 16 17 18 19 20 21 22 23 24 25 26 27 28 29 30 31 32 33 34 35 36 37 38 39 40 41 42 43 44 45 46 47 48 49 50 51 52 53 54 55 56 57 58 59 60 61 62 63 64 65
29
Robinson, M. D., & Clore, G. L. (2001). Simulation, scenarios, and emotional appraisal: testing
the convergence of real and imagined reactions to emotional stimuli. Personality and
Social Psychology Bulletin, 27(11), 1520-1532.
Rubinstein, A. (2008). Instinctive and cognitive reasoning: A study of response times. The
Economic Journal, 117(523), 1243-1259.
Sanfey, A. G., Rilling, J. K., Aronson, J. A., Nystrom, L. E., & Cohen, J. D. (2003). The neural
basis of economic decision-making in the ultimatum game. Science, 300, 1755-1758.
Schneider, W., & Shiffrin, R. M. (1977). Controlled and automatic human information
processing: I. Detection, search, and attention. Psychological Review, 84(1), 1-66.
Shiffrin, R. M., & Schneider, W. (1977). Controlled and automatic human information
processing: II. Perceptual learning, automatic attending, and a general theory.
Psychological Review, 84(2), 127-190.
Stanovich, K. E., & West, R. F. (2000). Individual differences in reasoning: Implications for the
rationality debate? Behavioral and Brain Sciences, 23(5), 645-726.
Strahilevitz, M. A., & Loewenstein, G. (1998). The effect of ownership history on the valuation
of objects. Journal of Consumer Research, 25, 276-289.
Thaler, R. (1980). Toward a positive theory of consumer choice. Journal of Economic Behavior
and Organization, 1(1), 39-60.
Thompson, L., & Loewenstein, G. (1992). Egocentric interpretations of fairness and
interpersonal conflict. Organizational Behavior and Human Decision Processes, 51(2),
176-197.
Tidd, K. L., & Lockard, J. S. (1978). Monetary significance of the affiliative smile: A case for
reciprocal altruism. Bulletin of the Psychonomic Society, 11(6), 344-346.
Van Huyck, J. B., Battalio, R. C., & Walters, M. F. (1995). Commitment versus discretion in the
peasant-dictator game. Games and Economic Behavior, 10(1), 143-170.

1 2 3 4 5 6 7 8 9 10 11 12 13 14 15 16 17 18 19 20 21 22 23 24 25 26 27 28 29 30 31 32 33 34 35 36 37 38 39 40 41 42 43 44 45 46 47 48 49 50 51 52 53 54 55 56 57 58 59 60 61 62 63 64 65
30
Table 1. Summary of means for Experiment 1 (IG)
Immediate treatment Delay treatment
Sender Responder Sender Responder
Investment Game
Amount sent ($) 02.41 (1.66) 02.63 (1.67)
Amount returned ($) 01.76 (2.56) 01.81 (2.34)
Proportion returned 00.24 (0.19)a 00.23 (0.22)
a
Earnings ($) 04.35 (2.15) 10.47 (4.16) 04.19 (2.26) 11.06 (4.58)
Delay Activities
Email 0.47 0.82 0.44 0.50
School work 0.24 0.18 0.19 0.13
Drink 0.00 0.06 0.13 0.00
Eat 0.00 0.06 0.06 0.00
Listen to music 0.06 0.00 0.06 0.00
Plan/organize schedule 0.12 0.29 0.19 0.25
Recreational reading 0.06 0.24 0.06 0.06
School reading 0.12 0.06 0.06 0.19
Rest 0.24 0.06 0.13 0.38
Surf the internet 0.53 0.59 0.44 0.50
Think about the game 0.35 0.35 0.31 0.56
Other 0.12 0.24 0.13 0.06
Demographics
Age 20.35 (2.67) 22.24 (7.48) 26.94 (15.41) 20.38 (1.86)
Gender (Male) 00.53 00.47 00.44 00.50
Note. Numbers in parentheses are standard errors. a This statistic was computed for responders whose senders sent a non-zero amount of money.

1 2 3 4 5 6 7 8 9 10 11 12 13 14 15 16 17 18 19 20 21 22 23 24 25 26 27 28 29 30 31 32 33 34 35 36 37 38 39 40 41 42 43 44 45 46 47 48 49 50 51 52 53 54 55 56 57 58 59 60 61 62 63 64 65
31
Table 2. Relationship of sender and responder behavior to treatment and demographics for
Experiment 1 (IG)
Model: OLS
Player: Sender Responder
Dependent variable: Amount sent Amount returned
(1) (2) (3)
Amount received 0.277**
0.280*
(0.132) (0.136)
Delay treatment -0.333 -0.160
(0.626) (0.957)
Age -0.017 0.256 0.255
(0.028) (0.226) (0.760)
Gender (Male) 0.117 -0.711 -0.723
(0.598) (0.957) (0.980)
Constant 2.689 -5.202 -5.132
(0.773) (4.844) (4.966)
Number of observations 33 27 27
R2 0.017 0.189 0.190
Note. Numbers in parentheses are standard errors of parameter estimates; Models 2 and 3 include
only data from responders who received positive amounts. * p < 0.1,
** p < 0.05,
*** p < 0.01, all two-tailed
1 2 3 4 5 6 7 8 9 10 11 12 13 14 15 16 17 18 19 20 21 22 23 24 25 26 27 28 29 30 31 32 33 34 35 36 37 38 39 40 41 42 43 44 45 46 47 48 49 50 51 52 53 54 55 56 57 58 59 60 61 62 63 64 65
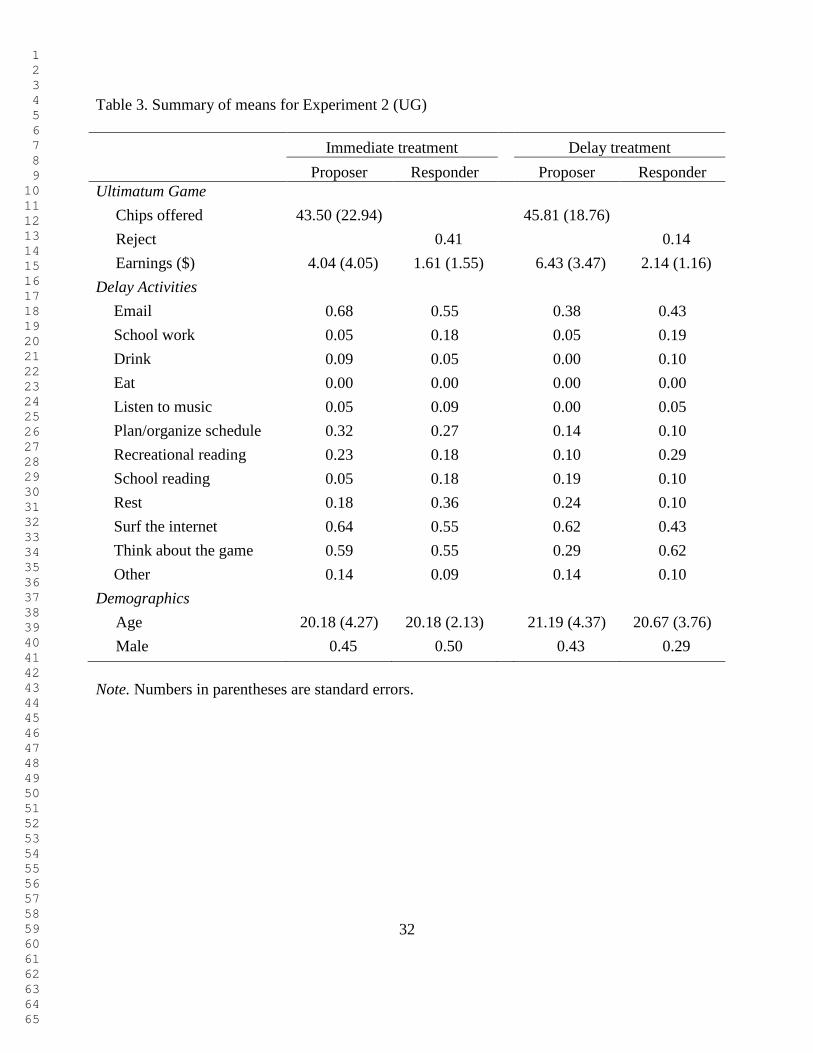
32
Table 3. Summary of means for Experiment 2 (UG)
Immediate treatment Delay treatment
Proposer Responder Proposer Responder
Ultimatum Game
Chips offered 43.50 (22.94) 45.81 (18.76)
Reject 00.41 00.14
Earnings ($) 04.04 (4.05) 01.61 (1.55) 06.43 (3.47) 02.14 (1.16)
Delay Activities
Email 0.68 0.55 0.38 0.43
School work 0.05 0.18 0.05 0.19
Drink 0.09 0.05 0.00 0.10
Eat 0.00 0.00 0.00 0.00
Listen to music 0.05 0.09 0.00 0.05
Plan/organize schedule 0.32 0.27 0.14 0.10
Recreational reading 0.23 0.18 0.10 0.29
School reading 0.05 0.18 0.19 0.10
Rest 0.18 0.36 0.24 0.10
Surf the internet 0.64 0.55 0.62 0.43
Think about the game 0.59 0.55 0.29 0.62
Other 0.14 0.09 0.14 0.10
Demographics
Age 20.18 (4.27) 20.18 (2.13) 21.19 (4.37) 20.67 (3.76)
Male 00.45 00.50 00.43 00.29
Note. Numbers in parentheses are standard errors.

1 2 3 4 5 6 7 8 9 10 11 12 13 14 15 16 17 18 19 20 21 22 23 24 25 26 27 28 29 30 31 32 33 34 35 36 37 38 39 40 41 42 43 44 45 46 47 48 49 50 51 52 53 54 55 56 57 58 59 60 61 62 63 64 65
33
Table 4. Relationship of proposer and responder behavior to treatment, demographics for
Experiment 2 (UG)
Model: OLS Probit (marginal effects)
Player: Proposer Responder
Dependent variable: Chips offered Probability of rejection
(1) (2) (3)
Chips offered -0.014***
-0.014***
(0.004) (0.004)
Delay 1.772 -0.296
**
(6.582) (0.143)
Age 0.556 -0.014 -0.007
(0.818) (0.022) (0.022)
Gender (Male) 0.881 -0.024 -0.102
(6.948) (0.141) (0.139)
Constant 31.886
*
(16.405)
Number of observations 43 43 43
Log likelihood -17.41 -15.23
(Pseudo) R2 0.018 0.316 0.402
Note. Numbers in parentheses are standard errors of parameter estimates. When restricted to
unequal monetary divisions (less than 75 chips offered), chips offered and delay remain
significant. When restricted to unequal chip divisions (less than 50 chips offered), chips offered
is directionally consistent but not significant and delay is significant at α = 0.10.
* p < 0.1,
** p < 0.05,
*** p < 0.01, all two-tailed

1 2 3 4 5 6 7 8 9 10 11 12 13 14 15 16 17 18 19 20 21 22 23 24 25 26 27 28 29 30 31 32 33 34 35 36 37 38 39 40 41 42 43 44 45 46 47 48 49 50 51 52 53 54 55 56 57 58 59 60 61 62 63 64 65
34
Table 5. Summary of means for Experiment 3 (UG)
Immediate treatment Delay treatment
Proposer Responder Proposer Responder
Ultimatum Game
Chips offered 44.01 (2.51) 50.00 (2.56)
Reject 00.42 00.25
Earnings ($) 01.68 (0.08) 00.44 (0.03) 01.50 (0.08) 00.50 (0.26)
Reflective Processing
Word Count 16.35 (1.32) 20.33 (1.75)
Emotions
Angry 2.48 (0.18) 2.26 (0.18)
Frustrated 2.75 (0.21) 2.63 (0.20)
Insulted 3.00 (0.23) 2.77 (0.21)
Disappointed 3.63 (0.22) 2.95 (0.22)
Happy 3.49 (0.21) 3.75 (0.21)
Grateful 3.41 (0.21) 3.51 (0.22)
Satisfied 3.43 (0.21) 4.18 (0.22)
Confident 4.19 (0.21) 4.08 (0.22)
Shocked 2.73 (0.21) 2.36 (0.18)
Surprised 3.56 (0.22) 3.11 (0.20)
Demographics
Age 28.50 (1.02) 29.24 (1.19) 29.21 (1.10) 28.18 (0.95)
Male 00.45 0.56 00.43 00.50
Note. Numbers in parentheses are standard errors.

1 2 3 4 5 6 7 8 9 10 11 12 13 14 15 16 17 18 19 20 21 22 23 24 25 26 27 28 29 30 31 32 33 34 35 36 37 38 39 40 41 42 43 44 45 46 47 48 49 50 51 52 53 54 55 56 57 58 59 60 61 62 63 64 65
35
Table 6. Relationship of proposer and responder behavior to treatment, demographics, reflective
processing and emotions for Experiment 3 (UG)
Model: OLS Probit (marginal effects)
Player: Proposer Responder
Dependent
variable:
Chips
offered Probability of rejection
(1) (2) (3) (4) (5) (6)
Chips offered -0.012*** -0.012*** -0.006*** -0.006*** -0.005**
(0.019) (0.002) (0.002) (0.002) (0.002)
- Delay 6.049* -0.127* -0.13 -0.130
(3.612) (0.075) (0.083) (0.083)
Age -0.143 0.000 -0.000 0.001
(0.184) (0.004) (0.004) (0.004)
Gender (Male) 0.549 -0.016 -0.027 -0.108
(3.618) (0.078) (0.078) (0.095)
Word Count -0.003
(0.003)
Angry 0.069
(0.048)
Frustrated 0.001
(0.037)
Insulted 0.076* 0.089*** 0.060***
(0.040) (0.034) (0.022)
Disappointed -0.085** -0.075**
(0.040) (0.037)
Happy -0.055 -0.063
(0.042) (0.039)
Grateful -0.010
(0.034)
Satisfied -0.080** -0.085*** -0.104***
(0.040) (0.039) (0.028)
Confident 0.076** 0.065** 0.057**
(0.031) (0.028) (0.025)

1 2 3 4 5 6 7 8 9 10 11 12 13 14 15 16 17 18 19 20 21 22 23 24 25 26 27 28 29 30 31 32 33 34 35 36 37 38 39 40 41 42 43 44 45 46 47 48 49 50 51 52 53 54 55 56 57 58 59 60 61 62 63 64 65
36
Shocked -0.025
(0.044)
Surprised 0.036 0.039
(0.030) (0.025)
Constant 47.829***
(6.151)
Number of
observations
172 172 172 172 172 172
Log likelihood -86.78 -85.39 -65.57 -67.59 -72.44
(Pseudo) R2 0.018 0.211 0.223 0.40 0.39 0.34
AIC 1.05 1.06 0.949 0.891 0.900
BIC -691.22 -688.86 -671.86 -703.86 -714.75
Note. Numbers in parentheses are standard errors of parameter estimates. * p < 0.1,
** p < 0.05,
*** p < 0.01, all two-tailed

1 2 3 4 5 6 7 8 9 10 11 12 13 14 15 16 17 18 19 20 21 22 23 24 25 26 27 28 29 30 31 32 33 34 35 36 37 38 39 40 41 42 43 44 45 46 47 48 49 50 51 52 53 54 55 56 57 58 59 60 61 62 63 64 65
37
Table 7. Independent probit coefficients, relationship of probability of rejection to emotions and
reflective processing with only treatment and demographic controls for Experiment 3 (UG)
Model: Probit (marginal effects)
Player: Responder
Dependent Variable: Probability of rejection
Reflective Processing
Word Count -0.003 (0.003)
Emotions
Angry 0.088*** (0.025)
Frustrated 0.058*** (0.022)
Insulted 0.080*** (0.021)
Disappointed 0.032 (0.021)
Happy -0.078*** (0.022)
Grateful -0.050** (0.021)
Satisfied -0.081*** (0.022)
Confident -0.004 (0.019)
Shocked 0.049*** (0.022)
Surprised 0.028 (0.020)
Note. Numbers in parentheses are standard errors of parameter estimates. * p < 0.1,
** p < 0.05,
*** p < 0.01, all two-tailed

1 2 3 4 5 6 7 8 9 10 11 12 13 14 15 16 17 18 19 20 21 22 23 24 25 26 27 28 29 30 31 32 33 34 35 36 37 38 39 40 41 42 43 44 45 46 47 48 49
Table 8. Relationship of reflective processing and emotions to study treatments and demographics for Experiment 3 (UG)
Model: OLS
Player: Responder
Dependent
variable:
Word
Count Angry Frustrated Insulted
Dis-
appointed Happy Grateful Satisfied Confident Shocked Surprised
Chips
offered 0.011 -0.028*** -0.032*** -0.047*** -0.044*** 0.035*** 0.038*** 0.041*** 0.004 -0.010*
(c) 0.011*
(a)
(0.047) (0.005) (0.006) (0.006) (0.006) (0.006) (0.006) (0.006) (0.006) (0.006) (0.006)
Delay 3.914* -0.015 0.092 0.102 -0.450* 0.171 -0.029 0.546** -0.084 -0.319 -0.533*
(a)
(2.226) (0.233) (0.261) (0.263) (0.261) (0.261) (0.264) (0.266) (0.291) (0.270) (0.287)
Age 0.042 0.006 -0.013
(b) 0.105 0.002 0.015 0.008 0.006 -0.006 -0.003 0.032**
(b)
(0.113) (0.012) (0.013) (0.013) (0.013) (0.013) (0.014) (0.014) (0.015) (0.014) (0.015)
Gender
(Male)
-0.779 0.659*** 0.532** 0.252 0.328 0.470* 0.658** 0.246 0.424 0.271 0.125
(2.26) (0.024) (0.265) (0.267) (0.265) (0.264) (0.267) (0.270) (0.297) (0.276) (0.291)
Past Week 0.136** 0.136** 0.167** 0.247*** 0.279*** 0.287*** 0.224*** 0.422*** 0.294*** 0.271***
(0.068) (0.065) (0.075) (0.070) (0.079) (0.074) (0.083) (0.087) (0.081) (0.077)
Constant 2.751*** 3.743*** 4.212*** 4.612*** -0.202 -0.218 0.241 2.000 2.468 1.215
(0.513) (0.575) (0.571) (0.571) (0.635) (0.597) (0.606) (0.646) (0.563) (0.606)
Number of
obs.
172 172 172 172 172 172 172 172 172 172
Adj R2 0.20 0.19 0.31 0.32 0.25 0.27 0.31 0.14 0.10 0.11
Note. Numbers in parentheses are standard errors of parameter estimates. “Past Week” refers to the reported feeling of the same
emotions during past week. All significance levels similar in the ordered logit, except as notated: (a)
not significant under ordered logit, (b)
p < 0.1 under ordered probit, (c)
p < 0.05 under ordered probit.
* p < 0.1,
** p < 0.05,
*** p < 0.01, all two-tailed

1 2 3 4 5 6 7 8 9 10 11 12 13 14 15 16 17 18 19 20 21 22 23 24 25 26 27 28 29 30 31 32 33 34 35 36 37 38 39 40 41 42 43 44 45 46 47 48 49 50 51 52 53 54 55 56 57 58 59 60 61 62 63 64 65
Figure 1. Amount sent, received, and returned per sender-responder pair in the (A) Immediate
and (B) Delay treatments of the investment game.

1 2 3 4 5 6 7 8 9 10 11 12 13 14 15 16 17 18 19 20 21 22 23 24 25 26 27 28 29 30 31 32 33 34 35 36 37 38 39 40 41 42 43 44 45 46 47 48 49 50 51 52 53 54 55 56 57 58 59 60 61 62 63 64 65
40
Figure 2. Number of chips offered and accept/reject decision per proposer-responder pair in the
(A) Immediate and (B) Delay treatments of the ultimatum game.
1 2 3 4 5 6 7 8 9 10 11 12 13 14 15 16 17 18 19 20 21 22 23 24 25 26 27 28 29 30 31 32 33 34 35 36 37 38 39 40 41 42 43 44 45 46 47 48 49 50 51 52 53 54 55 56 57 58 59 60 61 62 63 64 65
41
Figure 3. Number of chips offered and accept/reject decision per proposer-responder pair in the
(A) Immediate and (B) Delay treatments of the ultimatum game.