THE EFFECTS OF THE DISTRICT ASSEMBLIES’ …9)-529-542.pdf · expected volume and standard...
14
International Journal of Asian Social Science, 2015, 5(9): 529-542 DOI: 10.18488/journal.1/2015.5.9/1.9.529.542 ISSN(e): 2224-4441/ISSN(p): 2226-5139 © 2015 AESS Publications. All Rights Reserved. 529 THE EFFECTS OF THE DISTRICT ASSEMBLIES’ COMMON FUND ON DISTRICT ASSEMBLIES INTERNALLY GENERATED REVENUE MOBILISATION IN GHANA: AN ANALYSIS OF THE EARLY YEARS OF THE FUND Robinson D. Boye Bandie 1 1 University for Development Studies, Faculty of Planning & Land Management, Wa Campus, Ghana ABSTRACT The decentralisation system of Ghana requires the transfer of functions to the District Assemblies (DAs). This needs to be accompanied by various type of resources especially funds to ensure its success since District Assemblies are responsible for Ghana’s infrastructural and political development. Financial resource scarcity was common among district authorities which made it more difficult for DAs to carry out their mandated functions. The District Assemblies’ Common Fund (DACF) was introduced to augment the locally generated revenue of DAs. This paper assesses the impact of the DACF on internally-generated revenue (IGR) mobilisation. It seeks to establish the extent to which the introduction of the DACF has influenced local revenue generation of the Bolgatanga, Sissala and Nadowli District Assemblies. In this regard, the discussion covers the legal authority, nature and attributes of the DAs financial resources. The study has established that Central transfers have a dominating importance in the structure of the District Assemblies’ revenue in Ghana. Of the transfers, the DACF constitutes, on the average (for the three districts) 65% of the total income available for the period 1994 –1998. The IGR collection efforts of the three study districts changed in real terms since the inception of the DACF. The huge inflow of central government grants to the District Assemblies has resulted in a reduction in locally-generated revenue and, the high proportion of the DACF contribution to the revenue situation of the three districts implies that all the districts have very weak local revenue mobilisation structures. © 2015 AESS Publications. All Rights Reserved. Keywords: DACF, Internally generated funds, District assembly, Ghana. International Journal of Asian Social Science ISSN(e): 2224-4441/ISSN(p): 2226-5139 journal homepage: http://www.aessweb.com/journals/5007
Transcript of THE EFFECTS OF THE DISTRICT ASSEMBLIES’ …9)-529-542.pdf · expected volume and standard...

International Journal of Asian Social Science, 2015, 5(9): 529-542
DOI: 10.18488/journal.1/2015.5.9/1.9.529.542
ISSN(e): 2224-4441/ISSN(p): 2226-5139
© 2015 AESS Publications. All Rights Reserved.
529
THE EFFECTS OF THE DISTRICT ASSEMBLIES’ COMMON FUND ON
DISTRICT ASSEMBLIES INTERNALLY GENERATED REVENUE
MOBILISATION IN GHANA: AN ANALYSIS OF THE EARLY YEARS OF
THE FUND
Robinson D. Boye Bandie1
1University for Development Studies, Faculty of Planning & Land Management, Wa Campus, Ghana
ABSTRACT
The decentralisation system of Ghana requires the transfer of functions to the District Assemblies
(DAs). This needs to be accompanied by various type of resources especially funds to ensure its
success since District Assemblies are responsible for Ghana’s infrastructural and political
development. Financial resource scarcity was common among district authorities which made it
more difficult for DAs to carry out their mandated functions. The District Assemblies’ Common
Fund (DACF) was introduced to augment the locally generated revenue of DAs. This paper
assesses the impact of the DACF on internally-generated revenue (IGR) mobilisation. It seeks to
establish the extent to which the introduction of the DACF has influenced local revenue
generation of the Bolgatanga, Sissala and Nadowli District Assemblies. In this regard, the
discussion covers the legal authority, nature and attributes of the DAs financial resources. The
study has established that Central transfers have a dominating importance in the structure of the
District Assemblies’ revenue in Ghana. Of the transfers, the DACF constitutes, on the average
(for the three districts) 65% of the total income available for the period 1994 –1998. The IGR
collection efforts of the three study districts changed in real terms since the inception of the
DACF. The huge inflow of central government grants to the District Assemblies has resulted in a
reduction in locally-generated revenue and, the high proportion of the DACF contribution to the
revenue situation of the three districts implies that all the districts have very weak local revenue
mobilisation structures.
© 2015 AESS Publications. All Rights Reserved.
Keywords: DACF, Internally generated funds, District assembly, Ghana.
International Journal of Asian Social Science
ISSN(e): 2224-4441/ISSN(p): 2226-5139
journal homepage: http://www.aessweb.com/journals/5007

International Journal of Asian Social Science, 2015, 5(9): 529-542
© 2015 AESS Publications. All Rights Reserved.
530
Contribution/ Originality
This paper contributes to the theoretical argument on the role of external funding in
deepening dependency syndrome vis-à-vis its role in furthering decentralised goals. External
fund (DACF) that comes with fiscal decentralisation is justifiable. However, its success depends
on the creativity of autonomous structures to use it to further development goals.
1. INTRODUCTION
Decentralisation has taken a greater part of the reforms in developing countries, especially
sub-Saharan Africa. According to Conyers (1984) decentralisation was regarded as a means of
achieving various development goals, including rural development and national unity, and as
such attracted broader interest. Although studies have shown that decentralisation, especially
fiscal decentralisation has made little impact in the economies (Prud'Homme, 1995; Smoke,
2001) it is still being promoted in as a vehicle of promoting effectiveness in local level
development. The advocates, especially the donor community maintained that it is an effective
way of ensuring responsiveness to the local level (Wallis and Oates, 1988; World Bank, 1994;
Crook, 2003; Crawford, 2008). Due to the perceived advantages, many developing countries are
facing both external and internal pressures to decentralise government functions and resources to
the local level (Sharma, 2004). It has actually become the cornerstone of development in many
developing countries (Aslam and Yilmaz, 2011).
In Ghana, many have pointed to local governments as the viable institution that can shape
the contours for the promotion of good governance at the local level, open the blockages of inert
central bureaucracies that can offer more direct access to government by the people and stimulate
the whole nation to participate in the national development. This ideology has orchestrated and
engineered the institutionalisation of decentralisation which was once practiced in varying forms
in the period of imperialism in most African countries (Inanga and Osei-Wusu, 2004; Crawford,
2008). In 1988, the Government of Ghana embarked on the implementation of a comprehensive
policy to decentralise the system of government. The decentralisation programme had two main
objectives: to create opportunity for the majority of Ghanaians who live in the rural areas in
villages and towns to participate in decisions that directly affect their lives and increase their
access to political authority; and to promote local development through the involvement of the
indigenous people as a way of improving ownership and commitment to enhance
implementation, leading to improvement in the living conditions of the local people. The Local
Government Law, 1988 (PNDC Law 207) was enacted to give legal backing to the
decentralisation process. Central administrative authority was to be devolved to the district level.
Twenty-two functional areas of government were to be fused at the sub-national and local levels
into one administrative unit. The decentralisation process was to be total, including political
decentralisation, administrative decentralisation, fiscal decentralisation, and planning
decentralisation (Government of Ghana, 1999; CIDA, 2002; Inanga and Osei-Wusu, 2004).
Fiscal Decentralisation in particular, is a critical component intended to facilitate the
implementation of the entire decentralisation policy and to give it practical effect. It has been
described variously as the ―fourth leg‖, the ―prime mover‖ or the ―driving force of success‖ of

International Journal of Asian Social Science, 2015, 5(9): 529-542
© 2015 AESS Publications. All Rights Reserved.
531
the programme of decentralization in Ghana (CIDA., 2002). This is because for decentralised
institutions to perform the responsibilities devolved to them, they need resources (Parker, 1995).
In Ghana, the central government usually transferred functions to the local levels without
transferring the accompanying means. The problem of financial resource scarcity was common
among district authorities which made it more difficult for them to deliver and maintain the
expected volume and standard socio-economic services to the localities. This tended to constrain
the growth and development of the localities (Kessey, 1995).
It may however be argued that if responsibilities and tasks are to be decentralised, then they
must be accompanied by a corresponding fiscal reform to strengthen local government finances.
Decentralisation needs to be accompanied by resources especially funds to ensure its success
since District Assemblies are responsible for Ghana’s infrastructural and political development.
Finance is thus, the life-blood of every organisation which decentralised administrative set up is
no exception. Since no organisation can successfully perform its functions without financial
resources, it is more expedient to identify how the concept of decentralisation in Ghana is
financed; or the extent to which local governments are fiscally independent. How do the District
Assemblies generate their own revenue to commensurate their responsibilities as the cutting-edge
or the immediate agents of grass root development? One of the five pillars of Ghana’s
decentralisation is fiscal decentralisation. It comprises the assignment of responsibilities,
including sectoral functions, as well as the assignment of own-source revenues to sub-national
governments (Smoke, 2003). Fiscal decentralisation ensures the transfer of adequate financial
resources from the Central to local governments with sufficient autonomy to allocate and utilise
these resources in the provision of socio-economic services.
This paper assesses the impact of the DACF on internally-generated revenue mobilisation. It
seeks to find out the extent to which the introduction of the DACF has influenced local revenue
generation capacities of the District Assemblies. In this regard, the discussion covers the legal
authority, nature and attributes of the DAs financial resources for development. Specifically, the
study seeks to analyse District Assemblies’ local revenue performance vis-à-vis their share of the
DACF.
2. SCOPE OF THE RESEARCH
The DACF has been operational in Ghana since 1994. The period from 1994 to 1998 has
therefore been chosen for the research of fiscal decentralisation and for that matter the DACF in
Ghana. This period is considered long enough to reveal any impacts and lapses of the DACF on
the IGF of the study districts. Where appropriate, developments during the period immediately
before the introduction of the DACF, that is, 1990 to 1993, were examined for purposes of
comparison. The focus of the research is on the two Upper Regions of Ghana, that is, the Upper
East and the Upper West Regions. The relatively high level of poverty and deprivation in these
regions require higher levels of development interventions if the prevailing undesirable situation
is to be addressed or redressed (Ghana Statistical Service, 1995; Songsore and Denkabe, 1995).
The developmental needs and expectations of the people of the two regions are enormous and the
District Assemblies therefore have the onerous task of promoting improvement in their general
International Journal of Asian Social Science, 2015, 5(9): 529-542
© 2015 AESS Publications. All Rights Reserved.
532
welfare and the quality of life. This paper focuses on the revenue performance of the districts
from 1994 to 1998. A second paper will take into account the immediate preceding years before
Ghana signed up to the Highly Indebted Poor Countries (HIPC) Initiative and period during the
initiative. Thus the second paper will take into account three main variables, the DACF, the
internally-generated funds (IGF), and the HIPC Funds.
3. THE BASIS OF THE DACF
In Ghana, it has been realised that the issue of fiscal decentralisation is one of the main
causes of the failure of successive local government systems in the country (Asibuo and Nsarkoh,
1994; Kessey, 1995). The central government usually transferred functions to the local levels
without transferring the accompanying means. The problem of financial resource scarcity
common among district authorities which made it more difficult for them to deliver and maintain
the expected volume and standard socio-economic services to the localities.
It may however be argued that if responsibilities and tasks are to be decentralised, then they
must be accompanied by a corresponding fiscal reform to strengthen local government finances.
There has been the tendency to exaggerate the difficulties of decentralising central government’s
fiscal policy and thus justifying centralised fiscal control. Nonetheless, given the numerous
responsibilities assigned to local authorities in Ghana, Kessey (1995) contends that:
―This shows the necessity to grant some level of fiscal empowerment to all local
governments in less developed countries (LDCs). They should not be kept as spending agents of
the central government‖.
It is against this background that the DACF was introduced in Ghana as part of efforts to
operationalise decentralisation and to address the perennial problem of inadequate finance for
local development. Article 252 of the 1992 Fourth Republican Constitution made provision for
the establishment of the DACF. The Constitution stipulates that the Fund, which should represent
not less than five percent of the total revenues of Ghana (excluding loans and grants), should be
allocated to District Assemblies for the promotion of local level development (Republic of
Ghana, 1992). The DACF was instituted in July 1993 with the enactment of Act 455 by
Parliament. Through the Common Fund, additional financial resources are provided to DAs in
support of their development efforts, that is, the undertaking of local development projects
(Republic of Ghana, 1993a).
The DACF presently represents a major channel for the Government’s development
assistance to the districts. With the introduction of the District Assemblies’ Common Fund, for
the first time of their existence, the DAs have been confronted with the task of administering
large sums of money for development. The transfer of these substantial funds from the DACF
imposes great responsibility on the DAs IGR capacity. How resources of the Fund are
influencing the IGF of the DAs is the focus of this study.
3.1. Legal Authority
The District Assemblies in Ghana are charged with the responsibility of developing their
communities (Local Government Act, 1993, Act 462, Section 10). Accordingly, Act 462

International Journal of Asian Social Science, 2015, 5(9): 529-542
© 2015 AESS Publications. All Rights Reserved.
533
(Section 94) empowers them to raise revenue to finance development activities. Specifically, by
Section 95 of the Act, District Assemblies are the rating authorities for the district with the
mandate to make and levy rates. A number of general rating instruments have also been offered
by the Act (Republic of Ghana, 1993b). These instruments define the broadness of the financial
responsibility given to the Assemblies. The next section reviews these rating instruments.
3.2 General Rating Instruments
A District Assembly, according to Section 96 of Act 462, has the authority to levy general
rates on immovable property, possessions and persons as well as special rates for special projects
in the district. The main rating instruments identifiable are property rate, possession tax and
basic/head/poll tax. Others are income tax, licences, user charges and rents, loans, general
community levies and inter-governmental transfers (Republic of Ghana, 1993b). Figure 1
presents a summary of the sources and the associated discretionary powers given to the District
Assemblies over spending from these sources.
District Assemblies are generating revenues from sources such as fees and fines, licences,
rents, investments and others (Nadowli District Assembly, 1996; Sissala District Assembly,
1996). The problems associated with the generation of revenue from these sources by the study
districts include:
Low staffing and logistical capacity of the revenue collection administration of the
districts
High poverty levels making it difficult for the District Assemblies to raise enough
revenue
Poor natural resource base leading to low revenue generation from royalties.
Figure-1. District Assemblies’ Sources of Revenue and Discretionary Authority
Source: Adapted From Kroes and Korkor (1995)

International Journal of Asian Social Science, 2015, 5(9): 529-542
© 2015 AESS Publications. All Rights Reserved.
534
4. STRUCTURE OF DISTRICT ASSEMBLIES’ REVENUE
In this section, the revenue structure of the DAs is assessed to determine the significance of
the sources in generating the requisite resources for development. A critical examination of the
trial balances of the study districts shows that income receipts come from four main sources,
namely; internally generated revenue (derived from assigned sources by law), share of the
District Assemblies Common Fund (DACF), specific grants (comprising ceded revenue, salary
grants, relief grant, and education grant), and others (made up of donor support fund, budget
surpluses and funds from Non-governmental Organisations). The DACF and specific grants
together constitute the central government transfers to the districts.
The data in Tables 1 to 6 show the prominence of transfers, especially the DACF, in the
income of the Assemblies. For purposes of comparison, the time period has been divided into
two; 1990–1993 and 1994 – 1998. This has been done to show the now dominant position of the
DACF since its inception in 1994.
Table-1. Revenues by Source and Amount: Bolgatanga District Assembly (1990-1998)
Source: Field Survey, 2001
Table-2. Percentage Contribution of Revenue Sources: Bolgatanga District Assembly
Table-3. Revenues by Source and Amount: Sissala District Assembly (1990-1998)
Source Amount (in millions of cedis)
1990 1991 1992 1993 1994 1995 1996 1997 1998
IGR
DACF
Grants
Others
73.09
-
-
6.30
69.36
-
8.01
10.91
75.51
-
32.06
10.10
69.64
-
9.01
26.92
87.80
120.30
94.01
11.68
132.90
457.69
146.81
72.90
175.66
727.73
158.94
127.70
187.47
694.32
237.60
96.70
178.19
1,222.27
456.70
44.50
TOTAL 79.39 88.28 117.67 105.57 313.79 810.30 1190.03 1216.09 1,901.66
Source 1990 1991 1992 1993 1994 1995 1996 1997 1998
IGR
DACF
GRANTS
OTHERS
92.06
-
-
7.94
78.57
-
9.07
12.36
64.17
-
27.25
8.58
65.97
-
8.53
25.50
27.98
38.33
29.96
3.73
16.40
56.48
18.12
8.00
14.76
61.15
13.36
10.73
15.42
57.09
19.54
7.95
9.37
64.27
24.02
2.34
Source Amount (in millions of cedis)
1990 1991 1992 1993 1994 1995 1996 1997 1998
IGR
DACF
GRANTS
OTHERS
8.15
-
-
3.39
8.94
-
3.01
4.49
7.99
-
24.32
3.07
8.14
-
25.56
4.95
20.35
110.20
22.24
9.43
23.86
226.90
32.60
52.91
62.33
459.01
70.29
114.25
123.73
496.40
80.69
158.87
143.63
1,128.86
123.19
21.12
TOTAL 11.54 16.44 35.38 38.65 162.22 336.27 705.88 859.69 1,416.68

International Journal of Asian Social Science, 2015, 5(9): 529-542
© 2015 AESS Publications. All Rights Reserved.
535
Table-4. Percentage Contribution of Revenue Sources: Sissala District Assembly
Table-5. Revenues by Source and Amount: Nadowli District Assembly
Table-6. Percentage Contribution of Revenue Sources: Nadowli District Assembly
On the average, IGR constituted about 55% of the total revenue of the Assemblies during the
period, 1990-1993. Central Government transfers, made up mainly of specific grants, accounted
for almost 30%, with the remaining 15% coming from other sources. The trend, however,
changed between 1994 and 1998. Central Government transfers contributed, about 65% of the
total revenue of the districts during the period. The IGR’s contribution declined to about 13%,
whilst other sources increased to about 22%.The dominating importance of Central Government
transfers in total local receipts is not peculiar to the three districts. Studies by Korkor (1991) and
Kessey (1995) showed a similar structural pattern in income for Tamale Municipal Assembly
(59.5%), Krachi District Assembly (52.4%), Accra Metropolitan Assembly (30.9 %) and
ShamaAhanta East Metropolitan Assembly (43.2%). The statistics further show that the districts
exhibit similarity in structures. For Bolgatanga district, between 1990 and 1993, IGR constituted
75% of total revenue receipts. This, however, dropped to about 17% in the 1994 – 1998 period.
The IGR contribution for the other districts reflected the same trend. The contribution from IGR
was 42% for the Sissala district and 47% in the case of the Nadowli district during the period,
1990-1993. Between 1994 and 1998, there was a decline in the IGR for these two districts, to
10.6% for the Sissala district and 5.03% for the Nadowli district. From Tables 1-6, it is evident
that the contribution of specific grants in the structure of the District Assemblies’ revenue started
declining after 1993/1994. For example, in the Sissala district, specific grants’ contributions,
Source 1990 1991 1992 1993 1994 1995 1996 1997 1998
IGR
DACF
GRANTS
OTHERS
70.62
-
-
29.38
54.38
-
18.31
27.31
22.58
-
68.74
8.68
21.06
-
66.13
12.81
12.54
67.93
13.72
5.81
7.10
67.48
9.69
15.73
8.83
65.02
9.96
16.19
14.39
57.74
9.39
18.48
10.14
79,68
8.69
1.49
Source Amount (in millions of cedis)
1990 1991 1992 1993 1994 1995 1996 1997 1998
IGR
DACF
GRANTS
OTHERS
10.90
-
1.83
6.92
24.26
-
6.37
3.37
11.18
-
23.05
1.64
11.75
-
27.33
2.88
11.98
154.60
31.87
7.62
23.76
581.90
35.58
-
54.37
570.14
55.50
262.27
69.79
603.39
58.38
525.93
66.58
1,615.64
120.05
32.94
TOTAL 19.65 34.00 35.87 41.96 206.07 540.04 942.28 1257.49 1,835.21
Source 1990 1991 1992 1993 1994 1995 1996 1997 1998
GR
DACF
GRANTS
OTHERS
55.47
-
9.31
35.22
71.35
-
18.74
9.91
31.17
-
64.26
4.57
28.00
-
65.14
6.86
5.81
75.02
15.47
3.70
4.40
89.01
6.59
-
5.77
60.51
5.89
27.83
5.55
47.98
4.64
41.83
3.63
88.04
6.54
1.79

International Journal of Asian Social Science, 2015, 5(9): 529-542
© 2015 AESS Publications. All Rights Reserved.
536
after peaking at about 69% in 1992, dropped to about 9% in 1998. Similarly, the contribution of
the specific grant for the Nadowli and Bolgatanga districts dropped from 64.26% to 6.54% and
68.74% to 8.69%respectively in the same period.
4.1. The Effect of DACF on Revenue Collection Performance
The release of the DACF to the districts has been observed to assume an important status in
the financial structure of the DAs. According to Kessey (1999) the release of the DACF to the
DAs has led to a relaxation in their efforts at mobilising IGR. This makes it imperative to draw a
relationship between the performance of DACF and IGF in these districts. Table 7 gives an
indication of the importance of the DACF in the financial structures of the DAs. The statistics
presented in the table show that, on the basis of total receipts, the contribution of IGR to the
combined receipts from all the sources varied among the three districts. For example, IGR as a
percent of total receipts for the Bolgatanga District between 1994 and 1998 declined from 27.9%
in 1994 to 9.4% in 1998, a decrease of about 66% (Bolgatanga District Assembly, 1996). In the
case of the Sissala and Nadowli districts the decline was 19.1% and 37.5% respectively over the
period.
In separate discussions with the Budget and Planning Officers of the districts, they indicated
that the decline could be due to the fact that during electioneering activities in 1996, the
government cut down on the DACF allocations so that enough resources will be available to
government to organise the elections. This could be the case because in 1998 the allocations to
the DAs increased again. On the whole, however, these results imply that the DACF, since its
inception, has become a very important source of revenue to the Assemblies. Thus, from the
statistics, it can be contended that the IGR performance has been overshadowed by the quantum
of the DACF released to the DAs. There also seems to be some effect of the DACF on the
collection of the IGR of the DAs, notably the Bolgatanga district. To substantiate this, an
assessment of the IGR performance needs to be conducted. This constitutes the focus of the next
section.
Table-7. Contribution of Revenue Sources to District Assemblies’ Finances (1994 - 1998)
Revenue Sources
DISTRICT
Bolgatanga Sissala Nadowli
1994
IGR Receipts (%)
DACF Receipts (%)
Grants (%)
Others (%)
27.98
38.33
29.96
3.73
12.54
67.93
13.72
5.81
5.81
75.02
15.47
3.70
Total 100.0 100.0 100.0
1995
IGR Receipts (%)
DACF Receipts (%)
Grants (%)
Others (%)
16.40
56.48
18.12
8.0
7.10
67.48
9.69
15.73
4.40
89.01
6.59
NA
Total 100.0 100.0 100.0
1996
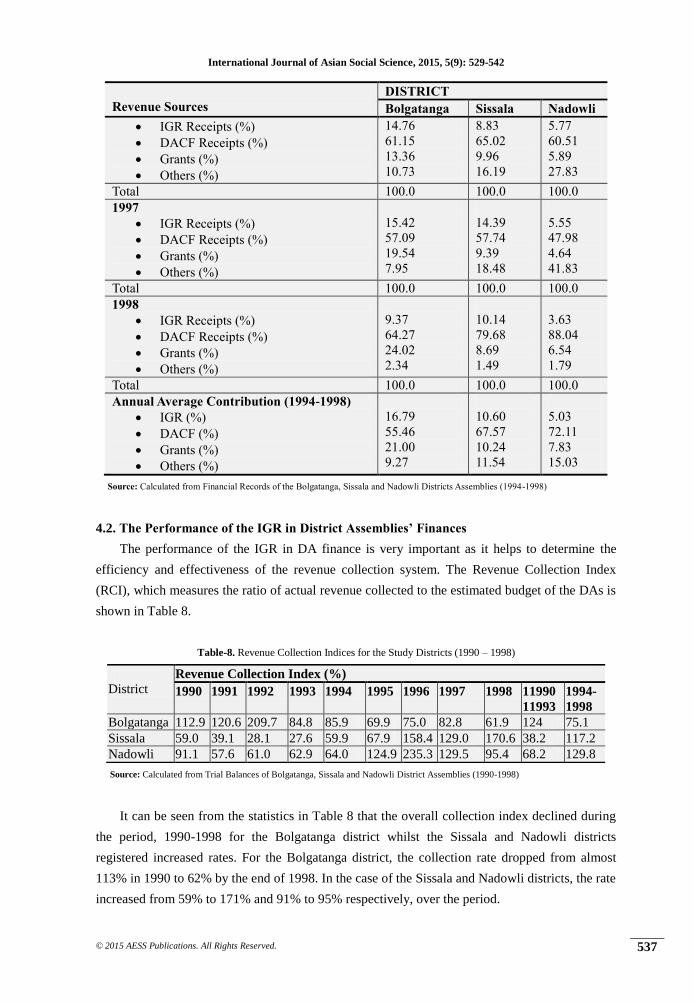
International Journal of Asian Social Science, 2015, 5(9): 529-542
© 2015 AESS Publications. All Rights Reserved.
537
Revenue Sources
DISTRICT
Bolgatanga Sissala Nadowli
IGR Receipts (%)
DACF Receipts (%)
Grants (%)
Others (%)
14.76
61.15
13.36
10.73
8.83
65.02
9.96
16.19
5.77
60.51
5.89
27.83
Total 100.0 100.0 100.0
1997
IGR Receipts (%)
DACF Receipts (%)
Grants (%)
Others (%)
15.42
57.09
19.54
7.95
14.39
57.74
9.39
18.48
5.55
47.98
4.64
41.83
Total 100.0 100.0 100.0
1998
IGR Receipts (%)
DACF Receipts (%)
Grants (%)
Others (%)
9.37
64.27
24.02
2.34
10.14
79.68
8.69
1.49
3.63
88.04
6.54
1.79
Total 100.0 100.0 100.0
Annual Average Contribution (1994-1998)
IGR (%)
DACF (%)
Grants (%)
Others (%)
16.79
55.46
21.00
9.27
10.60
67.57
10.24
11.54
5.03
72.11
7.83
15.03
Source: Calculated from Financial Records of the Bolgatanga, Sissala and Nadowli Districts Assemblies (1994-1998)
4.2. The Performance of the IGR in District Assemblies’ Finances
The performance of the IGR in DA finance is very important as it helps to determine the
efficiency and effectiveness of the revenue collection system. The Revenue Collection Index
(RCI), which measures the ratio of actual revenue collected to the estimated budget of the DAs is
shown in Table 8.
Table-8. Revenue Collection Indices for the Study Districts (1990 – 1998)
Source: Calculated from Trial Balances of Bolgatanga, Sissala and Nadowli District Assemblies (1990-1998)
It can be seen from the statistics in Table 8 that the overall collection index declined during
the period, 1990-1998 for the Bolgatanga district whilst the Sissala and Nadowli districts
registered increased rates. For the Bolgatanga district, the collection rate dropped from almost
113% in 1990 to 62% by the end of 1998. In the case of the Sissala and Nadowli districts, the rate
increased from 59% to 171% and 91% to 95% respectively, over the period.
District Revenue Collection Index (%)
1990 1991 1992 1993 1994 1995 1996 1997 1998 11990
11993
1994-
1998
Bolgatanga 112.9 120.6 209.7 84.8 85.9 69.9 75.0 82.8 61.9 124 75.1
Sissala 59.0 39.1 28.1 27.6 59.9 67.9 158.4 129.0 170.6 38.2 117.2
Nadowli 91.1 57.6 61.0 62.9 64.0 124.9 235.3 129.5 95.4 68.2 129.8

International Journal of Asian Social Science, 2015, 5(9): 529-542
© 2015 AESS Publications. All Rights Reserved.
538
The sharp increase in collection index in 1992 for the Bolgatanga district was attributed to
bumper harvest, which was experienced in that year. This was confirmed by the District Planning
Officer and the District Director of Agriculture. In the case of the Sissala district, the District
Planning Officer indicated that the high revenue collection indices from 1996 to 1998 were
accounted for by training programmes, which were organised for the Assembly’s 24 revenue
collectors and the involvement of the Unit Committees in revenue collection. As was the case in
the Sissala district, the Planning Officer of the Nadowli District Assembly ascribed similar
reasons for the high revenue collection indices recorded from 1995 to 1997.
Before the inception of DACF (1990-1993), the average revenue collection index for
Bolgatanga was 120%, but dropped to slightly over 73% during the period of the DACF. The
Sissala and Nadowli districts, however, presented a different picture. The rates for the two
districts saw improvements from 35% in 1990-1993 to 130% in 1994-1998 for Sissala, and from
63% in 1990-1993 to 123% in 1994 –1998 in the case of Nadowli district. The Budget Officers
of the Nadowli and Sissala districts ascribed the involvement of Unit Committee members in
revenue collection as the reason for the high revenue collection indices recorded from 1995 to
1997. In the case of the Bolgatanga district, the Planning and Budget Officer indicated that the
explanation for the decline in the RCI was that the Bolgatanga District Assembly over estimated
revenue targets for the period.
4.3. Relationship between DACF and IGR Collection Efforts
The analyses so far have revealed that the revenue collection efforts of the three study DAs
have changed (either positively or negatively) since the inception of the DACF. Table 9 shows
the calculation that was done in order to establish the relationship between the DACF and the
internally generated revenue of the districts.
Table-9. Results for Correlation Coefficient and Coefficient of Determination Analysis
District
Degree of Association
Correlation Coefficient Coefficient of Determination
Bolgatanga -0.638 0.407
Sissala 0.330 0.109
Nadowli 0.060 0.003
The positive relationship for the Sissala and Nadowli Districts is partly explained by the
commitment of resources to the training of revenue collection staff and the recruitment of
additional revenue collectors financed from the DACF. There was no evidence of similar effort in
the Bolgatanga district. In addition, investments with high propensities for generating revenue
were financed from the DACF by the Sissala and Nadowli DAs. These included the construction
of a District Assembly Canteen, a Guest House and new markets in the Nadowli district and the
overhauling of corn mills and construction of markets (Bugubelle and Tumu) in the Sissala
district. Even though the Bolgatanga District Assembly implemented projects of such kind such
as the construction of a market in Sumbrugu from its DACF, the Planning Officer and the District
Coordinating Director for the district indicated that the IGR had been declining over the years

International Journal of Asian Social Science, 2015, 5(9): 529-542
© 2015 AESS Publications. All Rights Reserved.
539
due to the poor revenue collection administration of the district. They emphasised that the DACF
was seen by the local taxpayers as a substitute for local revenue generation hence the negative
relationship between DACF and IGR in the district.
Since there are other determinants of the revenue collection efforts of districts besides the
DACF, there was the need to ascertain the degree of relationship between IGR collection efforts
and the DACF, using the correlation coefficient and the coefficient of determination (See Table
9).
The results of the correlation co-efficient even though low, confirm that indeed there exists a
relationship between IGR collection efforts of the DAs and their DACF inflows. The co-efficient
of determinations have also revealed that the effect of the DACF inflows on the IGR collection
efforts is more pronounced in the Bolgatanga district than the Sissala and Nadowli districts.
Whilst Sissala and Nadowli exhibit a positive relationship, Bolgatanga shows a negative linear
relationship. This means that for the Sissala and Nadowli districts, an increase in DACF leads to
a corresponding increase in IGR collection efforts. For Bolgatanga however, an increase in
DACF leads to a decrease in the IGR collection efforts.
The results imply that 41% of the decrease in IGR in the Bolgatanga district is explained by
the introduction of the DACF. On the other hand, 11% and 0.3% of the increases in IGR in the
Nadowli and Sissala districts respectively are attributable to the introduction of the DACF. The
remaining factors are attributable to the IGR collection mechanism and management systems of
the District Assemblies.
4.4. IGR Collection Mechanisms and Management Systems
To start with, the revenue administration structures of the three districts are fraught with
some problems, which grossly affect their revenue collection efforts. In the case of the Sissala
and Bolgatanga districts tax collectors paid directly to the District Finance Officers as and when
they were able to collect a certain fixed amount. The system, according to the districts’ Finance
Officers led to leakages, which affected the internally generated revenue of the districts. In the
Nadowli district, a multiplicity of payment procedures existed. Tax collectors made payments to
the Area Councils for onward payment to the District Assembly. These intermediary stages
exposed the revenue collection system in the Nadowli district to leakages thus affecting the
internally generated revenue. Four members of the Area Councils in the district testified to this
situation.
During the field survey, the District Finance Officers of the three District Assemblies
identified inadequate logistics for revenue collectors, general reluctance of taxpayers in paying
taxes and poor remuneration as significantly affecting the revenue collection efforts of the
districts. Even though it was revealed that the Ministry of Local Government and Rural
Development (MLGRD) had given the districts vehicles for revenue collection, it was indicated
that the vehicles were used mostly by the District Chief Executives (DCEs). As a consequence,
revenue collectors were unable to make wider coverage in their areas of operation thus affecting
the internal revenue generated. According to the District Finance Officer (DFOs), people were
generally reluctant to pay taxes because they felt the DAs were not satisfying their needs. In a
International Journal of Asian Social Science, 2015, 5(9): 529-542
© 2015 AESS Publications. All Rights Reserved.
540
similar study conducted by Action (2002) it was revealed in five districts that their internally
generated revenue was generally grossly low due primarily to the afore-mentioned factors.
The foregoing discussions have shown the nature of the relationship existing between IGR
and the DACF in all the study districts. The problems militating against revenue collection efforts
and management systems have also been identified. Nevertheless, the inception of the DACF has
led to the restructuring of the expenditure pattern of the DAs with the emphasis being on
development projects. The impact of the DACF on the expenditure pattern of the DAs is the
subject of discussion in the next section.
5. SUMMARY OF STRUCTURE AND PERFORMANCE OF REVENUE
Following an analysis of the three districts, the following key findings emerged:
(i) The share of internally generated revenue (IGR) of total income declined in all the
District Assemblies. For the Bolgatanga district, it dropped from 75.2% (1990 –1993) to
16.8% (1994 –1998), whilst for the Sissala and Nadowli districts, the IGR share
declined from 42.2% (1990 –1993) to 10.6% (1994 – 1998) and 46.5% (1990 –1993) to
5.0% (1994 –1998) respectively.
(ii) Central transfers have a dominating importance in the structure of the District
Assemblies’ revenue. Of these transfers, the DACF constitutes, on the average, for the
three districts, 65% of the total income available for the period 1994 –1998.
(iii) In terms of the effect of the DACF on local revenue collection, the overall collection
rate of IGR declined during the period 1990 – 1998 for the Bolgatanga district whilst the
Sissala and Nadowli districts registered increased rates. Before the inception of the
DACF (1990 – 1993), the average collection rate for the Bolgatanga district was 12%,
but dropped to slightly over 7.3% during the period of the DACF (1994 – 1998). The
Sissala and Nadowli districts however saw improvements from 35% (1990 – 1993) to
130% (1994 – 98) and 63% (1990 – 93) to 123% (1994 – 98) respectively.
(iv) The IGR collection efforts of the three study districts changed in real terms since the
inception of the DACF. The contribution of the DACF to this change in the IGR
collection efforts by the districts is very pronounced in the case of the Bolgatanga (41%)
district and insignificant in the case of the Sissala (11%) and Nadowli (0.3%).
6. CONCLUSIONS
The high proportion of the DACF contribution to the revenue situation of the three districts
implies that all the districts have very weak revenue structures. This can slag the districts’
development efforts if measures are not taken to reverse this trend. Moreover, the fact that there
still exist some negative development indicators in the districts, even though some investments
have been made on development projects from the DACF, implies that the District Assemblies
cannot wholly depend on the DACF alone but rather must put the relevant structures in place to
expand their local revenue base.
Based on the above analysis on the DACF and the Internal Generated Revenue mobilisation,
it has been established that there exists a relationship between the District Assemblies’ Common
International Journal of Asian Social Science, 2015, 5(9): 529-542
© 2015 AESS Publications. All Rights Reserved.
541
Fund and Internally Generated Revenue. The study also revealed some lapses and deficiencies
associated with the DACF at the National, Regional, District and Community levels. The
emerged issues and the lessons learnt will not only contribute to the debate on decentralisation in
general, but will, to a greater extent also improve on the operationalisation of fiscal
decentralisation in the country.
Based on the findings and conclusions, the study has revealed some useful lessons for fiscal
decentralisation and local governance in Ghana and elsewhere. The key lesson is that, the huge
inflow of central grants to the District Assemblies has had mixed effects. Some of these effects
are: a) reduction in locally-generated revenue and, b) expansion in the coverage of socio-
economic infrastructure. The significance of the effect on locally generated revenue collection
efforts is dependent on the revenue collection mechanisms in place.
REFERENCES
Action, A.-G., 2002. Local governance performance: Case study of five districts in Ghana. ActionAid.
Accra, Ghana.
Asibuo, S.K. and J.K. Nsarkoh, 1994. Financing local government in Ghana – Empirical studies of
problems. Accra: Friedrich Ebert Foundation.
Aslam, G. and S. Yilmaz, 2011. Impact of decentralization reforms in Pakistan on service delivery—An
empirical study. Public Administration and Development, 31(3): 159-171.
Bolgatanga District Assembly, 1996. Five year medium term development plan (1996-2000). Unpublished.
Bolgatanga.
CIDA, 2002. Ghana fiscal decentralisation project design report. Canadian International Development
Agency. CIDA Project #400/1878. Accra.
Conyers, D., 1984. Decentralization and development: A review of the literature. Public Administration and
Development, 4(2): 187-197.
Crawford, G., 2008. Decentralization and the limits to poverty reduction: Findings from Ghana. Oxford
Development Studies, 36(2): 235-258.
Crook, R.C., 2003. Decentralisation and poverty reduction in Africa: The politics of local–central relations.
Public Administration and Development, 23(1): 77-88.
Ghana Statistical Service, 1995. Ghana living standards survey. Accra: Ghana Publishing Corporation.
Government of Ghana, 1999. A comprehensive development framework, decentralisation. Accra: Ministry
of Local Government and Rural Development.
Inanga, E.L. and D. Osei-Wusu, 2004. Financial resource base of sub‐national governments and fiscal
decentralization in Ghana. African Development Review, 16(1): 72-114.
Kessey, K.D., 1995. Financing local development in Ghana: Mobilisation and management of fiscal
resources in Kumasi. Dortmund: SPRING Publications.
Kessey, K.D., 1999. Financing development in Kumasi metropolis: Challenges and prospects. Paper
Presented at a Workshop on Planning and Managing the Development of Kumasi. Kumasi. pp:
20-29.
Korkor, J.Y., 1991. Local fiscal capacity for development-a comparative analysis between Ghana and
liberia. Dortmund: SPRING Publications.
International Journal of Asian Social Science, 2015, 5(9): 529-542
© 2015 AESS Publications. All Rights Reserved.
542
Kroes, G. and J.Y. Korkor, 1995. Finance and budgeting in district development planning and management.
Dortmund: SPRING Publications.
Nadowli District Assembly, 1996. Five-year medium term development plan (1996-2000). Unpublished.
Nadowli.
Parker, A.N., 1995. Decentralization: The way forward for rural development. World Bank Policy Research
Working Paper No. (1475).
Prud'Homme, R., 1995. The dangers of decentralization. The world Bank Research Observer, 10(2): 201-
220.
Republic of Ghana, 1992. Constitution of the republic of Ghana. Accra: Ghana Publishing Corporation.
Republic of Ghana, 1993a. District assemblies common fund act, 1993 (Act 455). Accra: Ghana Publishing
Corporation.
Republic of Ghana, 1993b. District assemblies common fund act, 1993 (Act 455). Accra: Ghana Publishing
Corporation.
Sharma, C.K., 2004. Why decentralization? The puzzle of causation. Synthesis, 3(1): 1-17.
Sissala District Assembly, 1996. Five-year medium term development plan (1996-2000). Unpublished.
Tumu.
Smoke, P., 2001. Fiscal decentralization in developing countries: A review of current concepts and practice.
Geneva: United Nations Research Institute for Social Development.
Smoke, P., 2003. Decentralisation in Africa: Goals, dimensions, myths and challenges. Public
Administration and Development, 23(1): 7-16.
Songsore, J. and A. Denkabe, 1995. Challenging rural poverty in Northern Ghana: The case of Upper West
region, centre for environment and development. Norway: University of Trondheim.
Wallis, J.J. and W.E. Oates, 1988. Decentralization in the public sector: An empirical study of state and
local government. In fiscal federalism: Quantitative studies. University of Chicago Press. pp: 5-
32.
World Bank, 1994. World development report: Infrastructure for development. New York: Oxford
University Press.
Views and opinions expressed in this article are the views and opinions of the authors, International Journal of Asian
Social Science shall not be responsible or answerable for any loss, damage or liability etc. caused in relation to/arising
out of the use of the content.