The Effects of Tax Salience and Tax Experience on Individual - Iza
30
DISCUSSION PAPER SERIES Forschungsinstitut zur Zukunft der Arbeit Institute for the Study of Labor The Effects of Tax Salience and Tax Experience on Individual Work Efforts in a Framed Field Experiment IZA DP No. 6049 October 2011 Martin Fochmann Joachim Weimann
Transcript of The Effects of Tax Salience and Tax Experience on Individual - Iza

DI
SC
US
SI
ON
P
AP
ER
S
ER
IE
S
Forschungsinstitut zur Zukunft der ArbeitInstitute for the Study of Labor
The Effects of Tax Salience and Tax Experience on Individual Work Efforts in a Framed Field Experiment
IZA DP No. 6049
October 2011
Martin FochmannJoachim Weimann

The Effects of Tax Salience and
Tax Experience on Individual Work Efforts in a Framed Field Experiment
Martin Fochmann University of Magdeburg
Joachim Weimann
University of Magdeburg and IZA
Discussion Paper No. 6049 October 2011
IZA
P.O. Box 7240 53072 Bonn
Germany
Phone: +49-228-3894-0 Fax: +49-228-3894-180
E-mail: [email protected]
Any opinions expressed here are those of the author(s) and not those of IZA. Research published in this series may include views on policy, but the institute itself takes no institutional policy positions. The Institute for the Study of Labor (IZA) in Bonn is a local and virtual international research center and a place of communication between science, politics and business. IZA is an independent nonprofit organization supported by Deutsche Post Foundation. The center is associated with the University of Bonn and offers a stimulating research environment through its international network, workshops and conferences, data service, project support, research visits and doctoral program. IZA engages in (i) original and internationally competitive research in all fields of labor economics, (ii) development of policy concepts, and (iii) dissemination of research results and concepts to the interested public. IZA Discussion Papers often represent preliminary work and are circulated to encourage discussion. Citation of such a paper should account for its provisional character. A revised version may be available directly from the author.

IZA Discussion Paper No. 6049 October 2011
ABSTRACT
The Effects of Tax Salience and Tax Experience on Individual Work Efforts in a Framed Field Experiment*
We conduct a framed field experiment with 245 employed persons (no students) as subjects and a real tax, which is levied on the subjects’ income from working in our real effort task. In our first three treatments, the net wage is constant but gross wages are subject to different constant marginal tax rates (0, 25%, 50%). It turns out that the effort is significantly higher under the tax than in the no tax treatment. Subjects perceive a too high net wage because they underestimate the tax. We conjecture that tax perception depends on the tax rate, the presentation of the tax and the experience subjects have with taxation. These conjectures are confirmed in four further treatments employing a direct and an indirect progressive tax scale. It turns out that simple at taxes are particularly prone to being misperceived because their simplicity reduces the tax salience. JEL Classification: C91, D14, H24 Keywords: field experiment, real effort experiment, tax perception, tax salience,
tax experience, behavioral economics Corresponding author: Martin Fochmann Chair of Economic Policy University of Magdeburg PO Box 4120 39016 Magdeburg Germany E-mail: [email protected]
* We would like to thank Wolfram Richter, Peter Katuščák, and the participants of the Asia-Pacific Economic Science Association Conference, the International Economic Science Association Conference, and the Jahrestagung der Gesellschaft für experimentelle Wirtschaftsforschung for helpful comments and suggestions. We gratefully acknowledge funding by the German Federal Ministry of Finance.

1 Introduction
In the economic literature on taxes, behavioral aspects do not usually play a promi-
nent role. For example, the theory of optimal taxation assumes that taxpayers adapt
to a given tax scale rationally by maximizing their utility. Phenomena like “inequal-
ity aversion” (Fehr and Schmidt, 1999; Bolton and Ockenfels, 2000), “reciprocity”
(Fehr and Gachter, 1998) or “altruism” (Andreoni and Miller, 2002), intensively
discussed in the area of behavioral economics, do not play a role in this theory for
good reasons. On the other hand, it must be realized that there is experimental
evidence that a fundamental assumption made in theories about the effects of tax-
ation may be violated in reality: the assumption that taxpayers perceive the tax as
implemented by the government.
There is a variety of papers showing that subjects in laboratory experiments or
the participants in surveys are not aware of their true tax burden. For example,
Gensemer et al. (1965), Morgan et al. (1977), Lewis (1978) and Rupert and Fischer
(1995) find in their surveys that taxpayers misestimate their marginal tax rates. In
a laboratory experiment, Bartolome (1995) shows that most of the subjects under-
estimate their tax burden in investment decisions since they use the average tax rate
instead of the marginal tax rate. More recently, Chetty et al. (2009) show in a field
experiment that subjects do not consider taxes correctly when they decide on their
consumption of goods in a store.
In an assortment of studies, the salience of a tax—the degree of tax visibility—is
identified as the main determinant of tax perception. In a laboratory experiment,
Rupert and Wright (1998) use four different presentation forms of a tax scale that
differ in the visibility of the marginal tax rates, and find that the quality of invest-
ment decisions increases with the visibility. Sausgruber and Tyran (2005) find that
subjects are much more aware of taxes if they have to pay the tax bill than if the
other market side has to pay. Chetty et al. (2009) observe in their field experiment
that an explicit tax posting on price tags induces consumers to pay more attention
to taxes. In the same manner, Finkelstein (2009) finds that the awareness of tolls
is much lower when individuals pay the toll automatically by using an electronic
toll collection system than when paying in cash. All of these studies reveal that the
higher the salience of a tax, the higher the tax perception. Thus, the degree of tax
consideration in individuals’ decisions is affected by tax salience.
Given these observations, the question arises, why is tax perception biased or,
considering it the other way around, what are the necessary conditions for a correct
perception of tax? Answering this question is not only important for governments
trying to create tax-systems that produce correctly perceived taxes, but also for the
1

economic analysis of taxes. For example, if taxes are misperceived, this affects the
welfare analysis of taxation because the excess burden of taxes becomes smaller or
greater due to the perception bias.
In this paper, we investigate the way taxes are perceived in a framed field exper-
iment1 with a real effort task in which subjects have to decide on their labor supply.
Some experiments described in the literature already use real effort designs to an-
alyze the impact of taxes. But the experimental designs used in these experiments
do not allow potential misperceptions of taxes to be investigated. For example, in
the experiments of Sillamaa (1999a, 1999b, 1999c) and Swenson (1988), only the
after-tax wage rate was announced and any kind of tax framing was avoided. Fur-
thermore, in order to control for income effects, the tax revenue is redistributed to
the subjects. The work-leisure decision is established in the laboratory by offering
subjects newspapers and computer games they could use instead of working—which
is quite different from the real work-leisure decision people have to make when they
decide on their labor supply.
In contrast to the existing literature, we designed the experiments in such a
way as to achieve as much external validity as possible. For this reason, we used
employed people as subjects (no students) and conducted a real effort experiment.
Furthermore, subjects had to make a real work-leisure decision because they decided
not only about their effort but also about the time they spent on work. There was
no time restriction. Because the experiment was financed by the German Federal
Ministry of Finance, we could use real taxes. On the other hand, we did not redis-
tribute the taxes to the subjects because, in the real world, the quantity of public
goods taxpayers consume is, in fact, independent of the taxes they personally pay.
The experiments are designed to investigate three different hypotheses concern-
ing the determinants of tax perception. The first hypothesis is that tax perception
depends on the tax rate itself. We conjecture that when tax rates are low, subjects
will tend to underestimate the tax and that the tax bias will become smaller, the
higher the tax rates. We formulate this hypothesis for linear tax scales only in order
to avoid the difficulty of differentiating between marginal and average tax rates. Our
second hypothesis concerns the way taxes are presented to the taxpayer. To inves-
tigate this hypothesis, we use two tax scales that are more difficult and complex:
an indirect progressive tax and a direct progressive tax. These complex scales are
presented in a more or less transparent way (either only verbally or with a graphical
illustration). We conjecture that tax perception depends on the transparency of the
1According to Harrison and List (2004) our experiment can be regarded as a framed fieldexperiment because we used employees as subjects and a real tax on labor income.
2

tax presentation. The third hypothesis concerns the characteristic of the subjects.
Our conjecture in this case is that the experience subjects have with the taxation of
earned labor income affects tax perception: the more experience subjects have, the
smaller the tax bias will be.
In the next section, we will briefly describe the theoretical framework of our
experiment. Section three describes the experimental design and presents the three
hypotheses more precisely. The results are presented in section four and discussed
in the final section.
2 Theoretical framework
In our experiment, participants are asked to produce a good in a real effort task
without any time restriction. The total number of goods produced by subject i is xi
and the subject earns the gross wage rate w for each unit of xi. Income is subject to
an income tax and the total tax burden of an individual is τ(xi). The total net of
tax income equals wxi− τ(xi). The production costs c (subject’s disutility of labor)
depend on the output level and we assume that ∂c(xi)∂xi
> 0 and ∂2c(xi)∂2xi
> 0. Because
each subject decides on the working time individually, the output level xi depends
on both the time ti a subject spends in the laboratory and on the effort level ei. The
latter is defined as output quantity per time unit and measures the productivity of
a participant approximately. The output level is then determined by xi = eiti and
the following payoff function results:
πi(eiti) = weiti − τ(eiti)− c(eiti) (1)
As described above, the baseline hypothesis of this paper is that taxpayers do not
perceive taxes correctly. To consider such a tax bias in our model, we introduce
the variable τ which represents the perceived tax burden. In the case of an under-
estimation (overestimation) of the tax effect, the perceived tax burden τ is lower
(higher) than the true tax burden τ . The difference between the perceived and the
true value—the tax bias—is denoted as ∆τ = τ − τ . Since individuals base their
labor supply decisions on their perceived (expected) payoff, subjects are assumed to
maximize:
πi(eiti) = weiti − τ(eiti)− c(eiti) = weiti − τ(eiti)−∆τ(eiti)− c(eiti) (2)
3

5
perceived tax rate
true tax rate
In the optimum, the (perceived) marginal net wage equals the marginal effort costs. Given the
assumptions made for the cost function, the optimal effort will increase if the gross wage w
increases. The reaction to an increase in the real (marginal) tax rate obviously depends on
how depends on .
Turning to the relationship between the perceived tax burden and the true tax burden , we
assume that the tax bias is zero for tax rates of 0% and 100%. The tax can be over- or under-
estimated for tax rates inbetween. In both cases, there has to be an area in which the tax (rate)
bias firstly increases followed by an area in which this bias decreases. Figure 1 shows an ex-
ample. The solid line (45-degree line) represents an unbiased tax perception. The dashed line
represents an underestimation of the tax effect, with the absolute tax (rate) bias increasing for
tax rates less than and decreasing for tax rates greater than .
Figure 1: Perceived tax rate as a function of the true tax rate
3 Treatments and hypotheses
To derive our hypotheses, we will focus only on subjects’ work efforts. The decisions about
the time spent in the laboratory will be ignored because we do not have enough control over
the opportunity costs driving these decisions. For example, it may be the case that a subject
has an appointment later or that the subject’s wife or husband is waiting for dinner. Thus, we
assume that the decision about time and effort are additively separable. Subjects decide how
hard they are going to work given their optimal chosen labor time.5
5 Despite this difficulty, we decided to leave the decision on the length of the experiment to the subjects, be-
cause our aim was to create a real work-leisure decision.
1
1
t*
Figure 1: Perceived tax rate as a function of the true tax rate
If we normalize the time spent in the laboratory (ti = 1), we get the necessary
condition for the payoff maximizing effort:
w − ∂τ
∂ei=∂c(ei)
∂ei(3)
In the optimum, the (perceived) marginal net wage rate equals the marginal effort
costs. Given the assumptions made for the cost function, the optimal effort will
increase if the gross wage rate w increases. The reaction to an increase in the real
(marginal) tax rate obviously depends on how τ depends on τ .
Turning to the relationship between the perceived tax burden τ and the true tax
burden τ , we assume that the tax bias is zero for tax rates (t) of 0% and 100%. The
tax can be over- or underestimated for tax rates inbetween. In both cases, there
has to be an area in which the difference between perceived and true tax rate firstly
increases and, therefore, also the tax (burden) bias, followed by an area in which
this difference and also the tax (burden) bias decreases. Figure 1 shows an example.
The solid line (45-degree line) represents an unbiased tax perception. The dashed
line represents an underestimation of the tax effect, with the absolute tax (rate) bias
increasing for tax rates less than t∗ and decreasing for tax rates greater than t∗.
3 Treatments and hypotheses
To derive our hypotheses, we will focus only on subjects’ efforts. The decisions
about the time spent in the laboratory will be ignored because we do not have
enough control over the opportunity costs driving these decisions. For example, it
may be the case that a subject has an appointment later or that the subject’s wife
or husband is waiting for dinner. Thus, we assume that the decision about time and
4

effort are additively separable. Subjects decide how hard they are going to work
given their optimal chosen labor time.2
It is well known that the ability to do simple tasks improves with practice. The
learning process can best be described by the “Power Law of Learning” (PLL)3
which states that productivity is an isoelastic function of practice time. Thus, if
ei is the productivity (or effort) of person i and ti is the time spent folding letters,
then according to the PLL it holds that ei(ti) = gtηi with 0 < η < 1. Where g and
η are parameters describing the learning ability of the individual. We cannot rule
out that the participants in our experiments differ with respect to these parameters.
In principle, it is possible to estimate g and η but this would make it necessary to
observe the productivity of each individual over the entire time they spend in the
laboratory. We decided against this because if a person is observed that closely, it
would surely influence his or her behavior. However, we controlled for demographic
parameters like gender, education and age. We found that “age” has a significant
influence on productivity but that controlling for this does not change the treatment
effects. This gives us confidence that the randomization was successful and the
productivity parameters are equally distributed over the treatments.
3.1 Tax effect: tax-free, 25% tax, and 50% tax treatments
In line with the empirical results of Gensemer et al. (1965), Morgan et al. (1977),
Lewis (1978), Bartolome (1995), Rupert and Fischer (1995), and Chetty et al. (2009),
we conjecture that individuals misperceive the tax effect. Even though the perceived
tax burden τ is not observable, the effort levels will depend on participant’ tax
perception. Therefore, we can use the observed effort levels in our different tax
treatments to characterize tax perception at least in a qualitative way. According
to equation 3, the necessary condition for the payoff maximizing effort is:
∂c(ei)
∂ei= w − ∂τ
∂ei= w − ∂τ
∂ei− ∂∆τ
∂ei(4)
In order to analyze tax-effect biases, we consider three treatments with identical net
wage rates of 9 euro-cents per produced item but with different tax rates and gross
wage rates adjusted accordingly. In the tax-free treatment, no taxation is applied.
In the 25% tax treatment (50% tax treatment), the gross wage rate is 12 (18) euro-
cents, but now it is taxed at a constant rate of 25% (50%). With respect to equation
2Despite this difficulty, we decided to leave the decision on the length of the experiment to thesubjects, because our aim was to create a real work-leisure decision.
3See Mincer (1958), Ritter and Schooler (2001), and Richter (2011).
5

4, the term w − ∂τ∂ei
, which determines the true marginal net wage rate, is the same
in all three treatments (9 cents). Therefore, the effort should be the same in all
treatments if no tax misperception exists (∂∆τ∂ei
= 0). Recall that for linear tax scales∂τ∂ei
and ∂∆τ∂ei
are constant. The last term can be interpreted as the fraction of the
tax that is not correctly realized as a tax.
In line with the empirical results of Bartolome (1995) and Chetty et al. (2009),
we expect that participants underestimate the tax effect. In our model, this is rep-
resented by a negative value of ∆τ . For a constant (marginal and average) tax rate
(as in our 25% and 50% tax treatments), ∂∆τ∂ei
is also constant and negative. Since
the cost function is assumed to be convex, subjects’ effort in both tax treatments
should be greater than subjects’ effort in the tax-free treatment. This leads us to
the following hypothesis:
Hypothese 1 (part 1): Participants’ effort level is lower in the tax-free treat-
ment than in the 25% tax treatment and 50% tax
treatment.
Based on our assumptions regarding the relationship between the perceived and
true tax rate (see figure 1), the tax bias ∆τ in the 25% tax treatment can be equal,
higher, or lower than the tax bias in the 50% tax treatment. However, if we assume
that an increase of the (average and marginal) tax rate from 25% to 50% leads to
a decline in tax misperceptions, a lower effort should be observed in the 50% tax
treatment than in the 25% tax treatment for a constant gross wage rate w. In order
to compare the efforts, the net wage rates in the linear tax treatments have to be
identical. Therefore, the gross wage rate in the 50% treatment has to be higher
than in the 25% treatment. Comparing the 25% and the 50% treatments we need to
consider both the increase of the gross wage rate and the effect of a higher tax rate
on the tax perception. Both effects will work in different directions. For a given tax
misperception (a given constant fraction of the true tax that is ignored) an increase
of the gross wage rate will lead to higher efforts. On the other hand, a higher tax
rate will make the tax more salient and this will result in a lower tax misperception
(a smaller fraction of the true tax is ignored) and, therefore, in a lower effort level.
However, we conjecture that the first effect will not dominate the second. Therefore,
we obtain the following hypothesis:
Hypothese 1 (part 2): Participants’ effort level in the 50% tax treatment is
not higher than in the 25% tax treatment.
6
0 %
10 %
20 %
30 %
40 %
50 %
60 %
0 5 10 15 20 25 30 35 40 45 50
ma
rgin
al
tax r
ate
gross income in Euro
direct progressive tax indirect progressive tax
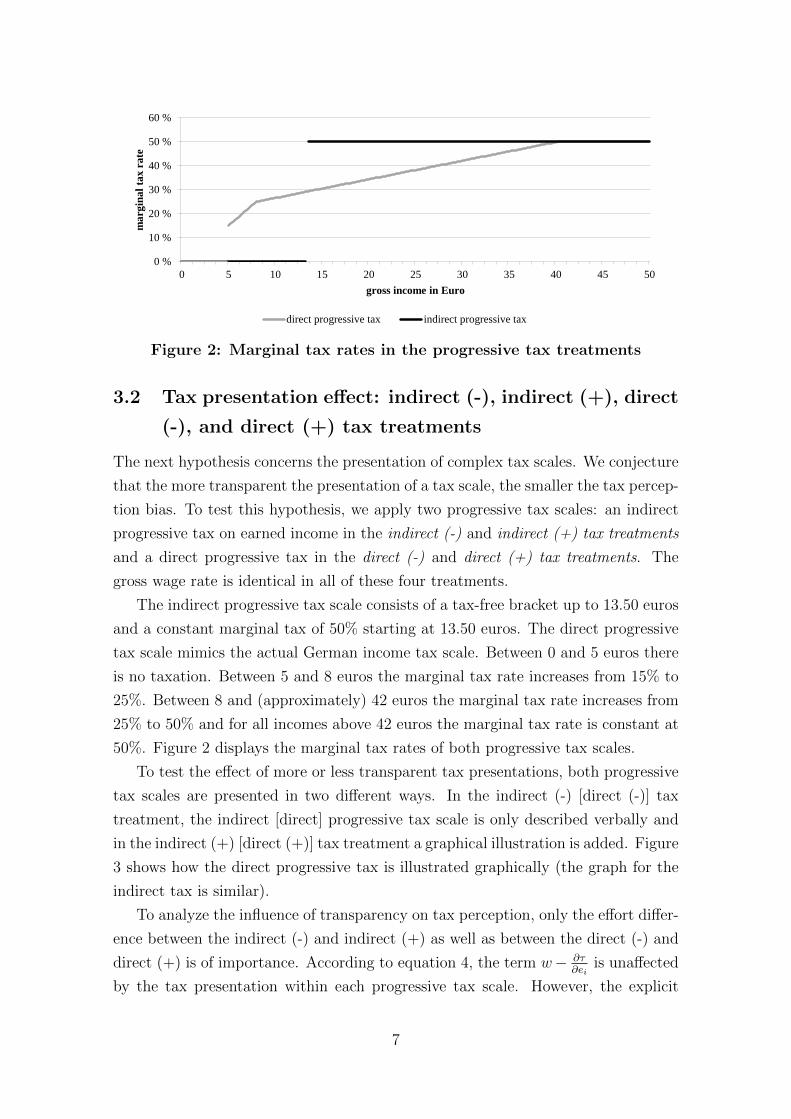
Figure 2: Marginal tax rates in the progressive tax treatments
3.2 Tax presentation effect: indirect (-), indirect (+), direct
(-), and direct (+) tax treatments
The next hypothesis concerns the presentation of complex tax scales. We conjecture
that the more transparent the presentation of a tax scale, the smaller the tax percep-
tion bias. To test this hypothesis, we apply two progressive tax scales: an indirect
progressive tax on earned income in the indirect (-) and indirect (+) tax treatments
and a direct progressive tax in the direct (-) and direct (+) tax treatments. The
gross wage rate is identical in all of these four treatments.
The indirect progressive tax scale consists of a tax-free bracket up to 13.50 euros
and a constant marginal tax of 50% starting at 13.50 euros. The direct progressive
tax scale mimics the actual German income tax scale. Between 0 and 5 euros there
is no taxation. Between 5 and 8 euros the marginal tax rate increases from 15% to
25%. Between 8 and (approximately) 42 euros the marginal tax rate increases from
25% to 50% and for all incomes above 42 euros the marginal tax rate is constant at
50%. Figure 2 displays the marginal tax rates of both progressive tax scales.
To test the effect of more or less transparent tax presentations, both progressive
tax scales are presented in two different ways. In the indirect (-) [direct (-)] tax
treatment, the indirect [direct] progressive tax scale is only described verbally and
in the indirect (+) [direct (+)] tax treatment a graphical illustration is added. Figure
3 shows how the direct progressive tax is illustrated graphically (the graph for the
indirect tax is similar).
To analyze the influence of transparency on tax perception, only the effort differ-
ence between the indirect (-) and indirect (+) as well as between the direct (-) and
direct (+) is of importance. According to equation 4, the term w− ∂τ∂ei
is unaffected
by the tax presentation within each progressive tax scale. However, the explicit
7

1. Euro
total tax: 0.00 € total tax: 0.60 €
0 % 0 % 0 % 0 % 0 %
2. Euro 3. Euro 4. Euro 5. Euro 8. Euro 7. Euro 6. Euro
25 % 20 % 15 %
1. Part: 0.00 € to 5.00 € no taxation
2. Part: 5.01 € to 8.00 € tax rate increases from
15 % to 25 %
total tax: 0.60 €
9. Euro 10. Euro 39. Euro 40. Euro
3. Part: 8.01 € to 40.25 € tax rate increases from
25 % to 50 %
41. Euro 42. Euro
4. Part: more than 40.25 € (constant) tax rate: 50 %
43. Euro
26.50 % 49.25 % 50 % 50 % 50 % 50 %
… …
total tax: 12.10 €
total tax: 12.70 €
total tax: 12.70 € + 50 Cent for each Euro exceeding 40.25 €
25.75 %
total tax: 50 Cent for each Euro exceeding 40.25 €
Figure 3: Graphical illustration of the direct progressive tax scale
tax scale presentation in the indirect (+) and direct (+) tax treatments is expected
to lead to a lower degree of tax misperception, i.e.∣∣∣∂τindirect(−)
∂ei
∣∣∣ ≥ ∣∣∣∂τindirect(+)
∂ei
∣∣∣ and∣∣∣∂τdirect(−)
∂ei
∣∣∣ ≥ ∣∣∣∂τdirect(+)
∂ei
∣∣∣. Under the assumption that subjects also underestimate
progressive taxes, the effort should then be lower in the treatments with the explicit
tax presentation. This leads to our second hypothesis:
Hypothese 2: Participants’ effort level is lower in the indirect (+) [direct
(+)] tax treatment than in the indirect (-) [direct (-)] tax treat-
ment.
3.3 Tax experience effect: all treatments
We conjecture that tax perception not only depends on the tax effect and the tax
presentation effect, but also on individuals’ tax experience. For an individual to
gain this experience, it is necessary to have a personal income that is high enough
to create a tax obligation. In Germany, income taxation concentrates very much
on higher incomes. Tax is payable on monthly incomes of more than 1,000 euros
for single people and 1,700 euros for married people. Therefore, those subjects in
our subject pool with an income below 2,000 euros are classified as subjects with
no or only limited experience and those with an income above 2,000 euros are the
“experienced” subjects.
8

Table 1: Characterization of treatments
treatment tax scalegrosswagerate
marginaltax rate
net wage ratetax scale
presentationnumber of
participants
tax-free no taxation e 0.09 — e 0.09 — 60
25% taxproportional
income taxatione 0.12 25% e 0.09 no 36
50% taxproportional
income taxatione 0.18 50% e 0.09 no 31
indirect (-)
indirectprogressive
taxation withtax-free bracket
e 0.12 0% or 50% (e 0.06; e 0.12) no 26
indirect (+)
indirectprogressive
taxation withtax-free bracket
e 0.12 0% or 50% (e 0.06; e 0.12) yes 29
direct (-)direct progressive
taxatione 0.12 [0%; 50%] (e 0.06; e 0.12) no 27
direct (+)direct progressive
taxatione 0.12 [0%; 50%] (e 0.06; e 0.12) yes 36
We hypothesize that subjects with more tax experience are more aware of taxes
than inexperienced subjects and this higher sensitivity will lead to a more accurate
tax perception. Therefore,∣∣∣∂τinexperienced
∂ei
∣∣∣ ≥ ∣∣∣∂τexperienced
∂ei
∣∣∣. In accordance with equa-
tion 4 and under the general expectation that the subjects will underestimate the
taxes in all tax treatments, hypothesis 3 can be stated as follows:
Hypothese 3: In all tax treatments, the effort levels of experienced subjects
are lower than the levels of inexperienced subjects.
Table 1 summarizes the characteristics of all seven treatments.
4 Experimental protocol
The experiments were conducted at the experimental laboratory of the local uni-
versity. Subjects were recruited randomly from the local telephone book. Potential
subjects first received a letter in which they were informed that they could attend
an experiment at the university if they were regularly employed with a minimum
working time of 30 hours per week. A day later we called the subjects, asking if
they fulfilled our requirements and if they were willing to participate. Those who
agreed were invited to come to the laboratory in the late afternoon, after their reg-
ular working time. In total, 245 subjects participated. When they arrived at the
laboratory, they received written instructions informing them about their task, the
gross wage rate and the tax scale. The task was to fold letters and put them into
9

Table 2: Summary statistic over all treatments
mean medianstandarddeviation
number of letters folded 178.04 150.00 134.06minutes in the lab 71.90 65.00 40.61
effort 2.416 2.326 0.69net wage rate (in euro) 16.42 14.40 11.47
Table 3: Effort levels (number of folded letters per minute) in the tax-free, 25% tax and 50% tax treatments
treatment mean medianstandarddeviation
tax-free 2.283 2.134 0.74625% tax 2.687 2.410 0.74650% tax 2.604 2.786 0.484
an envelope. The subjects were told that they could decide how long to stay in the
laboratory. They could stop working whenever they wanted to and there was no
time restriction. The subjects were located at computer desks, separated from each
other, in soundproof booths. No communication was allowed during the experiment.
Subjects were paid immediately after the experiment and received a show-up fee of
5 euros.
5 Results
The subjects folded about 43,300 letters over all treatments. Table 2 summarizes the
mean, median, and the standard deviation of the number of folded letters, the time
spent in the laboratory, the effort and the realized net income over all treatments.
The first hypothesis concerns the question of how subjects react to a simple flat
tax. A comparison of the effort levels in the tax-free treatment with those in the
25% tax and 50% tax treatments clearly shows that the effort levels under a flat tax
are higher than without taxation (see table 3 and figure 4).
The differences between the tax-free and the 25% tax treatments and between
the tax-free and the 50% tax treatments are highly significant (p = 0.007 and 0.005,
Mann-Whitney-U-test, two-sided). Obviously, the first part of hypothesis 1 can be
confirmed. The subjects seem to ignore the flat tax to a great extent and demon-
strate a kind of “net-wage illusion”. They behave as if a significant fraction of the
10

2.102.202.302.402.502.602.702.80
tax free 25% tax 50% tax
Figure 4: Effort levels on average in the tax-free, 25% tax and 50% taxtreatment
tax is part of their net income. We can conclude that the tax bias ∆τ is negative
(i.e. an underestimation of the tax effect) in the 25% tax and 50% tax treatments.
The second part of hypothesis 1 claims that an increase in the flat tax rate from
25% to 50% will increase the tax salience and, therefore, lead to a smaller tax bias.
The data show that there is no significant difference between the efforts in the 25%
tax and 50% tax treatments (p = 0.860, Mann-Whitney-U-test, two-sided). If it is
true that the effort depends on the perceived net wage rate, this implies that the
net wage rates in both tax treatments are perceived as identical. Obviously, the two
effects described in section 3.1 cancel each other out. On the one hand, the increase
in the gross wage rate (from 12 to 18 cent per letter) increases the perceived net
wage rate for a given net-wage illusion. On the other hand, the increase of the tax
rate makes taxation more salient, which leads to a lower tax misperception and,
therefore, to a decrease in the perceived net wage rate. While the first effect makes
the effort level go up, the second works in the opposite direction. Thus, the second
part of hypothesis 1 is also confirmed. A higher tax rate increases the tax salience
and leads to a smaller tax misperception.
In order to test the second hypothesis, it is necessary to compare the results of
the progressive tax treatments with and without the graphical illustration. Table 4
and figure 5 show the effort levels in these treatments.
As a result, the graphical presentation of the tax leads to lower effort levels for
both kinds of progressive tax scales. The fact that this is only weakly significant
for the indirect progressive tax scale (p = 0.057) is surprising because the tax scale
used in both the indirect (-) and the indirect (+) treatments is already very simple
considering that it has only two marginal tax rates (0% and 50%). Nevertheless,
explaining this simple form of taxation in more detail causes a significant decrease
in the effort level. On the other hand, this is not true for the much more complex
11

Table 4: Effort levels in the treatments with a progressive tax scale
treatment mean medianstandarddeviation
indirect (-) 2.569 2.470 0.637indirect (+) 2.273 2.151 0.721
direct (-) 2.421 2.283 0.703direct (+) 2.208 2.176 0.582
2.10
2.20
2.30
2.40
2.50
2.60
indirect (-) indirect (+) direct (-) direct (+)
Figure 5: Effort levels on average in the treatments with a progressivetax scale
tax scale in the direct (-) and direct (+) tax treatments. A possible explanation for
this result is that the complexity of a tax scale is a determinant of its salience. The
more complex taxes are, the more salient the taxation is. This interpretation is in
line with the observation that the extremely simple tax scales in the 25% tax and
50% tax treatments are not perceived correctly.
The last hypothesis concerns the role of experiences made with income taxation.
Table 5 shows the average and median (in brackets) effort levels of experienced (high
income) and inexperienced (low income) subjects. The distribution of experienced
and inexperienced subjects in each treatment is presented in brackets in the first
column and the p-value results from a Mann-Whitney-U-test (two-sided). Figure 6
plots the average effort levels of both subject groups.
It turns out that experience with taxation does not provide any protection against
tax perception bias at all. In the flat tax treatments, 25% tax and 50% tax, the
higher income group always shows a higher effort level than the low income subjects
(although not significantly). Experience becomes important when the tax scales
become more complex. Starting with the indirect (-) treatment, the effort levels of
the experienced subjects are always below those of the inexperienced. It is only in
the direct (-) treatment, however, that the difference is significant. In this treatment,
expert knowledge has the highest value because the tax scale is complicated and only
described verbally. But the results of the direct (+) treatment demonstrate that
12

Table 5: Average and median (in brackets) effort levels of experiencedand inexperienced subjects
treatmentinexperienced
experienced p-value
tax-free[19/41]
2.171(2.083)
2.335(2.281)
0.409
25% tax[6/29]
2.618(2.512)
2.743(2.380)
0.861
50% tax[10/19]
2.489(2.401)
2.685(2.818)
0.359
indirect (–)[15/11]
2.712(2.651)
2.375(2.393)
0.139
indirect (+)[5/23]
2.760(2.108)
2.148(2.151)
0.490
direct (–)[10/16]
2.681(2.532)
2.314(2.162)
0.092
direct (+)[15/17]
2.294(2.313)
2.155(2.000)
0.257
2.10
2.20
2.30
2.40
2.50
2.60
2.70
2.80
tax free 25% tax 50% tax indirect (-) indirect (+) direct (-) direct (+)
inexperienced subjects experienced subjects
Figure 6: Average effort levels of experienced and inexperienced subjects
13

expert knowledge can be substituted by a better and more transparent presentation
of the tax.
Table 6 shows the results of a linear regression analysis with the effort level as the
dependent variable. As independent variables, we use dummies for each treatment,
which take the value of 1 if a subject participated in the respective treatment.
The tax free treatment is the default and, therefore, the coefficient of a dummy
variable measures the difference between the respective tax treatment and the tax
free treatment. Furthermore, we include the information we obtained from an ex
post questionnaire: dummies are introduced for ‘gender’ (female = 0, male = 1),
‘education’ (low educational level = 0, high educational level = 1)4 and ‘income’ (net
household income per month below e 2,000 = 0, above e 2,000 = 1). Furthermore,
we use a dummy which takes the value of 1 if the person is in an ‘executive position’,
a dummy for ‘brain work’ (no brain work = 0, brain work = 1), and a dummy for the
question of whether the person had worked the day the experiment was carried out
(if yes then ‘worked today’ = 1). The variable ‘age’ is measured on a 6-point scale
from 1 (20 – 25) to 6 (older than 65). We further asked the subjects how they felt
at work in general (‘value work’) and how exhausting they found the experiment
(‘experiment exertion’). Both were measured on a 10-point scale from 1 (totally
dissatisfied / relaxing) to 10 (deeply satisfied / exhausting). The variable ‘hours
per week’ indicates the number of hours a participant works per week on average.
We consider the results of all the subjects in model 1 and 2, whereas we split the
subject pool into those who earned more than 2,000 euros (experienced subjects)
and those with an income below that level (inexperienced subjects) in models 3 and
4 to control for the experience effect.
In general, the results of our regression analyses are in line with our previous
findings. With respect to model 1 and 2, we find a significant increase in the effort in
both flat tax treatments. This increase is also observed in the other models for both
experienced and inexperienced subjects, however, the difference is not significant
at all. In (nearly) all models, we observe a somewhat smaller increase in the 50%
tax treatment than in the 25% tax treatment which confirms our conjecture that a
higher tax rate increases tax salience and, therefore, decreases tax misperceptions.
Furthermore, the analyses confirm our observation that a more transparent tax pre-
sentation reduces tax biases (except for the inexperienced subjects with the indirect
progressive taxation).
4Low educational level includes the answers: no completed apprenticeship, completed appren-ticeship, and master craftsman. High educational level includes the answers: college (university ofapplied sciences) degree and university degree.
14

Table 6: Linear regressions with “effort” as dependent variable
model 1 model 2 model 3 model 4all
subjects
all
subjects
inexp.
subjects
exp.
subjects
inexp.
subjects
exp.
subjects
constant 2.283*** 2.658*** 2.171*** 2.335*** 2.972*** 2.497***25% tax 0.403*** 0.279** 0.447 0.408** 0.228 0.276*50% tax 0.321** 0.265* 0.318 0.350* 0.267 0.251indirect (-) 0.286* 0.175 0.541** 0.039 0.339 0.060indirect (+) -0.011 -0.102 0.589* -0.187 0.585* -0.287*direct (-) 0.138 0.066 0.510* -0.022 0.321 -0.085direct (+) -0.076 -0.142 0.123 -0.180 0.004 -0.160
age -0.159*** -0.160** -0.188***gender -0.469*** -0.548* -0.433***education 0.114 0.000 0.141hours worked 0.001 -0.005 0.004brain work 0.058 0.113 0.021executive position 0.070 -0.046 0.144worked today 0.148 0.157 0.154value work 0.054** 0.036 0.054**experiment exertion -0.031 -0.027 -0.019income -0.075 — —
R2 0.065 0.291 0.104 0.104 0.315 0.346adjusted R2 0.041 0.238 0.031 0.068 0.154 0.275model’s p-value 0.013 0.000 0.220 0.011 0.033 0.000
*** p < 0.01, ** p < 0.05, * p < 0.1
The results of model 3 and 4 reveal a strong tax experience effect in the complex
tax treatments. Compared to the results of the tax free treatment, inexperienced
subjects increased their effort in all progressive tax treatments, but experienced sub-
jects did not. In nearly all of these treatments, subjects with tax experience actually
decreased their effort. However, in the direct tax treatment, the large difference be-
tween the groups vanishes when individuals received a graphical illustration of the
tax system. Therefore, we can conclude that a very transparent tax presentation
can compensate for tax inexperience.
With respect to demographic variables, we observe that “age”, “gender”, and
“value work” have a significant negative impact on effort. However, controlling
for these effects does not change the significant treatment effects we have already
detected.
15

6 Discussion
The experimental results reported in this paper demonstrate that the perception of
taxes can be heavily biased. Surprisingly, it turns out that most notably very simple
forms of taxation are in danger of causing tax perception bias. The strongest form
of misperception was observed when the labor income was subject to a flat tax of
25%, with our non-student subjects increasing their effort significantly as compared
to the subjects in the tax-free treatment. The tax rate itself is also a determinant
of tax perception. The stronger the taxation, the more salient the tax – even a
simple flat tax. A possible explanation for the higher effort levels in the treatments
with 25% and 50% taxes could be that subjects like to work for the government or
derive utility from producing public goods. If this is a true explanation, however, we
should not observe that subjects work less hard if they are more aware of the tax.
But the results of our last four treatments show that this is precisely what happens.
A promising way to overcome the misperception of taxes is their transparent
presentation. Once again, this is particularly true for simple taxes. Progressive tax
scales with more than one marginal tax rate have a higher salience, simply because
they are more complex. Nevertheless, a graphical illustration also improves the
correctness of tax perception for these tax scales.
Experience with taxation does not prevent taxpayers from experiencing a net-
wage illusion when taxes are simple and, therefore, not salient. It does, however,
become valuable when taxes are more complicated and in need of more transparent
explanation. Furthermore, this experience can be supplemented with a clear pre-
sentation of complicated tax scales so that people with little, or no, tax experience
also have a fair chance of perceiving taxes as they are.
Appendix
A Instructions
The instructions of all the treatments differ only in one specific passage. Therefore,
we first present the general instructions, which are identical in all the treatments,
and then the specific instructions of each treatment. The instructions were originally
written in German.
16

A.1 General instructions
By participating in this experiment, you have the opportunity to earn money. The
payoff at the end of the experiment depends on your individual effort. Please read the
instructions carefully. If you have any further questions, please ask the experimenter.
Primary note:
The aim of this experiment is to obtain information about the individual labor
supply. For this purpose you will be confronted with a real work task, with which
you earn money. To compare the data of various research participants, a work task
has been chosen in such a way that absolutely no previous knowledge or special
talent is required and that it is easy to measure.
Procedure:
We would like to point out that communicating with other participants or leaving
your seat is not allowed for the duration of the whole experiment. After reading the
instructions, you will receive letters and envelopes. Your task is to fold these letters
and to put them into the envelopes. Please seal the envelopes. The letters are used
to acquire research participants in Magdeburg.
You determine your working time yourself. This means that there is no time
limit and you can stop the experiment at any time. Afterwards, you will receive
your payoff in accordance with the following rule and you are then allowed to leave
the laboratory.
[specific instructions of a treatment]
After this experiment, we will ask you to fill out a short questionnaire. We would
like to emphasize that we do not record you name at any time and, therefore, all
your statements remain anonymous.
Enjoy yourself!
A.2 Specific instructions of the tax-free treatment
You will receive a payoff at the end of the experiment that depends on the number
of letters folded and put into envelopes. You will receive 9 cents for each letter. If
you fold on average 2 letters per minute, this leads to an hourly wage of 10.80 euros,
2.5 letters to 13.50 euros and 3 letters to 16.20 euros. The money you earn will be
paid to you in cash at the end of the experiment.
17

A.3 Specific instructions of the 25% tax treatment
You will receive a payoff at the end of the experiment that depends on the number
of letters folded and put into envelopes. You will receive 12 cents for each letter. If
you fold on average 2 letters per minute, this leads to an hourly wage of 14.40 euros,
2.5 letters to 18.00 euros and 3 letters to 21.60 euros. A tax at a rate of 25% will
be deducted from your earned amount, and the rest will be paid to you in cash at
the end of the experiment.
A.4 Specific instructions of the 50% tax treatment
You will receive a payoff at the end of the experiment that depends on the number
of letters folded and put into envelopes. You will receive 18 cents for each letter. If
you fold on average 2 letters per minute, this leads to an hourly wage of 21.60 euros,
2.5 letters to 27.00 euros and 3 letters to 32.40 euros. A tax at a rate of 50% will
be deducted from your earned amount, and the rest will be paid to you in cash at
the end of the experiment.
A.5 Specific instructions of the indirect (-) and indirect (+)
tax treatment
You will receive a payoff at the end of the experiment that depends on the number
of letters folded and put into envelopes. You will receive 12 cents for each letter.
If you fold on average 2 letters per minute, this leads to an hourly wage of 14.40
euros, 2.5 letters to 18.00 euros and 3 letters to 21.60 euros. Your income will not
be subject to a tax up to an earned amount of 13.50 euros. A tax at a rate of 50%
will be deducted from each amount above 13.50 euros, and the rest will be paid in
cash to you at the end of the experiment.
A.6 Specific instructions of the direct (-) and direct (+) tax
treatment
You will receive a payoff at the end of the experiment that depends on the number
of letters folded and put into envelopes. You will receive 12 cents for each letter. If
you fold on average 2 letters per minute, this leads to an hourly wage of 14.40 euros,
2.5 letters to 18.00 euros and 3 letters to 21.60 euros. A tax will be deducted from
your earned amount, and the rest will be paid to you at the end of the experiment in
cash. The tax burden depends on your total amount and is determined as follows:
18

Bracket 1: Your total amount is between 0.00 euros and 5.00 euros:
If your total amount is not higher than 5.00 euros, no tax will be
imposed.
Bracket 2: Your total amount is between 5.01 euros and 8.00 euros:
A tax is deducted from each amount above 5.00 euros. The tax
rate uniformly increases from 15% (at 5.01 euros) to 25% (at 8.00
euros) in this bracket.
Bracket 3: Your total amount is between 8.01 euros and 40.25 euros:
If your total amount is in this bracket, a lump sum tax of 0.60 euros
will be levied.
In addition to this tax, a further tax is deducted from each amount
above 8.00 euros. The tax rate uniformly increases from 25% (at
8.01 euros) to 50% (at 40.25 euros) in this bracket.
Bracket 4: Your total amount is above 40.25 euros:
If your total amount is in this bracket, a lump sum tax of 12.70
euros will be levied.
In addition to this tax, a further tax is deducted from each amount
above 40.25 euros. The tax rate is always 50%.
19

B Raw Data
subject treatment folded letterstime
(min)
effort
(letters per min)tax experience
1 tax-free 94 39 2.410 inexperienced
2 tax-free 30 24 1.250 inexperienced
3 tax-free 93 44 2.114 inexperienced
4 tax-free 215 73 2.945 inexperienced
5 tax-free 217 107 2.028 inexperienced
6 tax-free 156 64 2.438 inexperienced
7 tax-free 275 59 4.661 inexperienced
8 tax-free 217 84 2.583 inexperienced
9 tax-free 202 101 2.000 inexperienced
10 tax-free 189 75 2.520 experienced
11 tax-free 127 91 1.396 experienced
12 tax-free 184 76 2.421 experienced
13 tax-free 49 39 1.256 experienced
14 tax-free 157 79 1.987 experienced
15 tax-free 120 81 1.481 experienced
16 tax-free 268 91 2.945 experienced
17 tax-free 160 84 1.905 experienced
18 tax-free 231 91 2.538 experienced
19 tax-free 30 17 1.765 experienced
20 tax-free 58 33 1.758 experienced
21 tax-free 107 31 3.452 experienced
22 tax-free 114 62 1.839 experienced
23 tax-free 192 70 2.743 experienced
24 tax-free 73 32 2.281 experienced
25 tax-free 145 58 2.500 inexperienced
26 tax-free 105 53 1.981 inexperienced
27 tax-free 100 48 2.083 inexperienced
28 tax-free 219 105 2.086 inexperienced
29 tax-free 138 64 2.156 inexperienced
30 tax-free 25 17 1.471 inexperienced
31 tax-free 54 26 2.077 inexperienced
32 tax-free 141 108 1.306 inexperienced
33 tax-free 104 56 1.857 inexperienced
34 tax-free 52 40 1.300 inexperienced
35 tax-free 150 80 1.875 experienced
36 tax-free 200 94 2.128 experienced
37 tax-free 40 32 1.250 experienced
38 tax-free 122 53 2.302 experienced
39 tax-free 148 61 2.426 experienced
20

40 tax-free 37 14 2.643 experienced
41 tax-free 57 23 2.478 experienced
42 tax-free 92 50 1.840 experienced
43 tax-free 55 36 1.528 experienced
44 tax-free 146 67 2.179 experienced
45 tax-free 78 43 1.814 experienced
46 tax-free 100 71 1.408 experienced
47 tax-free 214 100 2.140 experienced
48 tax-free 217 94 2.309 experienced
49 tax-free 200 101 1.980 experienced
50 tax-free 201 67 3.000 experienced
51 tax-free 339 107 3.168 experienced
52 tax-free 306 118 2.593 experienced
53 tax-free 165 44 3.750 experienced
54 tax-free 55 28 1.964 experienced
55 tax-free 108 32 3.375 experienced
56 tax-free 288 60 4.800 experienced
57 tax-free 405 169 2.396 experienced
58 tax-free 217 114 1.904 experienced
59 tax-free 153 61 2.508 experienced
60 tax-free 189 51 3.706 experienced
61 25% tax 410 164 2.500 inexperienced
62 25% tax 150 53 2.830 inexperienced
63 25% tax 100 42 2.381 inexperienced
64 25% tax 308 122 2.525 inexperienced
65 25% tax 1174 312 3.763 experienced
66 25% tax 166 74 2.243 experienced
67 25% tax 132 47 2.809 experienced
68 25% tax 289 66 4.379 experienced
69 25% tax 145 50 2.900 experienced
70 25% tax 230 95 2.421 experienced
71 25% tax 215 61 3.525 experienced
72 25% tax 71 33 2.152 experienced
73 25% tax 218 125 1.744 experienced
74 25% tax 305 129 2.364 experienced
75 25% tax 19 13 1.462 not stated
76 25% tax 175 106 1.651 inexperienced
77 25% tax 432 113 3.823 inexperienced
78 25% tax 363 122 2.975 experienced
79 25% tax 38 16 2.375 experienced
80 25% tax 525 150 3.500 experienced
81 25% tax 1213 312 3.888 experienced
82 25% tax 144 64 2.250 experienced
21

83 25% tax 138 59 2.339 experienced
84 25% tax 333 109 3.055 experienced
85 25% tax 300 102 2.941 experienced
86 25% tax 151 65 2.323 experienced
87 25% tax 100 49 2.041 experienced
88 25% tax 188 94 2.000 experienced
89 25% tax 322 141 2.284 experienced
90 25% tax 160 77 2.078 experienced
91 25% tax 149 38 3.921 experienced
92 25% tax 63 17 3.706 experienced
93 25% tax 201 59 3.407 experienced
94 25% tax 21 14 1.500 experienced
95 25% tax 119 50 2.380 experienced
96 25% tax 151 66 2.288 experienced
97 50% tax 155 80 1.938 not stated
98 50% tax 173 60 2.883 not stated
99 50% tax 268 114 2.351 inexperienced
100 50% tax 120 58 2.069 inexperienced
101 50% tax 356 114 3.123 inexperienced
102 50% tax 100 43 2.326 inexperienced
103 50% tax 226 123 1.837 inexperienced
104 50% tax 269 92 2.924 inexperienced
105 50% tax 83 44 1.886 experienced
106 50% tax 233 72 3.236 experienced
107 50% tax 123 57 2.158 experienced
108 50% tax 200 69 2.899 experienced
109 50% tax 315 104 3.029 inexperienced
110 50% tax 332 119 2.790 inexperienced
111 50% tax 255 104 2.452 inexperienced
112 50% tax 131 66 1.985 inexperienced
113 50% tax 279 86 3.244 experienced
114 50% tax 182 66 2.758 experienced
115 50% tax 31 11 2.818 experienced
116 50% tax 62 23 2.696 experienced
117 50% tax 195 70 2.786 experienced
118 50% tax 175 74 2.365 experienced
119 50% tax 271 90 3.011 experienced
120 50% tax 143 44 3.250 experienced
121 50% tax 350 124 2.823 experienced
122 50% tax 245 81 3.025 experienced
123 50% tax 122 42 2.905 experienced
124 50% tax 182 79 2.304 experienced
125 50% tax 331 102 3.245 experienced
22

126 50% tax 179 91 1.967 experienced
127 50% tax 181 110 1.645 experienced
128 indirect (-) 113 53 2.132 inexperienced
129 indirect (-) 250 75 3.333 inexperienced
130 indirect (-) 112 50 2.240 inexperienced
131 indirect (-) 200 80 2.500 inexperienced
132 indirect (-) 197 82 2.402 inexperienced
133 indirect (-) 393 103 3.816 inexperienced
134 indirect (-) 226 79 2.861 inexperienced
135 indirect (-) 116 65 1.785 inexperienced
136 indirect (-) 200 95 2.105 experienced
137 indirect (-) 101 66 1.530 experienced
138 indirect (-) 150 56 2.679 experienced
139 indirect (-) 60 19 3.158 experienced
140 indirect (-) 100 47 2.128 experienced
141 indirect (-) 51 36 1.417 experienced
142 indirect (-) 240 61 3.934 inexperienced
143 indirect (-) 112 48 2.333 inexperienced
144 indirect (-) 120 43 2.791 inexperienced
145 indirect (-) 114 43 2.651 inexperienced
146 indirect (-) 200 67 2.985 inexperienced
147 indirect (-) 50 23 2.174 inexperienced
148 indirect (-) 222 81 2.741 inexperienced
149 indirect (-) 112 54 2.074 experienced
150 indirect (-) 100 41 2.439 experienced
151 indirect (-) 181 71 2.549 experienced
152 indirect (-) 135 37 3.649 experienced
153 indirect (-) 201 84 2.393 experienced
154 indirect (+) 124 46 2.696 not stated
155 indirect (+) 112 62 1.806 inexperienced
156 indirect (+) 347 188 1.846 inexperienced
157 indirect (+) 156 74 2.108 inexperienced
158 indirect (+) 92 51 1.804 experienced
159 indirect (+) 46 40 1.150 experienced
160 indirect (+) 186 84 2.214 experienced
161 indirect (+) 347 123 2.821 experienced
162 indirect (+) 104 63 1.651 experienced
163 indirect (+) 132 97 1.361 experienced
164 indirect (+) 128 60 2.133 experienced
165 indirect (+) 291 108 2.694 experienced
166 indirect (+) 233 77 3.026 experienced
167 indirect (+) 368 73 5.041 inexperienced
168 indirect (+) 186 62 3.000 inexperienced
23

169 indirect (+) 129 64 2.016 experienced
170 indirect (+) 191 86 2.221 experienced
171 indirect (+) 55 25 2.200 experienced
172 indirect (+) 200 93 2.151 experienced
173 indirect (+) 100 52 1.923 experienced
174 indirect (+) 112 44 2.545 experienced
175 indirect (+) 149 55 2.709 experienced
176 indirect (+) 167 61 2.738 experienced
177 indirect (+) 300 121 2.479 experienced
178 indirect (+) 183 88 2.080 experienced
179 indirect (+) 127 51 2.490 experienced
180 indirect (+) 118 81 1.457 experienced
181 indirect (+) 41 23 1.783 experienced
182 indirect (+) 166 94 1.766 experienced
183 direct (-) 150 67 2.239 inexperienced
184 direct (-) 200 65 3.077 inexperienced
185 direct (-) 285 136 2.096 inexperienced
186 direct (-) 121 53 2.283 inexperienced
187 direct (-) 234 54 4.333 inexperienced
188 direct (-) 141 55 2.564 inexperienced
189 direct (-) 150 64 2.344 inexperienced
190 direct (-) 146 52 2.808 inexperienced
191 direct (-) 350 140 2.500 inexperienced
192 direct (-) 133 63 2.111 experienced
193 direct (-) 127 79 1.608 experienced
194 direct (-) 115 51 2.255 experienced
195 direct (-) 71 34 2.088 experienced
196 direct (-) 148 73 2.027 experienced
197 direct (-) 101 93 1.086 experienced
198 direct (-) 197 66 2.985 experienced
199 direct (-) 142 44 3.227 experienced
200 direct (-) 197 89 2.213 experienced
201 direct (-) 316 78 4.051 experienced
202 direct (-) 134 68 1.971 experienced
203 direct (-) 120 78 1.538 not stated
204 direct (-) 100 39 2.564 inexperienced
205 direct (-) 181 74 2.446 experienced
206 direct (-) 256 93 2.753 experienced
207 direct (-) 115 68 1.691 experienced
208 direct (-) 306 119 2.571 experienced
209 direct (-) 60 31 1.935 experienced
210 direct (+) 66 38 1.737 not stated
211 direct (+) 320 137 2.336 not stated
24

212 direct (+) 322 143 2.252 not stated
213 direct (+) 60 30 2.000 inexperienced
214 direct (+) 220 72 3.056 inexperienced
215 direct (+) 180 64 2.813 inexperienced
216 direct (+) 229 97 2.361 inexperienced
217 direct (+) 204 93 2.194 inexperienced
218 direct (+) 229 99 2.313 inexperienced
219 direct (+) 245 105 2.333 inexperienced
220 direct (+) 100 49 2.041 inexperienced
221 direct (+) 66 49 1.347 experienced
222 direct (+) 138 47 2.936 experienced
223 direct (+) 60 27 2.222 experienced
224 direct (+) 52 30 1.733 experienced
225 direct (+) 42 27 1.556 experienced
226 direct (+) 189 95 1.989 experienced
227 direct (+) 118 56 2.107 not stated
228 direct (+) 231 122 1.893 inexperienced
229 direct (+) 60 40 1.500 inexperienced
230 direct (+) 307 135 2.274 inexperienced
231 direct (+) 80 61 1.311 inexperienced
232 direct (+) 690 238 2.899 inexperienced
233 direct (+) 259 109 2.376 inexperienced
234 direct (+) 222 73 3.041 inexperienced
235 direct (+) 243 102 2.382 experienced
236 direct (+) 110 57 1.930 experienced
237 direct (+) 41 21 1.952 experienced
238 direct (+) 42 21 2.000 experienced
239 direct (+) 46 34 1.353 experienced
240 direct (+) 131 63 2.079 experienced
241 direct (+) 40 28 1.429 experienced
242 direct (+) 99 24 4.125 experienced
243 direct (+) 41 16 2.563 experienced
244 direct (+) 41 19 2.158 experienced
245 direct (+) 147 51 2.882 experienced
25

References
Andreoni, J., Miller, J., 2002. Giving according to garp: An experimental test of
the consistency of preferences for altruism. Econometrica 70 (2), 737–753.
Bartolome, C. A. d., 1995. Which tax rate do people use: Average or marginal?
Journal of Public Economics 56 (1), 79–96.
Bolton, G. E., Ockenfels, A., 2000. Erc: A theory of equity, reciprocity, and compe-
tition. The American economic review 90 (1), 166–193.
Chetty, R., Looney, A., Kroft, K., 2009. Salience and taxation: theory and evidence.
The American economic review 99 (4), 1145–1177.
Fehr, E., Gachter, S., 1998. Reciprocity and economics: The economic implications
of homo reciprocans. European Economic Review 12.
Fehr, E., Schmidt, K. M., 1999. A theory of fairness, competition, and cooperation.
The quarterly journal of economics 114 (3), 817–868.
Finkelstein, A., 2009. E-ztax: Tax salience and tax rates*. Quarterly Journal of
Economics 124 (3), 969–1010.
Gensemer, B. L., Lean, J. A., Neenan, W. B., 1965. Awareness of marginal income
tax rates among high-income taxpayers. National Tax Journal 18 (3), 258–267.
Harrison, G. W., List, J. A., 2004. Field experiments. Journal of Economic Literature
42 (4), 1009–1055.
Lewis, A., 1978. Perceptions of tax rates. British Tax Review 6, 358–366.
Mincer, J., 1958. Investment in human capital and personal income distribution.
Journal of Political Economy 66 (4), 281–302.
Morgan, J. N., Dye, R. F., Hybels, J. H., 1977. Results from two national surveys of
philanthropic activitiy. In: Commission on Private Philanthropy and Public Needs
(Ed.), Research Papers Volume I: History, Trends, and Current Magnitudes. pp.
157–324.
Richter, W. F., 2011. Mincer equation, power law of learning, and efficient education
policy. Working Paper.
26

Ritter, F. E., Schooler, L. J., 2001. The learning curve. In: Kintch, W., Smelser,
N., Baltes, P. (Eds.), International Encyclopedia of the Social and Behavioral
Sciences. Oxford, pp. 8602–8605.
Rupert, T. J., Fischer, C. M., 1995. An empirical investigation of taxpayer awareness
of marginal tax rates. Journal of the American Taxation Association 17 (2), 36–59.
Rupert, T. J., Wright, A. M., 1998. The use of marginal tax rates in decision making:
The impact of tax rate visibility. Journal of the American Taxation Association
20 (2), 83–99.
Sausgruber, R., Tyran, J.-R., 2005. Testing the mill hypothesis of fiscal illusion.
Public Choice 122 (1), 39–68.
Sillamaa, M.-A., 1999a. How work effort responds to wage taxation: A non-linear
versus a linear tax experiment. Journal of Economic Behavior & Organization
39 (2), 219–233.
Sillamaa, M.-A., 1999b. How work effort responds to wage taxation: An experi-
mental test of a zero top marginal tax rate. Journal of Public Economics 73 (1),
125–134.
Sillamaa, M.-A., 1999c. Taxpayer behavior in response to taxation: comment and
new experimental evidence. Journal of Accounting and Public Policy 18 (2), 165–
177.
Swenson, C. W., 1988. Taxpayer behavior in response to taxation: An experimental
analysis. Journal of Accounting and Public Policy 7 (1), 1–28.
27