The Effects of Staffing and Training on Firm Productivity … The Effects of Staffing and Training...
29
MONOGRAPH The Effects of Staffing and Training on Firm Productivity and Profit Growth Before, During, and After the Great Recession Youngsang Kim and Robert E. Ployhart University of South Carolina This study integrates research from strategy, economics, and applied psychology to examine how organizations may leverage their human resources to enhance firm performance and competitive advantage. Staffing and training are key human resource management practices used to achieve firm performance through acquiring and developing human capital resources. However, little research has examined whether and why staffing and training influence firm-level financial performance (profit) growth under different environmental (economic) conditions. Using 359 firms with over 12 years of longitudinal firm-level profit data, we suggest that selective staffing and internal training directly and interactively influence firm profit growth through their effects on firm labor productivity, implying that staffing and training contribute to the generation of slack resources that help buffer and then recover from the effects of the Great Recession. Further, internal training that creates specific human capital resources is more beneficial for prerecession profitability, but staffing is more beneficial for postrecession recovery, apparently because staffing creates generic human capital resources that enable firm flexibility and adaptation. Thus, the theory and findings presented in this article have implications for the way staffing and training may be used strategically to weather economic uncertainty (recession effects). They also have important practical implications by demonstrating that firms that more effectively staff and train will outperform competitors throughout all pre- and postrecessionary periods, even after controlling for prior profitability. Keywords: staffing (recruiting and selection), training, strategic human resources, recession Understanding the factors that contribute to firm heterogeneity, growth, and competitive advantage has captivated the attention of organizational scholars for decades (e.g., Penrose, 1959). A rich literature in strategic management and economics has helped iden- tify many of these factors, but the role that people play in this process has been rather simplistic and frozen in time. This histor- ical view is beginning to unthaw, as strategic management re- searchers are increasingly examining the psychological origins of organizational effectiveness through the study of human capital resources (see Ployhart & Hale, in press). A natural progression in human capital research would be to connect to the psychological literature on staffing (recruiting and personnel selection) and train- ing, as these human resources (HR) practices profoundly shape the nature of human capital resources (e.g., Coff & Kryscynski, 2011). However, this integration has been slow to occur. One reason is because even after a century of research on staffing and training, we still know relatively little about whether they influence firm- level performance, and why any such effects may occur (Sch- neider, Smith, & Sipe, 2000). Nearly all of the prior research has been conducted at the individual level, and although it has gener- ated many important insights, recent research has been calling for direct examinations of staffing and training on firm-level perfor- mance (Schneider, Ehrhart, & Macey, 2012). For example, Ploy- hart (2012) questioned, “. . . when viewed from the lens of strategic management, one might question the extent, or at least the certainty, to which use of valid personnel selection can contribute to an organization’s competitive advantage” (p. 69). One of the reasons strategy research is often dismissive of “micro-level” research is because the latter tends to ignore the role of context and environment. In contrast to the individual level research on staffing and training, strategy research suggests that the relationships found at the firm level will be dependent on the firm’s strategy and environmental influences (Delery & Doty, 1996; Jackson & Schuler, 1995; Youndt, Snell, Dean, & Lepak, 1996). One profound type of environmental influence is an eco- nomic recession, defined as a significant decline of economic activities lasting several months (National Bureau of Economic Research [NBER], 2001). Recessions occur with regular fre- quency, yet sometimes with little warning and broadly transform the competitive landscape for organizations (Tvede, 1997). Severe This article was published Online First December 30, 2013. Youngsang Kim and Robert E. Ployhart, Management Department, University of South Carolina. This article greatly benefitted from the advice of Matt Call, Michael C. Campion, Donnie Hale, Yasemin Kor, Lynn McFarland, Anthony Nyberg, DJ Schepker, Mike Ulrich, and Patrick Wright. Correspondence concerning this article should be addressed to Youngsang Kim, Management Department, Darla Moore School of Business, University of South Carolina, Columbia, SC 29208. E-mail: youngsang.kim@ grad.moore.sc.edu Journal of Applied Psychology © 2013 American Psychological Association 2014, Vol. 99, No. 3, 361–389 0021-9010/14/$12.00 DOI: 10.1037/a0035408 361
Transcript of The Effects of Staffing and Training on Firm Productivity … The Effects of Staffing and Training...
MONOGRAPH
The Effects of Staffing and Training on Firm Productivity and ProfitGrowth Before, During, and After the Great Recession
Youngsang Kim and Robert E. PloyhartUniversity of South Carolina
This study integrates research from strategy, economics, and applied psychology to examine howorganizations may leverage their human resources to enhance firm performance and competitiveadvantage. Staffing and training are key human resource management practices used to achieve firmperformance through acquiring and developing human capital resources. However, little research hasexamined whether and why staffing and training influence firm-level financial performance (profit)growth under different environmental (economic) conditions. Using 359 firms with over 12 years oflongitudinal firm-level profit data, we suggest that selective staffing and internal training directly andinteractively influence firm profit growth through their effects on firm labor productivity, implying thatstaffing and training contribute to the generation of slack resources that help buffer and then recover fromthe effects of the Great Recession. Further, internal training that creates specific human capital resourcesis more beneficial for prerecession profitability, but staffing is more beneficial for postrecessionrecovery, apparently because staffing creates generic human capital resources that enable firm flexibilityand adaptation. Thus, the theory and findings presented in this article have implications for the waystaffing and training may be used strategically to weather economic uncertainty (recession effects). Theyalso have important practical implications by demonstrating that firms that more effectively staff andtrain will outperform competitors throughout all pre- and postrecessionary periods, even after controllingfor prior profitability.
Keywords: staffing (recruiting and selection), training, strategic human resources, recession
Understanding the factors that contribute to firm heterogeneity,growth, and competitive advantage has captivated the attention oforganizational scholars for decades (e.g., Penrose, 1959). A richliterature in strategic management and economics has helped iden-tify many of these factors, but the role that people play in thisprocess has been rather simplistic and frozen in time. This histor-ical view is beginning to unthaw, as strategic management re-searchers are increasingly examining the psychological origins oforganizational effectiveness through the study of human capitalresources (see Ployhart & Hale, in press). A natural progression inhuman capital research would be to connect to the psychologicalliterature on staffing (recruiting and personnel selection) and train-ing, as these human resources (HR) practices profoundly shape thenature of human capital resources (e.g., Coff & Kryscynski, 2011).
However, this integration has been slow to occur. One reason isbecause even after a century of research on staffing and training,we still know relatively little about whether they influence firm-level performance, and why any such effects may occur (Sch-neider, Smith, & Sipe, 2000). Nearly all of the prior research hasbeen conducted at the individual level, and although it has gener-ated many important insights, recent research has been calling fordirect examinations of staffing and training on firm-level perfor-mance (Schneider, Ehrhart, & Macey, 2012). For example, Ploy-hart (2012) questioned, “. . . when viewed from the lens ofstrategic management, one might question the extent, or at least thecertainty, to which use of valid personnel selection can contributeto an organization’s competitive advantage” (p. 69).
One of the reasons strategy research is often dismissive of“micro-level” research is because the latter tends to ignore the roleof context and environment. In contrast to the individual levelresearch on staffing and training, strategy research suggests thatthe relationships found at the firm level will be dependent on thefirm’s strategy and environmental influences (Delery & Doty,1996; Jackson & Schuler, 1995; Youndt, Snell, Dean, & Lepak,1996). One profound type of environmental influence is an eco-nomic recession, defined as a significant decline of economicactivities lasting several months (National Bureau of EconomicResearch [NBER], 2001). Recessions occur with regular fre-quency, yet sometimes with little warning and broadly transformthe competitive landscape for organizations (Tvede, 1997). Severe
This article was published Online First December 30, 2013.Youngsang Kim and Robert E. Ployhart, Management Department,
University of South Carolina.This article greatly benefitted from the advice of Matt Call, Michael C.
Campion, Donnie Hale, Yasemin Kor, Lynn McFarland, Anthony Nyberg,DJ Schepker, Mike Ulrich, and Patrick Wright.
Correspondence concerning this article should be addressed to YoungsangKim, Management Department, Darla Moore School of Business, Universityof South Carolina, Columbia, SC 29208. E-mail: [email protected]
Journal of Applied Psychology © 2013 American Psychological Association2014, Vol. 99, No. 3, 361–389 0021-9010/14/$12.00 DOI: 10.1037/a0035408
361

recessions require fundamental changes to organizational strategy(Latham & Braun, 2011), and hence have the potential to influencethe value of staffing and training on firm performance.
The purpose of this study was to integrate scholarship on eco-nomics, strategy, and firm performance, with industrial-organizational scholarship on staffing and training, to examinewhether firms that use more rigorous staffing and training outper-form firms that do not—before, during, and recovering from theGreat Recession.1 We show that such an integration leads toseveral new insights that contradict long-standing findings withineach literature independently. First, the findings demonstrate thefirm-level strategic value of staffing and training, suggesting thatsuch practices enhance not only internal performance but alsofinancial performance growth that differentiates the firm fromcompetitors. Examining effects on firm-level performance growthresponds to criticisms that staffing and training are not strategicand has, as Schneider et al. (2012) put it, “. . . severely held backprogress . . .” (p. 97). Second, we demonstrate that at the firmlevel, staffing and training contribute to financial performancegrowth due to enhancing the firm’s labor productivity. This me-diated model connects micro scholarship (which tends to focus oninternal firm performance) with macro scholarship (which tends tofocus on external firm performance) to illuminate “the black box”between HR practices and external firm performance (B. E. Becker& Huselid, 2006). Finally, we show that the mediated effects ofstaffing and training on financial growth differ between pre- andpostrecession periods. These conditional effects are consistent withpredictions from the strategy literature, but somewhat inconsistentwith the contextually invariant findings typically observed at theindividual level. We use a longitudinal design that precedes andencompasses the Great Recession, which offers a “naturalisticexperiment” to test this question. A focus on financial growthfurther helps demonstrate the use of staffing and training to builda firm’s competitive advantage (Peteraf & Barney, 2003) and addsrigor into theory building and testing (Mitchell & James, 2001;Wright & Haggerty, 2005). It also contributes to a broader call forunderstanding the effects of recessions on organizations (Latham& Braun, 2011). In terms of practical contributions, we show howstaffing and training help firms buffer the deleterious effects ofeconomic recessions and recover more quickly.
To develop these contributions, we examine the relationshipsbetween selective staffing, internal training, labor productivity,and firm financial performance (profit) growth using a sample of359 firms with objective financial performance data collected from1999 to 2011. Staffing and training are operationalized in terms ofthe firm’s selection ratio (number of full-time hires/number offull-time applicants) and proportion of full-time employees trainedinternally (measured in 2005). Utility analyses suggest that selec-tion ratio is one of the strongest determinants of the overall qualityand value of staffing systems (Boudreau & Rynes, 1985; Cabrera& Raju, 2001; Cascio, 2000; Cronbach & Gleser, 1965; Taylor &Russell, 1939). Because all firms in this study used at least onetype of formal staffing practice (e.g., interview, cognitive tests),selection ratio represents a proxy for the quality of generic humancapital resources, where more selective systems produce higherquality (Cabrera & Raju, 2001). Percentage of employees inter-nally trained has been widely used as an indicator of a firm’sdevelopment activities that enhance firm-specific human capital
resources (e.g., Delaney & Huselid, 1996; Russell, Terborg, &Powers, 1985; Tharenou, Saks, & Moore, 2007).
Theoretical Framework
The psychology and strategic human resource management(SHRM) literatures provide a rich theoretical foundation suggest-ing that HR should play an important role in achieving a firm’scompetitive advantage (Combs, Liu, Hall, & Ketchen, 2006;Huselid, 1995; Wright, McMahan, & McWilliams, 1994). Staffingand training are particularly vital HR functions for influencing theacquisition and development of employees’ knowledge, skills,abilities, or other characteristics (KSAOs; Jiang, Lepak, Hu, &Baer, 2012; Lepak, Liao, Chung, & Harden, 2006). In the aggre-gate, these employee KSAOs comprise organizational level formsof human capital resources that contribute to a firm’s performance(Ployhart & Moliterno, 2011). Human capital resources are com-posed of two types (Barney & Wright, 1998). Generic humancapital resources are based on KSAOs such as general cognitiveability or knowledge that are valuable in different contexts ororganizations. Specific human capital resources are based onKSAOs such as knowledge and skills that are mainly valuable toa particular organization. The strategy literature suggests thatspecific human capital resources are the more proximal determi-nant of firm competitive advantage because they are harder tobuild and imitate (e.g., Hatch & Dyer, 2004). Staffing is expectedto primarily impact the acquisition of generic human capital re-sources, whereas training is expected to primarily impact thedevelopment of specific human capital resources (Hatch & Dyer,2004; Lepak et al., 2006; Ployhart, Van Iddekinge, & MacKenzie,2011).
However, it is still relatively unclear how and why staffing andtraining generate financial performance growth over time. Toaddress this neglect, we draw from multilevel staffing models(Ployhart, 2006; Ployhart & Schneider, 2002) and human capitalresearch (Crook, Todd, Combs, Woehr, & Ketchen, 2011; Ployhart& Moliterno, 2011) to develop a mediated model linking staffingand training to firm financial growth through their effects oninternal firm performance. Internal performance and financial per-formance are related, but they are not interchangeable (Huselid,1995; Richard, Devinney, Yip, & Johnson, 2009). Internal perfor-mance is sometimes known as operational performance and re-lates to the effectiveness and efficiency by which a firm deploys itsinternal resources, including human capital resources (Crook et al.,2011; Dyer & Reeves, 1995). Internal performance is more prox-imally linked to HR activities (Lawler, Levenson, & Boudreau,2004), and “. . . closer to the actual competitive advantages createdby superior human capital” (Crook et al., 2011, p. 445). In contrast,financial performance is determined by factors both external andinternal to the firm. External influences include a firm’s compet-itive market and economic conditions (White & Hamermesh,1981). Internal influences include HR practices that affect costs orrevenues (Barney & Wright, 1998).
In this study, internal performance is operationalized in terms oflabor productivity (hereafter, simply productivity), and externalperformance is operationalized in terms of profit. Productivity is
1 The Great Recession is defined as the recessionary economic periodthat existed between December 2007 and June 2009.
362 KIM AND PLOYHART

the efficiency of a firm’s workforce to produce output. Most HRmanagers emphasize productivity because it is closely tied to HRactivities and human capital while being less influenced by factorsexternal to the firm. External performance is operationalized interms of profit, which in this study is the widely reported account-ing metric of earnings before interest and taxes (EBIT; hereafter,simply profit). Profit is the ultimate criterion for the firm, andgrowing profit is one of the most important strategic goals fororganizations (Penrose, 1959).
Productivity is a particularly important internal determinant ofprofit, but profit is also affected by environmental factors (Crooket al., 2011; Curtis, Hefley, & Miller, 1995). For example, a firmmay be highly productive but fail to generate profitability givenintense market competition, a decrease in consumer demand, orpowerful stakeholders that extract positive effects of resources(Crook, Ketchen, Combs, & Todd, 2008; Peteraf & Barney, 2003).However, greater productivity means human capital resources areefficiently deployed and hence generating above-normal returns.Enhancing productivity is therefore an important way to buildslack resources. As production increases without correspondingincreases in human capital inputs (e.g., hiring more staff), costs arereduced while profits are raised, thereby increasing financial slackresources. Slack resources can then be used to expand operations,pursue new product innovations, and reach new customers(Latham & Braun, 2008). A more productive workforce thusenables a firm to pursue additional profit-generating opportunities(Barney & Wright, 1998). For example, 3M expects employees tospend a portion of their time pursuing new product innovations,and they can enable such exploration because they have sufficientproductivity to meet required operational performance objectives.
Cumulatively, these lines of theory suggest that productivityshould contribute to profit growth over time due to greater returnsfrom human capital and the generation of slack resources (Penrose,1959). Yet, productivity is expected to be highly affected by HRinterventions and the corresponding human capital resources theygenerate (Crook et al., 2011). We argue that the reason staffing andtraining contribute to profit growth is through their effects onproductivity. However, in contrast to prior research, we expect thenature of these relationships to differ depending on whether theyare examined before or after a recession.
Prerecession Hypotheses
The first set of hypotheses focus on the effects of staffing andtraining before the Great Recession (prior to 2008). This period ismarked by a growing economy and high consumer demand. Firmsfaced enormous HR challenges in the period prior to the GreatRecession. Unemployment was low and wages were high, whichcontributed to considerable mobility and hence difficulties in at-tracting, selecting, and retaining employees. Staffing and trainingthus played vital roles in enhancing productivity, profit growth,and competitive advantage.
Staffing is the means by which firms recruit and select appli-cants with higher quality KSAOs and generic human capital(Guion, 2011; Schmitt & Chan, 1998). In multilevel staffing mod-els (Ployhart, 2006; Ployhart & Schneider, 2002), selective staffingenhances productivity and profit growth in two distinct ways. First,to the extent that KSAOs are job related and have been linked toperformance outcomes (e.g., job analysis), firms that acquire
higher quality KSAOs are more likely to have effective task andcitizenship performance, both individually and collectively (e.g.,Ployhart, Weekley, & Ramsey, 2009; Van Iddekinge et al., 2009).Costly turnover is also reduced because selective staffing increasesthe likelihood that employees have the KSAOs needed to effec-tively perform the work (Schneider, 1987). Therefore, the en-hanced productivity of individuals contributes to productivity andthen profit growth through increasing revenues and reducing costs(Cascio & Boudreau, 2008; Lepak et al., 2006; Ployhart & Sch-neider, 2002; Podsakoff, Whiting, Podsakoff, & Blume, 2009).Second, multilevel staffing models suggest selective staffing con-tributes to firm outcomes through the accumulation of generichuman capital resources. Generic human capital resources arecollective, firm-level constructs that are based on a process ofemergence (Ployhart & Moliterno, 2011). Firms better able toattract and hire the best applicants build a generic human capitalresource that is valuable, rare, and difficult to imitate (Ployhart etal., 2009), thus contributing to differentiating the firm and devel-oping a competitive advantage. Generic human capital resourcesalso contribute to firm-level productivity because higher qualitygeneric resources contribute to knowledge sharing and accumula-tion (Felin, Zenger, & Tomsik, 2009), and enhance workforceefficiency and flexibility (Evans & Davis, 2005).
We operationalize selective staffing as a firm’s overall selectionratio. Selection ratio captures the effectiveness of both recruitingand selection. Companies better able to source and attract candi-dates get a higher number of quality applicants who accept posi-tions with the firm. Further, firms that employ rigorous selectionmethods (e.g., job-related cognitive or personality tests) will gen-erate even higher applicant quality if they select only the highestscoring applicants on those assessments. Numerous studies in thepersonnel selection literature identify the fundamental role that theselection ratio has in shaping the economic utility of a selectionsystem (Alexander, Barrett, & Doverspike, 1983; Boudreau &Rynes, 1985; Cabrera & Raju, 2001; Cascio, 2000; Sackett &Ellingson, 1997; Schmidt & Hunter, 1998).
Training is the means by which firms develop more firm-specific human capital resources (Aguinis & Kraiger, 2009; Noe,2008; Tharenou et al., 2007). Providing extensive training en-hances employees’ knowledge of their firm’s operations, markets,customers, coworkers, and products, thereby enhancing productiv-ity by creating more efficient operational capabilities and routines(Aguinis & Kraiger, 2009; Arthur, Bennett, Edens, & Bell, 2003;Kozlowski, Brown, Weissbein, Cannon-Bowers, & Salas, 2000;Tharenou et al., 2007). However, internal training (training fo-cused on developing knowledge specific to a firm) is a particularlystrong determinant of productivity and profit growth. Internaltraining contributes to the accumulation of knowledge that is firmspecific and tacit, and it is this form of knowledge that is the mostproximal predictor to firm performance because it is embeddedwithin a specific firm’s context and tied to specific coworkers,processes, and customers (Grant, 1996a, 1996b; Hatch & Dyer,2004). Such knowledge increases productivity because it enhancesshared knowledge and mental models (DeChurch & Mesmer-Magnus, 2010; Evans & Davis, 2005), transactive memory (“whoknows what”; Ren & Argote, 2011), and contributes to the forma-tion of organizational routines (Parmigiani & Howard-Grenville,2011). Routines are the “. . . repetitive patterns of interdependentorganizational actions” (Parmigiani & Howard-Grenville, 2011, p.
363STAFFING, TRAINING, AND FIRM PERFORMANCE

417) that are socially complex, context dependent, and inimitable(Cyert & March, 1963). They are especially important for enhanc-ing productivity because more firm-specific and tacit knowledgeleads to interdependent and coordinated actions that facilitateknowledge transfer and learning by minimizing cost (Argote,1999; Feldman & Pentland, 2003; March, 1991). Such knowledgealso increases profitability because specific human capital re-sources are difficult for other firms to imitate (Grant, 1996a,1996b). Because specific human capital resources are not easilytransferred into other firms without cost of value (Mahony &Pandian, 1992), the competitors cannot easily deploy specifichuman capital in an equally productive manner (Koch & McGrath,1996). Thus, internal training that develops firm-specific humancapital resources are among the most important competitive re-sources (Hitt, Bierman, Shimizu, & Kochhar, 2001).
We operationalize the extent of internal training as a firm’soverall percentage of full-time employees internally trained on thejob. This operationalization is similar to prior SHRM research(Delaney & Huselid, 1996; Huselid, 1995; Mabey & Ramirez,2005; Murray & Raffaele, 1997; Ployhart et al., 2011; Russell etal., 1985; Tharenou et al., 2007; Van Iddekinge et al., 2009).Specifically, the internal on-the-job training helps firms developemployees’ knowledge and skills required to effectively performtasks specific to their organizational context (Aguinis & Kraiger,2009), and thus the higher the portion of employees who wereinternally trained on the job, the greater firm-specific knowledgeand skills.
Further, workforce productivity should partially mediate theeffects of staffing and training on profit growth. We posit partialmediation because when the economy is strong, building higherquality human capital resources through staffing and training alsocontributes to other favorable organizational outcomes beyondtheir effects on productivity. First, the slack resources generatedthrough higher productivity can be put to productive service whenthe economy is strong (Latham & Braun, 2008). Firms with higherquality generic and specific human capital resources can leveragethese resources to pursue new product innovations, additionalcapacity, or product extensions, which contribute to financialperformance growth by generating new products, growing reve-nues, and cutting costs (Damanpour, 1991; Damanpour & Evan,1984; Danneels, 2002; Subramaniam & Youndt, 2005). Second,higher quality generic and specific human capital resources con-tribute to social capital and hence growing relationships with newcustomers and businesses (Lengnick-Hall, 1996; Oldroyd & Mor-ris, 2012). Therefore, when the economy is strong and growing,staffing and training will not only positively influence productivitybut also directly and positively influence profit growth.
Hypothesis 1a, Hypothesis 1b: Prerecession, firms with moreselective staffing have greater (a) productivity and (b) profitgrowth than firms with less selective staffing.
Hypothesis 2a, Hypothesis 2b: Prerecession, firms with moreinternal training have greater (a) productivity and (b) profitgrowth than firms with less internal training.
Hypothesis 3: Firm prerecession productivity has a positiveeffect on firm prerecession profit growth.
Hypothesis 4a, Hypothesis 4b: Firm prerecession productivitypartially mediates the positive effects of (a) selective staffingand (b) internal training on prerecession profit growth.
Thus far, selective staffing and internal training have beenconceptualized to relate directly to performance in an independentmanner. In contrast, a more recent alternative theoretical viewsuggests that complementarities may exist between staffing andtraining, and the corresponding human capital resources they cre-ate (Campbell, Coff, & Kryscynski, 2012; Ployhart et al., 2011).Complementarities are defined as the “. . . interplay of the elementsof a system where the presence of one element increases the valueof others” (Ennen & Richter, 2010, p. 207). Proposing comple-mentary, interactive relationships between selective staffing andinternal training is somewhat counter to the direct relationshipshypothesized above. Existing theory suggests either direct or in-teractive relationships may exist, yet there is only modest empir-ical evidence supporting either perspective (see Ployhart, Nyberg,Reilly, & Maltarich, in press). Therefore, we develop the followinginteractive hypotheses not as competing hypotheses to those pre-sented above, but as alternative conceptualizations to determinewhether data support one perspective more than another. There aretwo broad theoretical reasons to expect interactive complementa-rities.
First, SHRM theory suggests that HR practices combine intosystems that influence internal firm performance. Research onthese high-performance work systems suggest that synergistic ef-fects of HR practices are stronger than the effects of any particularHR practice in isolation (Combs et al., 2006; Huselid, 1995; Jianget al., 2012). The reason is because different practices have dif-ferent effects on employee ability, motivation, and opportunity, yetall three are needed to enhance productivity and performance(Jiang et al., 2012). For example, selection and training are ex-pected to have stronger effects on employee ability, whereas jobdesign is expected to have a stronger effect on creating opportu-nity. Given that HR practices are most proximally linked to inter-nal firm performance (Jiang et al., 2012; Lepak et al., 2006), weexpect an interaction between selective staffing and internal train-ing on firm productivity. Indeed, training is generally more effec-tive (offers greater return) when more selective staffing has en-sured higher quality candidates (Aguinis & Kraiger, 2009).
Second, theory in the strategy literature is increasingly empha-sizing the study of resource complementarities as determinants ofexternal firm performance (Adegbesan, 2009; Ennen & Richter,2010; Schmidt & Keil, 2013). Human capital resource comple-mentarities have the potential to generate above-normal financialreturns relative to the resources deployed in isolation becauseresource complementarities are more difficult to imitate, do nothave preexisting or efficient factor markets, and thus create syn-ergistic effects on firm value creation (Campbell et al., 2012;Dierickx & Cool, 1989; Ployhart et al., in press). Such “interactivecomplementarities” between generic and specific human capitalresources should lead to greater prerecession firm profit growth.The generally positive effect of generic human capital resources onprofit growth should be enhanced by higher levels of specifichuman capital resources because employees have the capabilitiesto both exploit existing markets (through specific knowledge) andexplore new markets (through generic knowledge). However,lower levels of specific human capital may actually weaken the
364 KIM AND PLOYHART

positive effects of generic human capital because the firm is unableto transform the generic skills into firm-specific capabilities. Thus,from both SHRM research on HR systems and strategy research onresource combinations, we expect:
Hypothesis 5: Prerecession, there is an interaction betweenselective staffing and internal training on productivity. Thepositive effect of selective staffing on productivity is strongerfor firms whose employees have more internal training.
Hypothesis 6: Prerecession, there is an interaction betweenselective staffing and internal training on profit growth. Thepositive effect of selective staffing on prerecession profitgrowth is stronger for firms whose employees have moreinternal training.
Postrecession Hypotheses
The second set of hypotheses focus on the effects of staffing andtraining during and after the Great Recession (December 2007–June 2009). The Great Recession was the longest since World WarII and radically transformed the global economic environment.Consumer demand changed, the global economy shrank, unem-ployment increased, and most firms experienced sharp declines inprofitability (Ghemawat, 2009; Latham & Braun, 2011; Pearce &Michael, 2006; Tewari, 2010). Because a recession changes thenature of a firm’s competitive environment and strategy, the ef-fects of selective staffing and internal training may likewise differfrom prerecession periods. Yet, this is where individual and firm-level theories differ. Most prior research (which is based onindividual level data) gives little reason to suggest the benefits ofstaffing or training differ across economic periods, as much valid-ity generalization research has observed (e.g., Colquitt, Lepine, &Noe, 2000; Schmidt & Hunter, 1998). However, firm-level SHRMand resource-based theory suggest the opposite, that the value ofhuman capital created through selective staffing and internal train-ing differs according to changes in the competitive environmentand firm strategy (Delery & Doty, 1996; Jackson & Schuler, 1995;Youndt et al., 1996). As profit increases before the Great Reces-sion (2007 and prior), drops at the onset of the recession (end of2007-early 2008), and then recovers (turns back positive) throughand after the recession (2009 and later), predictive relationshipsmust necessarily change as well (Figure 1 provides an overview).
Recession Onset
The onset of the recession produces a significant reduction infirm profitability because the market radically changes (NBER,2001).2 Consequently, as the profit trajectory drops sharply at therecession onset, the relationships between staffing and trainingwith profitability must change from positive to negative at thisonset period, meaning that firms with better staffing and trainingshould actually see a greater performance drop at the recessiononset. This “sign reversal” may seem counterintuitive, but it isactually very consistent with the limited firm-level research onrecession effects. For example, Latham and Braun (2008) argued(and empirically demonstrated) that firms that are outperformingcompetitors prior to a recession have maximized their fit to thecompetitive environment and are extracting more value from theirexisting resources. When the competitive environment changes,
that fit is disrupted and the corresponding readjustment to a neweconomic reality is more dramatic. Thus, firms with more selectivestaffing and internal training should see greater performance re-ductions at the onset of the recession than competitors. However,we do not mean to imply that staffing and training become liabil-ities during a recession. First, we still expect firms with moreeffective staffing and training to have higher mean levels ofperformance at the recession onset than competitors. Second andmore importantly, those firms that invested in staffing and trainingprior to the recession should manifest faster recovery during andafter the recession.3
Recession Recovery
Firms that used more selective staffing and internal trainingprior to the Great Recession should recover more quickly, asshown by greater profitability growth through the recession.4
However, the explanation is different from the prerecession periodbecause the competitive environment and corresponding strategicdemands facing the firm have changed. Postrecession recoverydemands rapid change, organizational flexibility, and adaptability(Latham & Braun, 2011; Pearce & Michael, 2006; Pearce &
2 Productivity should be relatively unaffected because it is an internalperformance metric, so our discussion of recession-onset effects is limitedto firm profitability.
3 We empirically show how the Great Recession dramatically alteredfirm profitability and predictive relationships to establish evidence for theeffects of the recession, but we do not make specific hypotheses for theseeffects at the time of the recession’s onset. There is clearly theory to do so,but we believe that such a time-specific focus draws attention away fromthe broader and more important point that selective staffing and internaltraining ultimately contribute to greater firm productivity and profitability.Across all time periods, we show that firms with more effective staffingand training outperform those that do not. Stated simply, “The bigger theyare, the harder they fall, but the faster they get back up.”
4 Again, the emphasis is on profitability, as it is not expected thatproductivity will experience a change due to the recession.
Figure 1. Firm profit growth, decline, and recovery as a result of reces-sion events. H � Hypothesis.
365STAFFING, TRAINING, AND FIRM PERFORMANCE

Robbins, 2008; Tewari, 2010). The human capital needed toquickly learn new tasks is critical in rapidly changing environ-ments (Ehrlich, 1994). By definition, generic human capital re-sources can be redeployed or rebundled for different environmentsand purposes and are particularly important for building organiza-tional flexibility and adaptability (Ployhart & Moliterno, 2011;Way et al., 2012; Wright & Snell, 1998). This suggests thatprerecession staffing, but not training, should be related to post-recession profit growth.
Indeed, recent studies suggest that enhancing skill flexibilitycontributes to firm productivity and performance in turbulentenvironments (e.g., Beltrán-Martín, Roca-Puig, Escrig-Tena, &Bou-Llusar, 2008; Bhattacharya, Gibson, & Doty, 2005; Ketkar &Sett, 2009, 2010; Ngo & Loi, 2008; Way et al., 2012). Hence, theacquisition of higher quality generic human capital resourcesthrough prerecession selective staffing should enable firms tobetter adapt and respond to change required by an economicrecession, and hence be more profitable than competitors.
In contrast, developing specific human capital resources throughinternal training before the recession is unlikely to be related topostrecession profitability growth. Changing or shrinking demandfor a firm’s products or services may negate the value of internaltraining. The routines and specific knowledge that is built throughinternal training before a recession may no longer be as relevant toprofitable growth postrecession (Collinson & Wilson, 2006;March, 1991; Szulanski, 1996). Routines and specific knowledgemay even become sources of inertia that impede organizationalflexibility for adapting to a postrecession environment (March,1991; Parmigiani & Howard-Grenville, 2011). Szulanski (1996)further argued that the “stickiness” of routines and knowledgecreates difficulties to transfer new routines within a firm. Adaptingto a new postrecession reality requires developing new types ofexplicit and tacit knowledge and thus new routines, all of whichare time-consuming (Grant, 1996b; Liebeskind, 1996; Teece, Pi-sano, & Shuen, 1997).
Notice that if supported, these predictions run counter to severalprevailing findings in the extant literature. First, these predictionssuggest that the acquisition of generic human capital resources(selective staffing) will be a stronger determinant of firm perfor-mance growth than the development of specific human capitalresources (internal training)—directly contradicting research fromthe strategic human capital literature (e.g., Hatch & Dyer, 2004).Second, these predictions suggest that the value of internal trainingdiffers depending on broader economic conditions—directly con-tradicting research on training effectiveness at more micro levels(e.g., Colquitt et al., 2000).
Finally, just because internal training does not have a directrelationship with profit growth does not preclude the presence ofan indirect effect. In contrast to the prerecession prediction forpartial mediation, here we posit that prerecession productivity willfully mediate the effects of prerecession staffing and internaltraining on profit growth. The reason is because the slack resourcesgenerated prerecession that were used for exploring new profit-generating opportunities (e.g., new market development, productinnovations, pursuing new customers) will now be consumed tocounter the effects of the recession. In particular, postrecessionperiods are ones of reduced environmental munificence, which isthe degree of resource abundance that firms can access externally(Latham & Braun, 2008). Consumer demand is stagnant, equity
markets dry up, and firms have difficulties accessing alternativesources of capital (Pearce & Michael, 2006; Richardson, Kane, &Lobingier, 1998). Firms have incremental pressures for sustainingcost structures and cash flow that prevent them from accessingexternal resources (Zarnowitz, 1999). Thus, firms must “turn in-ward” and leverage their internal resources. Firms that betterrecover from this constrained environment must rely on prereces-sion slack resources to mitigate the recession effects (Latham &Braun, 2008). Then, as the constraints begin to lessen, any remain-ing slack resources enable more flexible responses to new envi-ronmental opportunities, which generate faster recovery and profitgrowth (Cheng & Kesner, 1997; Tan & Peng, 2003). Thus, pre-recession productivity fully mediates the effects of prerecessionstaffing and training on postrecession profitability growth becausethe slack resources that previously contributed to above-normalreturns are now being fully consumed and devoted to core aspectsof the business needed to recover from the Great Recession.
Hypothesis 7: Firms with more selective staffing (prereces-sion) have greater postrecession profit growth than firms withless selective staffing.
Hypothesis 8: Firm prerecession productivity has a positiveeffect on firm postrecession profit growth.
Hypothesis 9a, Hypothesis 9b: Firm prerecession productivityfully mediates the positive effects of (a) selective staffing and(b) internal training on postrecession profit growth.
Unlike the prerecession hypotheses, we do not expect an inter-action between selective staffing and internal training on postre-cession profit growth. Again, the reason is because the economicand competitive landscape has been transformed as a result of theGreat Recession. The generic knowledge generated through selec-tive staffing may be redeployed to pursue new or different marketopportunities, whereas the tacit and firm-specific knowledge gen-erated through internal training is no longer as relevant. Therefore,we do not expect an interaction between selective staffing andinternal training. We test this interaction to provide further insightinto the theory and postrecession effects but do not formallypropose a null hypothesis.
Finally, the unique nature of the data set examined in thisresearch affords an opportunity to consider several additionalresearch questions that, although not central to the purposes of thepresent study, add meaning by putting the findings within thebroader organizational and economic context. The first researchquestion examines whether there are changes in firm staffing andtraining programs from 2004 to 2011. This informs questions as tothe variability of HR practices and whether the Great Recessionaffected these practices. The second research question examinesthe role of collective turnover as a substantive variable that has thepotential to attenuate the effects of selective staffing and internaltraining. There is a great deal of interest in collective turnover(Hausknecht & Trevor, 2011), and recent theory conceptualizescollective turnover as the erosion of human capital resources(Nyberg & Ployhart, 2013; Shaw, Park, & Kim, 2013). Hence, it isinformative to examine whether the deleterious effects of collec-tive turnover are affected by the Great Recession. The final re-search question considers whether support for the hypotheses isfound with a different firm financial measure.
366 KIM AND PLOYHART

Method
Sample and Procedure
The Korean Research Institute for Vocational Education andTraining (KRIVET, 2012) provided data from their Human CapitalCorporate Panel (HCCP) Survey, and corporate annual financialdata came from the Korean Information Service (KIS, 2013) thatcollected Korean corporate financial data from 1999 to 2011.HCCP data have been officially approved by the Korea NationalStatistical Office, and KRIVET provided HCCP data with theaccounting performance data set together. The HCCP survey hasbeen conducted every 2 years (2005, 2007, 2009, and 2011) andincludes a battery of questions relating to HR practices. For hy-pothesis testing, we focused on the data in 2005 (which wascollected at the end of December 2005) because it fully precededthe recession and we could model relations with performancegrowth over the longest period of time. The HCCP survey in 2005was administered using on-site interviews with two HR managers.KRIVET contacted the persons at targeted firms, and HR manag-ers were asked to rate staffing survey items, whereas HR devel-opment managers were asked to rate the training and developmentsurvey items. The referent for these items was the firm. Althoughthe staffing or training items were completed by a single rater,there is evidence that managers from within the same firm canreasonably agree and produce ratings of reasonable reliability(Takeuchi, Chen, & Lepak, 2009). The survey for managers askedthem to respond to the items in reference to 2004, and thus thesurvey items were designed to capture (retrospectively) all of2004. In addition, KRIVET provided accounting performancedata, cooperating with KIS through matching with the same firmcode. KRIVET basically established five firm selection guidelines:(a) firms are within South Korea; (b) firms are listed in KIScorporate data collected in 2005; (c) firms employ more than 100workers; (d) public firms are excluded; and (e) firms withinagriculture, fishery, forestry, and mining industries are also ex-cluded. On the basis of these guidelines, KRIVET generated thesampling frame encompassing 1,899 firms. Through the surveyprocedure, 454 firms responded with response rates of 23.91%. Wefurther had to drop 95 firms because they did not recruit or selectany new employees, or invest in any internal training programs in2004. Thus, the final sample size is 359 firms nested in three
industries: manufacturing (n � 257), finance (n � 31), and non-finance service (n � 71; see Table 1). As the data in this study arepart of a large multiyear public panel data set, we may pursueadditional studies on HR investments that significantly build fromthe present findings.
Measures
Selective staffing. Selective staffing was operationalized as thefirm’s overall selection ratio for full-time employees. Each HR man-ager reported how many applicants applied to their firm in 2004, andhow many of those applicants accepted offers. With these numbers,we calculated the selection ratio according to standard practice(Schmitt & Chan, 1998), such that selection ratio is equal to theproportion of applicants hired divided by the total number of appli-cants (for full-time positions). Although this is a proxy measure ofapplicant quality and generic human capital, it should be a reasonableapproximation for our purposes. First, selection ratio is historicallyused in utility models to gauge the quality of a firm’s human capitalacquisition (Boudreau & Rynes, 1985; Cascio & Boudreau, 2008;Cronbach & Gleser, 1965; Taylor & Russell, 1939). Firms with lowerselection ratios are more selective and thus have more employees withhigher quality generic KSAOs. Selection ratio is also a gauge of thevalue of the overall selection system, and firms will see greater returnson staffing investments with more selective ratios (Cabrera & Raju,2001; Cascio & Boudreau, 2008; Schmitt & Chan, 1998; Taylor &Russell, 1939). Second, focusing on selection ratio avoids the difficultchallenge of having different KSAOs present for different jobs orfirms. Even though different jobs may use different types of predic-tors, and regardless of which specific KSAOs are relevant for a job,the selection ratio provides an index of the quality of those KSAOs(Cabrera & Raju, 2001). Finally, other studies have used selectionratio to gauge quality of staffing practices (e.g., Huselid, 1995). Thus,the lower the selection ratio, the more likely the firm is acquiringhigh-quality KSAOs and generic human capital resources. However,to more easily interpret selection ratio as a proxy of applicant quality,we reverse scored it (1 – selection ratio) so that higher numbersindicate higher quality selective staffing. The average of the reversed-scored selection ratio was .76.
To further support the inferences of using selection ratio as aproxy measure for generic human capital, we examined the extentto which firms used job-related selection predictors (e.g., cognitive
Table 1Distribution of Firms Across Industries
Industry SubindustryNumber of
firms Industry SubindustryNumber of
firms
Manufacturing Food 21 Manufacturing Electronic 63Textile/Cloth 9 Automobile/Transportation equipment 34Petrochemical 35 Finance Finance & Insurance 31Rubber/Plastic 13 Service (nonfinance) Communication & Information service 5Metal/Nonmetal 45 SW/SI/online DB service 27Machine/Equipment 20 Professional service 17Computer/Office machine 5 Education service 18Electric 12 Art & leisure service 4
Overall 359
Note. Table is based on data from the Korean Research Institute for Vocational Education and Training. SW � software; SI � system integration; DB �database.
367STAFFING, TRAINING, AND FIRM PERFORMANCE

tests, personality, interviews). HR managers completed an item inthe 2005 survey that asked them which selection procedures theyused in hiring (across all employee groups) for the 2004 year. Allfirms used at least one predictor, with the mean number being 3.76(min � 1, max � 12). Approximately 30% of firms used person-ality tests, 26% used cognitive and aptitude tests, and 77% usedindividual interviews. Further, selection ratio and the number ofselection tools are positively related (r � .20, p � .05), the numberof selection tools predicted prerecession productivity (� �8,714.71, p � .05), and the number of selection tools predictedprerecession (� � 16,924,809.00, p � .05) and postrecessionprofit growth (� � 20,073,930.00, p � .05). Thus, to the extentthese selection predictors ensure applicant quality (which is thevery basis of selection), the measure of selection ratio should serveas an appropriate proxy for quality KSAOs and generic humancapital resources (Boudreau & Rynes, 1985; Cascio & Boudreau,2008; Cronbach & Gleser, 1965; Ployhart & Moliterno, 2011;Taylor & Russell, 1939).
Internal training. Internal training was operationalized as theproportion of total internal training programs completed by full-time employees, relative to the number of full-time employees inthe firm. Employees could participate in formal in-house trainingprograms for job- and firm-specific knowledge and skills. Thus,this training measure only includes training activities that firmsinternally provide. We calculated the training measure by dividingthe total number of full-time employees who participated in theinternal training programs into a total number of full-time employ-ees in each firm. Because many firms enable their employees toparticipate in multiple internal training programs, the ratio can begreater than one (i.e., more than 100%). This measure can reflectthe quality of internal training (e.g., knowledge acquired throughtraining; Delaney & Huselid, 1996; Hatch & Dyer, 2004; Huselid,1995; Mabey & Ramirez, 2005; Murray & Raffaele, 1997; Ploy-hart et al., 2011; Russell et al., 1985; Tesluk & Jacobs, 1998;Tharenou et al., 2007; Van Iddekinge et al., 2009) because itcaptures the firm-specific KSAOs’ possessed from total internaltraining programs. In this regard, the higher the ratio of employeeswho were internally trained, the greater the amount of firm-specific knowledge. The average of internal training was 1.48.
To support whether the internal training measure serves as a proxymeasure for firm-specific human capital development, we tested therelative magnitudes between internal training, external training, andfirm profit. Specifically, we focused on two external training mea-sures: (a) external training programs provided by external traininginstitutions and (b) funding for university coursework in domestic andforeign regions that may produce more general KSAOs that areapplicable across firms. Because developing firm-specific humancapital can contribute more to sustainable competitive advantage thangeneric human capital (e.g., Barney & Wright, 1998), we expect thatthe internal training measure is more highly related to firm perfor-mance than external training measures. For external training anduniversity training measures, HR development managers were askedto rate the total number of full-time employees who participated intraining programs of other training or education-related institutions, orwho were supported by funding for university coursework in domes-tic and foreign regions. The correlation results show that internaltraining is more highly correlated with average financial performance(EBIT) from 2000 to 2011 (r � .20, p � .05) than external training(r � �.03, ns) and university training (r � .10, ns). The difference in
correlations is significant only between internal and external training(z � 3.25, p � .05). These results strengthen the validity inferencesthat internal training captures the quality of firm-specific humancapital.
Firm profit. Firm profit is operationalized as EBIT, a widelyused financial accounting metric. To investigate the change ofEBIT before (prerecession), during, and after (postrecession) theGreat Recession, we used an 8-year period of 2000–2007 forprerecession and a 4-year period of 2008–2011 for postrecessionanalyses. EBIT is an accounting performance metric calculated byrevenue minus costs of products sold and administrative andselling costs related to a firm’s operations. This is a popularmeasure of firm profit and has the added benefit of being agenerally accepted accounting performance metric (see Richard etal., 2009). The average EBIT from 2000 to 2011 was50,369,766.00 thousand won.5
Productivity. Firm labor productivity is operationalized as aratio of firm operating revenue to total number of employees. Theproductivity measure is an indicator of total output to labor input(Samuelson & Nordhaus, 1989), and thus it captures the efficiency ofa workforce to produce output. Because firm productivity is closelyrelated to HR systems and human capital, productivity is consideredas an important workforce performance metric (Crook et al., 2011;Delery & Shaw, 2001) and has high validity for HR managers (Dyer& Reeves, 1995). In addition, this productivity measure has beenwidely used in other SHRM studies (e.g., Huselid, 1995; Ployhart etal., 2009; Shaw, Gupta, & Delery, 2005; Siebert & Zubanov, 2009).Firm productivity is the average of the scores between 2004 and 2007.We did this because our primary interest is in determining the extentto which prerecession productivity serves as a buffer against postre-cession performance declines. The average firm labor productivityfrom 2004 to 2007 was 22,681.00 thousand won.
Controls. Several control variables are used to provide morestringent tests of the hypotheses. However, internal firm performance(productivity) and external firm performance (profit growth) are dif-ferent theoretically and empirically (Jiang et al., 2012; Richard et al.,2009). Following the guidance of T. E. Becker (2005), we sought toonly include those control variables theoretically relevant to eachoutcome. Firm productivity is an internal performance metric, and sowe focused on those controls that prior research consistently finds asmost relevant to affecting internal firm operations. First, we controlledfor average firm size (2004–2007) because different-sized firms facevery different operating challenges (e.g., Huselid, 1995; Sun, Aryee,& Law, 2007), and larger firms may invest more in staffing andtraining to acquire and develop human capital resources (e.g., Collins& Clark, 2003). Second, we indirectly controlled for industry via theuse of a random coefficient model allowing between-industry differ-ences in intercepts to be modeled.
Firm profit growth (2000–2011) is an external performance metricand hence is potentially affected by a broader range of organizationaland economic factors. First and most importantly, we control for priorfirm profit. Guest, Michie, Conway, and Sheehan (2003) and Wright,Gardner, Moynihan, and Allen (2005) showed that ignoring pastperformance may lead to inaccurate model estimates. Thus, eachfirm’s EBIT scores in 1999 and 2007 were used as control variables
5 EBIT scores are based on Korean monetary unit (one thousand won)($1 � approximately 1,000 � 1,200 won).
368 KIM AND PLOYHART
for random coefficient growth analyses involving the 2000–2007(prerecession) and 2008–2011 (postrecession) performance data, re-spectively. Second, we control for industry (manufacturing, financial,service [nonfinancial]) because firms in different industries face dif-ferent competitive environments and are distinctively affected byeconomic recessions (Datta, Guthrie, & Wright, 2005; Pearce &Michael, 2006). Third, we control for firm size because larger firmsmay not only be more profitable but also have greater expenses. Inaddition, firm size may play an important role in responding tochanging environments (i.e., recession) because smaller firms canpossess and leverage flexible organizational processes and structuresfor adapting to environmental changes (Latham, 2009). Note that firmsize differs over time, so we used firm size as a time-varying controlfor pre- and postrecession analyses.
Analyses
Random coefficient growth models (RCGMs; Bliese & Ploy-hart, 2002; Lang & Bliese, 2009) are used to test the hypotheses.RCGMs are particularly well suited to the present study. First, themodels are able to estimate the rate of profit change over time tooperationalize growth. Second, the models can use the growth inprofit over time as the dependent variable to be predicted byselective staffing and internal training. Third, the models can beused to estimate and test mediation using bootstrapping proce-dures. Fourth, the RCGM provides estimates of within-firm vari-ance over time, and between-firm variance in the form of profitgrowth and recession effects. Finally, the models account for bothpreexisting firm differences and the control variables.
We followed the recommendations of Raudenbush and Bryk(2002) and Bliese and Ployhart (2002) when developing and testingthe RCGMs. There are two basic sets of analyses. The first set isdescriptive and focuses on modeling the profit growth trend over time.This is known as Model 0 because it contains no predictors or controlvariables. The baseline model uses a discontinuous term to model theeffect of the recession onset (Lang & Bliese, 2009). The second set ofanalyses focus on testing the hypotheses using either prerecessionproductivity and profit or postrecession profit data. These models firsttest the relationships between selective staffing and internal trainingwith firm productivity. We then examine the relationships betweenselective staffing, internal training, and firm productivity, with profit
growth for prerecession and postrecession periods. Finally, for themediation Hypotheses 4a and 4b and 9a and 9b, we follow the“product of coefficients” approach (MacKinnon, Lockwood, Hoff-man, West, & Sheets, 2002) to test the statistical significance ofindirect effects. We use the indirect effect estimation method based ona parametric bootstrap procedure (Monte Carlo method; MCM), assuggested by MacKinnon, Lockwood, and Williams (2004) and Seligand Preacher (2008). Because Hypotheses 4a and 4b and 9a and 9bare based on mediation models for longitudinal data, these mediationmodels have multiple and different types of indirect effects for inter-cepts and slopes. We thus model effects for both intercepts and slopes,but focus on indirect effects for slopes because they are the tests of thehypotheses. All RCGMs estimated between-firm variability for theintercept and trend effects. In this manner, any preexisting firmdifferences not captured by the control variables are modeled withinthe intercept variability. All control and predictor variables are stan-dardized to allow more straightforward interpretations (see Rauden-bush & Bryk, 2002).
Results
Baseline Analyses
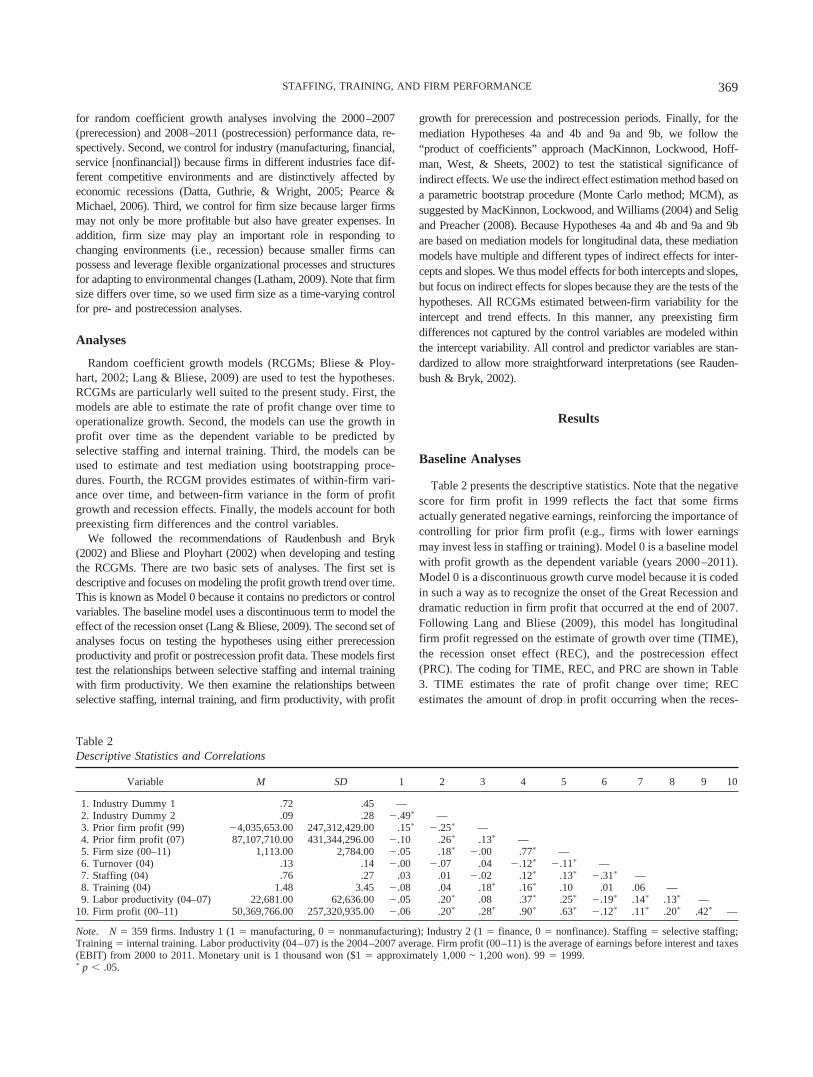
Table 2 presents the descriptive statistics. Note that the negativescore for firm profit in 1999 reflects the fact that some firmsactually generated negative earnings, reinforcing the importance ofcontrolling for prior firm profit (e.g., firms with lower earningsmay invest less in staffing or training). Model 0 is a baseline modelwith profit growth as the dependent variable (years 2000–2011).Model 0 is a discontinuous growth curve model because it is codedin such a way as to recognize the onset of the Great Recession anddramatic reduction in firm profit that occurred at the end of 2007.Following Lang and Bliese (2009), this model has longitudinalfirm profit regressed on the estimate of growth over time (TIME),the recession onset effect (REC), and the postrecession effect(PRC). The coding for TIME, REC, and PRC are shown in Table3. TIME estimates the rate of profit change over time; RECestimates the amount of drop in profit occurring when the reces-
Table 2Descriptive Statistics and Correlations
Variable M SD 1 2 3 4 5 6 7 8 9 10
1. Industry Dummy 1 .72 .45 —2. Industry Dummy 2 .09 .28 �.49� —3. Prior firm profit (99) �4,035,653.00 247,312,429.00 .15� �.25� —4. Prior firm profit (07) 87,107,710.00 431,344,296.00 �.10 .26� .13� —5. Firm size (00–11) 1,113.00 2,784.00 �.05 .18� �.00 .77� —6. Turnover (04) .13 .14 �.00 �.07 .04 �.12� �.11� —7. Staffing (04) .76 .27 .03 .01 �.02 .12� .13� �.31� —8. Training (04) 1.48 3.45 �.08 .04 .18� .16� .10 .01 .06 —9. Labor productivity (04–07) 22,681.00 62,636.00 �.05 .20� .08 .37� .25� �.19� .14� .13� —
10. Firm profit (00–11) 50,369,766.00 257,320,935.00 �.06 .20� .28� .90� .63� �.12� .11� .20� .42� —
Note. N � 359 firms. Industry 1 (1 � manufacturing, 0 � nonmanufacturing); Industry 2 (1 � finance, 0 � nonfinance). Staffing � selective staffing;Training � internal training. Labor productivity (04–07) is the 2004–2007 average. Firm profit (00–11) is the average of earnings before interest and taxes(EBIT) from 2000 to 2011. Monetary unit is 1 thousand won ($1 � approximately 1,000 ~ 1,200 won). 99 � 1999.� p � .05.
369STAFFING, TRAINING, AND FIRM PERFORMANCE

sion began, and PRC is rate of postrecession profit change relativeto the prerecession period.6
This baseline model revealed that firm profit increased linearlyover time (� � 13,106,234.00, p � .05). The recession produceda �63,650,000.00 (p � .05) drop in profit. The slope for postre-cession profit was positive but not significantly different than theslope for prerecession profit (� � 2,236,933.00, ns). However, thevariance components for all three terms and the intercept werelarge and statistically significant (see Table 4). Further, an ICC(1)revealed that 52% of the variance in profit across time was due tobetween-firm differences. To demonstrate that the recession onsetchanges the profit growth trajectory and hence predictive relation-ships, we examined how selective staffing, internal training, andproductivity related to firm profit at the onset of the recession(REC). Firms with more selective staffing (� � �40,930,000.00,p � .05), internal training (� � �65,600,000.00, p � .05), andfirm prerecession productivity (� � �98,600,000.00, p � .05)have greater reductions in profit at the onset of the recession. Thissuggests that firms that performed better due to selective staffing,internal training, and greater productivity before the recession
actually suffered worse when the recession hit. These effects areshown in Figure 2. Having demonstrated the effect of the GreatRecession, we now proceed to test the hypotheses using the pre-recession (2000–2007) and postrecession (2008–2011) data sep-arately, because this allows us to better test the effects of selectivestaffing, internal training, and productivity on profit growth ineach recession period.7
Hypothesis Tests
Table 5 shows the models with controls and tests for Hypotheses1a and 2a. Hypothesis 1a predicted that firms with more selectivestaffing would be positively associated with greater firm produc-tivity than firms with less selective staffing before the recession(prerecession). Model 2 shows that selective staffing is positivelyand significantly related to productivity. For every one standarddeviation increase in selective staffing, there is a corresponding7,057.90 increase in productivity (p � .05). Hypothesis 2a pre-dicted that firms with more internal training would be positivelyrelated to greater firm productivity than firms with less internaltraining. Model 3 shows that internal training is a significantpredictor of firm productivity. For every one standard deviationincrease in internal training, there is a corresponding 6,901.52increase in productivity (p � .05). Thus, Hypotheses 1a and 2a aresupported.
For prerecession hypotheses, Model 6 in Table 6 shows thebasic growth model with controls. Only prior firm profit in 1999was a significant control variable. The growth parameter (TIME)suggests that firm profit increased 12,415,964.00 per year (p �.05) prior to the recession. Finally, there was significant between-firm variability in profit change during the prerecession periods(TIME) and the intercept.
6 Although the recession began in December 2007, we coded 1 in 2008and 2009 because we only have yearly data, and the recession effectsactually influenced firm performance reduction after 2007.
7 We also tested whether the recession affects productivity using thesame model shown in Table 4. Productivity increases over time (� �417.86, p � .05), but there is no effect for the recession onset (� �5,909.89, ns), supporting the inference that productivity, as an internalperformance metric, is less affected by recession effects.
Table 3Coding and Interpretation of Change Variables (Baseline Model 0)
Variable
Year
Interpretation2000 2001 2002 2003 2004 2005 2006 2007 2008 2009 2010 2011
Prerecession(TIME)
0 1 2 3 4 5 6 7 8 9 10 11 Linear firm profitgrowth
Recession onset(REC)
0 0 0 0 0 0 0 0 1 1 1 1 Firm profit dropas a result ofrecession
Postrecession(PRC)
0 0 0 0 0 0 0 0 0 1 2 3 Linear firm profitgrowth in thepostrecessionperiod, relativeto theprerecessionperiod
Note. TIME � prerecession; REC � recession onset; PRC � postrecession.
Table 4Results of Functions for Time Predicting Profit (00–11)
Variable
Baseline Model 0
� SE
Intercept �3,115,261.00 10,718,384.00Change predictors
TIME 13,106,234.00� 2,985,312.00REC �63,650,000.00� 17,364,076.00PRC 2,236,933.00 6,174,401.00
Variance componentsIntercept 2.44 � 1016� 2.82 � 1015
TIME 2.23 � 1015� 2.42 � 1014
REC 5.25 � 1016� 8.62 � 1015
PRC 3.44 � 1015� 9.43 � 1014
�2 log likelihood 167,396.50Akaike’s information criterion 167,406.50
Note. 00–11 � 2000 to 2011; TIME � prerecession; REC � recessiononset; PRC � postrecession.� p � .05.
370 KIM AND PLOYHART
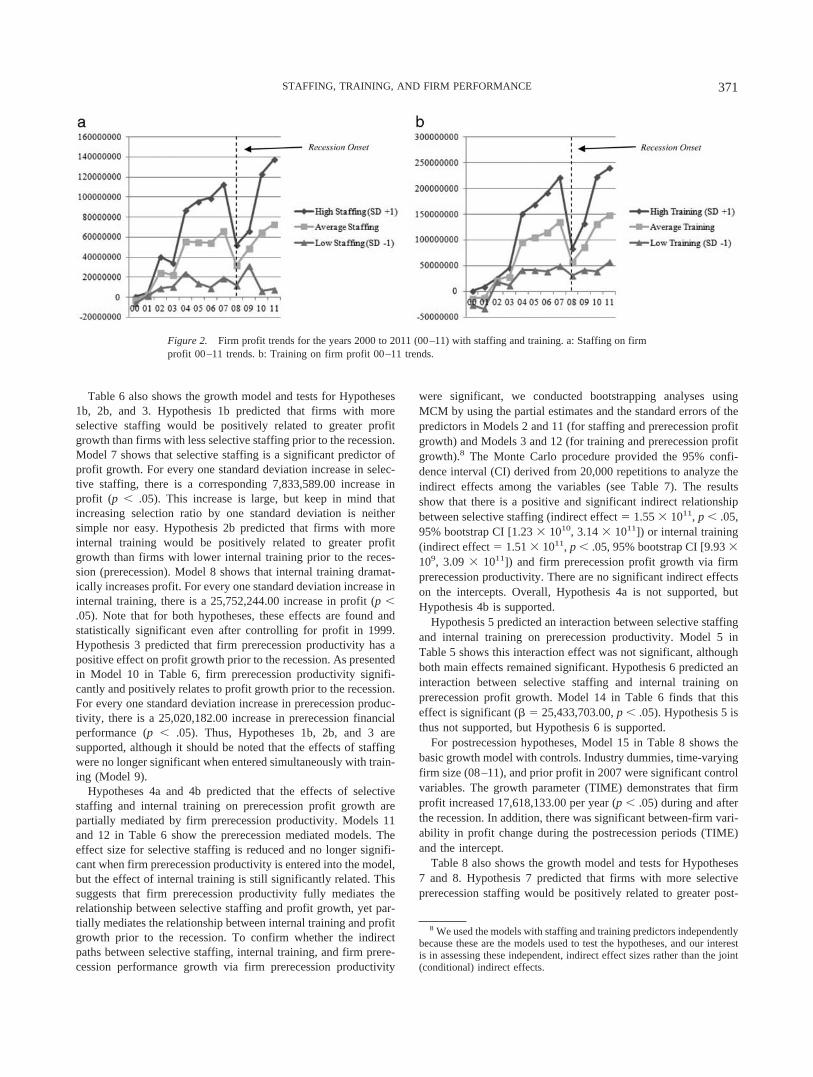
Table 6 also shows the growth model and tests for Hypotheses1b, 2b, and 3. Hypothesis 1b predicted that firms with moreselective staffing would be positively related to greater profitgrowth than firms with less selective staffing prior to the recession.Model 7 shows that selective staffing is a significant predictor ofprofit growth. For every one standard deviation increase in selec-tive staffing, there is a corresponding 7,833,589.00 increase inprofit (p � .05). This increase is large, but keep in mind thatincreasing selection ratio by one standard deviation is neithersimple nor easy. Hypothesis 2b predicted that firms with moreinternal training would be positively related to greater profitgrowth than firms with lower internal training prior to the reces-sion (prerecession). Model 8 shows that internal training dramat-ically increases profit. For every one standard deviation increase ininternal training, there is a 25,752,244.00 increase in profit (p �.05). Note that for both hypotheses, these effects are found andstatistically significant even after controlling for profit in 1999.Hypothesis 3 predicted that firm prerecession productivity has apositive effect on profit growth prior to the recession. As presentedin Model 10 in Table 6, firm prerecession productivity signifi-cantly and positively relates to profit growth prior to the recession.For every one standard deviation increase in prerecession produc-tivity, there is a 25,020,182.00 increase in prerecession financialperformance (p � .05). Thus, Hypotheses 1b, 2b, and 3 aresupported, although it should be noted that the effects of staffingwere no longer significant when entered simultaneously with train-ing (Model 9).
Hypotheses 4a and 4b predicted that the effects of selectivestaffing and internal training on prerecession profit growth arepartially mediated by firm prerecession productivity. Models 11and 12 in Table 6 show the prerecession mediated models. Theeffect size for selective staffing is reduced and no longer signifi-cant when firm prerecession productivity is entered into the model,but the effect of internal training is still significantly related. Thissuggests that firm prerecession productivity fully mediates therelationship between selective staffing and profit growth, yet par-tially mediates the relationship between internal training and profitgrowth prior to the recession. To confirm whether the indirectpaths between selective staffing, internal training, and firm prere-cession performance growth via firm prerecession productivity
were significant, we conducted bootstrapping analyses usingMCM by using the partial estimates and the standard errors of thepredictors in Models 2 and 11 (for staffing and prerecession profitgrowth) and Models 3 and 12 (for training and prerecession profitgrowth).8 The Monte Carlo procedure provided the 95% confi-dence interval (CI) derived from 20,000 repetitions to analyze theindirect effects among the variables (see Table 7). The resultsshow that there is a positive and significant indirect relationshipbetween selective staffing (indirect effect � 1.55 � 1011, p � .05,95% bootstrap CI [1.23 � 1010, 3.14 � 1011]) or internal training(indirect effect � 1.51 � 1011, p � .05, 95% bootstrap CI [9.93 �109, 3.09 � 1011]) and firm prerecession profit growth via firmprerecession productivity. There are no significant indirect effectson the intercepts. Overall, Hypothesis 4a is not supported, butHypothesis 4b is supported.
Hypothesis 5 predicted an interaction between selective staffingand internal training on prerecession productivity. Model 5 inTable 5 shows this interaction effect was not significant, althoughboth main effects remained significant. Hypothesis 6 predicted aninteraction between selective staffing and internal training onprerecession profit growth. Model 14 in Table 6 finds that thiseffect is significant (� � 25,433,703.00, p � .05). Hypothesis 5 isthus not supported, but Hypothesis 6 is supported.
For postrecession hypotheses, Model 15 in Table 8 shows thebasic growth model with controls. Industry dummies, time-varyingfirm size (08–11), and prior profit in 2007 were significant controlvariables. The growth parameter (TIME) demonstrates that firmprofit increased 17,618,133.00 per year (p � .05) during and afterthe recession. In addition, there was significant between-firm vari-ability in profit change during the postrecession periods (TIME)and the intercept.
Table 8 also shows the growth model and tests for Hypotheses7 and 8. Hypothesis 7 predicted that firms with more selectiveprerecession staffing would be positively related to greater post-
8 We used the models with staffing and training predictors independentlybecause these are the models used to test the hypotheses, and our interestis in assessing these independent, indirect effect sizes rather than the joint(conditional) indirect effects.
Figure 2. Firm profit trends for the years 2000 to 2011 (00–11) with staffing and training. a: Staffing on firmprofit 00–11 trends. b: Training on firm profit 00–11 trends.
371STAFFING, TRAINING, AND FIRM PERFORMANCE

recession profit growth than firms with less selective staffing.Model 16 shows that selective staffing is positively and signifi-cantly related to postrecession profit growth. For every one stan-dard deviation increase in selective staffing, there is a correspond-ing 13,742,680.00 (p � .05) increase in postrecession profit.Although we did not hypothesize a significant effect of internaltraining on postrecession financial performance, we tested therelationship to confirm whether internal training has bufferingeffects during and after the recession. The result (Model 17 in
Table 8) shows that the relationship between internal training andpostrecession profit growth is not significant (although the effectfor the intercept is significant). Further, the interaction betweenselective staffing and internal training was not significant (Model23 in Table 8). Together these findings suggest that internaltraining may become less valuable for generating postrecessionprofit growth. Hypothesis 8 predicted that firm prerecession pro-ductivity has a positive effect on postrecession profit growth.Model 19 in Table 8 shows that this effect is significant; for every
Table 5Direct Effects of Staffing and Training on Labor Productivity
Variable
Model 1 Model 2 (H1a) Model 3 (H2a) Model 4 Model 5 (H5)
� SE � SE � SE � SE � SE
Intercept 28,430.00 11,328.00 28,027.00 10,909.00 27,072.00 10,881.00 26,572.00 10,328.00 25,437.00 10,681.00Firm-level control
Firm size (04–07) 13,972.00� 3,244.48 12,435.00� 3,351.70 12,521.00� 3,311.04 11,449.00� 3,408.90 10,444.00� 3,436.51Predictors
Staffing (04) 7,057.90� 3,329.31 6,352.98� 3,472.82 8,039.19� 3,575.93Training (04) 6,901.52� 3,328.69 6,563.90� 3,372.99 3,851.43� 3,663.18
InteractionsStaffing (04) �
Training (04) 14,147.00 7,621.42Variance component
Intercept 3.27 � 108 4.24 � 108 2.97 � 108 3.99 � 108 2.95 � 108 3.96 � 108 2.57 � 108 3.65 � 108 2.78 � 108 3.85 � 108
�2 log likelihood 8,761.80 8,425.60 8,122.80 7,836.60 7,813.40Akaike’s information
criterion 8,765.80 8,429.60 8,126.80 7,840.60 7,817.40
Note. The dependent variable is average firm productivity for the years 2004 to 2007 (04–07). These analyses are estimated using random coefficientmodels, in which industry is treated as a Level 2 variable. Hence, differences across industry groups are modeled via differences in the intercept rather thandummy codes. H � Hypothesis.� p � .05.
Table 6Longitudinal Random Coefficient Growth Models (Prerecession)
Variable
Model 6 Model 7 (H1b) Model 8 (H2b) Model 9
� SE � SE � SE � SE
Intercept �1,517,589.00 24,883,950.00 �5,085,186.00 25,783,329.00 298,623.00 26,839,273.00 �2,305,932.00 27,632,378.00Firm-level controls
Industry Dummy 1 �8,840,716.00 27,517,386.00 �7,945,437.00 28,492,733.00 �10,830,000.00 29,539,040.00 �10,830,000.00 30,452,483.00Industry Dummy 2 25,820,561.00 46,661,013.00 50,991,716.00 47,902,772.00 6,007,074.00 49,288,864.00 26,953,169.00 50,512,195.00Prior profit (99) 79,719,469.00� 10,989,802.00 77,700,625.00� 11,177,891.00 75,543,242.00� 11,474,007.00 72,320,054.00� 11,658,520.00Firm size (00–07) �17,210,000.00 14,163,436.00 �45,320,000.00� 14,788,901.00 �29,450,000.00 15,175,617.00 �60,210,000.00 15,776,842.00Prior Profit (99) � TIME �3,825,149.00 3,641,238.00 �705,189.00 3,614,891.00 �7,425,415.00 3,677,571.00 �3,985,901.00 3,687,525.00
Change predictorTIME (prerecession) 12,415,964.00� 3,667,926.00 11,097,286.00� 3,668,836.00 13,021,709.00� 3,793,656.00 11,734,026.00� 3,817,520.00
PredictorsStaffing (04) 3,718,853.00� 11,468,904.00 2,622,309.00 12,246,726.00Staffing (04) � TIME 7,833,589.00� 3,772,907.00 6,083,661.00 3,961,319.00Training (04) 26,167,463.00� 18,244,824.00 36,825,521.00� 18,467,493.00Training (04) � TIME 25,752,244.00� 5,841,174.00 23,003,182.00� 5,818,068.00
MediatorFirm productivity (04–07)Firm Productivity (04–07) � TIME
ModeratorStaffing (04) � Training (04)Staffing (04) � Training (04) � TIME
Variance componentsIntercept 2.51 � 1016� 2.83 � 1015 2.68 � 1016� 2.91 � 1015 2.60 � 1016� 3.07 � 1015 2.77 � 1016� 3.14 � 1015
TIME 3.60 � 1015� 3.36 � 1014 3.50 � 1015� 3.29 � 1014 3.50 � 1015� 3.45 � 1014 3.47 � 1015� 3.42 � 1014
�2 log likelihood 100,561.90 96,032.20 92,850.10 89,006.00Akaike’s information criterion 100,567.90 96,038.20 92,856.10 89,012.00
Note. The dependent variable (prerecession profit) is change in firm profit for the years 2000 to 2007 (00–07). H � hypothesis; 99 � 1999; TIME �prerecession; 04 � 2004.� p � .05.
372 KIM AND PLOYHART

one standard deviation increase in firm prerecession productivity,there is a 29,925,673.00 (p � .05) increase in postrecession finan-cial performance. Thus, Hypotheses 7 and 8 are supported.
Hypotheses 9a and 9b predicted that the effects of prerecessionselective staffing and internal training on postrecession profit growthare fully mediated by firm prerecession productivity. Models 20 and21 in Table 8 show the postrecession mediated model. The effect sizesfor selective staffing and internal training are reduced and not signif-icant when firm prerecession productivity is entered into the models,and suggests firm prerecession productivity fully mediates the rela-tionship between selective staffing or internal training and postreces-sion profit growth. Using the partial estimates and the standard errorsfrom Models 2 and 20 (for staffing) and 3 and 21 (for training), thebootstrap results (see Table 7) show that there is a positive andsignificant indirect relationship between selective staffing (indirecteffect � 2.07 � 1011, p � .05, 95% bootstrap CI [1.21 � 1010,4.61 � 1011]) and internal training (indirect effect � 2.29 � 1011, p �.05, 95% bootstrap CI [1.41 � 1010, 4.99 � 1011]) with postrecessionprofit growth via firm prerecession productivity. There are no signif-icant effects on the intercepts. Overall, Hypotheses 9a and 9b aresupported.
The overall findings are graphically illustrated and summarizedin Figures 3 and 4. These were depicted by estimating predictedfirm pre- and postrecession profit with high- (1 SD above thesample mean) and low- (1 SD below the sample mean) selectivestaffing and internal training, contrasted with predicted firm per-formance at the sample mean. As shown in Figure 3, firms withmore selective staffing (see Figure 3a) and internal training (seeFigure 3b) outperform their rivals over time before the recession.Figure 3c shows the nature of the interaction between staffing andtraining, finding that it is only when staffing and training are bothhigh that firms see consistent profit growth. Figure 4 shows that
firms with more selective staffing have greater performancegrowth postrecession than firms with less selective staffing.
Supplemental Analyses for Research Questions
To provide further nuance and context for the hypothesis tests, wesummarize three sets of analyses informing the three research ques-tions relating to (a) changes in staffing and training over time (seeAppendix A), (b) collective turnover (see Appendix B), and (c) analternative operationalization of financial outcomes (see Appendix C).
Question 1: Do selective staffing and internal trainingchange over time? Selective staffing and internal training wereassessed in 2005, 2007, 2009, and 2011, using the same items andprocedures described in the Method section. In each measurementoccasion, the focus of the items was on the prior year (e.g.,selection ratio or internal training in 2004, 2006, 2008, and 2010).It was thus possible to see whether selection ratio (our operation-alization of selective staffing) and the amount of internal trainingdiffered as a result of the recession. Using an RCGM (see Appen-dix A, Table A1), we found that selective staffing increased veryslightly over time (� � .02, p � .05). However, the model wasunable to provide an estimate for between-firm variance in theslope, which usually means there is a lack of variability, and hencethe model is too complex (Singer & Willett, 2003). The slope forinternal training was not significant, although there was significantvariability across firms in this slope (variance component � .87,p � .05). Thus, selective staffing increased slightly for all firms,whereas the use of internal training was much more variable.However, the overall changes in staffing and training are rathermodest, suggesting that it is not the change in these variables thatis driving the changes in profit, but rather prerecession investments
Table 6 (continued)
Model 10 (H3) Model 11 (H4a) Model 12 (H4b) Model 13 Model 14 (H6)
� SE � SE � SE � SE � SE
2,157,819.00 25,504,191.00 �954,797.00 26,530,280.00 3,392,806.00 27,739,251.00 1,268,611.00 28,631,611.00 �11,130,000.00 27,707,557.00
�12,050,000.00 28,029,879.00 �11,630,000.00 29,133,486.00 �13,400,000.00 30,327,184.00 �13,830,000.00 31,337,770.00 �3,928,632.00 30,313,952.0013,981,476.00 47,423,629.00 34,143,393.00 48,736,012.00 �3,478,452.00 50,263,214.00 12,953,224.00 51,520,632.00 29,742,295.00 50,047,635.0079,086,149.00� 10,984,020.00 76,113,991.00� 11,196,228.00 75,021,945.00� 11,485,721.00 71,153,615.00� 11,686,040.00 69,787,369.00� 11,648,639.00
�16,230,000.00 14,752,637.00 �47,930,000.00 15,337,204.00 �28,190,000.00 15,686,370.00 �62,290,000.00 16,268,675.00 �65,710,000.00 15,935,036.00�5,762,757.00 3,360,459.00 �2,881,399.00 3,403,869.00 �8,024,873.00 3,467,972.00 �4,990,425.00 3,524,639.00 �5,419,808.00 3,658,473.00
12,327,529.00� 3,386,062.00 11,188,462.00� 3,449,819.00 12,986,702.00� 3,586,894.00 11,867,344.00� 3,655,680.00 10,052,004.00� 3,798,981.00
3,067,605.00 11,575,591.00 2,198,027.00 12,394,205.00 8,660,050.00 12,630,597.004,520,048.00 3,594,435.00 3,750,959.00 3,830,140.00 9,290,549.00 4,038,254.00
26,613,668.00� 18,395,714.00 35,208,819.00� 18,610,894.00 28,094,457.00� 19,027,218.0017,850,482.00� 5,653,737.00 16,499,377.00� 5,683,813.00 17,099,415.00� 6,043,394.00
83,694.00� 11,101,141.00 9,839,821.00� 11,315,410.00 �803,284.00� 11,844,143.00 8,871,741.00� 12,024,717.0025,020,182.00� 3,279,498.00 21,936,369.00� 3,344,291.00 21,843,735.00� 3,540,838.00 19,315,653.00� 3,594,581.00
44,748,805.00� 26,355,669.0025,433,703.00� 8,382,129.00
2.46 � 1016� 2.82 � 1015 2.65 � 1016� 2.90 � 1015 2.58 � 1016� 3.09 � 1015 2.76 � 1016� 3.16 � 1015 2.71 � 1016� 3.09 � 1015
2.95 � 1015� 2.87 � 1014 3.01 � 1015� 2.91 � 1014 3.03 � 1015� 3.08 � 1014 3.11 � 1015� 3.14 � 1014 3.34 � 1015� 3.32 � 1014
99,997.90 95,480.00 92,303.70 88,466.90 88,922.40100,003.90 95,486.00 92,309.70 88,472.90 88,928.40
373STAFFING, TRAINING, AND FIRM PERFORMANCE

in staffing and training that develop slack resources to contributeto firm profit growth during postrecession periods.
Question 2: How does collective turnover influence the ef-fects of selective staffing and internal training? It has longbeen recognized that collective turnover is usually negativelyrelated to firm performance (Hausknecht & Trevor, 2011). Morerecent theory and research are focusing on understanding howcollective turnover interrelates with human capital resources (Ny-berg & Ployhart, 2013; Shaw et al., 2013; Sturman, Trevor, Bou-dreau, & Gerhart, 2003). As collective turnover represents theerosion of human capital resources, research suggests that collec-
tive turnover should significantly moderate the effects of humancapital resources on firm financial performance outcomes (Nyberg& Ployhart, 2013). However, little of this empirical research hasbeen conducted at the firm level and over time. Therefore, weincluded collective turnover (of all firm employees, as reported inthe 2005 HCCP survey) as a substantive variable in all modelsinvolving the hypotheses tests (see Appendix B, Tables B1–B3).As expected, collective turnover is negatively related to produc-tivity (Model B1-1) and prerecession profit growth (Model B2-1),but is unexpectedly not related to postrecession profit growth(Model B3-1). For productivity, collective turnover moderates the
Table 8Longitudinal Random Coefficient Growth Models (Postrecession)
Variable
Model 15 Model 16 (H7) Model 17 Model 18
� SE � SE � SE � SE
Intercept 38,578,227.00 25,108,138.00 40,245,804.00 25,552,662.00 37,684,654.00 26,036,302.00 39,358,946.00 26,947,293.00Firm-level controls
Industry Dummy 1 8,758,676.00� 26,134,335.00 3,725,924.00 26,528,030.00 12,260,554.00 26,909,362.00 10,695,972.00 27,873,252.00Industry Dummy 2 �17,380,000.00� 41,154,339.00 �15,020,000.00� 41,232,274.00 �21,670,000.00� 41,261,263.00 �22,970,000.00� 42,369,554.00Prior profit (07) 349,020,000.00� 16,899,414.00 364,030,000.00� 17,826,901.00 338,780,000.00� 17,559,187.00 351,820,000.00� 18,983,573.00Firm size (08–11) �106,500,000.00� 15,219,636.00 �117,300,000.00� 15,378,892.00 �108,600,000.00� 15,207,363.00 �112,000,000.00� 15,668,832.00Prior Profit (07) � TIME 6,766,547.00 6,291,593.00 �413,296.00 6,851,893.00 5,567,413.00 6,743,908.00 �2,392,639.00 7,322,567.00
Change predictorTIME (prerecession) 17,618,133.00� 6,664,122.00 17,207,231.00� 6,865,363.00 15,684,125.00� 7,105,122.00 15,008,985.00� 7,282,398.00
PredictorsStaffing (04) �8,286,925.00 13,326,524.00 �10,290,000.00 14,197,982.00Staffing (04) � TIME 13,742,680.00� 6,845,025.00 13,950,147.00� 7,282,437.00Training (04) 58,064,642.00� 20,639,513.00 55,541,204.00� 21,011,606.00Training (04) � TIME �13,130,000.00 9,062,095.00 �12,170,000.00 9,186,478.00
MediatorFirm productivity (04–07)Firm Productivity (04–07) � TIME
ModeratorStaffing (04) � Training (04)Staffing (04) � Training (04) � TIME
Variance componentsIntercept 1.19 � 1016� 2.54 � 1015 1.09 � 1016� 2.56 � 1015 9.79 � 1015� 2.59 � 1015 1.05 � 1016� 2.72 � 1015
TIME 1.53 � 1015� 7.11 � 1014 1.64 � 1015� 7.37 � 1014 1.39 � 1015� 7.39 � 1014 1.39 � 1015� 7.73 � 1014
�2 log likelihood 49,788.80 47,725.40 45,918.40 44,158.50Akaike’s information criterion 49,794.80 47,731.40 45,924.40 44,164.50
Note. The dependent variable (postrecession profit) is change in firm profit for the years 2008 to 2011 (08–11). H � hypothesis; 07 � 2007; TIME �prerecession; 04 � 2004.� p � .05.
Table 7Bootstrapping Tests for Mediation
Mediation path
Bootstrapping
Indirect effect 95% CI
Indirect pathsHypotheses 4a & 4b
Staffing (04) ¡ Labor productivity (04–07) ¡ Intercept in prerecession profit (00–07) 6.94 � 1010 [�8.85 � 1010, 2.88 � 1011]Staffing (04) ¡ Labor productivity (04–07) ¡ Change in prerecession profit (00–07) 1.55 � 1011� [1.23 � 1010, 3.14 � 1011]Training (04) ¡ Labor productivity (04–07) ¡ Intercept in prerecession profit (00–07) �5.50 � 109 [�1.97 � 1011, 1.79 � 1011]Training (04) ¡ Labor productivity (04–07) ¡ Change in prerecession profit (00–07) 1.51 � 1011� [9.93 � 109, 3.09 � 1011]
Hypotheses 9a & 9bStaffing (04) ¡ Labor productivity (04–07) ¡ Intercept in postrecession profit (08–11) 6.53 � 1010 [�1.47 � 1011, 3.34 � 1011]Staffing (04) ¡ Labor productivity (04–07) ¡ Change in postrecession profit (08–11) 2.07 � 1011� [1.21 � 1010, 4.61 � 1011]Training (04) ¡ Labor productivity (04–07) ¡ Intercept in postrecession profit (08–11) 3.13 � 1010 [�2.03 � 1011, 2.85 � 1011]Training (04) ¡ Labor productivity (04–07) ¡ Change in postrecession profit (08–11) 2.29 � 1011� [1.41 � 1010, 4.99 � 1011]
Note. Bootstrapping is conducted on the basis of the Monte Carlo method with 20,000 repetitions. Estimates used in these tests come from differentmodels: Hypothesis 4a (Models 2 and 11), Hypothesis 4b (Models 3 and 12), Hypothesis 9a (Models 2 and 20), Hypothesis 9b (Models 3 and 21). CI �confidence interval; 00 � 2000; 04 � 2004; 07 � 2007; 08 � 2008; 11 � 2011.� p � .05.
374 KIM AND PLOYHART

effects of selective staffing and internal training (Models B1–2 andB1–3 in Appendix B, Table B1). For prerecession profit growth,collective turnover only moderated the effects of internal training(Model B2–3 in Appendix B, Table B2). There are three majorconclusions. First, the effects of collective turnover are affected bybroader economic conditions, in this case, the Great Recession. Sec-ond, collective turnover can moderate the effects of selective staffingand internal training, but primarily when the economy is strong andgrowing (e.g., prerecession). As shown in Figures B1a–B1c, highturnover attenuates the otherwise positive effects of selective staffingand internal training. Finally, the relationships between collectiveturnover, selective staffing, and internal training are complex andneed considerably more theoretical and empirical attention.
Question 3: Do the conclusions hold with an alternativemeasure of external firm financial performance? To reduceconcerns that these results were based on the choice of profitmeasure, we also tested the hypothesized models using ordinaryprofit as an alternative firm external performance measure. Theresults showed similar signs and magnitudes of effect sizes com-pared with the tables reported for the hypothesis tests (see Appen-dix C, Tables C1–C3). Thus, the hypothesis tests and conclusionsare identical with an alternative measure of profit.
Discussion
Understanding the factors that contribute to firm heterogeneity,performance, and competitive advantage is a question that unitesmultiple disciplinary perspectives. We propose that staffing and train-ing are two such strategically valuable factors because they shape thenature of human capital resources. Therefore, our objective in thisresearch was to examine why selective staffing and internal trainingcontribute to firm profit growth via firm labor productivity, and howthese relationships may differ as a function of the Great Recession.
For prerecession profit, the findings suggest (a) more selective staff-ing and internal training contribute indirectly (through productivity) toprofit growth, (b) the indirect effects are fully mediated for selectivestaffing and partially mediated for internal training, and (c) selectivestaffing and internal training also interact to directly influence profitgrowth. For postrecession profit, (d) selective staffing and internaltraining (assessed prerecession) contribute indirectly (through prere-cession productivity) to profit growth, and (e) the indirect effects arefully mediated. Finally, (f) internal training is more beneficial forgenerating prerecession resources and profit growth, whereas (g)staffing is more beneficial for postrecession profit growth (presum-ably because staffing builds generic human capital resources thatenable firm flexibility and adaptation). These findings and thoseoffered in the Supplemental Analyses section suggest that investing instaffing and training prerecession generates slack resources that helpfirms buffer and more quickly recover from the Great Recession,although collective turnover can, to a degree, attenuate these effects.
Theoretical Implications
Demonstrating that environmental variability influences thestrength and direction of staffing and training on productivity and firmpre- and postrecession profit has many important theoretical implica-tions. First, this study emphasizes the contextualized nature of firm-level relationships. This is noteworthy because the role of context isperhaps one of the greatest disconnects between micro and macroresearch (Ployhart & Hale, in press). Examining staffing and trainingwithin the broader economic context shows that environmentalchange presents an important boundary condition on their relation-ships with profit growth. Others have suggested environmental vari-ability is an important influence on HR management (Barney, 2001;Helfat & Peteraf, 2003; Schneider et al., 2012; Sirmon, Hitt, &Ireland, 2007), but empirical research has been lacking, particularly
Table 8 (continued)
Model 19 (H8) Model 20 (H9a) Model 21 (H9b) Model 22 Model 23
� SE � SE � SE � SE � SE
50,285,672.00� 24,514,314.00 50,686,217.00� 25,028,910.00 48,799,757.00� 25,438,721.00 49,966,276.00� 26,321,032.00 28,735,362.00 26,833,671.00
�3,535,163.00� 25,285,121.00 �6,683,348.00 25,758,085.00 1,469,910.00 26,025,703.00 758,496.00 26,942,705.00 18,478,065.00 27,549,552.00�41,270,000.00� 39,945,713.00 �37,830,000.00� 40,215,948.00 �45,000,000.00� 40,050,398.00 �47,050,000.00� 41,135,859.00 �18,490,000.00� 41,726,408.00335,000,000.00� 17,414,207.00 349,860,000.00� 18,404,064.00 326,870,000.00� 17,916,256.00 338,080,000.00� 19,335,900.00 342,150,000.00� 19,130,020.00
�91,550,000.00� 14,586,308.00 �101,300,000.00� 14,834,463.00 �93,180,000.00� 14,567,087.00 �95,170,000.00� 15,017,591.00 �109,500,000.00� 15,434,044.00�3,382,021.00 6,632,441.00 �10,040,000.00 7,147,663.00 �4,774,695.00 6,978,845.00 �12,300,000.00 7,509,778.00 �2,158,171.00 7,487,370.00
14,373,491.00� 6,494,549.00 13,991,571.00� 6,699,566.00 12,664,537.00� 6,904,761.00 11,922,513.00� 7,077,603.00 15,183,567.00� 7,328,114.00
�9,911,869.00 13,409,583.00 �11,540,000.00 14,275,901.00 �763,808.00 14,620,978.0010,833,944.00 6,698,605.00 10,995,597.00 7,096,740.00 13,512,264.00� 7,530,473.00
60,074,765.00� 20,887,122.00 57,896,381.00� 21,252,585.00 40,968,765.00� 21,806,118.00�15,490,000.00 9,000,242.00 �14,440,000.00 9,120,225.00 �11,260,000.00 9,658,076.00
12,079,661.00� 14,377,074.00 9,254,650.00� 14,508,795.00 4,532,367.00� 15,132,311.00 5,115,238.00� 15,433,143.0029,925,673.00� 7,414,948.00 29,291,379.00� 7,580,964.00 33,232,652.00� 7,852,675.00 32,659,541.00� 7,969,262.00
76,635,066.00� 31,174,890.00�3,137,461.00 15,866,365.00
1.11 � 1016� 2.38 � 1015 1.04 � 1016� 2.42 � 1015 9.30 � 1015� 2.42 � 1015 1.00 � 1016� 2.55 � 1015 9.65 � 1015� 2.65 � 1015
5.95 � 1014� 6.46 � 1014 7.27 � 1014� 6.75 � 1014 3.96 � 1014� 6.68 � 1014 3.59 � 1014� 7.00 � 1014 1.33 � 1015� 7.59 � 1014
49,686.30 47,627.40 45,816.50 44,058.70 44,077.5049,692.30 47,633.40 45,822.50 44,064.70 44,083.50
375STAFFING, TRAINING, AND FIRM PERFORMANCE

with respect to staffing and training. Indeed, the general finding is thatselective staffing (acquiring generic human capital) and internal train-ing (developing specific human capital) have positive effects on firmperformance (Combs et al., 2006; Crook et al., 2011; Schmidt &
Hunter, 1998). This study places boundaries on such “universalistic”expectations because more selective staffing and internal training donot always contribute to greater firm profit growth, and even whenthey do, the magnitude of the effects may differ over time. Simply put,
Figure 3. Predicted prerecession firm profit trends for the years 2000 to 2007 (00–07) with staffing andtraining. a: Staffing on firm profit 00–07 predicted trends. b: Training on firm profit 00–07 predicted trends.c: Predicted prerecession firm profit trends (00–07) with interaction between staffing and training.
Figure 4. Predicted postrecession firm profit trends for the years 2008 to 2011 (08–11) with staffing.
376 KIM AND PLOYHART

the value of staffing or training, and human capital resources andresource complementarities, depends on economic conditions. Thismore contextualized view expands prior contingency approaches ofHR practices (Delery & Doty, 1996; Jackson & Schuler, 1995;Youndt et al., 1996) and more recent contextualized views of humancapital (see Campbell et al., 2012; Ployhart & Moliterno, 2011).Future research should continue to explore other environmentalboundary conditions.
Second, the effects for training on profit growth were generallystronger than the effects of staffing before the recession, but theeffects for staffing were greater than the effects of training for recov-ery from the recession. This finding is interesting because it contra-dicts most prior strategy research on the superiority of specific humancapital resources for generating firm performance. However, thisresearch has not considered the broader economic context. Becauseselective staffing leads to acquiring higher quality generic humancapital resources that are more adaptive and flexible in turbulentenvironments (Ployhart & Moliterno, 2011; Way et al., 2012; Wright& Snell, 1998), staffing is an effective means to invest in humancapital to buffer the severe recession effects. Future research needs toexamine more specifically why this occurs. The explanation offered inthis study is one of generating slack resources. The pattern of medi-ation results and supplemental analyses suggests that staffing andtraining may generate slack resources when the economy is strong,and these slack resources help firms weather and recover from eco-nomic downturns. Training that develops specific human capital re-sources appears to be vital for establishing slack resources during astrong economy, whereas staffing that develops generic human capitalresources appears to be vital for reacting to and recovering from achanging economic context caused by the Great Recession. Futureresearch should also search for different training strategies that morequickly reconfigure specific human capital when recessions begin.Overall, research needs to identify the ways in which staffing andtraining contribute to competitive advantage under different environ-mental conditions.
Third, this study has implications for the “black box” concern ofHR practices (B. E. Becker & Huselid, 2006; Lepak et al., 2006)and resource complementarities (Ployhart et al., in press). SHRMscholars argue that HR practices sequentially contribute to HR,operational, and financial performance (e.g., Jiang et al., 2012;Ployhart & Hale, in press). We show that selective staffing andinternal training influence firm profit growth through firm prere-cession productivity. Our study sheds light on the SHRM literatureby empirically testing why staffing and training are related to pre-and postrecession performance via productivity. Future researchneeds to more closely examine other mediating processes relevantfor different types of firm-level outcomes. For example, our resultsemphasize the importance of staffing and training to develop slackresources, but the linkage between HR systems and the generationof slack resources has to date been relatively ignored. At the sametime, our study extends research on HR systems by studyinginteractions between staffing and training from the lens of resourcecomplementarities. It is interesting to observe that research on HRsystems tends to emphasize the importance of the system, yetoperationalize the system via additive measures of individualpractices. In contrast, the strategy literature emphasizes the impor-tance of resources complementarities (e.g., Adegbesan, 2009; En-nen & Richter, 2010). Given that HR practices should influencehuman capital resources, future research should more carefully
consider the manner in which HR practices contribute to thecreation of resource complementarities, or alternatively, the man-ner in which HR practices may complement each other to acquireor develop human capital resources (Ployhart et al., in press).
Fourth, our study reinforces the importance of future researchexamining staffing, training, human capital resources, and collectiveturnover in combination. The supplemental analyses that includedturnover were both similar to and different from past research, and therelationships with staffing and training were complex, suggesting thepresence of additional moderators (see Nyberg & Ployhart, 2013, forseveral theoretical explanations). One such moderator could be thetiming of collective turnover. As expected, turnover rates followed aninverted U-shaped pattern over time, such that they increased prior tothe recession and decreased during and after the recession (�linear �.04, �quadratic � �.02; ps � .05). The variance components could notbe estimated for these terms, suggesting that the recession affectedturnover rates similarly. Finally, using turnover rates in 2006, 2008, or2010, we found effects with staffing, training, and profit growthidentical to those reported with turnover rates in 2004. Thus, itappears that collective turnover has a stronger effect when economicconditions are more favorable, perhaps because employee mobility isless constrained. Future research should take a more careful exami-nation of time, economic conditions, and collective turnover flowssimilar to the research that has been conducted at the individual level.
Fifth, this study furthers calls for careful consideration of the role oftime within organizational scholarship (Mitchell & James, 2001;Wright & Haggerty, 2005). Modeling the profit trajectory over timerevealed predictive relationships that were positive before and afterthe recession, but were negative when the recession hit. This “discon-tinuous” effect can only be observed by modeling data over time, andthese “sign reversals” would have been obscured by looking at thedata cross-sectionally (indeed, bivariate relationships are uniformlypositive). Thus, research should consider how long or under whatconditions the relationships between staffing, training, and perfor-mance last. For example, researchers need to not only identify theconditions that change the value of human capital resources (Helfat &Peteraf, 2003) but also how to manage the resources when the envi-ronment changes (Sirmon et al., 2007). Greater precision in thespecification of when relationships will exist, and for how long, addsto greater refinements of theory, more precise hypothesis tests, andmore actionable practical recommendations.
Finally, this study contributes to the growing integration betweenmicro and macro scholarship. As research in economics and strategyincreasingly explores psychological microfoundations of firm heter-ogeneity (e.g., Coff & Kryscynski, 2011; Felin et al., 2009), there ismuch that organizational psychology can do to contribute to thebroader macro literature (Ployhart & Hale, in press). Such research isimportant for many reasons, not the least of which is demonstratingthe strategic value and importance of psychological constructs andphenomena (Ployhart, 2012; Schneider et al., 2012). But the broaderscientific benefits are to gain a more complete understanding oforganizations and the people within them. For example, if the benefitsof staffing and training are, to a degree, dependent on broader eco-nomic conditions, then how does this change the way in whichvalidity generalization evidence is used to argue for the merits of oneselection or training practice over another? If staffing, which contrib-utes to the generation of generic human capital resources, is moreimportant in times of economic crisis, then does this require a changeto the past 50 years of economic research on specific human capital?
377STAFFING, TRAINING, AND FIRM PERFORMANCE
These findings challenge the dominant logic that exists within eachindependent literature, and they require new thinking and theory toaddress them.
Practical Implications
This study’s most important practical implication is that firmsthat use more selective staffing and internal training outproduceand outperform competitors before the Great Recession, and theyalso recover more quickly. Stated simply, the bigger they are, theharder they fall, but the faster they get back up. Yet, this simplestory obscures some important nuances that may enable managersto more effectively leverage their HR practices and human capitalresources under different economic conditions. This is importantbecause when budgets are constrained, where can HR managersmake investments that generate the greatest return? First, when theeconomy is strong, managers must be careful to invest in bothstaffing and training, but when the economy changes drastically,investing in training appears less critical. This suggestion is basedon the findings that training is more important for generating profitgrowth during the prerecession period, whereas staffing is moreimportant for generating profit growth through and recoveringfrom the recession. Second, the effects of staffing and training onprofit growth occur due to their effects on productivity, suggestingthat using HR to generate slack resources is necessary to weathereconomic transformations. Of course, staffing and training areonly two HR practices from an entire system, and other practicesin that system (e.g., compensation) are also necessary to enhanceproductivity and profit growth (e.g., Huselid, 1995; Jiang et al.,2012). Overall, these findings are timely given that economicturbulence is likely to be the norm in the foreseeable future(Brown, Haltiwanger, & Lane, 2006), and HR managers oftenstruggle to justify their human capital expenditures during times ofuncertainty (Ghemawat, 2009; Robbins & Pearce, 1992). Betteracquiring and developing talent offers greater flexibility and op-portunities for profit growth across pre- and postrecession periods,but not with equal effectiveness in each period.
Limitations and Directions for Future Research
Collecting firm-level performance data from over a decade andlinking it with measures of staffing and training presents manychallenges. We tried to provide the most stringent tests of thehypotheses possible, but there remain several factors beyond ourcontrol that should be considered when interpreting these findingsand addressed with future research. First, the staffing and trainingmeasures were based on reports by HR managers, albeit twomanagers within each firm. This not only eliminates common-source bias but also makes it impossible to estimate the reliabilityof these measures (Gerhart, Wright, McMahan, & Snell, 2000;Wright et al., 2001) because one manager responded to the staffingquestions, whereas another responded to the training questions.However, other research suggests that when the focus of the itemsis on more objective characteristics, reliability of single-itemscores is often acceptable (Wanous, Reichers, & Hudy, 1997).Further, when managers are within the same firm, prior researchsuggests it is possible for them to agree and produce ratings withacceptable levels of reliability (Takeuchi et al., 2009). In thisstudy, managers only reported the selection ratio and proportion of
employees internally trained. These are very objective questionsand hence may be more reliable, but the fact remains that wecannot estimate reliability. However, even if reliability is low, theresults presented here would be conservative because unreliabilityattenuates correlations and regression weights.
Second, future research should examine more direct measures ofstaffing and training or other proxy measures to ensure conver-gence of results (see Van Iddekinge et al., 2009). Use of selectionratio and proportion of employees who were internally trainedshould provide a reasonable approximation of the quality of se-lective staffing and internal training. For example, the quality ofselective staffing may be operationalized by selection ratio be-cause selecting applicants from larger pools using valid proceduresallows firms to identify higher quality talent (Cabrera & Raju,2001; Cascio, 2000; Cronbach & Gleser, 1965). Likewise, severalstudies have operationalized internal training on the basis of indi-ces of employee participation in training (Delaney & Huselid,1996; Hatch & Dyer, 2004; Ployhart et al., 2011; Russell et al.,1985). The analyses presented in the Method section offer someempirical support for these inferences of construct validity. Nev-ertheless, it is not possible to directly assess quality with thesemeasures, and thus future research should examine these moredirect measures. For example, researchers should examine whetherfirms that use structured (vs. unstructured) interviews, or trainingprograms based on job analyses and needs analysis (vs. those thatdo not), result in higher productivity and profitability. Such re-search would fill an important void that remains in the literature.
Third, the results of this study are in part limited by the timeframes for which we had data. The timing of the staffing andtraining measures were collected in the 2005 survey administrationbut referenced the 2004 calendar year. This allows us to model thelongest period of performance growth, but it would be preferableto model staffing and training farther back to the year 2000.Expanding the time periods is important because as the results ofthis study show, broader economic conditions can affect the spe-cific effect sizes and the statistical significance of different pre-dictors. Therefore, we caution readers from generalizing our re-sults too broadly across time or economic periods, and stronglysuggest the need for replication under similar and different eco-nomic periods. In particular, future research needs to examine howlong the effects found in this research are likely to last. Recessionshave occurred regularly over the last century, and hence one mustconsider when a “postrecession” period becomes a “prerecession”period. Further, the severity of the recession is likely to affect thesetime frames, as severe recessions tend to transform the economiclandscape, whereas lesser recessions tend to contract it.
Fourth, this study operationalized firm profit using EBIT be-cause it is based on generally accepted accounting principles anda widely used accounting metric (Richard et al., 2009). However,other firm performance metrics may have different relationshipswith selective staffing and internal training. Future research needsto examine which firm outcomes are most strongly related toselective staffing and internal training, and when.
Finally, although we tried to control for exogenous influencesthat may affect the staffing, training, and performance scores(particularly prior performance and size), there may be other “thirdvariables” that we cannot model. Allowing intercepts to varyacross firms may at least help account for such variability, butfuture research should model other potential sources of variance,
378 KIM AND PLOYHART
such as the firm’s other HR practices, policies, or the firm’sstrategy. One particularly important influence is the possibility thatprior firm profitability influences which HR practices are adoptedand how they are implemented. Although we tried to control forsuch reverse causality via modeling prior profit, future researchneeds to consider issues of reverse causality more carefully. An-other potential influence is cultural differences in the adoption ofHR practices. Even though South Korea has largely adopted West-ern HR practices since the late 1990s (Bae, 2012; Tung, Paik, &Bae, 2013), there may still be cultural differences that exist thatcannot be captured in our data, and hence these findings need to bereplicated in different countries. A third potential influence in-volves broader economic conditions that we could not model inthese data. In particular, unemployment rates increased during theGreat Recession, but they varied widely across industries andregions. Different unemployment rates will certainly influence thereturn to be found by selective staffing (and possibly internaltraining as well), and we encourage researchers to link sucheconomic indices to HR practices and psychological characteris-tics (e.g., quality of applicant pools).
Conclusion
Our study demonstrates that environmental change, such as theGreat Recession, can affect the strength and direction of staffing,training, and productivity on firm profit growth. Different relation-ships are found in different recession phases (pre- and postreces-sion). The results provide important nuanced insights that moreselective staffing and internal training enhance productivity that inturn contributes to pre- and postrecession profit growth and thatselective staffing helps buffer the deleterious effects of a recession.Overall, we hope the present study stimulates more theoretical andempirical attention to identify the potential boundary conditionsthat may influence the strategic value of HR systems for firmgrowth and competitive advantage.
References
Adegbesan, J. A. (2009). On the origins of competitive advantage: Strategic factormarkets and heterogeneous resource complementarity. Academy of Manage-ment Review, 34, 463–475. doi:10.5465/AMR.2009.40632465
Aguinis, H., & Kraiger, K. (2009). Benefits of training and development forindividuals and teams, organizations, and society. Annual Review Psychology,60, 451–474. doi:10.1146/annurev.psych.60.110707.163505
Alexander, R. A., Barrett, G. V., & Doverspike, D. (1983). An explicationof the selection ratio and its relationship to hiring rate. Journal ofApplied Psychology, 68, 342–344. doi:10.1037/0021-9010.68.2.342
Argote, L. (1999). Organizational learning: Creating, retaining, andtransferring knowledge. Boston, MA: Kluwer Academic Publishers.
Arthur, W., Jr., Bennett, W., Edens, P. S., & Bell, Z. T. (2003). Effective-ness of training in organizations: A meta-analysis of design and evalu-ation features. Journal of Applied Psychology, 88, 234–245. doi:10.1037/0021-9010.88.2.234
Bae, J. (2012). Self-fulfilling processes at a global level: The evolution ofhuman resource management practices in Korea, 1987–2007. Manage-ment Learning, 43, 579–607. doi:10.1177/1350507611427827
Barney, J. B. (2001). Is the resource-based “view” a useful perspective forstrategic management research? Yes. Academy of Management Review,26, 41–56. doi:10.5465/AMR.2001.4011938
Barney, J. B., & Wright, P. M. (1998). On becoming a strategic partner:The role of human resources in gaining competitive advantage. Human
Resource Management, 37, 31– 46. doi:10.1002/(SICI)1099-050X(199821)37:1�31::AID-HRM4�3.0.CO;2-W
Becker, B. E., & Huselid, M. A. (2006). Strategic human resource man-agement: Where do we go from here? Journal of Management, 32,898–925. doi:10.1177/0149206306293668
Becker, T. E. (2005). Potential problems in the statistical control ofvariables in organizational research: A qualitative analysis with recom-mendations. Organizational Research Method, 8, 274 –289. doi:10.1177/1094428105278021
Beltrán-Martín, I., Roca-Puig, V., Escrig-Tena, A., & Bou-Llusar, J. C.(2008). Human resource flexibility as a mediating variable between highperformance work systems and performance. Journal of Management,34, 1009–1044. doi:10.1177/0149206308318616
Bhattacharya, M., Gibson, D. E., & Doty, D. D. (2005). The effects offlexibility in employee skills, employee behaviors, and human resourcepractices on firm performance. Journal of Management, 31, 622–640.doi:10.1177/0149206304272347
Bliese, P. D., & Ployhart, R. E. (2002). Growth modeling using randomcoefficient models: Model building, testing, and illustrations. Organiza-tional Research Methods, 5, 362–387. doi:10.1177/109442802237116
Boudreau, J. W., & Rynes, S. L. (1985). Role of recruitment in staffingutility analysis. Journal of Applied Psychology, 70, 354–366. doi:10.1037/0021-9010.70.2.354
Brown, C., Haltiwanger, J., & Lane, J. (2006). Economic turbulence: Is avolatile economy good for America? Chicago, IL: University of ChicagoPress. doi:10.7208/chicago/9780226076348.001.0001
Cabrera, E. F., & Raju, N. S. (2001). Utility analysis: Current trends andfuture directions. International Journal of Selection and Assessment, 9,92–102. doi:10.1111/1468-2389.00166
Campbell, B. A., Coff, R., & Kryscynski, D. (2012). Rethinking sustainedcompetitive advantage from human capital. Academy of ManagementReview, 37, 376–395. doi:10.5465/amr.2010.0276
Cascio, W. F. (2000). Costing human resources. The financial impact ofbehavior in organizations. Cincinnati, OH: Southwestern.
Cascio, W. F., & Boudreau, J. W. (2008). Investing in people: Financialimpact of human resource initiatives. Upper Saddle River, NJ: FT Press.
Cheng, J., & Kesner, I. (1997). Organizational slack and response toenvironmental shifts: The impact of resource allocation patterns. Journalof Management, 23, 1–18. doi:10.1177/014920639702300101
Coff, R. W., & Kryscynski, D. (2011). Drilling for micro-foundations ofhuman capital–based competitive advantages. Journal of Management,37, 1429–1443. doi:10.1177/0149206310397772
Collins, C. J., & Clark, K. D. (2003). Strategic human resource practices, topmanagement team social networks, and firm performance: The role of humanresource practices in creating organizational competitive advantage. Academy ofManagement Journal, 46, 740–751. doi:10.2307/30040665
Collinson, S., & Wilson, D. C. (2006). Inertia in Japanese organizations:Knowledge management routines and failure to innovate. OrganizationStudies, 27, 1359–1387. doi:10.1177/0170840606067248
Colquitt, J. A., LePine, J. A., & Noe, R. A. (2000). Toward an integrativetheory of training motivation: A meta-analytic path analysis of 20 yearsof research. Journal of Applied Psychology, 85, 678–707. doi:10.1037/0021-9010.85.5.678
Combs, J., Liu, Y., Hall, A., & Ketchen, D. (2006). How much dohigh-performance work practices matter? A meta-analysis of their ef-fects on organizational performance. Personnel Psychology, 59, 501–528. doi:10.1111/j.1744-6570.2006.00045.x
Cronbach, L. J., & Gleser, G. C. (1965). Psychological tests and personneldecisions. Urbana: University of Illinois Press.
Crook, T. R., Ketchen, D. J., Jr., Combs, J. G., & Todd, S. Y. (2008).Strategic resources and performance: A meta-analysis. Strategic Man-agement Journal, 29, 1141–1154. doi:10.1002/smj.703
Crook, T. R., Todd, S. Y., Combs, J. G., Woehr, D. J., & Ketchen, D. J.(2011). Does human capital matter? A meta-analysis of the relationship
379STAFFING, TRAINING, AND FIRM PERFORMANCE
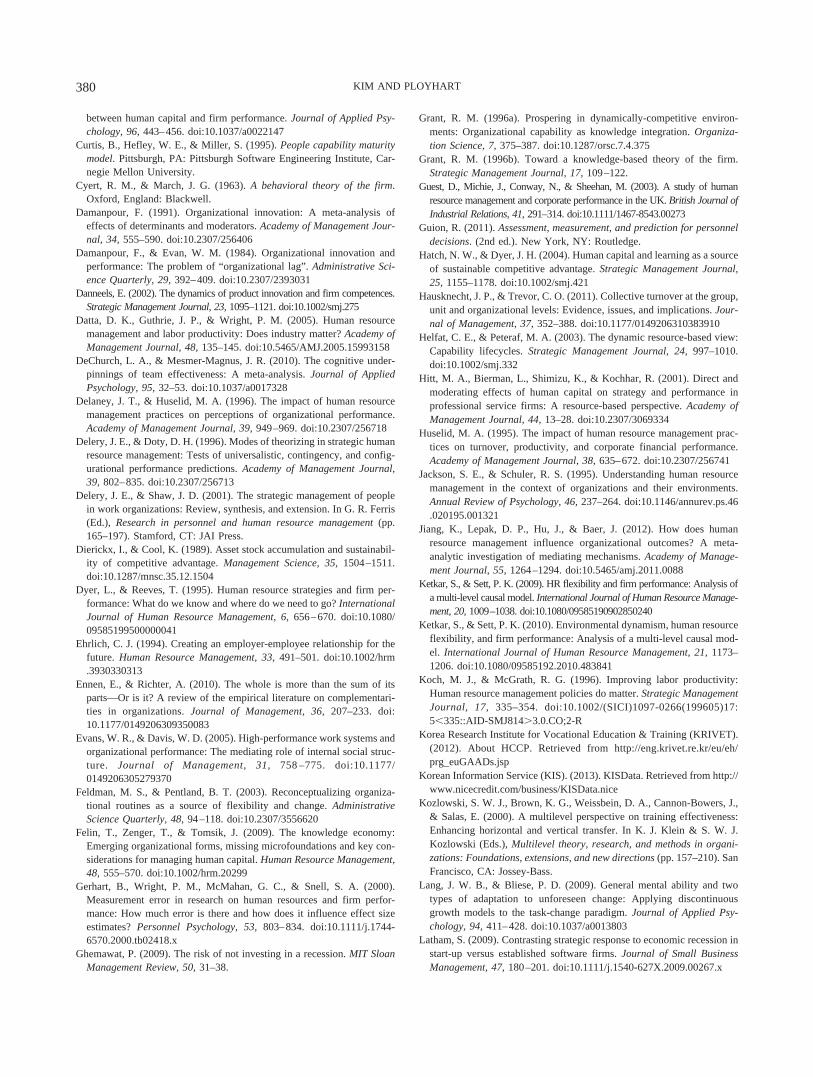
between human capital and firm performance. Journal of Applied Psy-chology, 96, 443–456. doi:10.1037/a0022147
Curtis, B., Hefley, W. E., & Miller, S. (1995). People capability maturitymodel. Pittsburgh, PA: Pittsburgh Software Engineering Institute, Car-negie Mellon University.
Cyert, R. M., & March, J. G. (1963). A behavioral theory of the firm.Oxford, England: Blackwell.
Damanpour, F. (1991). Organizational innovation: A meta-analysis ofeffects of determinants and moderators. Academy of Management Jour-nal, 34, 555–590. doi:10.2307/256406
Damanpour, F., & Evan, W. M. (1984). Organizational innovation andperformance: The problem of “organizational lag”. Administrative Sci-ence Quarterly, 29, 392–409. doi:10.2307/2393031
Danneels, E. (2002). The dynamics of product innovation and firm competences.Strategic Management Journal, 23, 1095–1121. doi:10.1002/smj.275
Datta, D. K., Guthrie, J. P., & Wright, P. M. (2005). Human resourcemanagement and labor productivity: Does industry matter? Academy ofManagement Journal, 48, 135–145. doi:10.5465/AMJ.2005.15993158
DeChurch, L. A., & Mesmer-Magnus, J. R. (2010). The cognitive under-pinnings of team effectiveness: A meta-analysis. Journal of AppliedPsychology, 95, 32–53. doi:10.1037/a0017328
Delaney, J. T., & Huselid, M. A. (1996). The impact of human resourcemanagement practices on perceptions of organizational performance.Academy of Management Journal, 39, 949–969. doi:10.2307/256718
Delery, J. E., & Doty, D. H. (1996). Modes of theorizing in strategic humanresource management: Tests of universalistic, contingency, and config-urational performance predictions. Academy of Management Journal,39, 802–835. doi:10.2307/256713
Delery, J. E., & Shaw, J. D. (2001). The strategic management of peoplein work organizations: Review, synthesis, and extension. In G. R. Ferris(Ed.), Research in personnel and human resource management (pp.165–197). Stamford, CT: JAI Press.
Dierickx, I., & Cool, K. (1989). Asset stock accumulation and sustainabil-ity of competitive advantage. Management Science, 35, 1504–1511.doi:10.1287/mnsc.35.12.1504
Dyer, L., & Reeves, T. (1995). Human resource strategies and firm per-formance: What do we know and where do we need to go? InternationalJournal of Human Resource Management, 6, 656–670. doi:10.1080/09585199500000041
Ehrlich, C. J. (1994). Creating an employer-employee relationship for thefuture. Human Resource Management, 33, 491–501. doi:10.1002/hrm.3930330313
Ennen, E., & Richter, A. (2010). The whole is more than the sum of itsparts—Or is it? A review of the empirical literature on complementari-ties in organizations. Journal of Management, 36, 207–233. doi:10.1177/0149206309350083
Evans, W. R., & Davis, W. D. (2005). High-performance work systems andorganizational performance: The mediating role of internal social struc-ture. Journal of Management, 31, 758 –775. doi:10.1177/0149206305279370
Feldman, M. S., & Pentland, B. T. (2003). Reconceptualizing organiza-tional routines as a source of flexibility and change. AdministrativeScience Quarterly, 48, 94–118. doi:10.2307/3556620
Felin, T., Zenger, T., & Tomsik, J. (2009). The knowledge economy:Emerging organizational forms, missing microfoundations and key con-siderations for managing human capital. Human Resource Management,48, 555–570. doi:10.1002/hrm.20299
Gerhart, B., Wright, P. M., McMahan, G. C., & Snell, S. A. (2000).Measurement error in research on human resources and firm perfor-mance: How much error is there and how does it influence effect sizeestimates? Personnel Psychology, 53, 803–834. doi:10.1111/j.1744-6570.2000.tb02418.x
Ghemawat, P. (2009). The risk of not investing in a recession. MIT SloanManagement Review, 50, 31–38.
Grant, R. M. (1996a). Prospering in dynamically-competitive environ-ments: Organizational capability as knowledge integration. Organiza-tion Science, 7, 375–387. doi:10.1287/orsc.7.4.375
Grant, R. M. (1996b). Toward a knowledge-based theory of the firm.Strategic Management Journal, 17, 109–122.
Guest, D., Michie, J., Conway, N., & Sheehan, M. (2003). A study of humanresource management and corporate performance in the UK. British Journal ofIndustrial Relations, 41, 291–314. doi:10.1111/1467-8543.00273
Guion, R. (2011). Assessment, measurement, and prediction for personneldecisions. (2nd ed.). New York, NY: Routledge.
Hatch, N. W., & Dyer, J. H. (2004). Human capital and learning as a sourceof sustainable competitive advantage. Strategic Management Journal,25, 1155–1178. doi:10.1002/smj.421
Hausknecht, J. P., & Trevor, C. O. (2011). Collective turnover at the group,unit and organizational levels: Evidence, issues, and implications. Jour-nal of Management, 37, 352–388. doi:10.1177/0149206310383910
Helfat, C. E., & Peteraf, M. A. (2003). The dynamic resource-based view:Capability lifecycles. Strategic Management Journal, 24, 997–1010.doi:10.1002/smj.332
Hitt, M. A., Bierman, L., Shimizu, K., & Kochhar, R. (2001). Direct andmoderating effects of human capital on strategy and performance inprofessional service firms: A resource-based perspective. Academy ofManagement Journal, 44, 13–28. doi:10.2307/3069334
Huselid, M. A. (1995). The impact of human resource management prac-tices on turnover, productivity, and corporate financial performance.Academy of Management Journal, 38, 635–672. doi:10.2307/256741
Jackson, S. E., & Schuler, R. S. (1995). Understanding human resourcemanagement in the context of organizations and their environments.Annual Review of Psychology, 46, 237–264. doi:10.1146/annurev.ps.46.020195.001321
Jiang, K., Lepak, D. P., Hu, J., & Baer, J. (2012). How does humanresource management influence organizational outcomes? A meta-analytic investigation of mediating mechanisms. Academy of Manage-ment Journal, 55, 1264–1294. doi:10.5465/amj.2011.0088
Ketkar, S., & Sett, P. K. (2009). HR flexibility and firm performance: Analysis ofa multi-level causal model. International Journal of Human Resource Manage-ment, 20, 1009–1038. doi:10.1080/09585190902850240
Ketkar, S., & Sett, P. K. (2010). Environmental dynamism, human resourceflexibility, and firm performance: Analysis of a multi-level causal mod-el. International Journal of Human Resource Management, 21, 1173–1206. doi:10.1080/09585192.2010.483841
Koch, M. J., & McGrath, R. G. (1996). Improving labor productivity:Human resource management policies do matter. Strategic ManagementJournal, 17, 335–354. doi:10.1002/(SICI)1097-0266(199605)17:5�335::AID-SMJ814�3.0.CO;2-R
Korea Research Institute for Vocational Education & Training (KRIVET).(2012). About HCCP. Retrieved from http://eng.krivet.re.kr/eu/eh/prg_euGAADs.jsp
Korean Information Service (KIS). (2013). KISData. Retrieved from http://www.nicecredit.com/business/KISData.nice
Kozlowski, S. W. J., Brown, K. G., Weissbein, D. A., Cannon-Bowers, J.,& Salas, E. (2000). A multilevel perspective on training effectiveness:Enhancing horizontal and vertical transfer. In K. J. Klein & S. W. J.Kozlowski (Eds.), Multilevel theory, research, and methods in organi-zations: Foundations, extensions, and new directions (pp. 157–210). SanFrancisco, CA: Jossey-Bass.
Lang, J. W. B., & Bliese, P. D. (2009). General mental ability and twotypes of adaptation to unforeseen change: Applying discontinuousgrowth models to the task-change paradigm. Journal of Applied Psy-chology, 94, 411–428. doi:10.1037/a0013803
Latham, S. (2009). Contrasting strategic response to economic recession instart-up versus established software firms. Journal of Small BusinessManagement, 47, 180–201. doi:10.1111/j.1540-627X.2009.00267.x
380 KIM AND PLOYHART

Latham, S. F., & Braun, M. R. (2008). The performance implications of financialslack during economic recession and recovery: Observations from thesoftware industry (2001–2003). Journal of Managerial Issues, 20, 30–50.
Latham, S. F., & Braun, M. R. (2011). Economic recessions, strategy, andperformance: A synthesis. Journal of Strategy and Management, 4,96–115. doi:10.1108/17554251111128592
Lawler, E. E., Levenson, A., & Boudreau, J. W. (2004). HR metrics andanalytics: Use and impact. Human Resource Planning, 24, 27–35.
Lengnick-Hall, C. A. (1996). Customer contributions to quality: A differ-ent view of the customer-oriented firm. Academy of Management Re-view, 21, 791–824. doi:10.5465/AMR.1996.9702100315
Lepak, D. P., Liao, H., Chung, Y., & Harden, E. (2006). A conceptualreview of human resource management systems in strategic humanresource management research. In J. Martocchio (Ed.), Research inpersonnel and human resources management (pp. 217–271). Oxford,England: Elsevier.
Liebeskind, J. P. (1996). Knowledge, strategy, and the theory of the firm.Strategic Management Journal, 17, 93–107.
Mabey, C., & Ramirez, M. (2005). Does management development im-prove organizational productivity? International Journal of Human Re-source Management, 16, 1067–1082. doi:10.1080/09585190500143931
MacKinnon, D. P., Lockwood, C. M., Hoffman, J. M., West, S. G., &Sheets, V. (2002). A comparison of methods to test mediation and otherintervening variable effects. Psychological Methods, 7, 83–104. doi:10.1037/1082-989X.7.1.83
MacKinnon, D. P., Lockwood, C. M., & Williams, J. (2004). Confidencelimits for the indirect effect: Distribution of the product and resamplingmethods. Multivariate Behavioral Research, 39, 99–128. doi:10.1207/s15327906mbr3901_4
Mahoney, J. T., & Pandian, J. R. (1992). The resource-based view withinthe conversation of strategic management. Strategic Management Jour-nal, 13, 363–380. doi:10.1002/smj.4250130505
March, J. G. (1991). Exploration and exploitation in organizational learn-ing. Organization Science, 2, 71–87. doi:10.1287/orsc.2.1.71
Mitchell, T. R., & James, L. R. (2001). Building better theory: Time andthe specification of when things happen. Academy of ManagementReview, 26, 530–547. doi:10.5465/AMR.2001.5393889
Murray, B., & Raffaele, G. C. (1997). Single-site, results-level evaluationof quality awareness training. Human Resource Development Quarterly,8, 229–245. doi:10.1002/hrdq.3920080306
National Bureau of Economic Research. (2001). US business cycle expan-sions and contractions. Retrieved from http://www.nber.org/cycles.html
Ngo, H., & Loi, R. (2008). Human resource flexibility, organizationalculture and firm performance: An investigation of multinational firms inHong Kong. International Journal of Human Resource Management, 19,1654–1666. doi:10.1080/09585190802295082
Noe, R. A. (2008). Employee training and development (4th ed.). Boston,MA: Irwin-McGraw.
Nyberg, A. J., & Ployhart, R. E. (2013). Context-emergent turnover (CET)theory: A theory of collective turnover. Academy of Management Re-view, 38, 109–131. doi:10.5465/amr.2011.0201
Oldroyd, J. B., & Morris, S. S. (2012). Catching falling stars: A humanresource response to social capital’s detrimental effect of informationoverload on star employees. Academy of Management Review, 37,396–418. doi:10.5465/amr.2010.0403
Parmigiani, A., & Howard-Grenville, J. (2011). Routines revisited: Explor-ing the capabilities and practice perspectives. Academy of ManagementAnnals, 5, 413–453. doi:10.1080/19416520.2011.589143
Pearce, J. A., & Michael, S. C. (2006). Strategies to prevent economicrecessions from causing business failure. Business Horizons, 49, 201–209. doi:10.1016/j.bushor.2005.08.008
Pearce, J. A., & Robbins, D. K. (2008). Strategic transformation as theessential last step in the process of business turnaround. Business Ho-rizons, 51, 121–130. doi:10.1016/j.bushor.2007.11.003
Penrose, E. T. (1959). The theory of the growth of the firm. Oxford,England: Basil Blackwell.
Peteraf, M. A., & Barney, J. B. (2003). Unraveling the resource-based tangle.Managerial & Decision Economics, 24, 309–323. doi:10.1002/mde.1126
Ployhart, R. E. (2006). Staffing in the 21st century: New challenges andstrategic opportunities. Journal of Management, 32, 868–897. doi:10.1177/0149206306293625
Ployhart, R. E. (2012). The psychology of competitive advantage: Anadjacent possibility. Industrial and Organizational Psychology, 5, 62–81. doi:10.1111/j.1754-9434.2011.01407.x
Ployhart, R. E., & Hale, D. (in press). The fascinating psychologicalmicrofoundations of strategy and competitive advantage. Annual Reviewof Organizational Psychology and Organizational Behavior.
Ployhart, R. E., & Moliterno, T. P. (2011). Emergence of the human capitalresource: A multilevel model. Academy of Management Review, 36,127–150. doi:10.5465/AMR.2011.55662569
Ployhart, R. E., Nyberg, A. J., Reilly, G., & Maltarich, M. A. (in press).Human capital is dead. Long live human capital resources! Journal ofManagement.
Ployhart, R. E., & Schneider, B. (2002). A multilevel perspective on personnelselection research and practice: Implications for selection system design,assessment, and construct validation. In F. J. Dansereau & F. Yamarino(Eds.), Research in multi-level issues volume 1: The many faces of multi-level issues (pp. 95–140). Oxford, England: Elsevier Science.
Ployhart, R. E., Van Iddekinge, C. H., & MacKenzie, W. I. (2011).Acquiring and developing human capital in service contexts: The inter-connectedness of human capital resources. Academy of ManagementJournal, 54, 353–368. doi:10.5465/AMJ.2011.60263097
Ployhart, R. E., Weekley, J. A., & Ramsey, J. (2009). The consequences ofhuman resource stocks and flows: A longitudinal examination of unitservice orientation and unit effectiveness. Academy of ManagementJournal, 52, 996–1015. doi:10.5465/AMJ.2009.44635041
Podsakoff, N. P., Whiting, S. W., Podsakoff, P. M., & Blume, B. D. (2009).Individual- and organizational-level consequences of organizational cit-izenship behaviors: A meta-analysis. Journal of Applied Psychology, 94,122–141. doi:10.1037/a0013079
Raudenbush, S. W., & Bryk, A. S. (2002). Hierarchical linear models: Appli-cations and data analysis methods (2nd ed.). Newbury Park, CA: Sage.
Ren, Y., & Argote, L. (2011). Transactive memory systems 1985–2010:An integrative framework of key dimensions, antecedents, and conse-quences. Academy of Management Annals, 5, 189–229. doi:10.1080/19416520.2011.590300
Richard, P. J., Devinney, T. M., Yip, G. S., & Johnson, G. (2009).Measuring organizational performance: Towards methodological bestpractice. Journal of Management, 35, 718 – 804. doi:10.1177/0149206308330560
Richardson, F., Kane, G., & Lobingier, P. (1998). The impact of recessionon the prediction of corporate failure. Journal of Business Finance &Accounting, 25, 167–186. doi:10.1111/1468-5957.00182
Robbins, D. K., & Pearce, J. A. (1992). Turnaround: Retrenchment andrecovery. Strategic Management Journal, 13, 287–309. doi:10.1002/smj.4250130404
Russell, J. S., Terborg, J. R., & Powers, M. L. (1985). Organizationalperformance and organizational level training and support. PersonnelPsychology, 38, 849–863. doi:10.1111/j.1744-6570.1985.tb00570.x
Sackett, P. R., & Ellingson, J. E. (1997). The effects of forming multi-predictor composites on group differences and adverse impact. Person-nel Psychology, 50, 707–721. doi:10.1111/j.1744-6570.1997.tb00711.x
Samuelson, P. A., & Nordhaus, W. D. (1989). Economics (13th ed.). NewYork, NY: McGraw-Hill.
Schmidt, F. L., & Hunter, J. E. (1998). The validity and utility of selectionmethods in personnel psychology: Practical and theoretical implicationsof 85 years of research findings. Psychological Bulletin, 124, 262–274.doi:10.1037/0033-2909.124.2.262
381STAFFING, TRAINING, AND FIRM PERFORMANCE

Schmidt, J., & Keil, T. (2013). What makes a resource valuable? Identi-fying the drivers of firm-idiosyncratic resource value. Academy of Man-agement Review, 38, 206–228. doi:10.5465/amr.2010.0404
Schmitt, N., & Chan, D. (1998). Personnel selection: A theoretical ap-proach. Thousand Oaks, CA: Sage Publications.
Schneider, B. (1987). The people make the place. Personnel Psychology,40, 437–453. doi:10.1111/j.1744-6570.1987.tb00609.x
Schneider, B., Ehrhart, M. G., & Macey, W. A. (2012). A funny thinghappened on the way to the future: The focus on organizational com-petitive advantage lost out. Industrial and Organizational Psychology:Perspectives on Science and Practice, 5, 96–101. doi:10.1111/j.1754-9434.2011.01411.x
Schneider, B., Smith, D. B., & Sipe, W. (2000). Personnel selectionpsychology: Multilevel considerations. In K. Klein & S. Kozlowski(Eds.), Multilevel theory, research, and methods in organizations (pp.91–120). San Francisco, CA: Jossey-Bass.
Selig, J. P., & Preacher, K. J. (2008). Monte Carlo method for assessing mediation:An interactive tool for creating confidence intervals for indirect effects [Com-puter software]. Available from http://quantpsy.org/
Shaw, J. D., Gupta, N., & Delery, J. E. (2005). Alternative conceptualiza-tions of the relationship between voluntary turnover and organizationalperformance. Academy of Management Journal, 48, 50–68. doi:10.5465/AMJ.2005.15993112
Shaw, J. D., Park, T. Y., & Kim, E. (2013). A resource-based perspective onhuman capital losses, HRM investments, and organizational performance.Strategic Management Journal, 34, 572–589. doi:10.1002/smj.2025
Siebert, W. S., & Zubanov, N. (2009). Searching for the optimal level ofemployee turnover: A study of a large U. K. retail organization. Acad-emy of Management Journal, 52, 294–313. doi:10.5465/AMJ.2009.37308149
Singer, J. D., & Willett, J. B. (2003). Applied longitudinal data analysis:Modeling change and event occurrence: Oxford, England: Oxford Uni-versity Press. doi:10.1093/acprof:oso/9780195152968.001.0001
Sirmon, D. G., Hitt, M. A., & Ireland, R. D. (2007). Managing firmresources in dynamic environments to create value: Looking inside theblack box. Academy of Management Review, 32, 273–292. doi:10.5465/AMR.2007.23466005
Sturman, M. C., Trevor, C. O., Boudreau, J. W., & Gerhart, B. (2003). Isit worth it to win the talent war? Evaluating the utility of performance-based pay. Personnel Psychology, 56, 997–1035. doi:10.1111/j.1744-6570.2003.tb00248.x
Subramaniam, M., & Youndt, M. A. (2005). The influence of intellectualcapital on the types of innovative capabilities. Academy of ManagementJournal, 48, 450–463. doi:10.5465/AMJ.2005.17407911
Sun, L.-Y., Aryee, S., & Law, K. S. (2007). High-performance humanresource practices, citizenship behavior, and organizational perfor-mance: A relational perspective. Academy of Management Journal, 50,558–577. doi:10.5465/AMJ.2007.25525821
Szulanski, G. (1996). Exploring internal stickiness: Impediments to thetransfer of best practice within the firm. Strategic Management Journal,17, 27–43. doi:10.2307/2486989
Takeuchi, R., Chen, G., & Lepak, D. P. (2009). Through the looking glassof a social system: Cross level effects of high-performance work systemson employees’ attitudes. Personnel Psychology, 62, 1–29. doi:10.1111/j.1744-6570.2008.01127.x
Tan, J., & Peng, M. W. (2003). Organizational slack and firm performanceduring economic transitions: Two studies from an emerging economy.Strategic Management Journal, 24, 1249–1263. doi:10.1002/smj.351
Taylor, H. C., & Russell, J. T. (1939). The relationship of validity coeffi-cients to the practical effectiveness of tests in selection: Discussion and
tables. Journal of Applied Psychology, 23, 565–578. doi:10.1037/h0057079
Teece, D. J., Pisano, G., & Shuen, A. (1997). Dynamic capabilities andstrategic management. Strategic Management Journal, 18, 509–533.doi:10.1002/(SICI)1097-0266(199708)18:7�509::AID-SMJ882�3.0.CO;2-Z
Tesluk, P. E., & Jacobs, R. R. (1998). Toward an integrated model of workexperience. Personnel Psychology, 51, 321–355. doi:10.1111/j.1744-6570.1998.tb00728.x
Tewari, R. (2010). HR and recession: A challenge among HR profession-als. Global Management Review, 4, 68–72.
Tharenou, P., Saks, A. M., & Moore, C. (2007). A review and critique ofresearch on training and organizational-level outcomes. Human ResourceManagement Review, 17, 251–273. doi:10.1016/j.hrmr.2007.07.004
Tung, R. L., Paik, Y., & Bae, J. (2013). Korean human resource manage-ment in the global context. International Journal of Human ResourceManagement, 24, 905–921. doi:10.1080/09585192.2012.755818
Tvede, L. (1997). Business cycles: From john law to chaos theory. London,England: Routledge Publishing.
Van Iddekinge, C. H., Ferris, G. R., Perrewé, P. L., Perryman, A. A., Blass,F. R., & Heetderks, T. D. (2009). Effects of selection and training onunit-level performance over time: A latent growth modeling approach.Journal of Applied Psychology, 94, 829–843. doi:10.1037/a0014453
Wanous, J. P., Reichers, A. E., & Hudy, M. J. (1997). Overall jobsatisfaction: How good are single-item measures? Journal of AppliedPsychology, 82, 247–252. doi:10.1037/0021-9010.82.2.247
Way, S. A., Tracey, J. B., Fay, C. H., Wright, P. M., Snell, S. A., Chang,S., & Gong, Y. (2012). Validation of a multidimensional HR flexibilitymeasure. Journal of Management. Advance online publication. doi:10.1177/0149206312463940
White, R. E., & Hamermesh, R. G. (1981). Toward a model of businessunit performance: An integrative approach. Academy of ManagementReview, 6, 213–223. doi:10.5465/AMR.1981.4287787
Wright, P. M., Gardner, T. M., Moynihan, L. M., & Allen, M. R. (2005).The relationship between HR practices and firm performance: Examin-ing causal order. Personnel Psychology, 58, 409–446. doi:10.1111/j.1744-6570.2005.00487.x
Wright, P. M., Gardner, T. M., Moynihan, L. M., Park, H. J., Gerhart, B.,& Delery, J. E. (2001). Measurement error in research on humanresources and firm performance: Additional data and suggestions forfuture research. Personnel Psychology, 54, 875–901. doi:10.1111/j.1744-6570.2001.tb00235.x
Wright, P. M., & Haggerty, J. J. (2005). Missing variables in theories ofstrategic human resource management: Time, cause and individuals(Working Paper Series 05–03). CAHRS, Cornell University.
Wright, P. M., McMahan, G. C., & McWilliams, A. (1994). Humanresources and sustained competitive advantage: A resource-based per-spective. International Journal of Human Resource Management, 5,301–326. doi:10.1080/09585199400000020
Wright, P. M., & Snell, S. A. (1998). Toward a unifying framework for explor-ing fit and flexibility in strategic human resource management. Academy ofManagement Review, 23, 756–772. doi:10.5465/AMR.1998.1255637
Youndt, M. A., Snell, S. A., Dean, J. W., & Lepak, D. P. (1996). Humanresource management, manufacturing strategy, and firm performance.Academy of Management Journal, 39, 836–866. doi:10.2307/256714
Zarnowitz, V. (1999). Theory and history behind business cycles: Are the1990s the onset of a golden age? Journal of Economic Perspectives, 13,69–90. doi:10.1257/jep.13.2.69
382 KIM AND PLOYHART

Appendix A
Appendix B
Table A1Longitudinal Trends for Selective Staffing and Internal Training
Variable
Model A1–1 Selective staffingModel A1–2
Internal training
� SE � SE
Intercept .77� .01 1.43� .16Change predictors
TIME .02� .01 .03 .09Variance components
Intercept .02� .00 4.06� .71TIME Did not converge Did not converge .87� .16�2 log likelihood �280.00 4,992.80Akaike’s information criterion �276.00 4,998.80
Note. TIME � prerecession.� p � .05.
Table B1Results of Staffing, Training, and Turnover on Labor Productivity
Variable
Model B1–1 Model B1–2 Model B1–3
� SE � SE � SE
Intercept 26,440.00 9,507.35 23,640.00 8,323.42 25,790.00 10,316.00Firm-level control
Firm size (04–07) 13,389.00� 3,251.35 11,869.00� 3,355.88 8,987.65� 3,280.68Predictors
Turnover (04) �10,037.00� 3,302.01 �13,583.00� 4,301.85 �14,196.00� 3,747.30Staffing (04) 4,867.23 3,496.91Training (04) 15,362.00� 3,814.39
InteractionsStaffing (04) � Turnover (04) �5,202.50� 2,585.65Training (04) � Turnover (04) �23,723.00� 5,862.51
Variance componentIntercept 2.13 � 108 3.22 � 108 1.46 � 108 2.67 � 108 2.59 � 108 3.66 � 108
�2 log likelihood 8,565.60 8,210.30 7,910.90Akaike’s information criterion 8,569.60 8,214.30 7,914.90
Note. The dependent variable is average firm productivity for the years 2004 to 2007 (04–07).� p � .05.
(Appendices continue)
383STAFFING, TRAINING, AND FIRM PERFORMANCE
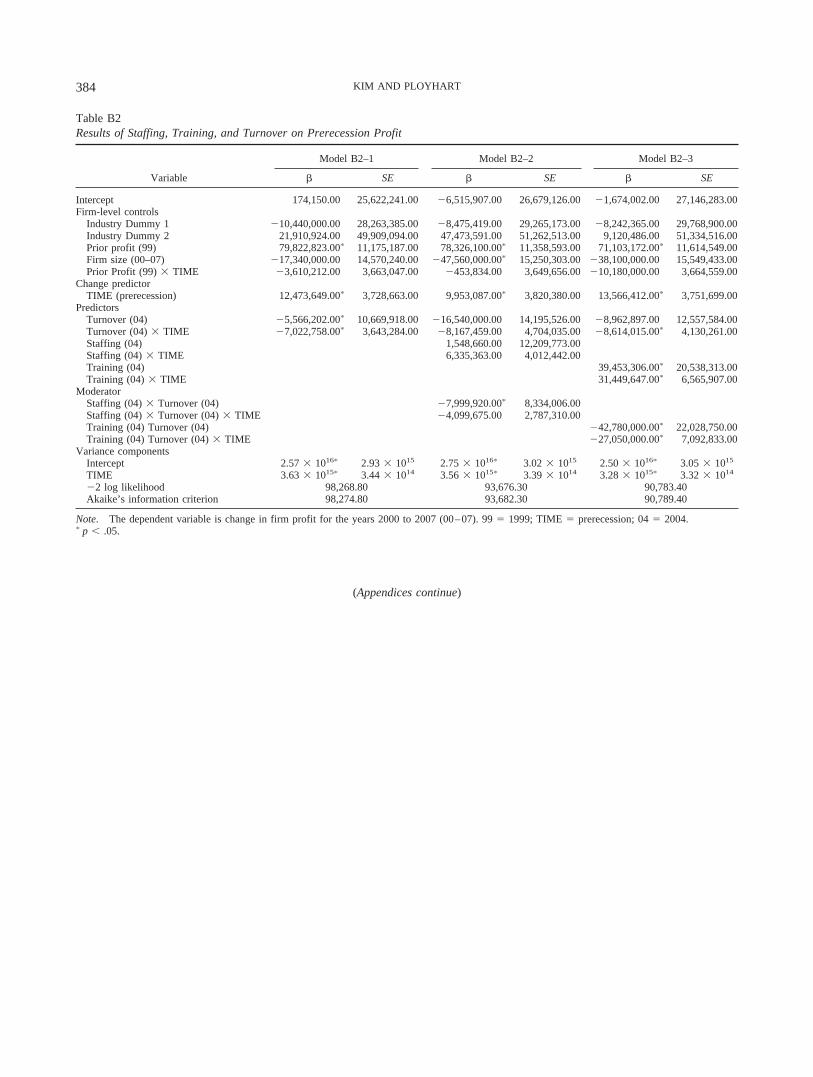
Table B2Results of Staffing, Training, and Turnover on Prerecession Profit
Variable
Model B2–1 Model B2–2 Model B2–3
� SE � SE � SE
Intercept 174,150.00 25,622,241.00 �6,515,907.00 26,679,126.00 �1,674,002.00 27,146,283.00Firm-level controls
Industry Dummy 1 �10,440,000.00 28,263,385.00 �8,475,419.00 29,265,173.00 �8,242,365.00 29,768,900.00Industry Dummy 2 21,910,924.00 49,909,094.00 47,473,591.00 51,262,513.00 9,120,486.00 51,334,516.00Prior profit (99) 79,822,823.00� 11,175,187.00 78,326,100.00� 11,358,593.00 71,103,172.00� 11,614,549.00Firm size (00–07) �17,340,000.00 14,570,240.00 �47,560,000.00� 15,250,303.00 �38,100,000.00 15,549,433.00Prior Profit (99) � TIME �3,610,212.00 3,663,047.00 �453,834.00 3,649,656.00 �10,180,000.00 3,664,559.00
Change predictorTIME (prerecession) 12,473,649.00� 3,728,663.00 9,953,087.00� 3,820,380.00 13,566,412.00� 3,751,699.00
PredictorsTurnover (04) �5,566,202.00� 10,669,918.00 �16,540,000.00 14,195,526.00 �8,962,897.00 12,557,584.00Turnover (04) � TIME �7,022,758.00� 3,643,284.00 �8,167,459.00 4,704,035.00 �8,614,015.00� 4,130,261.00Staffing (04) 1,548,660.00 12,209,773.00Staffing (04) � TIME 6,335,363.00 4,012,442.00Training (04) 39,453,306.00� 20,538,313.00Training (04) � TIME 31,449,647.00� 6,565,907.00
ModeratorStaffing (04) � Turnover (04) �7,999,920.00� 8,334,006.00Staffing (04) � Turnover (04) � TIME �4,099,675.00 2,787,310.00Training (04) Turnover (04) �42,780,000.00� 22,028,750.00Training (04) Turnover (04) � TIME �27,050,000.00� 7,092,833.00
Variance componentsIntercept 2.57 � 1016� 2.93 � 1015 2.75 � 1016� 3.02 � 1015 2.50 � 1016� 3.05 � 1015
TIME 3.63 � 1015� 3.44 � 1014 3.56 � 1015� 3.39 � 1014 3.28 � 1015� 3.32 � 1014
�2 log likelihood 98,268.80 93,676.30 90,783.40Akaike’s information criterion 98,274.80 93,682.30 90,789.40
Note. The dependent variable is change in firm profit for the years 2000 to 2007 (00–07). 99 � 1999; TIME � prerecession; 04 � 2004.� p � .05.
(Appendices continue)
384 KIM AND PLOYHART
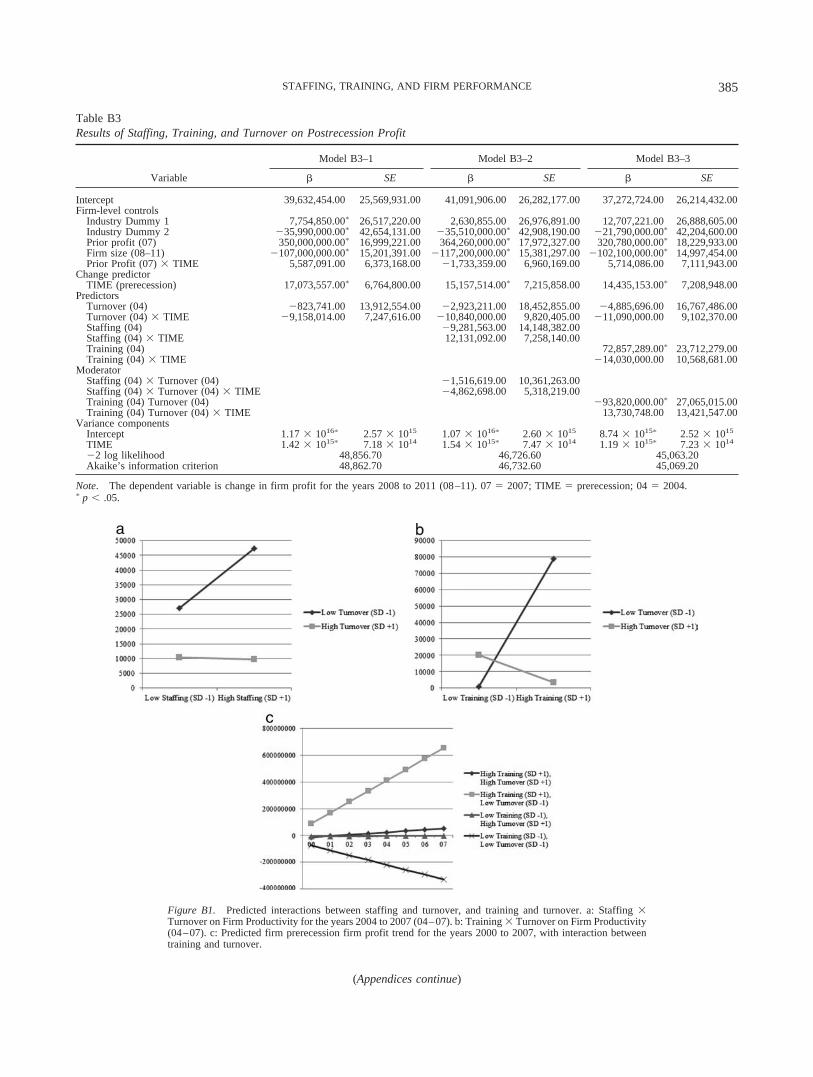
Figure B1. Predicted interactions between staffing and turnover, and training and turnover. a: Staffing �Turnover on Firm Productivity for the years 2004 to 2007 (04–07). b: Training � Turnover on Firm Productivity(04–07). c: Predicted firm prerecession firm profit trend for the years 2000 to 2007, with interaction betweentraining and turnover.
(Appendices continue)
Table B3Results of Staffing, Training, and Turnover on Postrecession Profit
Variable
Model B3–1 Model B3–2 Model B3–3
� SE � SE � SE
Intercept 39,632,454.00 25,569,931.00 41,091,906.00 26,282,177.00 37,272,724.00 26,214,432.00Firm-level controls
Industry Dummy 1 7,754,850.00� 26,517,220.00 2,630,855.00 26,976,891.00 12,707,221.00 26,888,605.00Industry Dummy 2 �35,990,000.00� 42,654,131.00 �35,510,000.00� 42,908,190.00 �21,790,000.00� 42,204,600.00Prior profit (07) 350,000,000.00� 16,999,221.00 364,260,000.00� 17,972,327.00 320,780,000.00� 18,229,933.00Firm size (08–11) �107,000,000.00� 15,201,391.00 �117,200,000.00� 15,381,297.00 �102,100,000.00� 14,997,454.00Prior Profit (07) � TIME 5,587,091.00 6,373,168.00 �1,733,359.00 6,960,169.00 5,714,086.00 7,111,943.00
Change predictorTIME (prerecession) 17,073,557.00� 6,764,800.00 15,157,514.00� 7,215,858.00 14,435,153.00� 7,208,948.00
PredictorsTurnover (04) �823,741.00 13,912,554.00 �2,923,211.00 18,452,855.00 �4,885,696.00 16,767,486.00Turnover (04) � TIME �9,158,014.00 7,247,616.00 �10,840,000.00 9,820,405.00 �11,090,000.00 9,102,370.00Staffing (04) �9,281,563.00 14,148,382.00Staffing (04) � TIME 12,131,092.00 7,258,140.00Training (04) 72,857,289.00� 23,712,279.00Training (04) � TIME �14,030,000.00 10,568,681.00
ModeratorStaffing (04) � Turnover (04) �1,516,619.00 10,361,263.00Staffing (04) � Turnover (04) � TIME �4,862,698.00 5,318,219.00Training (04) Turnover (04) �93,820,000.00� 27,065,015.00Training (04) Turnover (04) � TIME 13,730,748.00 13,421,547.00
Variance componentsIntercept 1.17 � 1016� 2.57 � 1015 1.07 � 1016� 2.60 � 1015 8.74 � 1015� 2.52 � 1015
TIME 1.42 � 1015� 7.18 � 1014 1.54 � 1015� 7.47 � 1014 1.19 � 1015� 7.23 � 1014
�2 log likelihood 48,856.70 46,726.60 45,063.20Akaike’s information criterion 48,862.70 46,732.60 45,069.20
Note. The dependent variable is change in firm profit for the years 2008 to 2011 (08–11). 07 � 2007; TIME � prerecession; 04 � 2004.� p � .05.
385STAFFING, TRAINING, AND FIRM PERFORMANCE

Appendix C
Table C1Longitudinal Random Coefficient Growth Models (Prerecession)
Variable
Model C1–1 Model C1–2 Model C1–3 Model C1–4
� SE � SE � SE � SE
Intercept �11,950,000.00 27,970,468.00 �15,400,000.00 29,062,753.00 �10,230,000.00 30,072,736.00 �12,760,000.00 31,055,777.00Firm-level controls
Industry Dummy 1 �9,002,412.00 30,902,855.00 �8,596,828.00 32,082,149.00 �11,430,000.00 33,064,717.00 �11,760,000.00 34,186,316.00Industry Dummy 2 28,110,243.00 52,407,166.00 48,445,971.00 53,927,317.00 4,871,220.00 55,187,387.00 20,343,345.00 56,707,159.00Prior profit (99) 87,639,184.00� 12,332,486.00 84,724,623.00� 12,575,310.00 82,903,325.00� 12,857,373.00 78,689,165.00� 13,098,409.00Firm size (00–07) �50,810,000.00� 15,938,572.00 �78,880,000.00� 16,732,258.00 �64,450,000.00 17,122,893.00 �95,130,000.00� 17,895,866.00Prior Profit (99) � TIME �11,410,000.00� 4,085,557.00 �8,193,990.00� 4,119,292.00 �15,320,000.00� 4,105,871.00 �11,830,000.00� 4,185,382.00
Change predictorTIME (prerecession) 14,018,757.00� 4,117,328.00 12,757,996.00� 4,175,088.00 14,789,460.00� 4,248,678.00 13,564,899.00� 4,338,284.00
PredictorsStaffing (04) 2,179,918.00 12,958,736.00 994,933.00 13,803,880.00Staffing (04) � TIME 8,907,849.00� 4,294,673.00 6,887,658.00 4,503,635.00Training (04) 23,291,536.00� 20,494,979.00 34,467,059.00� 20,808,975.00Training (04) � TIME 30,173,179.00� 6,519,055.00 27,432,624.00� 6,588,818.00
MediatorFirm productivity (04–07)Firm Productivity (04–07) � TIME
ModeratorStaffing (04) � Training (04)Staffing (04) � Training (04) � TIME
Variance componentsIntercept 3.07 � 1016� 3.60 � 1015 3.26 � 1016� 3.71 � 1015 3.13 � 1016� 3.89 � 1015 3.33 � 1016� 4.00 � 1015
TIME 4.46 � 1015� 4.25 � 1014 4.45 � 1015� 4.26 � 1014 4.29 � 1015� 4.33 � 1014 4.38 � 1015� 4.43 � 1014
�2 log likelihood 101,290.10 96,818.30 93,536.40 89,743.80Akaike’s information criterion 101,296.10 96,824.30 93,542.40 89,749.80
Note. The dependent variable is change in firm ordinary profit for the years 2000 to 2007 (00–07). 99 � 1999; TIME � prerecession; 04 � 2004.� p � .05.
Table C2Bootstrapping Tests for Mediation
Mediation path
Bootstrapping
Indirect effect 95% CI
Indirect pathsHypotheses 4a & 4b
Staffing (04) ¡ Labor productivity (04–07) ¡ Intercept in prerecession ordinary profit (00–07) 6.43 � 1010 [�1.20 � 1011, 3.01 � 1011]Staffing (04) ¡ Labor productivity (04–07) ¡ Change in prerecession ordinary profit (00–07) 1.71 � 1011� [1.24 � 1010, 3.48 � 1011]Training (04) ¡ Labor productivity (04–07) ¡ Intercept in prerecession ordinary profit (00–07) �8.40 � 109 [�2.25 � 1011, 2.07 � 1011]Training (04) ¡ Labor productivity (04–07) ¡ Change in prerecession ordinary profit (00–07) 1.62 � 1011� [1.16 � 1010, 3.39 � 1011]
Hypotheses 9a & 9bStaffing (04) ¡ Labor productivity (04–07) ¡ Intercept in postrecession ordinary profit (08–11) 6.52 � 1010 [�1.52 � 1011, 3.32 � 1011]Staffing (04) ¡ Labor productivity (04–07) ¡ Change in postrecession ordinary profit (08–11) 2.07 � 1011� [1.34 � 1010, 4.60 � 1011]Training (04) ¡ Labor productivity (04–07) ¡ Intercept in postrecession ordinary profit (08–11) 3.11 � 1010 [�2.03 � 1011, 2.90 � 1011]Training (04) ¡ Labor productivity (04–07) ¡ Change in postrecession ordinary profit (08–11) 2.29 � 1011� [1.31 � 1010, 4.98 � 1011]
Note. Bootstrapping is conducted on the basis of the Monte Carlo method with 20,000 repetitions. CI � confidence interval; 04–07 � 2004 to 2007;00–07 � 2000 to 2007; 08–11 � 2008 to 2011.� p � .05.
(Appendices continue)
386 KIM AND PLOYHART
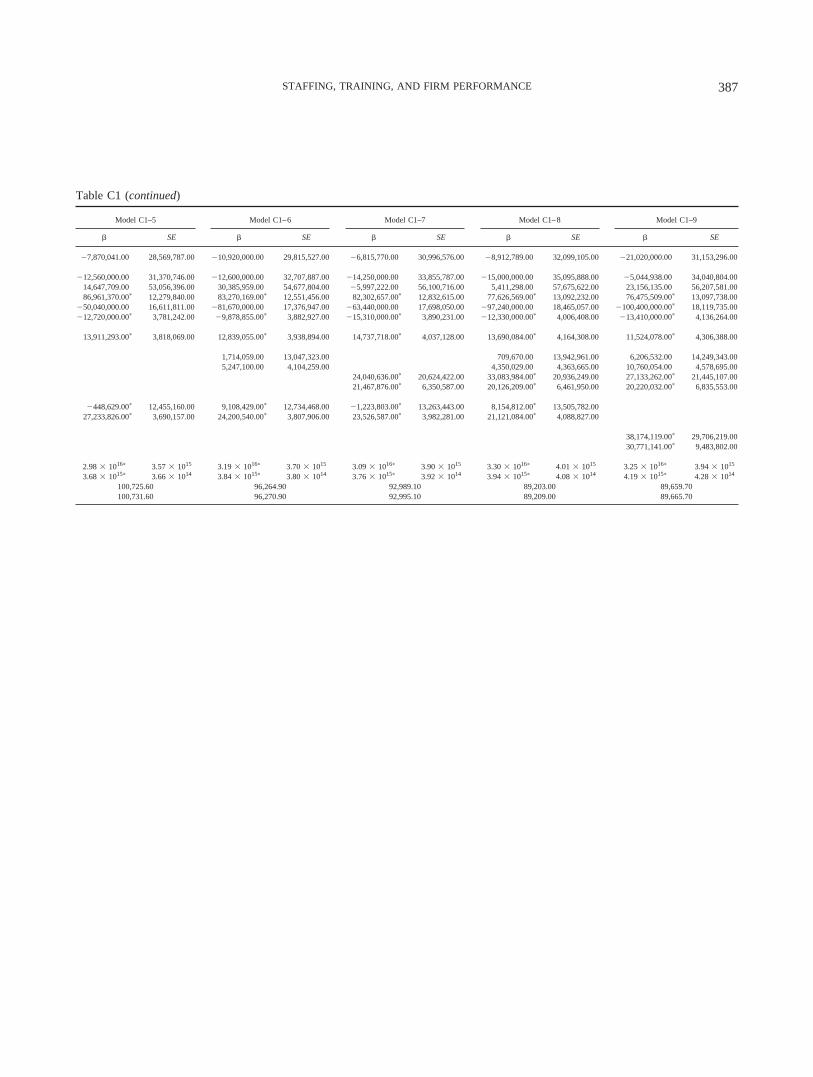
Table C1 (continued)
Model C1–5 Model C1–6 Model C1–7 Model C1–8 Model C1–9
� SE � SE � SE � SE � SE
�7,870,041.00 28,569,787.00 �10,920,000.00 29,815,527.00 �6,815,770.00 30,996,576.00 �8,912,789.00 32,099,105.00 �21,020,000.00 31,153,296.00
�12,560,000.00 31,370,746.00 �12,600,000.00 32,707,887.00 �14,250,000.00 33,855,787.00 �15,000,000.00 35,095,888.00 �5,044,938.00 34,040,804.0014,647,709.00 53,056,396.00 30,385,959.00 54,677,804.00 �5,997,222.00 56,100,716.00 5,411,298.00 57,675,622.00 23,156,135.00 56,207,581.0086,961,370.00� 12,279,840.00 83,270,169.00� 12,551,456.00 82,302,657.00� 12,832,615.00 77,626,569.00� 13,092,232.00 76,475,509.00� 13,097,738.00
�50,040,000.00 16,611,811.00 �81,670,000.00 17,376,947.00 �63,440,000.00 17,698,050.00 �97,240,000.00 18,465,057.00 �100,400,000.00� 18,119,735.00�12,720,000.00� 3,781,242.00 �9,878,855.00� 3,882,927.00 �15,310,000.00� 3,890,231.00 �12,330,000.00� 4,006,408.00 �13,410,000.00� 4,136,264.00
13,911,293.00� 3,818,069.00 12,839,055.00� 3,938,894.00 14,737,718.00� 4,037,128.00 13,690,084.00� 4,164,308.00 11,524,078.00� 4,306,388.00
1,714,059.00 13,047,323.00 709,670.00 13,942,961.00 6,206,532.00 14,249,343.005,247,100.00 4,104,259.00 4,350,029.00 4,363,665.00 10,760,054.00 4,578,695.00
24,040,636.00� 20,624,422.00 33,083,984.00� 20,936,249.00 27,133,262.00� 21,445,107.0021,467,876.00� 6,350,587.00 20,126,209.00� 6,461,950.00 20,220,032.00� 6,835,553.00
�448,629.00� 12,455,160.00 9,108,429.00� 12,734,468.00 �1,223,803.00� 13,263,443.00 8,154,812.00� 13,505,782.0027,233,826.00� 3,690,157.00 24,200,540.00� 3,807,906.00 23,526,587.00� 3,982,281.00 21,121,084.00� 4,088,827.00
38,174,119.00� 29,706,219.0030,771,141.00� 9,483,802.00
2.98 � 1016� 3.57 � 1015 3.19 � 1016� 3.70 � 1015 3.09 � 1016� 3.90 � 1015 3.30 � 1016� 4.01 � 1015 3.25 � 1016� 3.94 � 1015
3.68 � 1015� 3.66 � 1014 3.84 � 1015� 3.80 � 1014 3.76 � 1015� 3.92 � 1014 3.94 � 1015� 4.08 � 1014 4.19 � 1015� 4.28 � 1014
100,725.60 96,264.90 92,989.10 89,203.00 89,659.70100,731.60 96,270.90 92,995.10 89,209.00 89,665.70
387STAFFING, TRAINING, AND FIRM PERFORMANCE

Table C3Longitudinal Random Coefficient Growth Models (Postrecession)
Variable
Model C3–1 Model C3–2 Model C3–3 Model C3–4
� SE � SE � SE � SE
Intercept 38,573,448.00 25,108,176.00 40,240,797.00 25,552,731.00 37,679,272.00 26,036,284.00 39,353,282.00 26,947,278.00Firm-level controls
Industry Dummy 1 8,759,021.00� 26,134,338.00 3,726,634.00 26,528,060.00 12,261,129.00 26,909,290.00 10,696,934.00 27,873,176.00Industry Dummy 2 �17,420,000.00� 41,154,387.00 �15,060,000.00� 41,232,359.00 �21,710,000.00� 41,261,183.00 �23,010,000.00� 42,369,462.00Prior profit (07) 349,020,000.00� 16,899,466.00 364,030,000.00� 17,826,980.00 338,780,000.00� 17,559,208.00 351,820,000.00� 18,983,599.00Firm size (08–11) �106,500,000.00� 15,219,590.00 �117,300,000.00� 15,378,847.00 �108,600,000.00� 15,207,267.00 �111,900,000.00� 15,668,718.00Prior Profit (07) � TIME 6,765,916.00 6,291,536.00 �414,401.00 6,851,810.00 5,566,851.00 6,743,849.00 �2,393,615.00 7,322,483.00
Change predictorTIME (prerecession) 17,622,114.00� 6,664,061.00 17,211,285.00� 6,865,278.00 15,688,398.00� 7,105,056.00 15,013,324.00� 7,282,309.00
PredictorsStaffing (04) �8,295,332.00 13,326,629.00 �10,300,000.00 14,198,064.00Staffing (04) � TIME 13,746,718.00� 6,844,942.00 13,954,548.00� 7,282,351.00Training (04) 58,066,529.00� 20,639,604.00 55,543,927.00� 21,011,709.00Training (04) � TIME �13,130,000.00 9,062,066.00 �12,170,000.00 9,186,436.00
MediatorFirm productivity (04–07)Firm Productivity (04–07) � TIME
ModeratorStaffing (04) � Training (04)Staffing (04) � Training (04) � TIME
Variance componentsIntercept 1.19 � 1016� 2.54 � 1015 1.09 � 1016� 2.56 � 1015 9.79 � 1015� 2.59 � 1015 1.05 � 1016� 2.72 � 1015
TIME 1.52 � 1015� 7.11 � 1014 1.64 � 1015� 7.37 � 1014 1.39 � 1015� 7.39 � 1014 1.39 � 1015� 7.73 � 1014
�2 log likelihood 49,788.80 47,725.40 45,918.40 44,158.40Akaike’s information criterion 49,794.80 47,731.40 45,924.40 44,164.40
Note. The dependent variable is change in firm ordinary profit 2008–2011 (08–11). 07 � 2007; TIME � prerecession; 04–07 � 2004 to 2007.� p � .05.
388 KIM AND PLOYHART
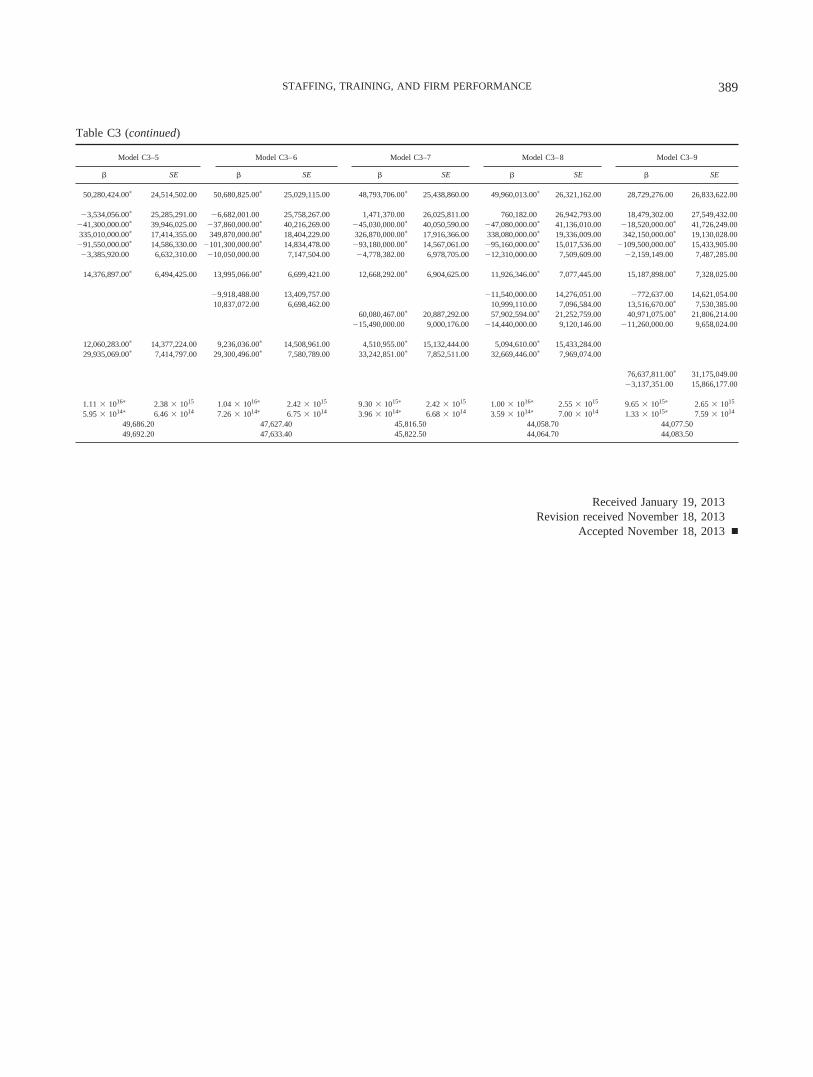
Received January 19, 2013Revision received November 18, 2013
Accepted November 18, 2013 �
Table C3 (continued)
Model C3–5 Model C3–6 Model C3–7 Model C3–8 Model C3–9
� SE � SE � SE � SE � SE
50,280,424.00� 24,514,502.00 50,680,825.00� 25,029,115.00 48,793,706.00� 25,438,860.00 49,960,013.00� 26,321,162.00 28,729,276.00 26,833,622.00
�3,534,056.00� 25,285,291.00 �6,682,001.00 25,758,267.00 1,471,370.00 26,025,811.00 760,182.00 26,942,793.00 18,479,302.00 27,549,432.00�41,300,000.00� 39,946,025.00 �37,860,000.00� 40,216,269.00 �45,030,000.00� 40,050,590.00 �47,080,000.00� 41,136,010.00 �18,520,000.00� 41,726,249.00335,010,000.00� 17,414,355.00 349,870,000.00� 18,404,229.00 326,870,000.00� 17,916,366.00 338,080,000.00� 19,336,009.00 342,150,000.00� 19,130,028.00
�91,550,000.00� 14,586,330.00 �101,300,000.00� 14,834,478.00 �93,180,000.00� 14,567,061.00 �95,160,000.00� 15,017,536.00 �109,500,000.00� 15,433,905.00�3,385,920.00 6,632,310.00 �10,050,000.00 7,147,504.00 �4,778,382.00 6,978,705.00 �12,310,000.00 7,509,609.00 �2,159,149.00 7,487,285.00
14,376,897.00� 6,494,425.00 13,995,066.00� 6,699,421.00 12,668,292.00� 6,904,625.00 11,926,346.00� 7,077,445.00 15,187,898.00� 7,328,025.00
�9,918,488.00 13,409,757.00 �11,540,000.00 14,276,051.00 �772,637.00 14,621,054.0010,837,072.00 6,698,462.00 10,999,110.00 7,096,584.00 13,516,670.00� 7,530,385.00
60,080,467.00� 20,887,292.00 57,902,594.00� 21,252,759.00 40,971,075.00� 21,806,214.00�15,490,000.00 9,000,176.00 �14,440,000.00 9,120,146.00 �11,260,000.00 9,658,024.00
12,060,283.00� 14,377,224.00 9,236,036.00� 14,508,961.00 4,510,955.00� 15,132,444.00 5,094,610.00� 15,433,284.0029,935,069.00� 7,414,797.00 29,300,496.00� 7,580,789.00 33,242,851.00� 7,852,511.00 32,669,446.00� 7,969,074.00
76,637,811.00� 31,175,049.00�3,137,351.00 15,866,177.00
1.11 � 1016� 2.38 � 1015 1.04 � 1016� 2.42 � 1015 9.30 � 1015� 2.42 � 1015 1.00 � 1016� 2.55 � 1015 9.65 � 1015� 2.65 � 1015
5.95 � 1014� 6.46 � 1014 7.26 � 1014� 6.75 � 1014 3.96 � 1014� 6.68 � 1014 3.59 � 1014� 7.00 � 1014 1.33 � 1015� 7.59 � 1014
49,686.20 47,627.40 45,816.50 44,058.70 44,077.5049,692.20 47,633.40 45,822.50 44,064.70 44,083.50
389STAFFING, TRAINING, AND FIRM PERFORMANCE