The effects of shifting vegetation mosaics on habitat suitability for coastal dune fauna—a case...
11
The effects of shifting vegetation mosaics on habitat suitability for coastal dune fauna—a case study on sand lizards (Lacerta agilis) Bart Wouters & Marijn Nijssen & Gertjan Geerling & Hein Van Kleef & Eva Remke & Wilco Verberk Received: 13 May 2011 /Revised: 13 November 2011 /Accepted: 16 November 2011 /Published online: 13 December 2011 # The Author(s) 2011. This article is published with open access at Springerlink.com Abstract Encroachment of tall grasses and shrubs in coastal dunes has resulted in loss of vegetation heteroge- neity. This is expected to have negative effects on animal diversity. To counteract encroachment and develop struc- tural heterogeneity grazing is a widely used management practice. Here, we aim to functionally interpret changes in vegetation composition and configuration following graz- ing management on habitat suitability for sand lizards. Aerial photographs taken over a period of 16 years were used to quantify changes in vegetation composition. A GIS- based method was developed to calculate habitat suitability for sand lizards in a spatially explicit manner, encompass- ing differences in vegetation structure and patch size. From 1987 to 2003 dune vegetation shifted from small patches of moss and sand to larger patches covered by shrubs and grasses. Grazing management did not have any significant effect on the overall level of heterogeneity, measured as habitat suitability for sand lizards. However, on a more local scale highly suitable patches in 1987 were deteriorat- ing whereas unsuitable patches became more suitable in 2003. This inversion results from a broad shift with shrubs being a limiting habitat element in 1987 to sandy patches being the limiting element in 2003. Future changes are believed to negatively impact sand lizards. The habitat suitability model has proven to be a useful tool to functionally interpret changes in coastal dune vegetation heterogeneity from an animal’ s perspective. Further re- search should aim to include multiple species operating on B. Wouters (*) : M. Nijssen : H. Van Kleef : E. Remke : W. Verberk Bargerveen Foundation, P.O. Box 9010, 6500 GL Nijmegen, The Netherlands e-mail: [email protected] M. Nijssen e-mail: [email protected] H. Van Kleef e-mail: [email protected] E. Remke e-mail: [email protected] W. Verberk e-mail: [email protected] G. Geerling Centre for Sustainable Management of Resources, ISIS, Radboud University Nijmegen, toernooiveld 1, 6525 ED Nijmegen, The Netherlands e-mail: [email protected] H. Van Kleef Department of Environmental Science, Institute for Wetland and Water Research, Radboud University Nijmegen, toernooiveld 1, 6525 ED Nijmegen, The Netherlands B. Wouters : M. Nijssen : E. Remke : W. Verberk Department of Animal Ecology and Ecophysiology, Institute for Wetland and Water Research, Radboud University Nijmegen, toernooiveld 1, 6525 ED Nijmegen, The Netherlands Present Address: W. Verberk Marine Biology and Ecology Research Centre, University of Plymouth, Davy Building, Drake Circus, PL4 8AA Plymouth, UK e-mail: [email protected] J Coast Conserv (2012) 16:89–99 DOI 10.1007/s11852-011-0177-9
-
Upload
bart-wouters -
Category
Documents
-
view
212 -
download
0
Transcript of The effects of shifting vegetation mosaics on habitat suitability for coastal dune fauna—a case...

The effects of shifting vegetation mosaics on habitatsuitability for coastal dune fauna—a case study on sandlizards (Lacerta agilis)
Bart Wouters & Marijn Nijssen & Gertjan Geerling &
Hein Van Kleef & Eva Remke & Wilco Verberk
Received: 13 May 2011 /Revised: 13 November 2011 /Accepted: 16 November 2011 /Published online: 13 December 2011# The Author(s) 2011. This article is published with open access at Springerlink.com
Abstract Encroachment of tall grasses and shrubs incoastal dunes has resulted in loss of vegetation heteroge-neity. This is expected to have negative effects on animaldiversity. To counteract encroachment and develop struc-tural heterogeneity grazing is a widely used managementpractice. Here, we aim to functionally interpret changes invegetation composition and configuration following graz-ing management on habitat suitability for sand lizards.Aerial photographs taken over a period of 16 years wereused to quantify changes in vegetation composition. A GIS-based method was developed to calculate habitat suitabilityfor sand lizards in a spatially explicit manner, encompass-ing differences in vegetation structure and patch size. From1987 to 2003 dune vegetation shifted from small patches of
moss and sand to larger patches covered by shrubs andgrasses. Grazing management did not have any significanteffect on the overall level of heterogeneity, measured ashabitat suitability for sand lizards. However, on a morelocal scale highly suitable patches in 1987 were deteriorat-ing whereas unsuitable patches became more suitable in2003. This inversion results from a broad shift with shrubsbeing a limiting habitat element in 1987 to sandy patchesbeing the limiting element in 2003. Future changes arebelieved to negatively impact sand lizards. The habitatsuitability model has proven to be a useful tool tofunctionally interpret changes in coastal dune vegetationheterogeneity from an animal’s perspective. Further re-search should aim to include multiple species operating on
B. Wouters (*) :M. Nijssen :H. Van Kleef : E. Remke :W. VerberkBargerveen Foundation,P.O. Box 9010, 6500 GL Nijmegen, The Netherlandse-mail: [email protected]
M. Nijssene-mail: [email protected]
H. Van Kleefe-mail: [email protected]
E. Remkee-mail: [email protected]
W. Verberke-mail: [email protected]
G. GeerlingCentre for Sustainable Management of Resources, ISIS,Radboud University Nijmegen,toernooiveld 1,6525 ED Nijmegen, The Netherlandse-mail: [email protected]
H. Van KleefDepartment of Environmental Science, Institute for Wetlandand Water Research, Radboud University Nijmegen,toernooiveld 1,6525 ED Nijmegen, The Netherlands
B. Wouters :M. Nijssen : E. Remke :W. VerberkDepartment of Animal Ecology and Ecophysiology, Institutefor Wetland and Water Research, Radboud University Nijmegen,toernooiveld 1,6525 ED Nijmegen, The Netherlands
Present Address:W. VerberkMarine Biology and Ecology Research Centre,University of Plymouth,Davy Building, Drake Circus,PL4 8AA Plymouth, UKe-mail: [email protected]
J Coast Conserv (2012) 16:89–99DOI 10.1007/s11852-011-0177-9

different scale levels to fully capture the natural landscapedynamics.
Keywords Grazing management . Restoration ecology .
Patch size . Heterogeneity . Remote sensing . GIS
Introduction
Dry coastal dune ecosystems are spatially structured,consisting of a fine scaled mosaic of patches whichprovide suitable habitat for many plant and animalspecies (De Bruyn 1997). This spatial heterogeneityarises from the interplay between aeolian dynamics, soildevelopment and vegetation succession and the intensityof each of these processes is governed by elevationdifferences and spatial variation in dune slope exposure(Doing 1995; Ranwell 1972).
Dune ecosystems along the coast of North-westernEurope are threatened by the expansion of tall, highlycompetitive grass and shrub species since the 1950s. Thisresults in dense homogeneous vegetations with a thick litterlayer (Ketner-Oostra and Sýkora 2004; Veer and Kooijman1997). This process of grass and shrub encroachment ismainly caused by increased atmospheric nitrogen deposi-tion (Jones et al. 2004; Kooijman et al. 1998), decreasedintensity of grazing by rabbits after plagues of myxomatoseand RVHD (Rabbit Viral Haemorrhagic Disease; Drees andOlff 2001; Ranwell 1963) and changes in land use practice(loss of marram harvest and agricultural use) (Provoost etal. 2009). The habitat degradation is manifested as adecrease and loss of open sand, early successional stages,small herbaceous plants and lichens, with concomitant lossof variation in microclimatic conditions (Maes and Bonte2006; Stoutjesdijk and Barkman 1992).
Landscape heterogeneity is recognised to be an impor-tant driver for plant and animal diversity (Geerling et al.2006; Huston 1979; Kerr et al. 2001; Verberk et al. 2006;Wiens 1989). Loss of heterogeneity threatens animalspecies that are characteristic for dunes by limiting theirpossibilities for thermoregulation, foraging and breeding(Bonte et al. 2004; Maes and Bonte 2006).
To counteract the effects of encroachment in coastaldune landscapes restoration measures are taken. Grazing isa widely used management practice in coastal dunes(Provoost et al. 2009), because it is relatively cheap andcan be applied on a large scale and in undulating land-scapes. A key priority aim of this type of management isthe restoration and conservation of landscape heterogeneity(Hopkins and Radley 1998). Management by grazing canincrease the spatial heterogeneity of the vegetation in somecases (Adler et al. 2001), but it remains unknown to whatdegree animals profit from such increases. In this study, we
investigate how grazing by cattle and ponies in a Dutchdune area influences the vegetation and how these changesaffect habitat heterogeneity from an animal’s perspective.Basic properties of heterogeneity include habitat diversity(variation in patch identity) and habitat configuration (sizeand distances between patches) (Gusafson 1998; Verberk etal. 2006). Sand lizards Lacerta agilis are considered to begood representatives for coastal dune heterogeneity as theyrequire a habitat with combinations of different patches forthermoregulation, foraging, hiding, hibernation and eggdeposition (Edgar et al. 2010; Glandt 1991; House et al.1980; House and Spellerberg 1983a). Sand lizards areespecially interesting because they have been subject ofintense debate, with many herpetologists voicing concernabout the disturbing effects grazing can have when highstocking densities are applied (Edgar et al. 2010; Offer et al.2003; Stumpel 2004). Finally, the sand lizard is a flagshipspecies for nature management and conservation policy incoastal dunes and is listed in the EU Habitat Directive(Council directive 1992).
When investigating the relation between habitat hetero-geneity and the abundance or diversity of its inhabitants,few studies analyse the influence of combinations of patchtypes in a spatially explicit approach, i.e. by using distanceto other patch types or by using grain size of patches asvariables in correlative analyses (Bonte et al. 2000; Denniset al. 2002). As a measure of heterogeneity previous studieshave used e.g., the availability or evenness of discretestructural elements (Tews et al. 2004), single vegetationvariables (Pöyry et al. 2006; WallisDeVries and Raemakers2001) or employed different classes of heterogeneity basedon one or more vegetation variables (Gibson et al. 1992). Inthis study we focussed on the patch dynamics resultingfrom shifting vegetation mosaics in Dutch coastal dunesfrom a sand lizard’s perspective. To this end we developeda spatially explicit GIS model to assess habitat suitabilityfor the sand lizard. To functionally interpret changes in drycoastal dune heterogeneity for fauna, we (a) investigatechanges in vegetation heterogeneity in grazed and ungrazedplots over a 16 year period, (b) determine the impact ofthese vegetation changes on habitat suitability for sandlizards, and (c) test whether this is reflected in the numberof encountered sand lizards.
Materials and methods
Study site
The study area is located in the inner dunes near Castricum(Fig. 1), in the western part of the Netherlands (52º34′34 N;4º38′41 E). In this area six plots were selected, three grazedand three ungrazed. The grazed area (56.7 ha) has an
90 B. Wouters et al.

average grazing intensity of 0.17 Large Livestock Units(LLU)·ha−1·year−1. Open range grazing was introduced in1999 and is done by ponies (year round) and cattle (June toMarch). It is known that ponies and cattle have a strong dietpreference for graminoid species (Lamoot et al. 2005). Thechoice of plots, which was made on basis of visual effects ofgrazing in the field, coincides with this preference (Fig. 1).Effectively this diet preference also means that grazingintensity throughout the year likely exceeds the abovementioned grazing intensity. Both grazed and ungrazed plotswere similar in size (0.5 ha) and geomorphology, and had nomanagement differences up to 1999. All distinguishedvegetation structure classes (Table 1) were present in the plots.
Vegetation cover maps
For the analyses, high resolution aerial photographs were usedfrom three years (Table 2): before RVHD extinction of rabbits
and massive expansion of grasses and shrubs (1987), afterrabbit extinction and grass/shrub expansion, but beforegrazing management (1995) and after four years of grazingmanagement (2003). Aerial photographs from different yearswere all taken in the beginning of summer, between the endof May and the beginning of July. Differences in vegetationcover due to seasonality are therefore not to be expected. The1987 and 1995 photographs were scanned and geo-referencedto the already geo-referenced 2003 photos. Ten vegetationstructures could be distinguished: sand, sand with algae, sandwith mosses and grasses, mosses, grass, dense grass, tussocks,Salix repens, Hippophae rhamnoides and shrub/trees.
ArcGIS, Erdas Imagine 8.x. and Definiens professional 5were used to prepare images and to produce the vegetationcover maps (Definiens 2006; ESRI 2004; Leica-Geosystems2004). Images were segmented into polygons using imagetexture such as differences in colour or shape and compact-ness or smoothness (Definiens 2006; Geerling et al. 2009).
Fig. 1 Map of the Netherlands showing its location within Europe(left). Within the map of the Netherlands the location of the study areanear Castricum is shown (middle). On the right an aerial photographof the study site in the inner dunes near Castricum is shown. The
grazed area (56.7 ha) is indicated with a dashed line around it andgrazed study plots are indicated with black stars and ungrazed plotswith white stars
Table 1 Sand lizard habitat suit-ability score for coverage ofstructural vegetation classeswithin home ranges of sandlizard, classified as optimal con-figuration (3 points), suboptimalconfiguration (1 point), unsuitableconfiguration (0 points)
Suitability score 0 1 3 1 0
Structure class
Sand & sand with algae 0–5% 5–20% 20–40% >40%
Sand with mosses and grasses & mosses 0–5% 5–25% 25–40% >40%
Grass & dense grass & tussocks 0–15% 15–35% 35–50% >50%
Salix repens & Hippophae rhamnoides 0–20% 20–35% 35–55% 55–70% >70%
Shrub/trees 0–5% 5–15% >15%
Effects of shifting vegetation mosaics on sand lizards 91

After segmentation the maps were classified and a stereo-scope (type Wild) was used to verify the polygon outlinesand interpret the vegetation structure. Fragstats 3.3 was usedto calculate patch size and type (McGarigal and Marks1995). Patches were divided into 11 size classes (<0.5 m2,0.5 to 1.5 m2, 1.5 to 3.5 m2, 3.5 to 7.5 m2, 7.5 to 15.5 m2,15.5 to 31.5 m2, 31.5 to 63.5 m2, 63.5 to 127.5 m2, 127.5 to255.5 m2, 255.5 to 511.5 m2, >511 m2).
Spatially explicit analysis of habitat suitability for sandlizards
To quantify habitat suitability for sand lizards and temporalchanges therein, vegetation cover maps were related to thehabitat use of the sand lizard. The initially identified tenvegetation structure classes were aggregated to fivevegetation structure classes (Table 1), which have previ-ously been shown to be important habitat elements for sandlizards (House and Spellerberg 1983a; b). The differentstructure classes were divided on basis of the height of thevegetation (Cooke 1991). Because there were no plantshigher than one meter in the class of Salix repens &Hippophae rhamnoides at the studied plots, these shrubswere kept separate from the shrub/trees class which were allhigher than one meter. Note that at different sites anddifferent geographical regions the division between theseclasses can be different.
A GIS based method was developed to analyse thelandscape from a sand lizard’s perspective. The model, whichuses a moving window analysis, calculated for each GIS rastercell (pixel) the relative coverage of each structure class withina circle with radius of 5.6 m. This translates to an area of100 m2, fully covering a sand lizard’s daily home range (VanLeeuwen and Van de Hoef 1976). Optimal and suboptimalhabitat configurations reported by House and Spellerberg(1983a, b), Cooke (1991) and Glandt (1991) were used toscore suitability for each structural class coverage (Table 1).Optimal and suboptimal coverage were awarded 3 points and1 point respectively. Too low or too high coverage of anyone structural class was deemed unsuitable and awarded nopoints. As five structure classes were used, habitat suitabilityscore ranged from 0 (unsuitable) to 15 (optimal). The
resulting maps show within-plot spatial variation in habitatsuitability and allow evaluation of changes in overall plotscores as well as within-plot spatial shifts through time.
Number of encountered sand lizards
Sand lizard abundance was studied from April toSeptember 2005. The six plots were censused 9 to 13times under similar weather and daytime conditions.Visual encounter surveys were done by two peoplesystematically scanning the total plot from one side tothe other. The number of encounters and the time spentin a plot were recorded. It was also attempted to catcheach encountered lizard. Caught lizards were photo-graphed for individual recognition (Märtens and Grosse1996) in order to estimate population size. Unfortunatelynot enough lizards were caught to give a reliableestimation for population size (data not shown). Thereforewe only report the number of encountered lizards per man-hour per hectare. Although the time spent in each plotduring one round was variable depending on the numberof encountered lizards, total census effort was comparablebetween the grazed part (107 h) and ungrazed part (114 h).
Data analysis
To detect the major changes in both vegetation type andpatch size, a Principal Component Analysis (PCA) wasperformed in Canoco for Windows version 4.0 (Ter Braakand Šmilauer 1998) on the ten vegetation classes sub-divided in eleven size classes (110 species) for each plot ineach year (total eighteen sites). Preliminary data analysis inCanoco indicated a short gradient length, making PCA themost appropriate ordination technique.
To test for effects of vegetation succession over the years(1987, 1995 and 2003) and management (grazing and nograzing) on habitat suitability for sand lizards, we performed arepeated measures analysis (Anova with Greenhouse-Geissercorrection) on the average suitability scores. A t-test was usedto test for differences in sand lizard numbers between grazedand ungrazed plots.
To illustrate how different vegetation structure classescontributed differently over the three years to the totalhabitat suitability score, we compared the two mostdisparate structure classes (“S. repens and H. rhamnoides”and “sand”). For this comparison we calculated the numberof pixels making up each habitat suitability score (scoresattributed to habitat suitability are derived from Table 1),and the number was then expressed as a percentagecoverage (correcting for difference in pixel size between1987 and 2003 and for differences in total area betweenplots). Differences in this percentage coverage were testedwith Mann–Whitney tests for each habitat suitability score.
Table 2 Aerial photograph type, photographic scale and pixel size.The pixel size of the analogue aerial imagery is based on the digitalscan taken from this image
1987 1995 2003
Type False colour,analogue
False colour,analogue
False colour,digital
Scale 1:5000 1:2500 1:2500
Pixel size 0.0625 m2 0.0625 m2 0.0256 m2
92 B. Wouters et al.

Results
Changes in vegetation heterogeneity
Patch size and ecotope type distribution differed betweengrazed and ungrazed plots in 1987, 1995 and 2003 (Figs. 2and 3). Both grazed and ungrazed plots exhibited a changein configuration from small (1–4) sand and moss dominatedpatches in 1987 to larger (6–8) grass and shrub dominatedpatches in 2003 (Fig. 2). From 1987 to 2003 the grazed andungrazed plots exhibited similar changes in class cover;shrub classes (H. rhamnoides; S. repens and other shrubsand trees) and dense grasses increased, whereas moss andsand classes (sand; sand with algae and sand with mossesand grasses) decreased. For the ungrazed plots, mostpronounced changes occurred after 1995, which coincidewith an increase in woody classes (Salix repens, Hippophaerhamnoides and shrub/trees) and patch size. In the grazedplots this shift had already occurred between 1987 and1995 before grazing was introduced.
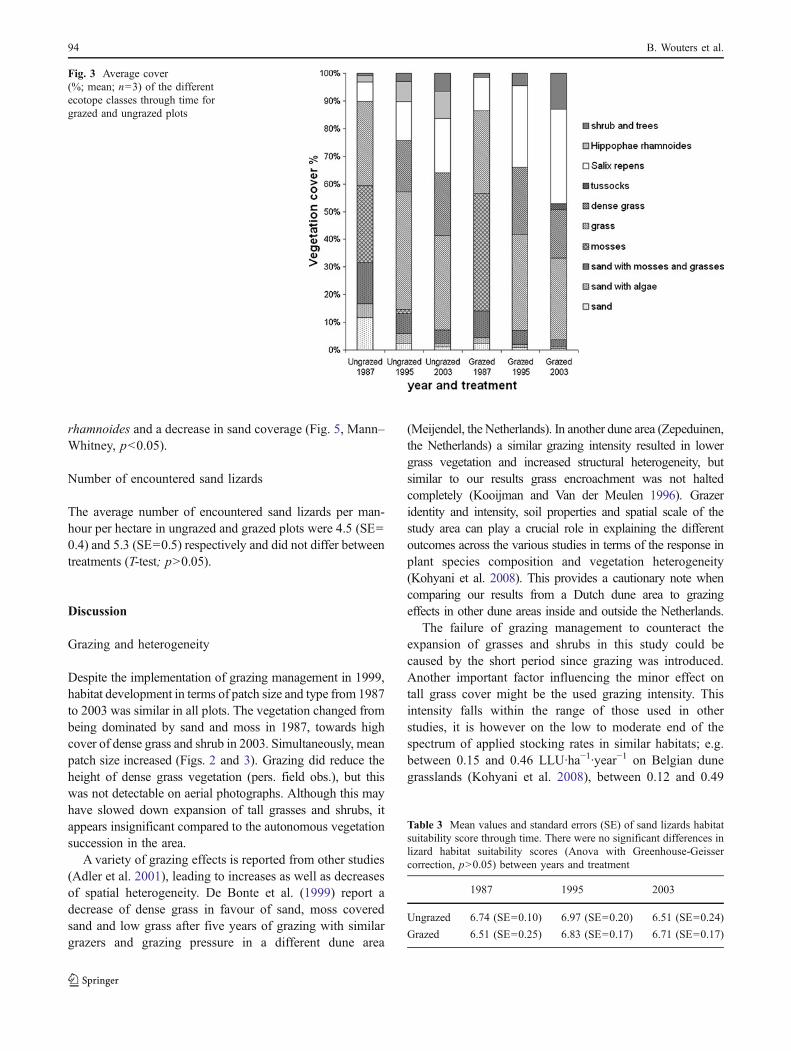
The average cover of the different vegetation structureclasses was calculated (Fig. 3), plots of the same year andtreatment were grouped because of high similarities (Fig. 2).In both treatments a 30–40% moss cover disappeared
between 1987 and 2003, sand dominated patches decreasedby approximately 60% and a 40% cover of grasses andwoody species in 1987 increased to more than 90% in 2003.Small differences between treatments included a highercover for the different classes of sand (sand; sand with algaeand sand with mosses and grasses) and a lower moss coverin the ungrazed plots of 1987. In addition, stands of H.rhamnoides occurred only in the ungrazed plots.
Sand lizard habitat suitability
Whole plot average values for sand lizard habitat suitabilityscores did not differ between years and treatments (Table 3,Anova with Greenhouse-Geisser correction, p>0.05). Incontrast, on a smaller scale (within plots), large spatialshifts in habitat suitability occurred during the researchperiod (Fig. 4). The occurrence of these large within-plotspatial changes without the co-occurrence of an overallchange between year and treatment result from a spatialinversion of how suitable patches are distributed in the plot(Fig. 4): low quality patches became more suitable, whilstpatches of intermediate and high quality became lesssuitable over time (Table 4). These shifts in habitatsuitability correspond with an increase of S. repens and H.
Fig. 2 Principal componentanalysis of patch size and ecotopeclass distribution through time.The figure shows changes andtheir explaining factors from 1987(white) via 1995 (grey) to 2003(black) from the three grazed(rounds) and three ungrazed(triangles) plots. Numbers(1 – 11) represent size classesgoing from 1 (<1 m2) to 11(>511.5 m2) and are explainedin the text
Effects of shifting vegetation mosaics on sand lizards 93
rhamnoides and a decrease in sand coverage (Fig. 5, Mann–Whitney, p<0.05).
Number of encountered sand lizards
The average number of encountered sand lizards per man-hour per hectare in ungrazed and grazed plots were 4.5 (SE=0.4) and 5.3 (SE=0.5) respectively and did not differ betweentreatments (T-test; p>0.05).
Discussion
Grazing and heterogeneity
Despite the implementation of grazing management in 1999,habitat development in terms of patch size and type from 1987to 2003 was similar in all plots. The vegetation changed frombeing dominated by sand and moss in 1987, towards highcover of dense grass and shrub in 2003. Simultaneously, meanpatch size increased (Figs. 2 and 3). Grazing did reduce theheight of dense grass vegetation (pers. field obs.), but thiswas not detectable on aerial photographs. Although this mayhave slowed down expansion of tall grasses and shrubs, itappears insignificant compared to the autonomous vegetationsuccession in the area.
A variety of grazing effects is reported from other studies(Adler et al. 2001), leading to increases as well as decreasesof spatial heterogeneity. De Bonte et al. (1999) report adecrease of dense grass in favour of sand, moss coveredsand and low grass after five years of grazing with similargrazers and grazing pressure in a different dune area
(Meijendel, the Netherlands). In another dune area (Zepeduinen,the Netherlands) a similar grazing intensity resulted in lowergrass vegetation and increased structural heterogeneity, butsimilar to our results grass encroachment was not haltedcompletely (Kooijman and Van der Meulen 1996). Grazeridentity and intensity, soil properties and spatial scale of thestudy area can play a crucial role in explaining the differentoutcomes across the various studies in terms of the response inplant species composition and vegetation heterogeneity(Kohyani et al. 2008). This provides a cautionary note whencomparing our results from a Dutch dune area to grazingeffects in other dune areas inside and outside the Netherlands.
The failure of grazing management to counteract theexpansion of grasses and shrubs in this study could becaused by the short period since grazing was introduced.Another important factor influencing the minor effect ontall grass cover might be the used grazing intensity. Thisintensity falls within the range of those used in otherstudies, it is however on the low to moderate end of thespectrum of applied stocking rates in similar habitats; e.g.between 0.15 and 0.46 LLU·ha−1·year−1 on Belgian dunegrasslands (Kohyani et al. 2008), between 0.12 and 0.49
Fig. 3 Average cover(%; mean; n=3) of the differentecotope classes through time forgrazed and ungrazed plots
Table 3 Mean values and standard errors (SE) of sand lizards habitatsuitability score through time. There were no significant differences inlizard habitat suitability scores (Anova with Greenhouse-Geissercorrection, p>0.05) between years and treatment
1987 1995 2003
Ungrazed 6.74 (SE=0.10) 6.97 (SE=0.20) 6.51 (SE=0.24)
Grazed 6.51 (SE=0.25) 6.83 (SE=0.17) 6.71 (SE=0.17)
94 B. Wouters et al.

LLU·ha−1·year−1 on sand dune vegetation communities inthe UK (FitzGibbon et al. 2005) and between 0.1 and 0.25LLU·ha−1·year−1 on lowlands heathland in the UK (Symesand Day 2003). Other likely explanations are the combinedeffects of high levels of airborne nitrogen deposition and avery low natural grazing regime by rabbits, whose
populations have decreased in numbers up to 90% betweensuccessive study years (1990–2003) in the whole of theNetherlands (Drees et al. 2009). Since changes in vegeta-tion heterogeneity were most apparent when comparingplots over time, rather than comparing between grazed andungrazed plots, we will focus the discussion on the effects
Fig. 4 A selection of plot cover maps (left) accompanied by theirhabitat suitability maps (right). Habitat suitability scores vary between1 and 15, 1 representing unsuitable spots and 15 very suitable spots.
Due to the window of 5.6 m radius (representing a lizard’s homerange) used in the habitat suitability analysis, the suitability maps are5.6 m smaller on the side to prevent inclusion of no-data points
Table 4 Total habitat suitability class change from 1987 to 2003 (%;means; n=6). Total suitability scores are divided into three classes:11–15 (++), 6–10 (+) and 1–5 (−). To facilitate interpretation, greyarea represent no change, black represent a negative change and white
represent a positive change in suitability class. For instance, out of allthe poor (−) habitat patches, which constituted about a third (34.7%)of the total area in 1987, some remained poor (37%), most improved(60%), while a tiny fraction (3%) became very good (++)
1987-
(34.7 % of total area)
1987 +
(63.3 % of total area)
1987 ++
(1.98 % of total area)
2003 - 37% 31% 31%
2003 + 60% 63% 65%
2003 ++ 3% 6% 4%
Effects of shifting vegetation mosaics on sand lizards 95

of autonomous vegetation succession in relation to habitatsuitability of sand lizards.
Sand lizard habitat quality
Sand lizards require a structurally complex habitat withcombinations of different patches for thermoregulation,foraging, hiding, hibernation and egg deposition (Edgar etal. 2010; House and Spellerberg 1983a; b) and theirnumbers have been shown to decline when heterogeneitydecreases (De Bruyn 1997; Jackson 1979). Despite pro-nounced within-plot spatial changes in heterogeneity(Fig. 4), average habitat suitability per plot neither changedin time, nor differed between grazed and ungrazed plots. Inaddition, field surveys in 2005 confirm the absence ofdifferences in habitat suitability, showing no differences in
sand lizard encounters between grazed and ungrazed plots.The absence of differences in sand lizard numbers whenhabitat suitability is comparable would also suggest there isnot a strong, direct impact of the current grazing intensity(0.17 LLU ha−1 year−1) on sand lizards. This agrees withthe findings of Edgar et al. (2010), who suggest that greatnegative effects on sand lizards were not to be expectedbecause stocking rates were below 0.2 LLU ha−1 year−1,which is seen as a stocking rate from where negative effectsare expected. The absence of differences in sand lizardnumbers would seem to question the validity of the sandlizard as an indicator species for heterogeneity. However, incontrast to the stability of habitat suitability scores averagedover entire plots, pronounced changes of within-plot spatialdifferences in habitat suitability scores were observed. Sandlizards may thus be valid indicator species on smaller
Fig. 5 The number ofpixels contributing to eachhabitat suitability score (scoresattributed to habitat suitabilityare derived from Table 1),expressed as average% cover(means±standard error; n=6).The two most disparate structureclasses are shown: S. repens andH. rhamnoides (woody vegeta-tion, a) and sand (no vegetation,b). Years are shown separately1987 (grey), 1995 (black) and2003 (white). Asterisks showsignificant differences acrossyears for a given class(Mann–Whitney, p<0.05)
96 B. Wouters et al.
spatial scales. Spatial changes in habitat suitability partlyresembled an inversion, with highly suitable locationsdeteriorating and unsuitable locations becoming moresuitable through the years. This deviates from the morecommonly observed pattern of habitat change, where themost suitable locations also remain suitable for the longesttime, providing refugia in the face of habitat deterioration.
One could argue that the change of suitable location intounsuitable locations and vice versa is characteristic fordynamic dry coastal dunes and that despite shiftingvegetation mosaics a status quo is preserved of suitablepatches being present somewhere in the landscape. How-ever, the relative contribution of the different structureclasses to the sand lizard habitat suitability showed strongdirectional changes. In 1987 habitat suitability was con-strained by the low cover of shrub (Salix repens orHippophae rhamnoides), while patches of open sand andlow vegetation were too large. With a strong increase ofshrubs together with a decrease in open sand and mosses,limitation of necessary structural elements hardly occurredin 2003, but instead habitat suitability was limited by lowcoverage of open sand. With ongoing succession andunchanged management, sand lizard habitat suitability isexpected to decrease due to a further loss of open sand andpioneer vegetation, as well as an increase of coverage of tallgrass, shrubs and trees. Three problems can be implicated.First, sand lizards require at least 1–1,5 m2 of open sand perhectare for oviposition (Strijbosch 1987) and maintaining1–10% of bare soil, recommended for a good sand lizardhabitat (JNCC 2009), can prevent these sites from becom-ing limiting. Second, loss of variation in vegetationstructure reduces possibilities for thermoregulation, aproblem documented for the closely related common lizardZootoca vivipara (Herczeg et al. 2006). Third, a denser andmore homogeneous vegetation may harbour lower preydensities, prey visibility and decrease foraging activity.
Practical implications
From the differences between whole-plot and within-plothabitat suitability for sand lizards, it is clear that theindicator function for heterogeneity of the sand lizard isscale-dependant. At the local (within-plot) scale level, thedistribution of sand lizards could probably be a usefulindication of within-plot habitat heterogeneity. Changes inwithin-plot habitat heterogeneity occurring over severalyears could thus be effectively traced through fine scaledsand lizard distribution monitoring. This is also recom-mended by Offer et al. (2003) who suggests that a goodmonitoring programme of reptiles and vegetation structureis essential as a precaution for negative effects in areaswhere grazing is recommended. At the regional (between-plot) scale level, habitat suitability has proven resistant to
changes in habitat heterogeneity until present. It is expectedto decrease with further vegetation succession and loss ofopen sandy patches. Changes in sand lizard population sizeat this scale most likely occur only after long ongoing andchronic habitat degradation, limiting its use as an earlywarning indicator. The abundance of an indicator species isideally linked with natural landscape heterogeneity, withthe species operating on a scale which is in accordance withnatural landscape dynamics. As it will often be impossibleto find a species fitting this profile, a multi-speciesapproach is preferred with species responding to habitatheterogeneity at different scales (local to regional) (Maesand Van Dyck 2005; Verberk 2011).
The extensive grazing regime applied in our study areadid not halt the expansion of grasses and shrubs and theloss of heterogeneity. Increase of grazing pressure canhowever have adverse effects on reptiles (Edgar et al. 2010)and other fauna of nutrient-poor grasslands, as also shownfor snails (Boschi and Baur 2007). Management of duneareas should aim at reversing this encroachment andrestoring habitat heterogeneity at multiple scales, rangingfrom local sandy patches, for a species as the blue-wingedgrasshopper Oedipoda caerulescens, to a mosaic ofdifferent vegetation patches for butterflies as the graylingHipparchia semele (Maes and Bonte 2006) and insectivo-rous birds as the red-backed shrike Lanius collurio (VanDuinen et al. 2004). The key large scale management toolto achieve these goals is a sustainable reactivation ofaeolian dynamics. Spatial differences in aeolian dynamicscan create a fine scaled mosaic of patches with differencesin soil development and vegetation succession beneficialfor many plant and animal species (De Bruyn 1997; Doing1995; Ranwell 1972). This is also essential for sand lizardconservation providing a suitable habitat with combinationsof different patches for thermoregulation, foraging, hiding,hibernation and egg deposition (Edgar et al. 2010; Glandt1991; House et al. 1980; House and Spellerberg 1983a). Ona smaller scale, extensive grazing, emulation of grazingthrough mowing and emulation of aeolian dynamicsthrough sod cutting are management practices which arein use nowadays. These practices, either separate orcombined, may prove suitable for reversing encroachmentand restoring heterogeneity of coastal dunes, but theirplanning will require a differentiation of measures in spaceand time (Edgar et al. 2010).
Conclusions
The use of a habitat suitability model has proven to be a usefultool to functionally interpret changes in dry coastal duneheterogeneity from an animal’s perspective. Average habitatsuitability proved unresponsive to changes in habitat hetero-
Effects of shifting vegetation mosaics on sand lizards 97
geneity until present but is expected to decrease with furthervegetation succession and loss of open sandy patches.Monitoring the distribution of sand lizards as an early warningsystem will be more suitable for documenting habitatheterogeneity on a smaller scale. The grazing intensity usedin this research did not halt expansion of grasses and woodyspecies. Large scale reactivation of aeolian dynamics andsmall scale emulation of these processes are deemed mostpromising to offset the negative effects of encroachment.Habitat suitability models such as these can help site managersfocus management efforts by identifying essential habitatelements. To fully capture the natural landscape dynamics werecommend expanding habitat suitability models to encom-pass multiple species operating on different scale levels anddiffering in their essential habitat elements.
Acknowledgments We thank the Provincial Water company NorthHolland for supporting and funding this study, especially Rienk Slingsand Hubert Kivit for their assistance during the research. HenkStrijbosch and Ravon for their expert judgement and access to theirliterature database. Special thanks to Gemma Rutten for her assistancein collecting the lizard encounter data during field work. Finally, thepaper improved by constructive comments of an anonymous referee.
Open Access This article is distributed under the terms of theCreative Commons Attribution Noncommercial License which permitsany noncommercial use, distribution, and reproduction in any medium,provided the original author(s) and source are credited.
References
Adler PB, Raff DA, Lauenroth WK (2001) The effect of grazing onthe spatial heterogeneity of vegetation. Oecologia 128:465–479
Bonte D, Maelfait J-P, Hoffman M (2000) The impact of grazing onspider communities in a mesophytic calcareous dune grassland. JCoast Conserv 6:135–144
Bonte D, Criel P, Vanhoutte L, Van Thournout I, Maelfait J-P (2004)The importance of habitat productivity stability and heterogeneityfor spider species richness in coastal grey dunes along the NorthSea and its implications for conservation. Biodivers Conserv13:2119–2134
Boschi C, Baur B (2007) The effect of horse cattle and sheep grazingon the diversity and abundance of land snails in nutrient-poorcalcareous grasslands. Basic Appl Ecol 8:55–65
Cooke AS (1991) The habitat of sand lizards Lacerta agilis atMerseyside. English Nature research & survey in natureconservation 41
Council directive 92/43/EEC of May 21 (1992) on the conservation ofnatural habitats and of wild fauna and flora, http://ec.europa.eu/environment/nature/legislation/habitatsdirective. Accessed onNov 2011
De Bonte AJ, Boosten A, Van der Hagen HGJM, Sýkora KV (1999)Vegetation development influenced by grazing in the coastal dunesnear The Hague The Netherlands. J Coast Conserv 5:59–68
De Bruyn GJ (1997) Animal communities in Dutch dunes. In: Van derMaarel E (ed) Dry coastal ecosystems: general aspects. Elsevier,Amsterdam, pp 361–386
Definiens (2006) Definiens Professional 5 User Guide Definiens.Munchen
Dennis P, Aspinall RJ, Gordon IJ (2002) Spatial distribution of uplandbeetles in relation to landform vegetation and grazing manage-ment. Basic Appl Ecol 3:183–193
Doing H (1995) Landscape ecology of the Dutch coast. J CoastConserv 1:145–172
Drees JM, Olff H (2001) Rabbit grazing and rabbit counting. In:Houston JA, Edmonson SE, Rooney PJ (eds) Coastal dunemanagement Shared experience of European conservation prac-tice. Liverpool University Press, Liverpool, pp 86–95
Drees JM, Dekker JJA, Wester L, Olff H (2009) The translocation ofrabbits in a sand dune habitat: survival, dispersal and predation inrelation to food quality and the use of burrows. Luntra 52:109–122
Edgar P, Foster J, Baker J (2010) Reptile habitat managementhandbook. Amphibian and Reptile Conservation, Bournemouth
ESRI (2004) ArcGIS 91 Environmental Systems Research InstituteRed lands. California
FitzGibbon C, Albon S, Robinson P (2005) The effects of a mixedgrazing regime on sand dune vegetation communities at BrauntonBurrows, Devon. English Nature Research Reports, No 637
Geerling GW, Ragas AMJ, Leuven RSEW, van Den Berg JH,Breedveld M, Liefhebber D (2006) Succession and rejuvenationin floodplains along the river Allier (France). Hydrobiologia 565(1):71–86
Geerling GW, Vreeken-Buijs MJ, Jesse P, Ragas AMJ, Smits AJM(2009) Mapping river floodplain ecotopes by segmentation ofspectral (CASI) and structural (LiDAR) remote sensing data.River Res Appl 25(7):795–813
Gibson CWD, Brown VK, Losito L, McGavin GC (1992) Theresponse of invertebrate assemblies to grazing. Ecography15:166–176
Glandt D (1991) The vegetation structure preferred by the sand lizard(Lacerta agilis) and the common lizard (Lacerta vivipara) in anexperimental outdoor enclosure. Acta Biol Benrodis 3:79–86
Gusafson EJ (1998) Quantifying landscape spatial patterns: what is thestate of the art? Ecosystems 1:143–156
Herczeg G, Gonda A, Saarikivi J, Merila J (2006) Experimentalsupport for the cost-benefit model of lizard thermoregulation.Behav Ecol Sociobiol 60:405–414
Hopkins J, Radley G (1998) Sand dunes and the Habitat directive:preparation of the UK national list. In: Houston JA, EdmondsonSE, Rooney PJ (eds) Coastal dune management shared experi-ence of European conservation practice. Liverpool UniversityPress, Liverpool, pp 283–301
House MS, Spellerberg IF (1983a) Ecology and conservation of sandlizard (Lacerta agilis) habitat in southern England. J Appl Ecol20:417–437
House MS, Spellerberg IF (1983b) Comparison of Lacerta agilishabitats in Britain and Europe. Br J Herpetol 6:305–308
House MS, Taylor PJ, Spellerberg IF (1980) Patterns of dailybehaviour in two lizard species Lacerta agilis L and Lacertavivipara Jacquin. Oecologia 44:396–402
Huston M (1979) A general hypothesis of species diversity. Am Nat113:81–101
Jackson HC (1979) The decline of sand lizard Lacerta agilis Lpopulation on the sand dunes of the Merseyside coast England.Biol Conserv 16:177–193
JNCC (2009) Common standards monitoring guidance for lowlandheathland. Version February 2009, ISSN 1743-8160
Jones MLM, Wallace HL, Norris D, Brittain SA, Haria S, Jones RE,Rhind PM, Reynolds BR, Emmett BA (2004) Changes invegetation and soil characteristics in coastal sand dunes along agradient of atmospheric nitrogen deposition. Plant Biol 6:598–605
Kerr JT, Southwood TRE, Cihlar J (2001) Remotely sensed habitatdiversity predicts butterfly species richness and communitysimilarity in Canada. PNAS 98(20):11365–11370
98 B. Wouters et al.
Ketner-Oostra R, Sýkora KV (2004) Decline of lichen diversity incalcium-poor coastal dune vegetation since the 1970s related tograss and moss encroachment. Phytocoenologia 34:521–549
Kohyani PT, Bossuyt B, Bonte D, Hoffmann M (2008) Grazing as amanagement tool in dune grasslands: evidence of soil and scaledependence of the effect of large herbivores on plant diversity.Biol Conserv 141:1687–1694
Kooijman AM, Van der Meulen F (1996) Grazing as a control against‘grass-encroachment’ in dry dune grasslands in the Netherlands.Landsc Urban Plann 34:323–333
Kooijman AM, Dopheide JCR, Sevink J, Takken I, Verstraten JM(1998) Nutrient limitations and their implications on the effectsof atmospheric deposition in coastal dunes; lime-poor and lime-rich sites in the Netherlands. J Ecol 86:511–526
Lamoot I, Meert C, Hoffmann M (2005) Habitat use of ponies andcattle foraging together in a coastal dune area. Biol Conserv122:523–536
Leica-Geosystems (2004) Erdas Imagine 87 Erdas Inc. Atlanta,Georgia
Maes D, Bonte D (2006) Using distribution patterns of five threatenedinvertebrates in a highly fragmentated dune landscape to developa multispecies conservation approach. Biol Conserv 133:490–499
Maes M, Van Dyck H (2005) Habitat quality and biodiversityindicator performances of a threatened butterfly versus amultispecies group for wet heathlands in Belgium. Biol Conserv123:177–187
Märtens B, Grosse W-R (1996) Gotografische Wiedererkennung beiZauneidechsen (Lacerta agilis L., 1758). Die Eidechse 7:1–6
McGarigal K, Marks B (1995) FRAGSTATS: Spatial analysisprogram for quantifying landscape structure PNW-GTR-351USDA Forest Service
Offer D, Edwards M, Edgar P (2003) Grazing heathland: a guide toimpact assessment for insects and reptiles. English NatureResearch Reports No. 497. English Nature, Peterborough
Pöyry J, Luoto M, Paukunen J, Pykälä J, Raatikainen K,Kuussaari M (2006) Different responses of plants andherbivore insects to a gradient of vegetation height: anindicator of the vertebrate grazing intensity and successionalstage. Oikos 115:401–412
Provoost M, Laurence M, Jones M (2009) Changes in landscape andvegetation of coastal dunes in northwest Europe: a review. JCoast Conserv. doi:10.1007/s11852-009-0068-5
Ranwell DS (1963) Newborough Warren Anglesey III Changes in thevegetation on parts of the dune system after the loss of rabbits bymyxomatosis. J Ecol 51:385–395
Ranwell DS (1972) Ecology of salt marshes and sand dunes. Chapmanand Hall, London
Stoutjesdijk P, Barkman JJ (1992) Microclimate vegetation and fauna.OPULUS Press AB, Knivsta
Strijbosch H (1987) Nest site selection of Lacerta agilis in theNetherlands. Proceedings of the 4th Ordinary General Meeting ofthe Societas Europaea Herpetologica. University of Nijmegen,Faculty of Sciences, Nijmegen, The Netherlands
Stumpel AHP, 2004 Reptiles and amphibians as targets for naturemanagement. Alterra Scientific Contributions 13. Alterra, Wageningen
Symes N, Day J (2003) A practical guide to the restoration andmanagement of Lowland Heathland. RSPB, Sandy
Ter Braak CJF, Šmilauer P (1998) CANOCO reference manual anduser’s guide to canoco for windows: software for canonicalcommunity ordination (version 4). Microcomputer power, Ithaca
Tews J, Brose U, Grimm V, Tielbörger K, Wichmann MC, SchwagerM, Jeltsch F (2004) Animal species diversity driven by habitatheterogeneity/diversity: the importance of keystone structures. JBiogeogr 31:79–92
Van Duinen GA, Beusink P, Nijssen M, Esselink H (2004) Broed- envoedselecologie van de Grauwe Klauwier in intacte kustduinen –De Kleine Junikever als schakel in het voedselweb. RapportStichting Bargerveen, Nijmegen
Van Leeuwen BH, Van de Hoef JCM (1976) Onderzoek naar deoecologie en populatie-dynamica van de zandhagedis (Lacertaagilis L) in de duinen van Oostvoorne. Rapport Rijksinstituutvoor Natuurbeheer, Leersum
Veer MAC, Kooijman AM (1997) Effects of grass-encroachment onvegetation and soil in Dutch dry dune grasslands. Plant Soil192:119–128
Verberk WCEP (2011) Gidssoorten wijzen de weg naar herstel. DeLevende Natuur 112:152–156
Verberk WCEP, van Duinen GA, Brock AMT, Leuven RCEW, SiepelH, Verdonschot PFM, van der Velde G, Esselink H (2006)Importance of landscape heterogeneity for conservation ofaquatic macroinvertebrate diversity in bog landscapes. J NatConserv 14:78–90
WallisDeVries MF, Raemakers I (2001) Does extensive grazingbenefit butterflies in coastal dunes. Restor Ecol 9:179–188
Wiens JA (1989) Spatial scaling in ecology. Funct Ecol 3:385–397
Effects of shifting vegetation mosaics on sand lizards 99