THE EFFECTS OF SCIENCE FAIRS ON STUDENTS’ KNOWLEDGE …
61
THE EFFECTS OF SCIENCE FAIRS ON STUDENTS’ KNOWLEDGE OF SCIENTIFIC INQUIRY AND INTEREST IN SCIENCE by Beverly Ann Jaworski A professional paper submitted in partial fulfillment of the requirements for the degree of Masters of Science in Science Education MONTANA STATE UNIVERSITY Bozeman, Montana July 2013
Transcript of THE EFFECTS OF SCIENCE FAIRS ON STUDENTS’ KNOWLEDGE …

THE EFFECTS OF SCIENCE FAIRS ON STUDENTS’ KNOWLEDGE OF
SCIENTIFIC INQUIRY AND INTEREST IN SCIENCE
by
Beverly Ann Jaworski
A professional paper submitted in partial fulfillment of the requirements for the degree
of
Masters of Science
in
Science Education
MONTANA STATE UNIVERSITY Bozeman, Montana
July 2013

ii
STATEMENT OF PERMISSION TO USE
In presenting this professional paper in partial fulfillment of the requirements for
a master’s degree at Montana State University, I agree that the MSSE Program shall
make it available to borrowers under rules of the program.
Beverly Ann Jaworski
July 2013

iii
DEDICATION
This paper is dedicated to my husband, David, who has supported my efforts in obtaining my Master’s Degree at Montana State University.

iv
TABLE OF CONTENTS
INTRODUCTION AND BACKGROUND ........................................................................1
CONCEPTUAL FRAMEWORK ........................................................................................3
METHODOLOGY ..............................................................................................................8
DATA AND ANALYSIS ..................................................................................................14
INTERPRETATION AND CONCLUSION .....................................................................23
VALUE ..............................................................................................................................24
REFERENCES CITED ......................................................................................................26
APPENDICES ...................................................................................................................28
APPENDIX A: Pre-test and Post-test on Scientific Inquiry ...................................29 APPENDIX B: Student Score Sheet for Inquiry Pre-test and Post-test..................37 APPENDIX C: Student Survey Before Science Fair ..............................................39 APPENDIX D: Student Interview Questions Before Science Fair ........................41 APPENDIX E: Student Checklist for Science Fair ................................................43 APPENDIX F: Student Conference Sheet ..............................................................45 APPENDIX G: Student Survey After Science Fair ................................................47 APPENDIX H: Student Interview Questions After Science Fair ...........................49 APPENDIX I: Judges’ Scoring Rubric ..................................................................51 APPENDIX J: Teachers’ Questionnaire .................................................................53

v
LIST OF TABLES
1. Data Triangulation Matrix .............................................................................................13

vi
LIST OF FIGURES
1. Mean of Students’ Scores on Pre-test and Post-test.......................................................14 2. Percentage of Students Whose Scores Increased, Decreased or Remained Unchanged
on the Scientific Inquiry Pre-test and Post-test .............................................................15 3. Student Survey Results on the Science Fair Should Be Voluntary ...............................15 4. Student Survey Results on Should Partner or Group Work be Permitted .....................17 5. Student Survey Results on the Science Fair Should be Competitive ............................18 6. Student Survey Results for the Judge Helped Me Learn More About My Science Fair
Project ............................................................................................................................19 7. Student Survey Results for the Science Fair Has Improved My Attitude Towards
Science ...........................................................................................................................20 8. Student Survey Results for the Science Fair Has Taught Me More About Scientific
Inquiry ...........................................................................................................................21 9. Teacher Questionnaire Results on This Year’s Science Fair .........................................22

vii
ABSTRACT
The purpose of this capstone project was to determine if science fairs increase students’ knowledge of scientific inquiry and build positive attitudes towards the study of science. This topic was chosen because students in the sixth through eighth grade participate in a school-sponsored science fair each year. Therefore the effectiveness of using science fairs as a method of teaching scientific inquiry and promoting interest in science was tested. Students were given a pre-test on scientific inquiry before the science fair and a post-test on scientific inquiry after the science fair. Then these test scores were compared. Students were also given surveys to complete before and after their participation in the science fair to determine if their attitudes changed towards the study of science. Samples of students from each grade were also interviewed before and after the science fair. Other sources of data were questionnaires completed by teachers at the school. These data were collected in a six-month time span. This capstone project determined that the science fair increased knowledge of scientific inquiry in students, but not for all students. Students’ attitudes play a role in what they find relevant and want to learn. The science fair was successful in promoting more positive attitudes towards the study of science for students who visited the fair. Participants who showed a more positive attitude towards the study of science were only students who previously expressed interest in science before their participation in the science fair.

1
INTRODUCTION AND BACKGROUND
For the past three years, I have been teaching science to the fourth through eighth
grades at St. Mary’s School in Rockville, Maryland. St. Mary’s School is a K-8 catholic
school that serves a culturally diverse population of 230 students who come from over ten
countries. The predominant nationalities are Hispanic, Asian, and American, but we also
have students from Africa, South America, and Europe. For most of our students English
is their first language. We have many students who also have Spanish as their second
language. Most of our students come from middle-income households, but students from
low-income households attend St. Mary’s through scholarships and tuition assistance. As
a result of their diversity, students bring a wide range of experience and skills to the
classroom.
In August 2009, I was hired and asked by my administrator to restructure the
science program. One goal of this reconstruction was to increase our students’
standardized test scores by using a more hands-on approach in the teaching of science.
The second goal was for our science curriculum to meet the required standards set by the
Archdiocese of Washington, D.C. These standards include knowledge and skills
associated with physical, life, and earth science, as well as scientific inquiry.
Students in grades four through eight attend science class four times a week with
classes running 40 minutes in length. They participate in at least two labs or activities
weekly. Students in grades four and five work with a partner to perform a lab or activity
and to answer questions. Students in grades six through eight experiment in small groups
and work on group lab reports. In this small group setting, students have a different job
for each lab. Experimenting is not limited to the classroom. Students in grades four and

2
five perform simple experiments for homework. Students in grades six through eight
participate in the school science fair that is held every January.
Serving as the coordinator for the science fair led me to focus my capstone project
on the effectiveness of science fairs in the study of science. Students in grades six
through eight work individually on a topic of their choice. They are given a timeline as
to when their questions, research, procedures, and final projects are due. They are also
provided with a detailed packet containing guidelines to help them with each step of the
process, and examples on how to make a science board, write a final report, and create a
bibliography.
At the science fair, students present their projects to a judge. The judge, who
works in a field of science, discusses the project with the student, giving positive
feedback as well as suggestions on how to improve their project. All participants receive
a participation award. Students also present their projects to the class to share
information and discuss what they learned.
The science fair takes a great deal of time and effort for both the students and the
teacher. This is time spent inside and outside of the classroom. Not all students see the
benefits from their participation in the science fair. Interviewing a sample of sixth and
eighth graders, I found that the majority sixth graders had a negative opinion of the fair,
while most eighth graders had a positive opinion.
Concern about students’ opinions pertaining to their science fair experiences led
me to my focus question: Do science fairs increase students’ knowledge of scientific
inquiry and promote a greater interest in science? Therefore the purpose of this capstone

3
project will determine if science fairs improve student learning in the application of
scientific inquiry and create positive student attitude towards the study of science.
CONCEPTUAL FRAMEWORK
One of the most common methods teachers use to instruct students in the study of
inquiry and develop interest in science is the science fair (Bellipanni & Lilly, 1999). A
science fair is an event involving students who present the results of their investigations.
Science fairs can be competitions that take place in elementary, middle and high school
levels. Inquiry is a process that engages students to learn in more meaningful ways. Its
purpose is to help students understand their world by using real-life experiences (Sumrall
& Schillenger, 2004).
The idea of exhibiting science began in 1828, in New York City, when the
American Institute of Science and Technology sponsored an exposition. Inventors were
awarded medals for their innovative ideas. The purpose of these expositions was to
promote and popularize science to the public. People could see the inventions like the
telegraph and telephone and become knowledgeable about the benefits science could
bring to their personal life. In 1928, there was a change in the purpose of these
expositions. The emphasis moved from adult inventors to student investigators. Here the
purpose of the science fair was to promote more student interest in science careers and
develop science literacy (Bellipanni & Lilly, 1999). The first student fair was held with
help from the American Museum of Natural History, and it became the model for all
science fairs (Silverman, 1986). Today the popularity of science fairs has increased with
larger numbers of students participating throughout the United States (Bellipanni & Lilly,

4
1999).
The benefits of science fairs to student learning have been discussed and
researched in science education from the 1980s to today. Adults with careers in science
stated that science fair experiences influenced their choice in a science profession (Olson,
1985). Scientists who were interviewed stated that encouragement from others,
excellence in teaching, and richness of science related experiences were the most
influential factors in their career choice (Shaw, 2005). Students at St. Thomas University
taking the Introduction to Psychology class reported that they exerted more effort and
learned more from their instructor and textbook when they participated in a psychology
science fair (Fish & Fraser, 1993). Many educators believe that science fairs are the best
way to develop skills, attitudes and knowledge that will lead to future success (Czerniak
& Lumpe, 1996). The science fair is seen as a good introduction to science that can lead
to students doing well in science later in their lives. It can be influential to making sense
of science (Bellipanni & Lilly, 1999). The most common reason students become
interested in science is because of science fairs (Bruce & Bruce, 2000). A survey of
students who participated in science fairs showed most students agreed that science fairs
are fun and they learn new things (Abernathy & Vineyard, 2001). A study done on
science education involving American Indian students found that student-directed
educational opportunities like science fairs positively influenced successful transitions
into higher education (Welsh, 2008).
Educators who find science fairs beneficial to students realize that science fairs
may need to change from their previous formats. These formats have students using
projects they found in books or at science project sites on the Internet instead of student

5
generated topics. These formats have students working independently on a project at
home instead of working in a group at school (Sumrall & Schillinger, 2004). Although
science fair competitions can contribute to the education of students in science, the
National Science Teacher Association recommends changes to science fairs using the
following guidelines (NSTA Official Positions, 1999):
• Competitions should be open to all students and participation voluntary for
both students and staff.
• Emphasis needs to be placed on learning and not competition.
• Competitions should supplement other educational experiences and align with
the curriculum.
• Projects need to focus on inquiry, scientific content, and application.
• Projects should be the work of the student.
• Competitions should build partnerships between students, schools and the
community
These guidelines have assisted educators in developing science fairs that are an
interactive process. Students are actively involved at school sharing ideas, brainstorming
ways to test predictions, and testing the validity of their results (Sumrall & Schillinger,
2004). Other proposals for science fair reform include making science fairs based on
standards so they place less emphasis on competition and more on communication
(Rillero, 2011). Taking science fairs on-line is another suggestion that when
implemented can give students the opportunity to record the process and results of their
experimentation allowing for more feedback and learning (Tubbs, 2007).
There are some educators who question the benefits of science fairs. Science fairs

6
often show inquiry as the scientific method that can be presented in a strict format, not
promoting creativity in problem solving. Participation has generally been restricted to
older students, but students need to be exposed to inquiry at an earlier age. Students
usually work individually and do most of their project at home, which can lead to a
stagnant project, and too much parent involvement (Craven & Hogan, 2008). Science
fairs can become more of a social event than a sharing of ideas. Projects are often a
repeat of a former project from a book or the Internet. Fairs can be extremely
competitive and have mandatory participation (Bellipanni & Lilly, 1999). Science fairs
offer students the chance to develop skills in inquiry, research, teamwork, analyzing, and
sharing, but this does not always translate into a student’s attainment of these skills
(Sumrall & Schillenger, 2004). Science fairs cause student anxiety towards science and
the fair. The relationship between anxiety towards science fairs and science achievement
are inversely correlated (Czerniak & Lumpe, 1996). Other research suggests that the
time and money spent on promoting fairs should be used on activities that engage student
in real-life issues that truly enhance scientific inquiry. Data also imply that promoting
other events and activities in science may be more beneficial in helping students develop
science literacy skills (Craven & Hogan, 2008). These are just a few of the concerns that
cause educators to question the effect science fairs are having on education and a
student’s learning experience.
Two studies focused on the effectiveness of science fairs on student inquiry and
interest. One study performed by researchers Arizona State University with seventh
graders found that students who participated in a science fair scored higher on a science
inquiry test than students who did not participate in a science fair. These researchers

7
failed to find significant differences in the test scores between students who participated
in a science fair and those who did not (Yaser & Baker, 2003). Another study performed
on fifth graders in Brevard County, Florida, researched the effects of mandatory and
competitive fairs on students’ attitudes and interest. The results showed that students
who participated in the non-competitive fair displayed a greater interest in science.
Students with low ability showed greater interest in science after participating in a non-
competitive fair. High ability students performed better in a competitive atmosphere
(Blenis, 2000). With conflicting views associated with the benefits of science fairs,
researchers believe that more studies need to be done on the impact of extracurricular
competitions on motivation and goals for students (Abernathy &Vineyard, 2001; Yaser &
Baker, 2003).
There are other variables that can affect whether student inquiry and interest are
improved by participation in a science fair. Not all students are motivated by the same
rewards, learn the same way, or have the same resources at home to complete a science
fair project. Students who have parents with science knowledge have an advantage over
students whose parents do not understand science. The interest of the teacher in charge
of the science fair can also affect desired results (Craven & Hogan, 2008). The
conclusion of a study on student attitude also revealed that students differed in relation to
their personal home and school environmental variables. Students whose mothers were
well educated and employed in white-collar jobs made the most positive gains after their
science fair completion and involvement (Dimit, 1990).
There are many factors that are involved in the success of science fairs. These
factors include: students’ learning styles and motivations, teachers’ and parents’

8
knowledge and interest in science, management of the science fair, and the real purpose
and focus of the fair. Therefore, the idea of science fairs, as a successful tool to teach
inquiry and promote student interest in science needs further discussion and research to
conclude its effectiveness on a student’s learning.
METHODOLOGY
This capstone project spanned 24 weeks from September 2012 to February 2013.
The research methodology for this capstone project received an exemption by Montana
State University’s Institutional Review Board and compliance for working with human
subjects was maintained. The treatment involved students in the sixth through eighth
grades. Each student in these grade levels participated in the school’s science fair.
Participation meant that each student found a question to research and answer
through experimentation, which formed the basis for their science fair project. Students
followed a given timeline that stated when each section of their project was due. These
sections were the question, research, variables and hypothesis, materials and procedure,
and final project. Students’ progress was monitored as they completed each section using
a checklist (Appendix E). A science fair packet was provided to the students showing
how each section of their project was to be completed. Class time was used for the
teacher to present each section. Students received time in class to look for topics of
interest and to research their chosen questions. They also had the opportunity to meet
with their teacher on any concerns as they worked through their projects. A student
conference sheet was used to track students’ progress and help guide students as they
worked on each section (Appendix F). Final projects consisted of a display board and a

9
final report.
At the science fair, students discussed their project with a person involved in the
field of science. These judges gave positive feedback to students on their projects and
provided ways they could strengthen their work. Students received an award for their
participation in the fair.
To determine the effects of student participation in a school science fair two
questions had been identified: do science fairs increase student knowledge of inquiry and
do they promote an increased interest in the study of science? To answer these questions,
data were collected using a variety of assessment strategies. These strategies included:
testing, student checklists, conferencing, surveys, interviews, and questionnaires
(Table 1).
In September, students in grades six through eight were given the Scientific
Inquiry Pre-test (N = 64). The test consisted of 25 multiple-choice questions on scientific
inquiry taken from a science skills textbook (Bailer, Ramig & Ramsey, 2006). Tests
were graded and students’ scores were recorded using the Student Score Sheet for Inquiry
Pre-test and Post-test (Appendix B). The mean for each class and the total number of
students was calculated using the students’ pre-test scores from this test (N = 64).
The post-test given after the science fair was identical to the pre-test (Appendix
A). These post-test scores were also recorded using the Student Score Sheet (N = 64).
The mean for each grade and the total number of students was calculated and then
graphed to show any gains in students’ learning of scientific inquiry (Figure 1). Student
pre-test and post-test scores were also analyzed to determine the percentage of students
whose scores demonstrated more knowledge on the post-test than pre-test, the percent of

10
students whose scores demonstrated less knowledge on the post-test than pre-test, and the
percent of students whose scores remained the same on both tests (Figure 2).
Students were given the Student Survey Before Science Fair (N = 64) concerning
their attitudes towards science and science fairs (Appendix C). This Student Survey
Before Science Fair used a Likert Scale of strongly agree (5), agree (4), neutral (3),
disagree (2), strongly disagree (1). Students had the opportunity to write additional
comments if they felt it necessary. Students’ responses were tallied for each question and
these tallies were used to determine a percentage of students with similar views.
The Student Survey After Science Fair (N = 64) was given after the students
participated in the science fair (Appendix G). This survey had the same questions as the
Student Survey Before Science Fair and used the same Likert Scale. Students were
given the opportunity to write comments. Students’ responses were again tallied for each
question and these tallies were used to determine a percentage of students with similar
views. These percentages and the percentages found from tallies on the Student Survey
After Science Fair (Appendix G) were used to graph any changes in student attitude from
their experience participating in the science fair.
Five students from each grade level were interviewed using the Student Interview
Questions Before Science Fair (N = 15) with the teacher recording all responses by taking
written notes. The interview sought to gain insight concerning students’ views on science
and science fairs before their science fair experience. Students chosen for interviews had
various learning abilities and their participation was optional. These comments were
used to support the findings on the Student Survey Before Science Fair (Appendix D).
Five students from each grade level were interviewed after their science fair

11
experience using the Student Interview Questions After Science Fair (N = 15). The
teacher followed the same procedure for interviewing students as the before the science
fair student interviews. Student comments were again used to support the findings on the
Student Survey After Science Fair (Appendix F)
After the initial testing, surveys, and interviews were completed, students began
work on their science fair projects. As each section of the project was completed,
students received written feedback from the teacher. The teacher used the Student
Checklist for Science Fair (N = 64) to track students’ progress (Appendix E).
Throughout the 24 weeks, students conferenced with the teacher about their
projects. Besides the three required conferences other times were scheduled upon
students’ requests. The teacher also scheduled conferences with students who appeared
to need more help. The required conferences discussed the student’s question and
variables, research and hypothesis, and materials and procedure. The Student Conference
Sheet (N = 64) was used to record what was discussed at the meeting (Appendix F).
Students completed this form before the conference and wrote down the information they
received. This was an important step because often times they forgot what was
discussed. The teacher also wrote notes on the conference sheet. Students kept copies of
this sheet in their science folder stored in the classroom and in their binder for home use.
As the deadline approached for their final project, students reviewed how to
organize their project boards and final reports. Both were due the day of the fair, which
was January 24, 2013. At the fair students presented their projects to a science fair judge.
Judges used the Judges’ Scoring Rubric (N = 60) to score students as they discussed what
areas of the project students’ showed clear understanding and which areas needed

12
improvement (Appendix I). The Judges’ Scoring Rubric used a scoring key of superior
(4), above average (3), average (2), below average (1), no evidence (0). Judges were
asked to write positive comments for each project and how students’ could make
improvements to their projects. The Judges’ Scoring Rubric was given to students at the
end of the science fair.
At the beginning of February all of the students took the Scientific Inquiry Post-
test (N = 64). This was the same test used for the pre-test on scientific inquiry (Appendix
A). The same procedure was followed as with the pre-test, with scores recorded and the
mean calculated. The percentage of students who scores increased, dropped, or stayed
the same on both tests were tallied, recorded and used for graphing purposes.
Students were given the Student Survey After Science Fair (N = 64) concerning
their attitude towards science and the science fair. The same procedure was used as on
the student survey given before the science fair. This survey had the same format as the
first, with students using a Likert Scale to express their opinions (Appendix G).
Students’ comments were tallied and percentages were found to show students with
similar views. A second Student Survey After Science Fair (N = 64) was administered
two months after the science fair (Appendix H). The same procedure was followed for
the first Student Survey After the Science Fair. This survey was given to determine if
students’ attitudes had changed given more time away from their science fair experience.
These student comments were tallied and percentages used for graphs in data analysis.
Five students with varying learning abilities from each grade level were again
selected for interviews using the Student Interview Questions After Science Fair (N =
15). Similar questions and the same procedure were used as before (Appendix I).

13
Students’ comments from these interviews were used to support the results from the
Student Survey After Science Fair (Appendix H).
To collect more input on this year’s fair to previous fairs, teachers from the school
were also asked to complete the Teachers’ Questionnaire (N=5). The Teachers’
Questionnaire was scored using a Likert Scale of I strongly agree (5), I agree (4), I am
neutral (3), I disagree (2), I strongly disagree (1). Teachers were also given
opportunities to write any additional comments if necessary (Appendix L). Data from the
testing, checklist, conferences, surveys, interviews, and questionnaires were used to
determine if the participation in the science fair increased students’ knowledge in the use
of inquiry and promoted more interest in science (Table 1).
Table 1 Data Triangulation Matrix Focus Questions Data Source 1 Data Source 2 Data Source 3
Primary Question 1: Do science fairs increase student knowledge of scientific inquiry?
Student pre-test and post-test on scientific inquiry.
Student checklist Student conference sheet
Compare student pre-test and post-test scores on scientific inquiry. Science judges’ scoring rubric Teachers’ questionnaire
Primary Question 2: Do science fairs promote student interest in science?
Student surveys before and after participation in the science fair.
Student interviews before and after participation in the science fair.
Compare survey and interview responses before and after the science fair. Teachers’ questionnaire

14
DATA AND ANALYSIS
The mean for all students’ scores on the Scientific Inquiry Post-test increased by
two percent over the mean for all students’ scores on the Scientific Inquiry Pre-test. The
average score increased overall from pre-test to post-test, due to increases for the seventh
and eighth graders. The sixth graders showed a slight decrease (Figure1).
Figure 1. Mean of students’ scores on pre-test and post-test, (N = 64).
Thirty-nine percent of all tested students increased their score from the pre-test to
the post-test. Forty-two percent of student scores deceased from the pre-test to the post-
test, and 19% remained unchanged. The seventh and eight graders showed the largest
number of students who increased their scores. Forty-seven percent of the eighth graders
showed improvement and 53% of the seventh graders improved their scores. The sixth
graders demonstrated the largest decrease in scoring between tests with 42% scoring
lower on the post-test (Figure 2).
48505254565860626466
Total Grade 8 Grade 7 Grade 6
Percent
Mean of Student Scores
Pre-testPost-test

15
Figure 2. Percentage of students whose scores increased, decreased or remained unchanged on the scientific inquiry pre-test and post-test, (N = 64).
A majority of students shared similar opinions on statements found on their pre-
survey and post-surveys pertaining to their views on the science fair. Sixty to 80% of the
students strongly agreed that participation in the science fair should be voluntary (Figure
3).
Figure 3. Student survey results on the science fair should be voluntary, (N = 64).
0
10
20
30
40
50
60
Total Grade 8 Grade 7 Grade 6
Percent
Students
Increasd ScoreDecreaed ScoreNo change
0102030405060708090
Agree Disagree
Strongly Agree Neutral Disagree Strongly
Precent of Students
Student Responses
Pre-surveyPost-surveyPost-survey 2

16
Interviewing students gave a good picture of their reasoning. An eighth grader
said, “Forcing someone to learn science can build dislike of the subject and I’m too busy
with outside activities to worry about a science project.” A seventh grader stated, “ I’m
just not interested in Science.” A sixth grader replied, “ I have to focus on subjects that I
need to improve my grade. I don’t have time for this.” Another sixth grade student said,
“ It’s just too stressful. Can’t you just give us a test instead of a project?” When asked if
the science fair was voluntary would they participate, nine of the 15 students interviewed
replied no. A student responded, “ I’m too busy with afterschool activities, and don’t
have time.” An eighth grader replied, “ With all the stress the eighth grade has applying
to high school, participating in the science fair is just too much work.” A sixth grader
said, “ I would not participate because I found the project too hard, and too confusing.”
A seventh grader who would participate stated, “ I would have to because my mother
would make me.” Four of the 15 interviewed students replied they might participate in
the science fair, but a deciding factor would be their workload at school and what other
demands were made from extracurricular activities.
Another statement on the survey that the majority of students agreed upon was if
students should be allowed to work with a partner or group. Over sixty to eighty percent
of the students strongly agreed (Figure 4).

17
Figure 4. Student survey results on should partner or group work be permitted, (N = 64).
One student gave the response, “ I learn more by working with others. Working
with a partner or with a group would mean less work and more fun.” Another student
remarked, “My sister was allowed to work with a partner when she did her project at this
school, I don’t know why I can’t.” One seventh grader stated, “ You should have a
choice. Some people work better alone and some work better with others.” A sixth grader
said, “ Working in a group would mean less work, but it may cause problems because
you need to meet outside of school, and that means your parents have to drive you to
someone’s house.”
The survey also demonstrated that the majority of students thought the science
fair should not be competitive. Fifty-six to 74% of the students disagreed the fair should
be more competitive, with awards and prizes given to the winners (Figure 5).
01020304050607080
Agree Agree
Strongly Agree Neutral Disagree Strongly
Percent of Students
Student Responses
Pre-surveyPost-surveyPost-survey 2

18
Figure 5. Student survey results on the science fair should be competitive, (N = 64).
A student replied, “Competition just freaks me out! They can be so stressful.”
One student stated, “Competitions can be unfair, and you can get very disappointed if you
don’t win anything. Then you think your project wasn’t any good.” Some students
though wanted a competitive fair. One student said, “ I work harder when I’m
competing. You try harder and get recognized for all your hard work.” Another stated,
“ Competition makes me want to do my best.”
The survey showed that a majority of students were neutral or did not feel talking
to a judge helped them learn more about their project. Only 25% of the students felt the
judge gave them more insight and constructive criticism on their topic (Figure 6).
0
10
20
30
40
50
60
Agree Disagree
Strongly Agree Neutral Disagree Strongly
Percent of Students
Student Responses
Pre-surveyPost-surveyPost-survey 2

19
Figure 6. Student survey results for the judge helped me learn more about my science fair project (N = 64).
Students gave these comments about the judges. One student stated, “ I didn’t
have much time with my judge. He seemed to be in a hurry.” Another replied, “I didn’t
learn anything new. I already knew everything from working months on the project.” A
sixth grader said, “He just asked me questions and didn’t give me any advice. He didn’t
tell me anything except, good job.” Another sixth grader said, “ The judge was an idiot!
He didn’t know anything about sports.”
Some interviewed students appeared to have a better experience with their judge.
A seventh grade student said, “ My judge was very professional and gave me advice on
how to improve my project.” An eighth grader stated, “ I know more now than I did.”
There were no positive remarks from the sixth graders interviewed.
Two of the statements on the survey dealt directly with the two focus questions of
this capstone project. The first statement was the science fair has improved my attitude
towards the study of science. Thirty- three percent strongly disagreed on the second post-
survey, and 21% disagreed. Thirty-three percent were neutral and 13% strongly agreed
or agreed. Students who disliked science did not appear to make a change in their
05
101520253035
Agree Disagree
Strongly Agree Neutral Disagree Strongly
Percent of Students
Student Responses
Pre-surveyPost-surveyPost-survey

20
attitude. The disagree responses remained about the same. The strongly agree, agree, and
neutral responses showed the most change. After participating in the science fair the
graph showed more students were neutral (Figure 7).
Figure 7. Student survey results for the science fair has improved my attitude towards science, (N = 64).
Students’ responses supported the data that the science fair did not improve their
attitude towards science. One stated, “ Science is boring. I am not interested in science.”
Another responded, “ Science is not my favorite subject. Can’t we learn science an easier
way than doing a project?” A sixth grader said, “I use to like Science, but not anymore.”
Some students responded positively. An eighth grader said, “ Yes, I want to work in a
vet’s office someday.” A sixth grader responded, “ I learned more about my topic and
now I am more interested in running as a sport.”
The second focus question this capstone project addressed was if science fairs
increase students’ knowledge of scientific inquiry. Students’ responses to this topic were
divided. Only two percent of the students strongly agreed and 26 % of the students
agreed that the science fair increased their understanding of scientific inquiry. Thirty-
05
101520253035
Agree Disagree
Strongly Agree Neutral Disagree Strongly
Percent of Students
Student Responses
Pre-surveyPost-surveyPost-survey

21
three percent of the responses were neutral. Eighteen percent of the students disagreed
and 21% of the students strongly disagreed (Figure 8).
Figure 8. Student survey results for the science fair has taught me more about scientific inquiry, (N = 64).
Students’ responses were also as varied as the data collected from the surveys.
One student said, “ No, I did not learn anything about scientific inquiry, I just did a
project. There was nothing to solve.” Another stated, “ If I wanted to solve a problem, it
would be better for me to watch a TV show like Dora the Explorer.” An eighth grader
stated, “I already have a good understanding of it, so I didn’t learn much that was new.”
A sixth grader said, “It’s just an experiment. I already knew the outcome before I
started.” Two students were not sure if they learned about scientific inquiry because they
answered, “ I don’t know.” A student also responded, “ Yes, I learned about scientific
inquiry by doing my project. You just follow the steps and then you do it.”
To compare the students’ responses other sources was sought out to give their
views on whether the students’ learning of scientific inquiry had increased and attitudes
appeared more positive towards science. The science fair judges were the first source of
information on these topics. One judge gave this response, “ The students appear more
05
10152025303540
Agree Disagree
Strongly Agree Neutral Disagree Strongly
Percent of Students
Student Responses
Pre-surveyPost-surveyPost-survey 2

22
confident discussing their projects and show interest in their topics. There was more of a
variety of topics this year. They still show weakness in critically analyzing data and
forming conclusions.” This judge though could not tell whether students had a better
understanding of scientific inquiry this year than last year, or if overall attitudes to
science had become more positive.
Teachers were another source of information concerning student progress in
scientific inquiry and attitudes towards science. The questionnaire showed that 100% of
the teachers agreed that the science fair increased interest in science and increased
knowledge of science in their own students. Sixty percent felt that the science fair
increased understanding of scientific inquiry and generated more interest in the students
who participate in the science fair (Figure 9).
Figure 9. Teacher questionnaire results on this year’s science fair, (N = 5).
One teacher commented, “ The science fair was wonderful this year. It generates so
much enthusiasm and so many questions. That is what science is questioning and
answering those questions about out natural world.” Another teacher stated, “ I was very
0102030405060708090
100
Percent
Teacher Responses
Strongly AgreeAgreeNeutralDisagreeStrongy Disagree

23
impressed with the quality of the projects in this year’s fair. Questioning students
demonstrated good understanding of the projects.” The fourth grade teacher replied,
“ My students looks forward to walking through the fair and participating in future fairs.”
INTERPRETATION AND CONCLUSION
Although the pre-test and post-test results showed student gains in their
knowledge of scientific inquiry due to their participation in the science fair, not all
students showed an increase in learning and the gains made by students were small. This
begs the question: was the scientific inquiry test used a good indicator of what students
had actually learned from the science fair? Would another test have given different
results? Students knew that these tests would not be used for grading purposes. Would
using them for a grade have motivated students to try harder? The teacher did not teach
to the test, but used time in class to instruct and guide students through their projects.
Would reviewing the tests improve students’ scores but be a true indicator of their gained
knowledge from doing their science project? The teacher and students spent 20 weeks on
the science fair. With a mean showing only a two percent increase, was this time used
effectively, or is there a better method to increase students’ knowledge in scientific
inquiry? These results support educational researchers who question the value of science
fairs. They believe that science fairs offer students the chance to develop skills in
inquiry, research, teamwork, analyzing, and sharing, but this does not always translate
into a student’s attainment of these skills (Sumrall & Schillenger, 2004)
The results of this action research revealed that the science fair promoted more
positive attitudes towards science to students who visit the science fair, but not for the

24
participants. These students’ attitudes remained the same or became more negative.
From students’ responses they feel doing a science fair project is too much work. They
want it to be voluntary and done as a group project. Would allowing them to work in
pairs or groups make the project more enjoyable? If science fair were voluntary, would
students participate? Is the science fair doing more harm than good? This last question
causes concern with educators. Science fairs cause student anxiety towards science and
the fair. Science achievement and anxiety towards science fairs are inversely correlated
(Czerniak & Lumpe, 1996).
If the science fair in its present format is not increasing learning and/or promoting
interest in science, then what is the best course of action? It could be debated that more
data are needed to form a conclusion and that this action research needs to be continued
for a longer time. It could mean that the science fair needs to be reviewed and changes
should be made taking into consideration students’ input from their surveys and
interviews. It could also mean that the science fair should be discontinued and other
inquiry based activities implemented into the classroom.
VALUE
This project has been of great value helping me analyze how I teach science and
how I proceed with our school’s science fair. I have realized presumptions about how all
students learn can be unproductive and can lead to unmotivated students and showing
small gains in student learning. Action research is a valuable tool that needs to be
incorporated into the classroom and into student projects. By testing students with

25
informal and formal testing strategies, teachers can determine what students know
and which concepts are still unclear. Surveying and interviewing students can give a
teacher feedback on how the students feel about their progress and teachers can use
student interests to bring more meaning and purpose for learning. When students feel
they are a vital part of the learning process, they are more active learners. Therefore I
have learned that active research has given me the data to support my next course of
action about the science fair. It has also shown me that action research is a vital part of
my everyday teaching. Evaluating and re-evaluating is an important characteristic for an
effective teacher.
This action research has been good experience for my students. They have
realized that their views and opinions are important to their learning and important to me
as their teacher. They stated that no one has ever surveyed them or interviewed them on
their opinions about their learning. Student attitude is a large factor in what they find
meaningful and therefore what they will learn. This open dialogue I believe will help me
better meet my students’ needs.
Science is such an exciting and interesting field of study. Knowing how to use
scientific inquiry in everyday problem solving is an important life skill. As I continue
using action research in my classroom hopefully it can bring my students a better
knowledge of scientific inquiry and promote a true interest in the study of science.

26
REFERENCES CITED
Abernathy, T.V., & Vineyard, R.N. (2001). Academic competitions in science what are the rewards for students? The Clearing House, 74, 269-276.
Bailer, J., Ramig, J.E., & Ramsey, J.M. (2006). Teaching Science Process Skills. Grand Rapids, Michigan: Frank Schaffer Publications.
Bellipanni, L.J., & Lilly, J.E. (1999). What have researchers been saying about science fairs? Science and Children, 36(8), 46-50.
Blenis, D.S. (2000). The Effects of Mandatory Competitive Science Fairs on Fifth Grade Students’Attitudes towards Science and Interest in Science. Unpublished professional paper, Florida Institute of Technology.
Bruce, S.P., & Bruce, B.C. (2000). Constructing images of science: people, technologies and practices. Computers in Human Behavior, 16, 241-256.
Craven, J. & Hogan, T. (2008). Rethinking the science fair. Phi Delta Kappan, 89(9), 679-680.
Czerniak, C.M., & Lumpe, A.T. (1996). Predictors of science fair participation using the theory of planned behavior. School Science and Mathematics, 96, 355-361.
Demit, C.F. (1990). Student Attitudes Toward Science and the Affecting Personal, Home, and School Environment Variables. The Claremont Graduate University, DAI-A 51(4), 1183-1354.
Fish, T.A., & Fraser, I.H. (1993). The science fair: a supplement to lecture technique. Teaching in Psychology, 20, 231-233.
NSTA Official Positions. (1999). NSTA position statement: science competitions. Retrieved September 29, 2012, from http://www.nsta.org/about/positions/competitions.aspx
Olson, L.S. (1985). The North Dakota Science and Engineering Fair-Its History and a Survey of Participants. Unpublished manuscript, North Dakota State University.
Rillero, P. (2011). A standards-based science fair: a revamped fair places less emphasis on competition and more on communication. Science and Children, 49(3), 32.
Shaw, A.D. (2008). How High School Science-Related Experiences Influenced Science Career Persistence. Saarbrucken: VDM Verlag.
Silverman, M.B. (1986). The effect of science fair project involvement on attitude of new york city junior high school students. Dissertation Abstracts International, 47, 142A.

27
Sumrall, W. & Schillinger, D. ( 2004). Non-traditional characteristics of a science fair project. Science Scope, 27(6), 20-24.
Tubbs, J. (2007). Take the science fair online! Science and Children, 45(4), 45.
Welsh, C.A. (2008). Making Science Education Meaningful For American Indian Students: The Effects of Science Fair Participation. University of Minnesota. Retrieved November 20, 2012, from conservancy.umm.edu/bitstream/47736/3/Welsh_umm_030E_10008.pd
Yaser, S. & Baker, D. (2003). The Impact of Involvement in a Science Fair on Seventh Grade Students. Arizona State University. Retrieved October 1, 2012, from http://www.eric.ed.gov/ERICWebPortal/detail?accno=ED478905

28
APPENDICES

29
APPENDIX A
PRE-TEST AND POST-TEST ON SCIENTIFIC INQUIRY

30
Scientific Inquiry Test
Name _______________________ Date_________________
Directions: Write the letter of the most appropriate answer next to the number.
_____1. Which of the following is an observation only?
A. The piece of metal is red, so it must be hot. B. The street is wet, so it must have rained. C. The table looks like it is made of wood. D. The child’s block is orange.
_____2. Which of the following could be observed with the sense of sight?
A. The temperature of the air. B. The change in height of plants. C. The sweetness of a new chemical. D. The sound made by an engine.
_____3. Which of the following is not a characteristic of an orange?
A. It is round. B. It is juicy. C. It is red. D. It can be peeled.
____4. A scientist discovered a large boulder in a field. The boulder was different than any of the surrounding rocks in the landscape. This discovery could be labeled:
A. a hypothesis B. an inference C. a discrepancy D. an interpretation of data

31
Here is some information about students in Maple School.
Name Gender Birthday Nationality Year entered school
M. Formichelli Female June 1994 Italian 2006
B. Thermal Male March 1994 Indian 2006
A. Siddiqui Male December 1993 Pakistani 2006
R. Johnson Female May 1994 Swedish 2006
R. Ali Male October 1993 Indonesian 2006
J. Martinez Male August 1993 Hispanic 2006
_____5. Which of the following categories would not allow you to separate these students into at least two different groups?
A. gender (male or female) B. year of birth C. nationality D. year entered school
_____6. Which one of the statements below accurately characterizes an observation?
A. serves as an explanation for an inference B. must involve the use of at least one of the human senses C. categorizes objects and/or events according to similarities D. serves to explain data taken in by any or all of the human senses.
_____7. For an observation to take place, the observer:
A. simply has to experience an object or event B. has to record the observed data C. must think about what is being observed D. must make an explanation of the object or event

32
_____8. A written statement of a hypothesis must contain or strongly imply which of the following variables?
A. only the responding variable B. only the manipulated variable C. both the manipulated and responding variables D. both the manipulated and responding variables, as well as the constant variables
_____9. The following four statements concern hypotheses.
1. A hypothesis may be formed on the basis of observation alone. 2. A hypothesis is stated in testable terms. 3. A hypothesis may be formed from inferences. 4. A hypothesis can establish the basis for experimentation.
Which of the four statements are true about hypotheses?
A. 1, 2, 3, and 4 B. only 2, 3 and 4 C. only 2 and 3 D. only 1, 2 and 3
_____10. A student wants to know the effect of acid rain upon a fish population. She takes two jars and fills each of the jars with the same amount of water. She adds fifty drops of vinegar (acid) to one jar and adds nothing extra to the other. She then puts ten similar fish in each jar. Both groups of fish are cared for (oxygen, food, etc.) in identical fashion. After observing the behavior of the fish for a week, she makes her conclusions. What would you suggest to improve this experiment?
A. Prepare more jars with different amounts of vinegar. B. Add more fish to the two jars already used. C. Add more jars with different kinds of fish and different amounts of vinegar in each jar. D. Add more vinegar to the two jars already in use.

33
_____11. Recently, Beth heard sirens roaring on a nearby street. The next day when she went to school she saw a house covered with wide black spots and smoke. The most reasonable inference that she could make when describing what she saw was:
A. The house was destroyed by a tornado. B. The house was destroyed by a wild animal. C. The house was destroyed by a fire. D. The house was destroyed by a hurricane
_____12. During the night, Steve was awakened by a thunderstorm. Walking to school the next day, he saw a large tree blocking the street. The best inference that he could make is that the tree was:
A. hit by a bulldozer B. bombed by an airplane C. knocked down by a storm D. destroyed by a fire
_____13. Which month do you think will be the coldest?
A. June B. September C. April D. January
_____14. Dan and Dawn want to know if there is any difference between the mileage expected from bicycle tires from two different manufacturers. Dan will put one brand on his bicycle and Dawn will put the other brand on her bicycle. Which of the following variables would be the most important to control in this experiment?
A. the time of day the test is made B. the number of miles traveled by each type of tire C. the physical condition of the bike rider D. the weather condition E. the weight of the bicycle used

34
_____15. A group of students conducted an experiment to determine the effect of heat on the germination (sprouting) of sunflower seeds. Which of the variables listed below is the least important to control on this experiment?
A. the temperature to which the seeds are heated B. the length of time the seeds are heated C. the type of soil used D. the amount of moisture in the soil
Highest daily temperature recorded each day for a week is shown on the data table.
Sunday Monday Tuesday Wednesday Thursday Friday Saturday
8 degrees C
7 degrees C
0 degrees C
15 degrees C
23 degrees C
21 degrees C
19 degrees C
_____16. Which if the following statements is correct?
A. Monday had the lowest temperature. B. The highest temperature was recorded on Thursday. C. It snowed all day on Friday. D. The temperature was higher on Wednesday than on Saturday. E. Saturday had the highest temperature of the week.
_____17. Bob set up two identical bowls. Both contained sugar water and were open to the air. One was placed in the dark, while the other was placed in the light. What is the one item that is different from one set-up to the other?
A. the exposure to light B. the shape of the bowl C. the exposure to air D. the amount of sugar in each
_____18. Which of these statements best represents a hypothesis?
A. The magnet picked up twelve paper clips. B. The milk in this bottle froze in twenty minutes. C. Most liquids expand when heated because the particles that make them

35
up move farther apart. D. If the rate of the water flow continues, the pool will fill in ten minutes.
_____19. Which of the following is written as an operational definition?
A. The pool froze because the temperature went below 0 degrees Celsius. B. The temperature will be determined by using a Celsius thermometer. C. How long will it take for the pool to freeze? D. If the air temperature drops below freezing, then the pool will freeze.
_____20. If the amount of carrots fed to hamsters is increased, fewer will die of tail rot. The above statement is best described as:
A. an observation B. a discrepancy C. an inference D. a hypothesis
_____21. What unit would best measure the distance between Fort Worth and Houston?
A. meter B. kilogram C. centimeter D. kilometer
_____22. Students created a data table showing the kinds of candy in a grocery store. They wanted to make a graph, so they could show the data in a second way. What kind of graph is most appropriate for this data?
A. line graph B. bar graph C. both kinds of graphs D. another kind of graph
_____23. Your lab group has made a number of observations. Your next step might be to:
A. Turn in a lab report. B. Generate a graph. C. Draw a picture illustrating an observation. D. Make some inferences about your observations and investigate.

36
_____24. When converting from one unit to another in the metric system:
A. A series of prefixes are used to indicate the new unit. B. A series of suffixes are used to indicate the new unit. C. Conversion formulas must be used. D. There are twelve centimeters in each meter.
_____25. If you were measuring the volume of water, which unit would be appropriate?
A. meter B. millimeter C. milligram D. milliliter

37
APPENDIX B
STUDENT SCORE SHEET FOR INQUIRY PRE-TEST AND POST-TEST

38
Scoring Sheet for Testing Grade ____________________
Pre-test Date ___________________ Post-test Date ______________________
Name of Student Pre-test Score Post-test Score
39
APPENDIX C
STUDENT SURVEY BEFORE SCIENCE FAIR

40
Student Survey Please answer the following questions using the rating system shown below. Circle the number you feel best describes your opinion. 5- I strongly agree. 4- I agree. 3- I have no opinion. 2- I disagree. 1- I strongly disagree. 1. I think my science fair project will help me learn about inquiry. 5 4 3 2 1
2. I think science fair participation should be voluntary. 5 4 3 2 1
3. I think I will need a lot of guidance when doing my project. 5 4 3 2 1
4. I think students should have more than 4 months to finish projects. 5 4 3 2 1 5. I think students should be able to work with a partner or group. 5 4 3 2 1 6. The hardest part of the project will be finding a project idea. 5 4 3 2 1
7. I will need help finding research for my project. 5 4 3 2 1
8. I think my attitude towards science will improve because 5 4 3 2 1 I will be participating in the science fair. 9. I will like listening to my classmates’ presentations. 5 4 3 2 1
10. I will like talking to the judges about my project. 5 4 3 2 1
11. I would like a more competitive science fair. 5 4 3 2 1
12. I think talking to the judges will help me learn more 5 4 3 2 1 about science. 13. I will be more interested in a career in science because of my 5 4 3 2 1 participation in the science fair. 14. I like being able to choose any topic that interests me. 5 4 3 2 1
15. I think there are better ways to learn about inquiry and 5 4 3 2 1 science besides doing a science fair project. If you have any other comments you would like to share, please use the back of this paper to express yourself.

41
APPENDIX D
STUDENT INTERVIEW QUESTIONS BEFORE SCIENCE FAIR

42
Student Interview Questions Before Science Fair
1. Do you think the science fair will help you learn more about how to do scientific
inquiry (problem solve)? Why or why not?
2. Do you think participation in the science fair should be mandatory or voluntary?
Why?
3. If participation in the science fair was voluntary, would you participate? Why or why
not?
4. Do you think you should be able to work with a partner or group to complete a science
fair project? Why or why not?
5. Would you like the science fair to be competitive or non-competitive? Why?
6. Do you feel talking to the judges will help you better understand your project? Why or
why not?
7. Do you think you will become more interested in science because of your participation
in the science fair? Why or why not?
8. What do you think will be the most difficult part of your project? Do you have any
suggestions that could make this part easier for you?
9. Do you have any other comments or suggestions that you think could help the science
fair be more meaningful or fun for you?
10. Is there anything else you would like to tell me?

43
APPENDIX E
STUDENT CHECKLIST FOR SCIENCE FAIR

44
Student Checklist for Science Fair Grade ______________
Student Question Research Variables and Hypothesis
Materials and Procedure
Board and Report
Final Score

45
APPENDIX F
STUDENT CONFERENCE SHEET

46
Student Conference Sheet
Name _______________________ Grade _____________ Date _____________
Put a check by the topic of discussion: ______ Question (Variables and Hypothesis)
______ Research
______ Experiment Set Up (Materials and Procedure)
______ Other: Please state your topic below.
_____________________________________________________________________
What questions do I have that need to be addressed?
_________________________________________________________________________________________________________________________________________________________________________________________________________________________________________________________________________________________________________________________________________________________________________________________________________________________________________________________________________________________________________________
Summary of Conference: What information do I now have to answer my questions?
____________________________________________________________________________________________________________________________________________________________________________________________________________________________________________________________________________________________________________________________________________________________________________________________________________________________________________________________________________________________________________________________________________________________________________________________________________________________________________________________________________________________________________________________________________________________________________________________________________________________________________________________________________________
Teacher Comments:
________________________________________________________________________________________________________________________________________________________________________________________________________________________________________________________________________________________

47
APPENDIX G
STUDENT SURVEY AFTER SCIENCE FAIR
48
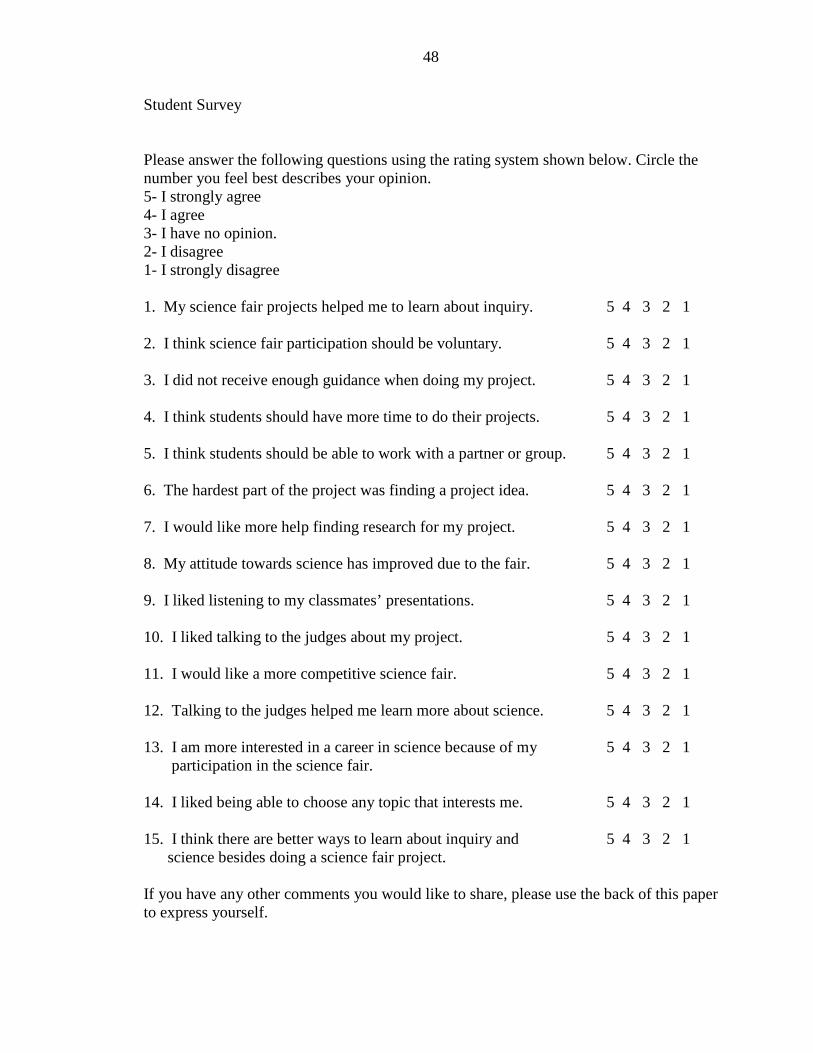
Student Survey
Please answer the following questions using the rating system shown below. Circle the number you feel best describes your opinion. 5- I strongly agree 4- I agree 3- I have no opinion. 2- I disagree 1- I strongly disagree 1. My science fair projects helped me to learn about inquiry. 5 4 3 2 1
2. I think science fair participation should be voluntary. 5 4 3 2 1
3. I did not receive enough guidance when doing my project. 5 4 3 2 1
4. I think students should have more time to do their projects. 5 4 3 2 1
5. I think students should be able to work with a partner or group. 5 4 3 2 1
6. The hardest part of the project was finding a project idea. 5 4 3 2 1
7. I would like more help finding research for my project. 5 4 3 2 1
8. My attitude towards science has improved due to the fair. 5 4 3 2 1
9. I liked listening to my classmates’ presentations. 5 4 3 2 1
10. I liked talking to the judges about my project. 5 4 3 2 1
11. I would like a more competitive science fair. 5 4 3 2 1
12. Talking to the judges helped me learn more about science. 5 4 3 2 1
13. I am more interested in a career in science because of my 5 4 3 2 1 participation in the science fair. 14. I liked being able to choose any topic that interests me. 5 4 3 2 1 15. I think there are better ways to learn about inquiry and 5 4 3 2 1 science besides doing a science fair project. If you have any other comments you would like to share, please use the back of this paper to express yourself.

49
APPENDIX H
STUDENT INTERVIEW QUESTIONS AFTER SCIENCE FAIR

50
Student Interview Questions After the Science Fair
1. Do you think the science fair has helped you learn more about how to do scientific
inquiry (problem solve)? Why or why not?
2. Do you think participation in the science fair should be mandatory or voluntary?
Why?
3. If participation in the science fair was voluntary, would you participate? Why or why
not?
4. Do you think you should be able to work with a partner or group to complete a science
fair project? Why or why not?
5. Would you like the science fair to be competitive or non-competitive? Why?
6. Do you feel talking to the judges helped you better understand your project? Why or
why not?
7. Have you become more interested in science because of your participation in the
science fair? Why or why not?
8. What was the most difficult part of your project? Do you have any suggestions that
could make this part easier for you?
9. Do you have any other comments or suggestions that you think could help the science
fair be more meaningful or fun for you?
10. Is there anything else you would like to tell me?

51
APPENDIX I
JUDGES’ SCORING RUBRIC

52
Science Fair Project Judging Scorecard
Student’s Name: Grade: Project Category: Date: Project Title: Project #
Judge’s Name: Final Score:
Supe
rior
Abo
ve A
vg.
Ave
rage
Bel
ow A
vg.
No
Evid
ence
Scientific Method 1. Presented a question that could be answered through experimentation. 4 3 2 1 0 2. Developed a hypothesis identifying a manipulated and responding variable.
4 3 2 1 0
3. Developed good procedure for testing the hypothesis, including use of constants.
4 3 2 1 0
4. Clear and thorough process for data observation and collection. 4 3 2 1 0 5. Ran sufficient trials (at least three). 4 3 2 1 0 6. Accurate experimental technique. 4 3 2 1 0 7. Derived conclusions from appropriately organized and summarized data. 4 3 2 1 0 8. Related conclusions back to the hypothesis. 4 3 2 1 0 Scientific Knowledge 9. Accessed a minimum of three, age-appropriate sources for background research.
4 3 2 1 0
10. Clearly identified and explained key scientific concepts relating to the experiment.
4 3 2 1 0
11. Used scientific principles and/or mathematical formulas correctly in the experiment.
4 3 2 1 0
Presentation 12. Neat and visually appealing. Components in the correct order. 4 3 2 1 0 13. Included key components (abstract/question, hypothesis/variables, background research, materials and procedures, data/charts and graphs, results, conclusion and discussion, acknowledgements, bibliography)
4 3 2 1 0
14. Included signed safety sheet with project. 4 3 2 1 0 Creativity 15. Investigated an original question or used an original approach or technique.
4 3 2 1 0
Total Score Strengths of Project: Opportunities for Improvement:

53
APPENDIX J
TEACHERS’ QUESTIONNAIRE

54
Science Fair Teacher Questionnaire
Teacher _________________________
Use the number code below to answer the following questions. Circle the number that best describes your view.
1- I strongly agree. 2- I agree. 3- I am neutral. 4- I disagree. 5- I strongly disagree.
1. I feel that this year’s science fair projects demonstrated a better understanding of scientific inquiry (problem solving) than last year’s projects. 5 4 3 2 1
2. I feel that this year’s science fair projects demonstrated more student interest in the field of science than last year’s projects. 5 4 3 2 1
3. I feel that the science fair is the best way for students to learn about scientific inquiry (problem solving). 5 4 3 2 1
4. I feel that the science fair promotes student interest in science for students who visit the fair. 5 4 3 2 1
5. I feel that the science fair increases student knowledge about 5 4 3 2 1 the field of science for students who visit the fair.
Please use the space below to add any comments you would like to express about the science fair.