The Effects of Rater Training on Inter-Rater Agreement · The Effects of Rater Training on...
25
FEATURE ARTICLE EFFECTS OF RATER TRAINING Mid-Western Educational Researcher •Volume 27, Issue 2 117 The Effects of Rater Training on Inter-Rater Agreement Lisa A. Pufpaff Ball State University Laura Clarke Eastern Kentucky University Ruth E. Jones Ball State University This paper addresses the effects of rater training on the rubric-based scoring of three preservice teacher candidate performance assessments. This project sought to evaluate the consistency of ratings assigned to student learning outcome measures being used for program accreditation and to explore the need for rater training in order to increase rater agreement. There were three phases during this project: (1) authentic student work was rated by department faculty members in the absence of rubric training; (2) faculty were then trained to administer rubric scoring guides; and (3) additional student work was rated by faculty after training. Inter-rater agreement was calculated pre- and post- rater training, using side-by-side comparisons. Little to no improvement in rater agreement was seen post-training. Implications and future research needs for rater training in the application of rubrics are discussed. Accountability in teacher education has driven the need for performance-based assessments evaluated using rubrics that are aligned to professional performance standards (e.g., Interstate Teacher Assessment and Support Consortium [InTASC] standards [Council of Chief State School Officers, 2013]). Rubric-based outcomes are being used to grade students and determine teacher candidate status, as well as evaluate faculty teaching, individual courses, and programs. Candidate outcomes on performance-based measures are the foundation for achieving accreditation from the Council for the Accreditation of Educator Preparation (CAEP, 2013). Rubrics are used widely in higher education (Reddy & Andrade, 2010) to support teaching and learning through formative assessment (Andrade & Du, 2005), to improve student performance (Petkov & Petkova, 2006; Reitmeier, Svendsen & Vrchota, 2004), and to contribute to program improvement (Dunbar, Brooks, & Kubicka-Miller, 2006; Knight, 2006). Yet few studies that report positive results stemming from the implementation of rubrics address the issue of the reliability of scoring derived from rubrics. There is some opinion that rubrics are inherently reliable. “Rubrics make assessments more reliable because they standardize the grading process. Every assignment is assessed using the same criteria and the impact on bias is minimized if the rubric guidelines are earnestly followed” (Hitt & Helms, 2009, p. Learning From the Dog Show Analogy section, para. 1). It has been reported that faculty believe rubrics reduce bias in grading (e.g., Powell, 2001), improve consistency and reliability of scoring (Campbell, 2005), and improve focus on specific performance criteria (Reitmeier et al., 2004).
Transcript of The Effects of Rater Training on Inter-Rater Agreement · The Effects of Rater Training on...

FEATURE ARTICLE EFFECTS OF RATER TRAINING
Mid-Western Educational Researcher •Volume 27, Issue 2 117
The Effects of Rater Training on Inter-Rater Agreement
Lisa A. Pufpaff
Ball State University
Laura Clarke
Eastern Kentucky University
Ruth E. Jones
Ball State University
This paper addresses the effects of rater training on the rubric-based scoring of three
preservice teacher candidate performance assessments. This project sought to evaluate
the consistency of ratings assigned to student learning outcome measures being used for
program accreditation and to explore the need for rater training in order to increase
rater agreement. There were three phases during this project: (1) authentic student work
was rated by department faculty members in the absence of rubric training; (2) faculty
were then trained to administer rubric scoring guides; and (3) additional student work
was rated by faculty after training. Inter-rater agreement was calculated pre- and post-
rater training, using side-by-side comparisons. Little to no improvement in rater
agreement was seen post-training. Implications and future research needs for rater
training in the application of rubrics are discussed.
Accountability in teacher education has driven the need for performance-based assessments
evaluated using rubrics that are aligned to professional performance standards (e.g., Interstate
Teacher Assessment and Support Consortium [InTASC] standards [Council of Chief State
School Officers, 2013]). Rubric-based outcomes are being used to grade students and determine
teacher candidate status, as well as evaluate faculty teaching, individual courses, and programs.
Candidate outcomes on performance-based measures are the foundation for achieving
accreditation from the Council for the Accreditation of Educator Preparation (CAEP, 2013).
Rubrics are used widely in higher education (Reddy & Andrade, 2010) to support teaching and
learning through formative assessment (Andrade & Du, 2005), to improve student performance
(Petkov & Petkova, 2006; Reitmeier, Svendsen & Vrchota, 2004), and to contribute to program
improvement (Dunbar, Brooks, & Kubicka-Miller, 2006; Knight, 2006). Yet few studies that
report positive results stemming from the implementation of rubrics address the issue of the
reliability of scoring derived from rubrics.
There is some opinion that rubrics are inherently reliable. “Rubrics make assessments more
reliable because they standardize the grading process. Every assignment is assessed using the
same criteria and the impact on bias is minimized if the rubric guidelines are earnestly followed”
(Hitt & Helms, 2009, p. Learning From the Dog Show Analogy section, para. 1). It has been
reported that faculty believe rubrics reduce bias in grading (e.g., Powell, 2001), improve
consistency and reliability of scoring (Campbell, 2005), and improve focus on specific
performance criteria (Reitmeier et al., 2004).
FEATURE ARTICLE EFFECTS OF RATER TRAINING
Mid-Western Educational Researcher •Volume 27, Issue 2 118
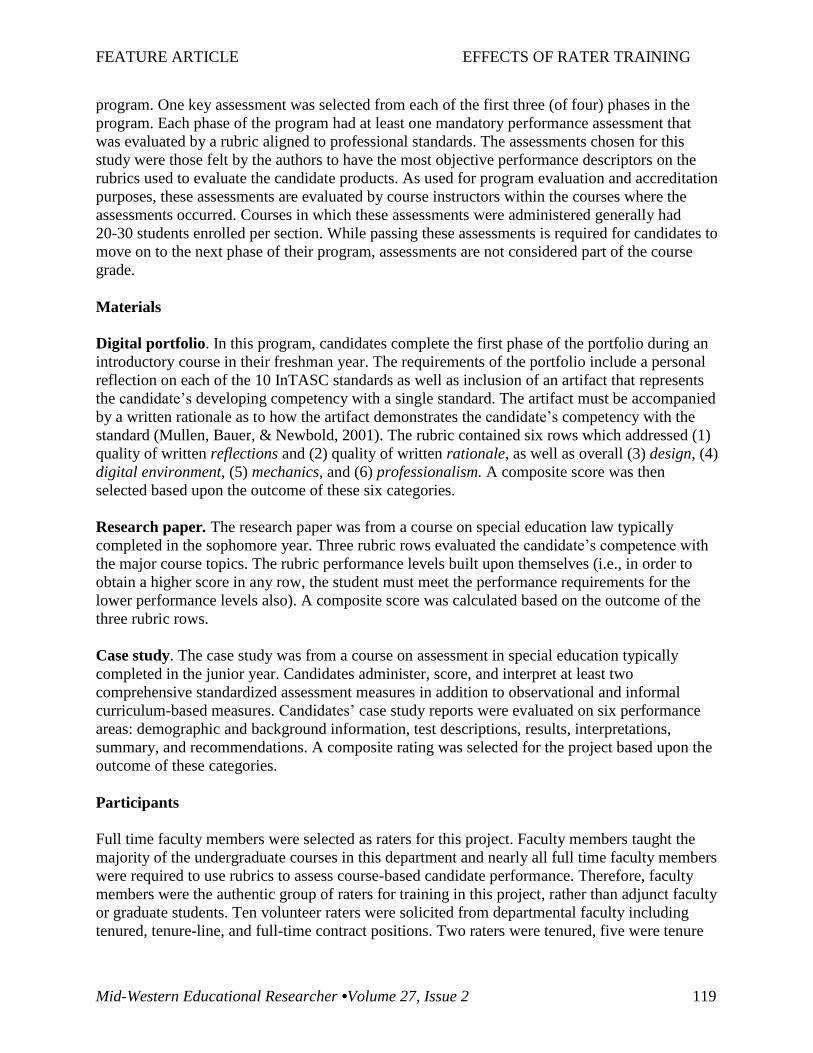
Rater reliability refers to the consistency of scores assigned by two or more independent raters of
the same product or performance (i.e., inter-rater reliability). Inter-rater reliability can be
approached in several ways. Rating accuracy is generally computed by comparing individual
raters’ scores to some measure of true score such as an expert rater’s score (Woehr & Huffcutt,
1994). Stemler (2004) suggested “consensus estimates” measure the degree to which a group of
raters give the same score to the same performance. Consensus estimates can be calculated as
percentage of total agreement and/or percentage of adjacent agreement (within one score level)
(Jonsson & Svingby, 2007). Consistency estimates examine the correlation between scores of
multiple raters (Fleenor, Fleenor, & Grossnickle, 1996).
While there are reports of strong inter-rater reliability of rubric-based scoring in higher education
settings (e.g., Dunbar et al., 2006; Hafner & Hafner, 2003), there is also evidence of poor
inter-rater reliability (Boulet, Rebbecchi, Denton, Mckinley, & Whelan, 2004; Oakleaf, 2006).
Few studies that have reported improved reliability of scoring through rubrics provided evidence
of reliability or how it was obtained. For example, Dunbar et al. (2006) described the reliability
training of the coders in their study in generic terms that could not be replicated by others, stating
that coders rated each student performance and then discussed their ratings until they reached
agreement. Rater training may be one of the most important factors for strong inter-rater
reliability (Boulet et al., 2004). More research is needed that addresses rubric reliability,
“including rater training and its contribution towards achieving inter-rater reliability” (Reddy &
Andrade, 2010, p. 446). Researchers need to report details of procedures and analyses used to
achieve strong inter-rater reliability.
Given that rubrics hold such power within academia, it seems logical that faculty should be
concerned with ensuring the reliability of rater scores and the effectiveness of rater trainings.
Without reliability, evaluation of student outcomes becomes more a matter of who is scoring,
rather than the quality of the candidate’s work (Stuhlmann, Daniel, Dellinger, Denny, & Powers,
1999). As Lovorn and Rezaei (2011) recently discovered, simply using rubrics does not
automatically increase inter-rater reliability or the accuracy of assigned scores. In an effort to
increase inter-rater reliability, it has been suggested that raters be trained on specific procedures
needed to score responses (McClellan, 2010; Stuhlmann et al., 1999).
Given the wide use and importance of rubric-based performance assessment, it appears that
rubric reliability (or lack thereof) has far-reaching implications, most importantly the impact on
candidate progress within a program of study. This paper presents the results of one department’s
efforts to improve the reliability of rubric outcomes by increasing rater agreement. The focus of
the project was rubrics used to evaluate major requirements of undergraduate preservice
teachers. The purpose of the project was to evaluate the consistency of ratings assigned to
student learning outcomes that were being used for accreditation purposes, by determining
existing levels of rater agreement on performance-based assessments and then exploring the
effectiveness of rater training to improve rater agreement.
Pre-Training Methods
This project was completed in three phases. During pre-training, three assessments were selected
from across major requirements in an undergraduate special education teacher preparation
FEATURE ARTICLE EFFECTS OF RATER TRAINING
Mid-Western Educational Researcher •Volume 27, Issue 2 119
program. One key assessment was selected from each of the first three (of four) phases in the
program. Each phase of the program had at least one mandatory performance assessment that
was evaluated by a rubric aligned to professional standards. The assessments chosen for this
study were those felt by the authors to have the most objective performance descriptors on the
rubrics used to evaluate the candidate products. As used for program evaluation and accreditation
purposes, these assessments are evaluated by course instructors within the courses where the
assessments occurred. Courses in which these assessments were administered generally had
20-30 students enrolled per section. While passing these assessments is required for candidates to
move on to the next phase of their program, assessments are not considered part of the course
grade.
Materials
Digital portfolio. In this program, candidates complete the first phase of the portfolio during an
introductory course in their freshman year. The requirements of the portfolio include a personal
reflection on each of the 10 InTASC standards as well as inclusion of an artifact that represents
the candidate’s developing competency with a single standard. The artifact must be accompanied
by a written rationale as to how the artifact demonstrates the candidate’s competency with the
standard (Mullen, Bauer, & Newbold, 2001). The rubric contained six rows which addressed (1)
quality of written reflections and (2) quality of written rationale, as well as overall (3) design, (4)
digital environment, (5) mechanics, and (6) professionalism. A composite score was then
selected based upon the outcome of these six categories.
Research paper. The research paper was from a course on special education law typically
completed in the sophomore year. Three rubric rows evaluated the candidate’s competence with
the major course topics. The rubric performance levels built upon themselves (i.e., in order to
obtain a higher score in any row, the student must meet the performance requirements for the
lower performance levels also). A composite score was calculated based on the outcome of the
three rubric rows.
Case study. The case study was from a course on assessment in special education typically
completed in the junior year. Candidates administer, score, and interpret at least two
comprehensive standardized assessment measures in addition to observational and informal
curriculum-based measures. Candidates’ case study reports were evaluated on six performance
areas: demographic and background information, test descriptions, results, interpretations,
summary, and recommendations. A composite rating was selected for the project based upon the
outcome of these categories.
Participants
Full time faculty members were selected as raters for this project. Faculty members taught the
majority of the undergraduate courses in this department and nearly all full time faculty members
were required to use rubrics to assess course-based candidate performance. Therefore, faculty
members were the authentic group of raters for training in this project, rather than adjunct faculty
or graduate students. Ten volunteer raters were solicited from departmental faculty including
tenured, tenure-line, and full-time contract positions. Two raters were tenured, five were tenure

FEATURE ARTICLE EFFECTS OF RATER TRAINING
Mid-Western Educational Researcher •Volume 27, Issue 2 120
line, and three were full-time contract faculty. Years of experience in their current position
ranged from 0-28 years with an average of 8.2 years. Raters were asked to self-report on their
level of experience with rubrics from among the following options: novice (I have had little
experience using this type of rubric to evaluate this type of assignment), experienced (I have
ample experience using this type of rubric to evaluate candidate assignments), and expert (I have
ample experience creating and using rubrics to evaluate candidate assignments for the purposes
of data collection on candidate performance). Three participants rated themselves as experts, six
as experienced, and one as novice.
Procedures
Two exemplars were selected from each of the three assessments described above. Exemplars
were chosen at random from the previous academic year. For the purposes of this project, the
original course instructor ratings were considered the true scores because course instructors were
the raters for these assessments. All rubrics used in this program evaluated candidate
performance on a four-point scale of unsatisfactory, basic, proficient, and distinguished. Each
rubric row provided a narrative description of desired candidate performance at each
performance level for each dimension of performance being rated. The rubrics used in this study
are proprietary and therefore cannot be shared in their entirety. A single rubric row from the
Case Study is provided later in the paper as a sample.
Raters were given six assignments (two exemplars per three assessments) with candidate
identifier information removed, a blank rater form for each assignment, and the rubric to
accompany each assignment. The first phase of this study functioned as a pre-test to determine
the baseline rater agreement prior to rater training. Raters were not provided any training specific
to the assessments. Each rater was provided with a sealed envelope of six assignments that had
been blinded. The envelope contained a letter that detailed the rater’s tasks. The letter asked each
rater to review and score the enclosed assignments and return them to the primary researcher’s
mailbox within ten business days. Each assignment in the rater’s envelope included the blinded
assignment, the assignment rubric, and a rater evaluation form where raters included their level
of experience with using rubrics and any questions they had when applying the rubric. All raters
completed their scoring individually and returned them to the first author’s mailbox as requested.
Data were analyzed in terms of rater agreement (Woehr & Huffcutt, 1994) and percent
agreement (Stemler, 2004). Rater agreement was determined by comparing the participants’
scores to the true (or original) rating provided by the course instructor. Percent agreement was
calculated by determining the percentage of participants who agreed with the true score. Rater
agreement was further examined in terms of scores that were +/- one acceptable performance
level of the true score (Jonsson & Svingby, 2007). A difference of one acceptable performance
level was determined based upon the potential effect on the candidate’s overall outcome.
Candidates must achieve a composite score of basic (or higher) on all performance-based
assessments. So, for example, if the true score was basic, a participant score of proficient would
be acceptable (because it would not change the overall outcome for the candidate) whereas a
participant score of unsatisfactory would not be acceptable (because it would change the
candidate’s status in the program). Percent agreement was then also calculated for a combination
FEATURE ARTICLE EFFECTS OF RATER TRAINING
Mid-Western Educational Researcher •Volume 27, Issue 2 121
of participants who agreed with the true score and those who assigned a score that was +/- one
acceptable performance level of the true score.
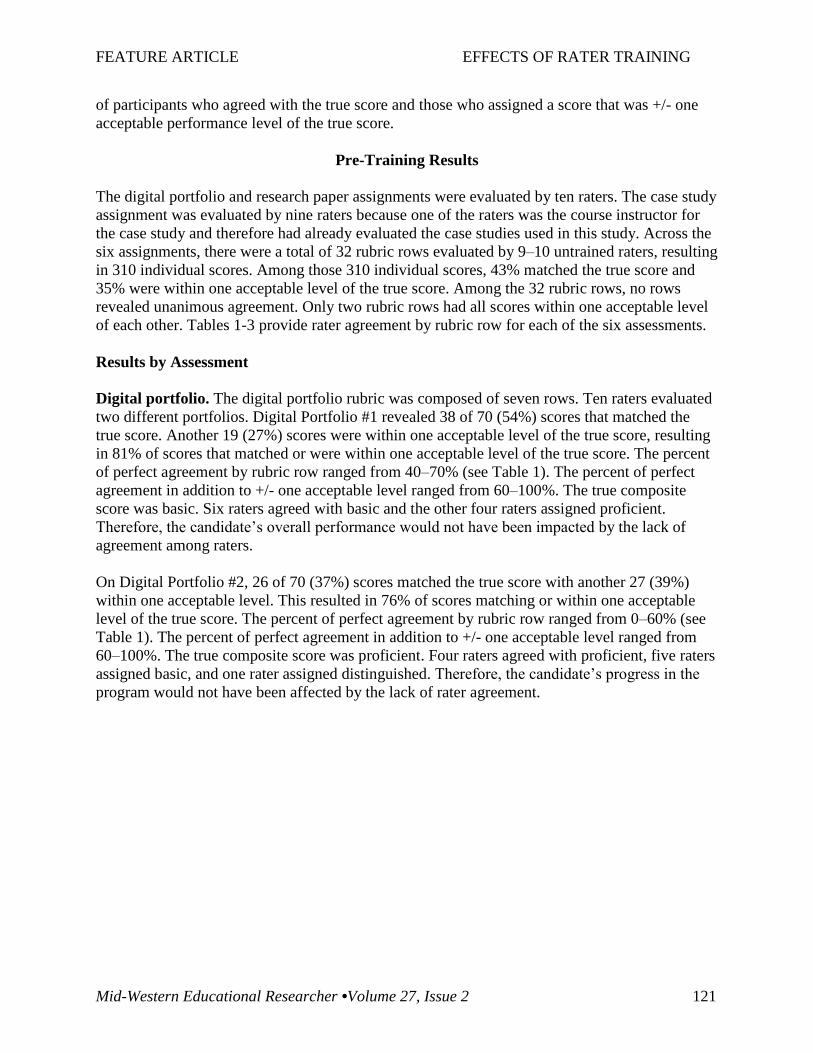
Pre-Training Results
The digital portfolio and research paper assignments were evaluated by ten raters. The case study
assignment was evaluated by nine raters because one of the raters was the course instructor for
the case study and therefore had already evaluated the case studies used in this study. Across the
six assignments, there were a total of 32 rubric rows evaluated by 9–10 untrained raters, resulting
in 310 individual scores. Among those 310 individual scores, 43% matched the true score and
35% were within one acceptable level of the true score. Among the 32 rubric rows, no rows
revealed unanimous agreement. Only two rubric rows had all scores within one acceptable level
of each other. Tables 1-3 provide rater agreement by rubric row for each of the six assessments.
Results by Assessment
Digital portfolio. The digital portfolio rubric was composed of seven rows. Ten raters evaluated
two different portfolios. Digital Portfolio #1 revealed 38 of 70 (54%) scores that matched the
true score. Another 19 (27%) scores were within one acceptable level of the true score, resulting
in 81% of scores that matched or were within one acceptable level of the true score. The percent
of perfect agreement by rubric row ranged from 40–70% (see Table 1). The percent of perfect
agreement in addition to +/- one acceptable level ranged from 60–100%. The true composite
score was basic. Six raters agreed with basic and the other four raters assigned proficient.
Therefore, the candidate’s overall performance would not have been impacted by the lack of
agreement among raters.
On Digital Portfolio #2, 26 of 70 (37%) scores matched the true score with another 27 (39%)
within one acceptable level. This resulted in 76% of scores matching or within one acceptable
level of the true score. The percent of perfect agreement by rubric row ranged from 0–60% (see
Table 1). The percent of perfect agreement in addition to +/- one acceptable level ranged from
60–100%. The true composite score was proficient. Four raters agreed with proficient, five raters
assigned basic, and one rater assigned distinguished. Therefore, the candidate’s progress in the
program would not have been affected by the lack of rater agreement.
FEATURE ARTICLE EFFECTS OF RATER TRAINING
Mid-Western Educational Researcher •Volume 27, Issue 2 122
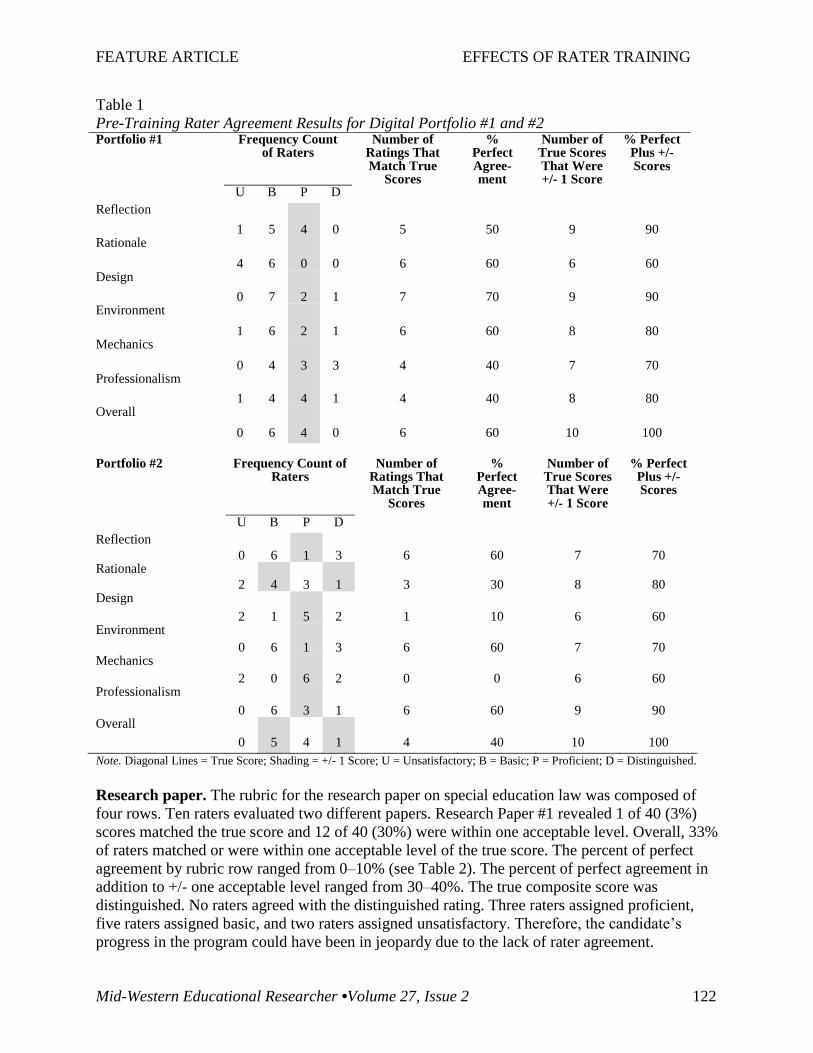
Table 1
Pre-Training Rater Agreement Results for Digital Portfolio #1 and #2 Portfolio #1 Frequency Count
of Raters Number of
Ratings That Match True
Scores
% Perfect Agree-ment
Number of True Scores That Were +/- 1 Score
% Perfect Plus +/- Scores
U B P D
Reflection
1 5 4 0 5 50 9 90 Rationale
4 6 0 0 6 60 6 60 Design
0 7 2 1 7 70 9 90 Environment
1 6 2 1 6 60 8 80 Mechanics
0 4 3 3 4 40 7 70 Professionalism
1 4 4 1 4 40 8 80 Overall
0 6 4 0 6 60 10 100
Portfolio #2 Frequency Count of
Raters Number of
Ratings That Match True
Scores
% Perfect Agree-ment
Number of True Scores That Were +/- 1 Score
% Perfect Plus +/- Scores
U B P D
Reflection
0 6 1 3 6 60 7 70 Rationale
2 4 3 1 3 30 8 80 Design
2 1 5 2 1 10 6 60 Environment
0 6 1 3 6 60 7 70 Mechanics
2 0 6 2 0 0 6 60 Professionalism
0 6 3 1 6 60 9 90 Overall
0 5 4 1 4 40 10 100
Note. Diagonal Lines = True Score; Shading = +/- 1 Score; U = Unsatisfactory; B = Basic; P = Proficient; D = Distinguished.
Research paper. The rubric for the research paper on special education law was composed of
four rows. Ten raters evaluated two different papers. Research Paper #1 revealed 1 of 40 (3%)
scores matched the true score and 12 of 40 (30%) were within one acceptable level. Overall, 33%
of raters matched or were within one acceptable level of the true score. The percent of perfect
agreement by rubric row ranged from 0–10% (see Table 2). The percent of perfect agreement in
addition to +/- one acceptable level ranged from 30–40%. The true composite score was
distinguished. No raters agreed with the distinguished rating. Three raters assigned proficient,
five raters assigned basic, and two raters assigned unsatisfactory. Therefore, the candidate’s
progress in the program could have been in jeopardy due to the lack of rater agreement.

FEATURE ARTICLE EFFECTS OF RATER TRAINING
Mid-Western Educational Researcher •Volume 27, Issue 2 123
Research Paper #2 had more consistent scores with 6 of 40 (15%) matching the true score and
14 of 40 (35%) within one acceptable level of the true score. Overall, 50% of raters matched or
were within one acceptable level of the true score. The percent of perfect agreement by rubric
row ranged from 0–30% (see Table 2). The percent of perfect agreement in addition to +/- one
acceptable level ranged from 20–70%. The true composite score was proficient. Only one rater
agreed with proficient, while six raters assigned basic, and three raters assigned unsatisfactory.
The raters found this assignment of much lower quality than the true score. Therefore, the
candidate’s progress in the program would have been affected by the lack of rater agreement.
Table 2
Pre-Training Rater Agreement Results for Research Paper #1 and #2
Note. Diagonal Lines = True Score; Shading = +/- 1 Score; U = Unsatisfactory; B = Basic; P = Proficient; D = Distinguished.
Case study. The case study rubric was composed of five rows. Nine raters evaluated two
different case studies. Case Study #1 revealed 14 of 45 (31%) scores matched the true score with
another 25 (56%) within one acceptable level of the true score. This resulted in 87% of the scores
matching or within one acceptable level of the true score. The percent of perfect agreement by
rubric row ranged from 0–77.8% (see Table 3). The percent of perfect agreement in addition to
+/- one acceptable level ranged from 77.8–100%. The true composite score was distinguished.
Only one rater agreed with distinguished, while six raters assigned proficient and two raters
assigned basic. Therefore, the candidate’s progress in the program would not have been affected
by the lack of rater agreement.
Research Paper #1 Frequency Count of Raters
Number of Ratings That Match True
Scores
% Perfect Agree-ment
Number of True Scores That Were +/- 1 Score
% Perfect Plus +/- Scores
U B P D
Row A
3 4 2 1 1 10 3 30
Row B
2 4 4 0 0 0 4 40
Row C
2 5 3 0 0 0 3 30
Overall
2 5 3 0 0 0 3 30
Research Paper #2
Frequency Count of Raters
Number of Ratings That Match True
Scores
% Perfect Agree-ment
Number of True Scores That Were +/- 1 Score
% Perfect Plus +/- Scores
U B P D
Row A 4 4 2 0 0 0 2 20 Row B 3 4 2 1 2 20 7 70 Row C 6 3 1 0 3 30 4 40 Overall 3 6 1 0 1 10 7 70
FEATURE ARTICLE EFFECTS OF RATER TRAINING
Mid-Western Educational Researcher •Volume 27, Issue 2 124
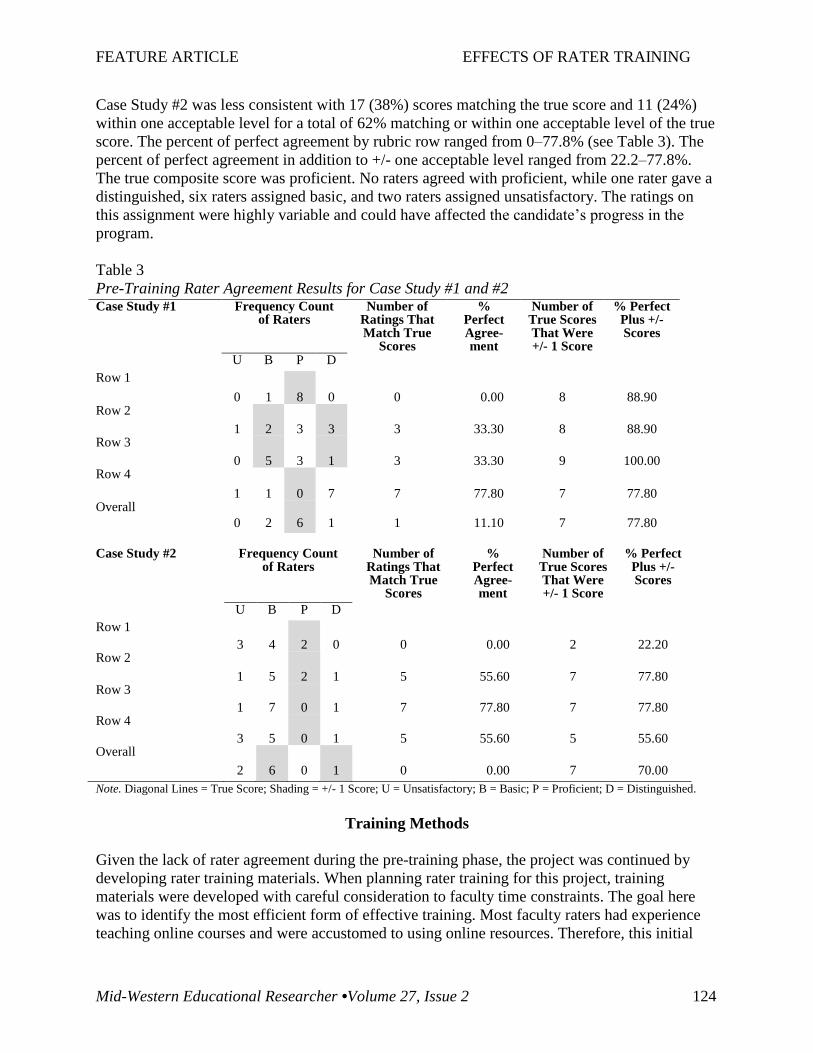
Case Study #2 was less consistent with 17 (38%) scores matching the true score and 11 (24%)
within one acceptable level for a total of 62% matching or within one acceptable level of the true
score. The percent of perfect agreement by rubric row ranged from 0–77.8% (see Table 3). The
percent of perfect agreement in addition to +/- one acceptable level ranged from 22.2–77.8%.
The true composite score was proficient. No raters agreed with proficient, while one rater gave a
distinguished, six raters assigned basic, and two raters assigned unsatisfactory. The ratings on
this assignment were highly variable and could have affected the candidate’s progress in the
program.
Table 3
Pre-Training Rater Agreement Results for Case Study #1 and #2
Case Study #2
Frequency Count
of Raters
Number of
Ratings That Match True
Scores
%
Perfect Agree-ment
Number of True Scores That Were +/- 1 Score
% Perfect
Plus +/- Scores
U B P D
Row 1 3 4 2 0 0 0.00 2 22.20 Row 2 1 5 2 1 5 55.60 7 77.80 Row 3 1 7 0 1 7 77.80 7 77.80 Row 4 3 5 0 1 5 55.60 5 55.60 Overall 2 6 0 1 0 0.00 7 70.00
Note. Diagonal Lines = True Score; Shading = +/- 1 Score; U = Unsatisfactory; B = Basic; P = Proficient; D = Distinguished.
Training Methods
Given the lack of rater agreement during the pre-training phase, the project was continued by
developing rater training materials. When planning rater training for this project, training
materials were developed with careful consideration to faculty time constraints. The goal here
was to identify the most efficient form of effective training. Most faculty raters had experience
teaching online courses and were accustomed to using online resources. Therefore, this initial
Case Study #1 Frequency Count of Raters
Number of Ratings That Match True
Scores
% Perfect Agree-ment
Number of True Scores That Were +/- 1 Score
% Perfect Plus +/- Scores
U B P D
Row 1
0 1 8 0 0 0.00 8 88.90 Row 2 1 2 3 3 3 33.30 8 88.90 Row 3 0 5 3 1 3 33.30 9 100.00 Row 4
1 1 0 7 7 77.80 7 77.80 Overall 0 2 6 1 1 11.10 7 77.80

FEATURE ARTICLE EFFECTS OF RATER TRAINING
Mid-Western Educational Researcher •Volume 27, Issue 2 125
project sought to determine if rater agreement could be improved through the implementation of
online training materials that faculty completed independently. The same faculty participants
were used for this phase of the project.
Materials
Expanded rubric. The expanded rubric had additional details added to each row of the original
rubric including requirements of the assignment; knowledge, skills, dispositions, and/or
performances from professional standards; written directions provided to candidates; as well as
definitions of terms within the rubric. The expanded rubrics included descriptors and precise
vocabulary in an effort to provide raters with a more standardized view of expected candidate
performance. Terms were defined and concepts were explained in detail so that faculty raters
who did not teach a particular course had a greater chance of applying the rubric requirements to
candidate work accurately and consistently. A sample of an original rubric row and that same
row in an expanded version is provided below.
Original rubric row from the Case Study rubric Performance Dimension
Unsatisfactory Basic Proficient Distinguished
Recommendations for instruction
Recommendations are missing or poorly developed, do not reflect the evaluation data, or are not appropriate to the strengths and needs of the student.
Recommendations reflect data but are general or not appropriate to the strengths and needs of the student.
Recommendations reflect data and are appropriate to the strengths and needs of the student.
Recommendations reflect data, are appropriate to the strengths and needs of the student, and are prescriptive.
Expanded version of the same rubric row Recommendations for instruction
Recommendations are missing or poorly developed, do not reflect the evaluation data, or are not appropriate to the strengths and needs of the student.
Recommendations reflect data but are general or not appropriate to the strengths and needs of the student
Recommendations reflect data and are appropriate to the strengths and needs of the student
Recommendations reflect data, are appropriate to the strengths and needs of the student, and are prescriptive.
Recommendations should be practical and directed to both teacher and parent. Recommendations should be based on strengths (need for enrichment) AND on growth areas (need for intervention and/or remediation). Candidates are instructed to give specific activities, websites, etc. to demonstrate possible instructional strategies. Recommendations must be numbered, organized (school/home; skill area, etc.), linked to test results, and prioritized. Vocabulary: Prescriptive: The recommendations should be targeted directly to the need or strength and at the appropriate level. For example, if the child exhibits reading comprehension deficits, the cause should be identified and addressed (fluency, literal comprehension, inferential comprehension, etc.).
Rater Comments:

FEATURE ARTICLE EFFECTS OF RATER TRAINING
Mid-Western Educational Researcher •Volume 27, Issue 2 126
Narrated presentations. Narrated PowerPoint presentations accompanied the expanded rubrics.
Each presentation included an introduction to the particular assignment, background information
about the purpose of the assignment, and a detailed explanation for each rubric row, elaborating
on specific expectations and definitions for desired candidate performance. Presentations varied
in length. The portfolio presentation included 17 slides and lasted 11 minutes and 30 seconds.
The research paper presentation had 10 slides and was 6 minutes in length. The case study
presentation had 10 slides and lasted 5 minutes and 30 seconds. The portfolio presentation was
lengthier than the others due to the larger number of rubric rows. An example of the script used
in the narration for the sample rubric row above was:
The final rubric row is dedicated to recommendations. Recommendations are to be
clearly tied to data from previous sections. They should reflect strengths and weaknesses
as identified in specific assessments. Prescriptive recommendations are the end of the
breadcrumb trail so to speak that has been laid in succeeding information. They are
targeted with regards to identified specific skill weaknesses and offer appropriate
suggestions for remediation and practice.
Follow-up survey. A survey was created by the authors to obtain feedback from participants
following the training. The survey asked participants to provide specific information about the
length of time spent interacting with the training materials and length of time spent scoring the
assignments. The majority of the survey focused on the participants’ views of the social validity
of the training materials. The complete survey is provided in Appendix A.
Procedures
The training phase of the study required participants to view the training materials on an
individual basis and then repeat evaluation of the assessments with six different exemplars. Each
rater was provided with a sealed envelope of assignments that had been blinded. The envelope
contained a letter that detailed the tasks to be completed. The letter asked each rater to go to a
specially designed Blackboard™ site that included the training materials, to read the expanded
rubrics, to watch the accompanying narrated PowerPoint presentations, and then to score the six
enclosed assignments.
Each assignment in the rater’s envelope included the expanded rubric and a rater evaluation
form. Raters were asked to return the scored assignments within ten business days to the primary
researcher’s mailbox and to complete the follow-up survey.
Training Results
Across the six assignments, there were a total of 32 rubric rows evaluated by 9–10 trained raters
resulting in 310 individual scores. Among those 310 individual scores, 43% matched the true
score and 32% were within one acceptable level of the true score. Among the 32 rubric rows, no
rows revealed unanimous agreement. Only two rubric rows had all scores within one acceptable
level of each other.
FEATURE ARTICLE EFFECTS OF RATER TRAINING
Mid-Western Educational Researcher •Volume 27, Issue 2 127
Results by Assessment
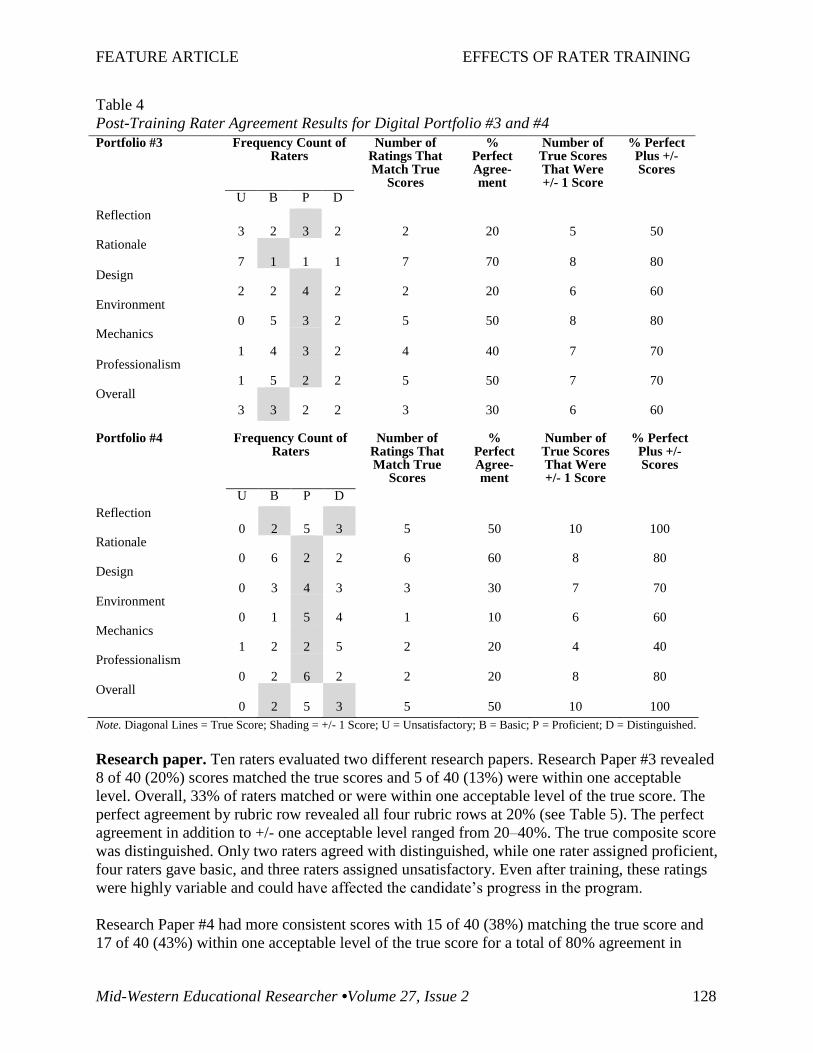
Digital portfolio. Ten raters evaluated two different digital portfolios. Digital Portfolio #3
revealed 28 of 70 (40%) scores that matched the true score. Another 15 (21%) scores were
within one acceptable level of the true score, resulting in 61% of scores that matched or were
within one acceptable level of the true score. The percent of perfect agreement by rubric row
ranged from 20–70% (see Table 4). The percent of perfect agreement in addition to +/- one
acceptable level ranged from 50–80%. The true composite score was unsatisfactory. Three raters
agreed with unsatisfactory, while three raters gave a basic, two raters assigned proficient, and
two raters assigned distinguished. In spite of training, the composite ratings on this assignment
were highly variable and could have affected the candidate’s progress in the program.
On Digital Portfolio #4, 24 of 70 (34%) scores matched the true score with another 29 (41%)
within one acceptable level. This resulted in 76% of scores matching or within one acceptable
level of the true score. The perfect agreement by rubric row ranged from 10–60% (see Table 4).
The perfect agreement in addition to +/- one acceptable level ranged from 40–100%. The true
composite score was proficient. Five raters agreed with proficient, while two raters gave a basic,
and three raters assigned distinguished. These ratings demonstrated more uniformity than for
Digital Portfolio #3 and would not have affected the candidate’s progress in the program.
FEATURE ARTICLE EFFECTS OF RATER TRAINING
Mid-Western Educational Researcher •Volume 27, Issue 2 128
Table 4
Post-Training Rater Agreement Results for Digital Portfolio #3 and #4
Portfolio #4 Frequency Count of
Raters Number of
Ratings That Match True
Scores
% Perfect Agree-ment
Number of True Scores That Were +/- 1 Score
% Perfect Plus +/- Scores
U B P D
Reflection
0 2 5 3 5 50 10 100 Rationale
0 6 2 2 6 60 8 80 Design
0 3 4 3 3 30 7 70 Environment
0 1 5 4 1 10 6 60 Mechanics
1 2 2 5 2 20 4 40 Professionalism
0 2 6 2 2 20 8 80 Overall
0 2 5 3 5 50 10 100
Note. Diagonal Lines = True Score; Shading = +/- 1 Score; U = Unsatisfactory; B = Basic; P = Proficient; D = Distinguished.
Research paper. Ten raters evaluated two different research papers. Research Paper #3 revealed
8 of 40 (20%) scores matched the true scores and 5 of 40 (13%) were within one acceptable
level. Overall, 33% of raters matched or were within one acceptable level of the true score. The
perfect agreement by rubric row revealed all four rubric rows at 20% (see Table 5). The perfect
agreement in addition to +/- one acceptable level ranged from 20–40%. The true composite score
was distinguished. Only two raters agreed with distinguished, while one rater assigned proficient,
four raters gave basic, and three raters assigned unsatisfactory. Even after training, these ratings
were highly variable and could have affected the candidate’s progress in the program.
Research Paper #4 had more consistent scores with 15 of 40 (38%) matching the true score and
17 of 40 (43%) within one acceptable level of the true score for a total of 80% agreement in
Portfolio #3 Frequency Count of Raters
Number of Ratings That Match True
Scores
% Perfect Agree-ment
Number of True Scores That Were +/- 1 Score
% Perfect Plus +/- Scores
U B P D
Reflection
3 2 3 2 2 20 5 50 Rationale
7 1 1 1 7 70 8 80 Design
2 2 4 2 2 20 6 60 Environment
0 5 3 2 5 50 8 80 Mechanics
1 4 3 2 4 40 7 70 Professionalism
1 5 2 2 5 50 7 70 Overall
3 3 2 2 3 30 6 60

FEATURE ARTICLE EFFECTS OF RATER TRAINING
Mid-Western Educational Researcher •Volume 27, Issue 2 129
matching or within one acceptable level of the true score. The perfect agreement by rubric row
ranged from 30–50% (see Table 5). The perfect agreement in addition to +/- one acceptable level
ranged from 70–100%. The true composite score was proficient. Three raters agreed with
proficient, while one rater assigned distinguished. Yet three raters gave basic and three raters
assigned unsatisfactory. Even after training, these ratings were highly variable and could have
affected the candidate’s progress in the program.
Table 5
Post-Training Rater Agreement Results for Research Paper #3 and #4
Research Paper #4 Frequency Count of
Raters Number of
Ratings That Match True
Scores
% Perfect Agree-ment
Number of True Scores That Were +/- 1 Score
% Perfect Plus +/- Scores
U B P D
Row A 0 5 3 2 3 30 10 100 Row B 2 2 4 2 4 40 8 80 Row C 2 5 2 1 5 50 7 70 Overall 3 3 3 1 3 30 7 70
Note. Diagonal Lines = True Score; Shading = +/- 1 Score; U = Unsatisfactory; B = Basic; P = Proficient; D = Distinguished.
Case study. Nine raters evaluated two different case studies. Case Study #3 revealed 30 of 45
(67%) scores matched the true scores with another 11 (24%) within one acceptable level of the
true score. This resulted in 91% of the scores matching or within one acceptable level of the true
score. The perfect agreement by rubric row ranged from 44.4–88.9% (see Table 6). The perfect
agreement in addition to +/- one acceptable level ranged from 77.8–100%. The true composite
score was distinguished. Six raters agreed with distinguished, while the other three raters
assigned proficient. For accountability purposes, there is no real difference between a composite
rating of distinguished versus proficient, revealing very high agreement among raters on this
assignment.
Case Study #4 was less consistent with 12 (27%) scores matching the true score and 21 (47%)
within one acceptable level for a total of 73% matching or within one level of the original score.
The perfect agreement by rubric row ranged from 0–55.6% (see Table 6). The perfect agreement
Research Paper #3 Frequency Count of Raters
Number of Ratings That Match True
Scores
% Perfect Agree-ment
Number of True Scores That Were +/- 1 Score
% Perfect Plus +/- Scores
U B P D
Row A 2 4 2 2 2 20 4 40 Row B 5 1 2 2 2 20 4 40 Row C 3 5 0 2 2 20 2 20 Overall 3 4 1 2 2 20 3 30

FEATURE ARTICLE EFFECTS OF RATER TRAINING
Mid-Western Educational Researcher •Volume 27, Issue 2 130
in addition to +/- one acceptable level ranged from 66.7–88.9%. The true composite score was
proficient. Five raters agreed with proficient, while three raters assigned basic, and one assigned
unsatisfactory. The unsatisfactory rating could have impacted the candidate’s progress in the
program.
Table 6
Post-Training Rater Agreement Results for Case Study #3 and #4
Case Study #4 Frequency Count of
Raters Number of
Ratings That Match True
Scores
% Perfect Agree-ment
Number of True Scores That Were +/- 1 Score
% Perfect Plus +/- Scores
U B P D
Row 1 2 3 4 0 0 0.00 4 44.40 Row 2 1 0 8 0 0 0.00 8 88.90 Row 3 2 3 3 1 3 33.30 7 77.80 Row 4 1 4 2 2 4 44.40 6 66.70 Overall 1 3 5 0 5 55.60 8 88.90
Note. Diagonal Lines = True Score; Shading = +/- 1 Score; U = Unsatisfactory; B = Basic; P = Proficient; D = Distinguished.
Overall Results
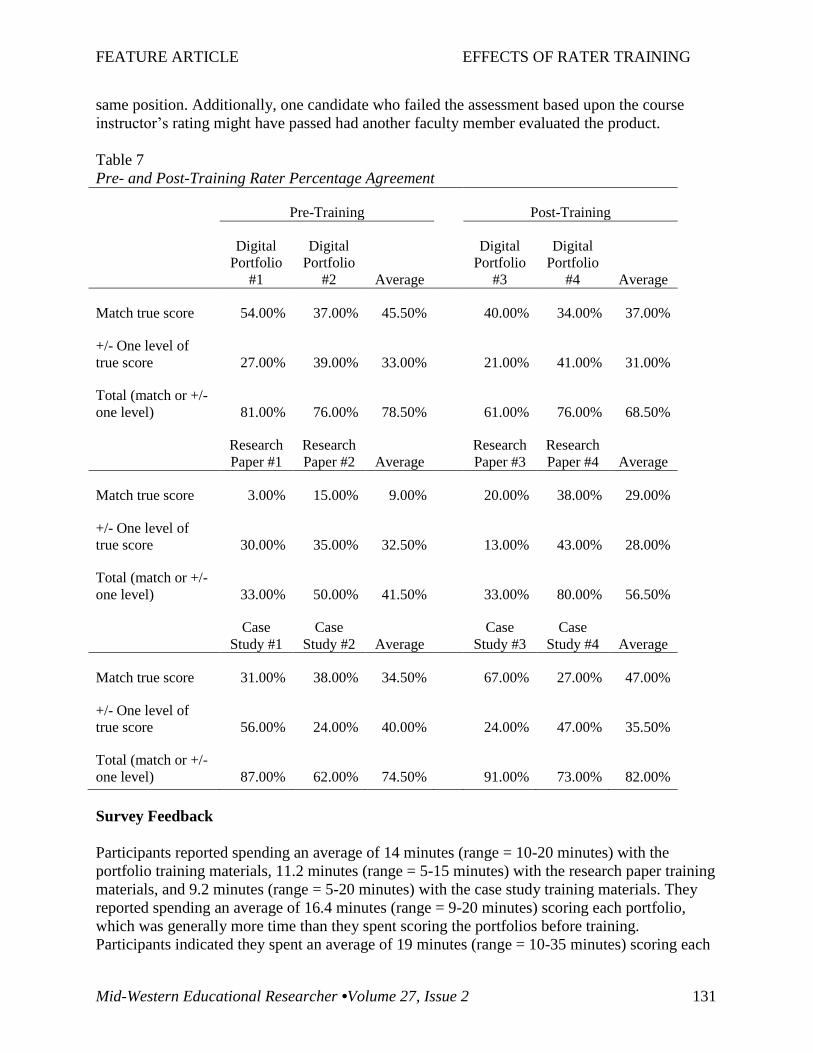
A side-by-side comparison of matching scores pre- and post-training revealed little improvement
in inter-rater agreement after training (see Table 7). Average perfect agreement and +/- one
acceptable level across rubric rows improved post-training for the research paper and the case
study, but decreased for the digital portfolio.
In terms of actual effect on candidate outcome, there were no differences post-training. The
baseline ratings revealed that three candidates who passed their assessment with a rating of basic
or higher by the course instructor might have failed the assessment had another faculty member
evaluated the product. Post-training there were still three candidates who would have been in the
Case Study #3 Frequency Count of Raters
Number of Ratings That Match True
Scores
% Perfect Agree-ment
Number of True Scores That Were +/- 1 Score
% Perfect Plus +/- Scores
U B P D
Row 1 1 0 4 4 4 44.40 8 88.90 Row 2 0 2 1 6 6 66.70 7 77.80 Row 3 0 1 2 6 6 66.70 8 88.90 Row 4 0 0 1 8 8 88.90 9 100.00 Overall 0 0 3 6 6 66.70 9 100.00
FEATURE ARTICLE EFFECTS OF RATER TRAINING
Mid-Western Educational Researcher •Volume 27, Issue 2 131
same position. Additionally, one candidate who failed the assessment based upon the course
instructor’s rating might have passed had another faculty member evaluated the product.
Table 7
Pre- and Post-Training Rater Percentage Agreement
Pre-Training Post-Training
Digital
Portfolio
#1
Digital
Portfolio
#2 Average
Digital
Portfolio
#3
Digital
Portfolio
#4 Average
Match true score 54.00% 37.00% 45.50% 40.00% 34.00% 37.00%
+/- One level of
true score 27.00% 39.00% 33.00% 21.00% 41.00% 31.00%
Total (match or +/-
one level) 81.00% 76.00% 78.50% 61.00% 76.00% 68.50%
Research
Paper #1
Research
Paper #2 Average
Research
Paper #3
Research
Paper #4 Average
Match true score 3.00% 15.00% 9.00% 20.00% 38.00% 29.00%
+/- One level of
true score 30.00% 35.00% 32.50% 13.00% 43.00% 28.00%
Total (match or +/-
one level) 33.00% 50.00% 41.50% 33.00% 80.00% 56.50%
Case
Study #1
Case
Study #2 Average
Case
Study #3
Case
Study #4 Average
Match true score 31.00% 38.00% 34.50% 67.00% 27.00% 47.00%
+/- One level of
true score 56.00% 24.00% 40.00% 24.00% 47.00% 35.50%
Total (match or +/-
one level) 87.00% 62.00% 74.50% 91.00% 73.00% 82.00%
Survey Feedback
Participants reported spending an average of 14 minutes (range = 10-20 minutes) with the
portfolio training materials, 11.2 minutes (range = 5-15 minutes) with the research paper training
materials, and 9.2 minutes (range = 5-20 minutes) with the case study training materials. They
reported spending an average of 16.4 minutes (range = 9-20 minutes) scoring each portfolio,
which was generally more time than they spent scoring the portfolios before training.
Participants indicated they spent an average of 19 minutes (range = 10-35 minutes) scoring each

FEATURE ARTICLE EFFECTS OF RATER TRAINING
Mid-Western Educational Researcher •Volume 27, Issue 2 132
research paper, which was more time than they spent scoring before the training. Finally,
participants reported spending an average of 17 minutes (range = 10-40 minutes) scoring each
case study, which was more time than they spent on each before the training.
Participants reported that they were more comfortable scoring all three types of assignments
following the training than they were before the training, and they all rated the clarity of the
training materials as excellent (40%) or good (60%) with one comment that summarized their
feedback, “Many of my questions were answered and I was clearer on the specific expectations
associated with the rows.”
All participants rated the usefulness of the training materials for understanding the assignments
as excellent (60%) or good (40%) and the length of the training materials in relationship to their
usefulness as excellent (20%) or good (80%). A couple of comments related to the length of the
training materials served to support the authors’ attempts to minimize the time commitment:
“long enough to explain, short enough not to bore or be too detailed” and “portfolio was a little
lengthy—I wanted to speed it up just a bit.”
Participants generally felt that the training materials were useful in terms of addressing their
questions or concerns related to scoring the assignments prior to training with 60% indicating
usefulness as excellent, 20% as good, and 20% as undecided. Comments such as “Training
materials explained much more detail about expectations and gave a common understanding not
held before” supported the indication of usefulness.
When asked to rate their self-perceived level of reliability in interpreting the rubrics following
training as compared to before training, participants indicated improvement with 20% reporting
highly reliable, 60% reporting more reliable, and only 20% reporting undecided. One participant
added, “I know the training helped, but I also think that having the first rating experience also
helped.”
Finally, participants were asked for their feedback on the type of training they felt would be most
beneficial for instructors new to the process of using an existing rubric to evaluate an
assignment. They were given a closed set of options:
expanded rubric with additional details about the assignment
PowerPoint presentation with narrator explanation
expanded rubric and narrated PowerPoint presentation
handout with additional details about the assignment
face-to-face training with an experienced rater
and directed to choose all training options that they felt would be beneficial. The majority of
participants (60%) selected narrated PowerPoint presentation with supporting comments such as
“concise and at my own pace” and “no one likes handouts; no one really likes to read.” But the
other options for training were also selected as being potentially beneficial, with 40% of
participants selecting the expanded rubric, the expanded rubric plus narrated PowerPoint
presentation, and the face-to-face training. Most comments addressed the need for face-to-face
training in conjunction with the other types of training, for example, “face-to-face after having
FEATURE ARTICLE EFFECTS OF RATER TRAINING
Mid-Western Educational Researcher •Volume 27, Issue 2 133
expanded rubric and PowerPoint training gives assessor opportunity to ask questions that still
may not be clear.”
Discussion
Results of this study found that a time efficient, digital method of rater training had little impact
on inter-rater agreement among full time faculty. Inter-rater agreement was calculated using
consensus estimates (Stemler, 2004) whereby faculty ratings were compared to a true score (i.e.,
original rating assigned by the course instructor) on two exemplars each of three different
assessments used as decision point requirements to determine candidates’ progress in their
teacher education program. Consensus estimates of 70% or higher are generally accepted as an
indication of inter-rater reliability (Stemler, 2004). Although results were calculated by rubric
row for each assessment, the composite rating for each assessment determines the candidate’s
progress in their program. Results revealed that prior to training the faculty raters had a range of
0-60% perfect agreement with the true score on the composite outcome of each assessment,
whereas post-training the range only increased to 20-66.70%. None of the composite ratings of
the six assessments reached the desired 70% agreement post-training.
Consensus estimates were also calculated for a combination of perfect agreement with true
scores as well as ratings that were within +/- one acceptable level of the true scores. Prior to
training, the faculty raters had a range of 30-100% of composite scores in perfect agreement or
+/- one acceptable level. Five of the six assessments reached the desired 70% level. The level of
agreement actually decreased post-training with a range of 30-100% of composite scores in
perfect agreement or +/- one acceptable level, yet only four of the six assessments reached the
desired 70% level. All data were examined for patterns related to high versus low original (true)
scores. No trends were evident in terms of rater consistency for assignments originally scored as
strong or weak.
Several reasons may account for the lack of improvement in inter-rater agreement following
training. The training materials and/or methods used in this project may have been insufficient to
improve the raters’ interpretation of the performance levels on the rubrics in relation to the
candidate performance on the assignments. Given the time constraints of busy faculty members,
training materials were delivered online and faculty were directed to view them on their own
time. Raters were asked to carefully review the expanded rubrics and listen to the audio
explanations embedded within the PowerPoint presentations. Raters completed training on their
own, without supervision from researchers. Although training materials were developed around a
combination of performance dimensions as well as performance standard training as
recommended by previous research (Smith, 1986; Woehr & Huffcutt, 1994), researchers had no
control over whether the raters viewed the material, how long raters spent with the training
materials, or whether raters understood the material. The self-reported feedback from
participants on the follow-up survey indicated wide variability in how much time each
participant spent with the training materials. If this study were to be repeated in the future, the
use of tracking functions should be utilized to determine how long each participant had the
training materials files open. Although such data does not guarantee that an individual is
studying the material while the files are open, it would provide an objective indicator of time
spent with the training materials.
FEATURE ARTICLE EFFECTS OF RATER TRAINING
Mid-Western Educational Researcher •Volume 27, Issue 2 134
Another challenge with this project may have been in the use of three different candidate
assessments. Each assessment had a particular content focus. The expectation that faculty raters
thoroughly learn about all three assessments through a brief, independent training may have been
exaggerated. Research has suggested that it is preferable that raters have expertise in the content
of the assessment (McClellan, 2010; Meier, Rich & Cady, 2006). Since the three assessments
used in this project were from the early stages of the candidates’ teacher preparation program, it
was felt the content of all assessments was familiar to all raters. Yet the specificity of candidate
performance being evaluated by the rubrics may have been more tied to the instructional content
of the respective courses than originally anticipated.
Another cause for the lack of effect of rater training may lie in the rubrics themselves. This
project began with an assumption that the rubrics for each assessment were valid assessments of
the candidate performance expected in each course. Rubrics were believed to be objective
assessments of desired candidate performance. For purposes of this study, no efforts were made
to revise the rubrics used. Although the expanded rubrics were provided to raters for purposes of
this study, the expansions did not alter the candidate performance that was being evaluated by
the rubrics. Future research will examine the quality of rubrics in relationship to inter-rater
reliability.
The outcomes of this project support the research evidence in relationship to rater training. Even
though the analytic scoring rubrics used in this project were assumed to clearly define desired
candidate performance at each scoring level, their application, even following training, was not
necessarily reliable. Research has demonstrated that raters must be trained to criterion in the
application of rubrics (Reddy & Andrade, 2010). Extensive training has been suggested (Meier et
al., 2006; Stuhlmann et al., 1999) and should include:
(1) sample responses at each performance level with discussion by experts as to the
rationale behind the rating (Meier, et al. 2006; Stuhlmann et al., 1999); samples
should begin with those that are clear and unambiguous as to their performance level
and then other types of responses should be added (McClellan, 2010),
(2) opportunities for practice ratings with comparison to expert ratings (McClellan,
2010; Meier et al., 2006; Stuhlmann et al., 1999), and
(3) “calibration” training whereby raters continue practicing with feedback until they are
consistently agreeing with expert raters at a pre-determined level (McClellan, 2010).
The question then becomes, how realistic is the implementation of evidence-based practices in
rubric rater training in the day-to-day world of teacher preparation programs? Although evidence
of reliability in candidate performance outcomes is crucial, teacher preparation programs may
find it more efficient to carefully analyze their specific needs. For example, the department used
for this project has several courses for entry level candidates that are taught by a variety of
faculty (and sometimes by adjuncts), whereas the majority of courses for upper level candidates
are specific to a given major and taught by the same faculty member each semester. Rubric rater
reliability is obviously a more important issue for those courses taught by multiple faculty
members than for those courses taught by the same faculty member each semester; although the
issue of intra-rater reliability should also be explored.
FEATURE ARTICLE EFFECTS OF RATER TRAINING
Mid-Western Educational Researcher •Volume 27, Issue 2 135
It has been suggested that the more complex the rubric, the more likely raters are to neglect the
rubric during the scoring process “particularly when multiple components of the rubric must be
considered simultaneously” (Joe, Harmes, & Hickerson, 2011, p. 254). In this case, the rubrics
were only four, six, and seven rows, but each rubric was different in the number of performance
dimensions being measured by each row. For example, the seven rubric rows for the digital
portfolio tended to measure only one performance dimension per row whereas the three rubric
rows for the research paper each measured multiple dimensions of candidate performance that
would be evidenced across the entire research paper, making it a more complex rubric to apply.
This may partly explain why the level of agreement was generally higher for the digital
portfolios than for the research papers.
Based upon the findings from this project, expedited rater training may not be effective at
improving inter-rater agreement. A mistaken belief in the inherent reliability of rubrics seems to
pervade higher education. The authors of this project were guilty of this belief at the beginning
of this project. Ample evidence has demonstrated that even though rubrics force more objective
evaluation of candidate performance via explicitly stated standards or guidelines, they are not
necessarily applied reliably from rater to rater. Given the limited evidence addressing validity,
reliability, and fairness of rubrics (e.g., Stemler, 2004), and the fact that rubrics are being used as
gatekeepers in multiple layers of accountability (e.g., Sandholtz & Shea, 2012), educators must
think critically about the function of rubrics and their scoring. This study demonstrates that there
is little consistency even among faculty with extensive experience in using rubrics to score
candidate performance, and suggests a need for additional research to find efficient methods that
lead to increased consistency in rubric ratings among scorers.
Future Research
The results of this study revealed that further examination of the reliability of ratings applied to
candidate performance is critical. Future research should compare the impact on inter-rater
reliability of different types of rater training. Although existing research evidence exists to guide
rater training (e.g., McClellan, 2010; Meier et al., 2006; Stuhlmann et al., 1999), the realities of
time constraints of busy faculty members must be balanced with the effectiveness of rater
training. Efficiency of rater training needs to be examined in addition to effectiveness.
This project also revealed to the authors that all performance-based rubrics must be examined for
quality. It is too easy to assume that because a given rubric has been used with a given
assignment for several years, it is a good rubric. Multiple follow-up studies are under way during
which inter-rater reliability is being examined in relationship to rubric revisions. One group of
faculty is documenting the process of using inter-rater reliability to guide rubric revisions. At
each stage of revision, inter-rater reliability is being assessed. Another group of faculty is
documenting the process of using calibration training (McClellan, 2010) to increase inter-rater
reliability. Projects such as these are critical in this age of accountability in teacher preparation
programs. Not only must we provide evidence of our candidates’ learning of professional
standards, but we must provide evidence of the reliability of our evidence.
FEATURE ARTICLE EFFECTS OF RATER TRAINING
Mid-Western Educational Researcher •Volume 27, Issue 2 136
Author Notes
Lisa A. Pufpaff is an Associate Professor in the Department of Special Education at Ball State
University.
Laura Clarke is an Assistant Professor in the Special Education department at Eastern Kentucky
University.
Ruth E. Jones is an Assistant Professor in the Department of Special Education at Ball State
University.
Correspondence concerning this article should be addressed to Lisa Pufpaff at

FEATURE ARTICLE EFFECTS OF RATER TRAINING
Mid-Western Educational Researcher •Volume 27, Issue 2 137
References
Andrade, H., & Du, Y. (2005). Student perspectives on rubric-referenced assessment. Practical
Assessment, Research & Evaluation, 10(5), 1-11.
Council for the Accreditation of Educator Preparation. (2013, August). CAEP Accreditation
Standards. Retrieved from https://caepnet.files.wordpress.com/2013/02/commrpt.pdf
Council of Chief State School Officers. (2013, April). Interstate Teacher Assessment and
Support Consortium InTASC model core teaching standards and learning progressions
for teachers 1.0: A resource for ongoing teacher development. Washington, DC: Author.
Boulet, J. R., Rebbecchi, T. A., Denton, E. C., Mckinley, D., & Whelan, G. P. (2004). Assessing
the written communication skills of medical school graduates. Advances in Health
Sciences Education, 9, 47-60.
Campbell, A. (2005). Application of ICT and rubrics to the assessment process where
professional judgment is involved: The features of an e-marking tool. Assessment &
Evaluation in Higher Education, 30(5), 529-537.
Dunbar, N. E., Brooks, C. F., & Kubicka-Miller, T. (2006). Oral communication skills in higher
education: Using a performance-based evaluation rubric to assess communication skills.
Innovative Higher Education, 31(2), 115-128.
Fleenor, J. W., Fleenor, J. B., & Grossnickle, W. F. (1996). Interrater reliability and agreement
of performance ratings: A methodological comparison. Journal of Business and
Psychology, 10, 367-380.
Hafner, J. C., & Hafner, P. M. (2003). Quantitative analysis of the rubric as an assessment tool:
An empirical study of the student peer-group rating. International Journal of Science
Education, 24(12), 1509-1528. DOI: 10.1080/0950069022000038268
Hitt, A. M., & Helms, E. C. (2009). Best in show: Teaching old dogs to use new rubrics. The
Professional Educator, 33(1). Retrieved from
http://www.theprofessionaleducator.org/articles/combined%20spring_09.pdf
Joe, J. N., Harmes, C., & Hickerson, C. A. (2011). Using verbal reports to explore rater
perceptual processes in scoring: A mixed methods application to oral communication
assessment. Assessment in Education: Principles, Policy & Practice, 18(3), 239-258.
Jonsson, A. & Svingby, G. (2007). The use of scoring rubrics: Reliability, validity and
educational consequences. Educational Research Review, 2, 130-144.
Knight, L. A. (2006). Using rubrics to assess information literacy. Reference Services Review,
34(1), 43-55.

FEATURE ARTICLE EFFECTS OF RATER TRAINING
Mid-Western Educational Researcher •Volume 27, Issue 2 138
Lovorn, M. G., & Rezaei, A. R. (2011). Assessing the assessment: Rubrics training for pre-
service and new in-service teachers. Practical Assessment, Research & Evaluation,
16(16). Retrieved from http://pareonline.net/getvn.asp?v=16&n=16
McClellan, C.A. (2010). Constructed-response scoring—Doing it right. R & D Connections, 13,
1-7.
Meier, S. L., Rich, B. S., & Cady, J. (2006). Teachers’ use of rubrics to score non-traditional
tasks: Factors related to discrepancies in scoring. Assessment in education: Principles,
policy and practice, 13, 69-95.
Mullen, L., Bauer, W., & Newbold, W. (2001). Developing a university-wide electronic
portfolio system for teacher education. Kairos: A Journal of Rhetoric, Technology, and
Pedagogy. Retrieved from
http://english.ttu.edu/kairos/6.2/coverweb/assessment/mullenbauernewbold/main.htm
Oakleaf, M. J. (2006). Assessing information literacy skills: A rubric approach. (Unpublished
doctoral dissertation). University of North Carolina, Chapel Hill. UMI 3207346.
Petkov, D., & Petkova, O. (2006). Development of scoring rubrics for IS projects as an
assessment tool. Issues in Informing Science and Information Technology, 3, 499-510.
Powell, T. A. (2001). Improving assessment and evaluation methods in film and television
production courses. (Unpublished doctoral dissertation). Capella University. UMI
3034481.
Reddy, Y. M., & Andrade, H. (2010). A review of rubric use in higher education. Assessment &
Evaluation in Higher Education, 35(4), 435-448.
Reitmeier, C. A., Svendsen, L. K., & Vrchota, D. A., (2004). Improving oral communication
skills of students in food science courses. Journal of Food Science Education, 3, 15-20.
Sandholtz, J. H., & Shea, L. M. (2012). Predicting performance: A comparison of university
supervisors’ predictions and teacher candidates’ scores on a teaching performance
assessment. Journal of Teacher Education, 63(1), 39-50.
Smith, D.E. (1986). Training programs for performance appraisal: A review. Academy of
Management Review, 11, 22-40.
Stemler, S. E. (2004). A comparison of consensus, consistency, and measurement approaches to
estimating interrater reliability. Practical Assessment, Research & Evaluation, 9(4).
Retrieved from http://PAREonline.net/getvn.asp?v=9&n=4
Stuhlmann, J., Daniel, C., Dellinger, A., Denny, R.K., & Powers, T. (1999). A generalizability
study of the effects of training on teachers’ abilities to rate children’s writing using a
rubric. Journal of Reading Psychology, 20, 107-127.
FEATURE ARTICLE EFFECTS OF RATER TRAINING
Mid-Western Educational Researcher •Volume 27, Issue 2 139
Woehr, D.J., & Huffcutt, A.I. (1994). Rater training for performance appraisal: A quantitative
review. Journal of Occupational and Organizational Psychology, 67, 189-205.

FEATURE ARTICLE EFFECTS OF RATER TRAINING
Mid-Western Educational Researcher •Volume 27, Issue 2 140
Appendix A
Rater Survey
Training materials = expanded rubric in conjunction with narrated PowerPoint presentation
1. How much time did you spend with the training materials for the Digital Portfolio?
2. How much time did you spend with the training materials for the Research Paper?
3. How much time did you spend with the training materials for the Case Study?
4. How much time did you spend scoring each Digital Portfolio?
5. How much time did you spend scoring each Research Paper?
6. How much time did you spend scoring each Case Study?
7. Was this more or less time than you spent rating the Digital Portfolios the first time (without
the training materials)?
8. Was this more or less time than you spent rating the Research Papers the first time (without
the training materials)?
9. Was this more or less time than you spent rating the Case Studies the first time (without the
training materials)?
10. Were you more or less comfortable rating the Digital Portfolios after the training than before
the training?
11. Were you more or less comfortable rating the Research Papers after the training than before
the training?
12. Were you more or less comfortable rating the Case Studies after the training than before the
training?
13. Rate the clarity of the training materials. (Forced choice among Excellent, Good, Undecided,
Inadequate, Poor, and Not Applicable).
14. Comments about the clarity?
15. Rate the usefulness of the training materials for understanding the assignments. (Forced
choice among Excellent, Good, Undecided, Inadequate, Poor, and Not Applicable).
16. Comment about the usefulness of the training materials for understanding the assignment.

FEATURE ARTICLE EFFECTS OF RATER TRAINING
Mid-Western Educational Researcher •Volume 27, Issue 2 141
17. Rate the length of the training materials in relationship to their benefit in understanding how
to evaluate the assignments. (Forced choice among Excellent, Good, Undecided, Inadequate,
Poor, and Not Applicable).
18. Comment on the length of the training materials in relationship to their benefit in
understanding how to evaluate the assignments.
19. Rate the usefulness of the training materials in relation to your questions/concerns the first
time when you’d had no training. (Forced choice among Excellent, Good, Undecided,
Inadequate, Poor, and Not Applicable).
20. Comment on the usefulness of the training materials in relation to your questions/concerns
the first time when you’d had no training.
21. How reliable do you think your evaluations were in terms of interpreting the rubrics
following this training as compared to pre-training? (Force choice among Highly Reliable,
More Reliable, Undecided, Less Reliable, Unreliable, Not Applicable).
22. Please comment: how reliable do you think your evaluations were in terms of interpreting the
rubrics following this training as compared to pre-training?
23. What type of training do you feel would be best suited for faculty and other instructors new
to evaluating assignments with existing rubrics? Pick all that apply. Choices:
A. Expanded rubric with additional details about the assignment.
B. PowerPoint with narrator explanation.
C. Expanded rubric with narrated PowerPoint.
D. Handout with additional details about the assignment.
E. Face-to-face training with experienced rater.
24. What type of training do you feel would be best suited for faculty and other instructors new
to evaluating assignments with existing rubrics? Please rank the following in order of
importance to you (1 being most important):
A. Expanded rubric with additional details about the assignment.
B. PowerPoint with narrator explanation.
C. Expanded rubric with narrated PowerPoint.
D. Handout with additional details about the assignment.
E. Face-to-face training with experienced rater.
25. Please explain why you chose the type of training(s) above.
26. What would make this type of training(s) more beneficial?
27. Additional Comments: