The effects of pupil-teacher ratio and expenditure per … effects of pupil-teacher ratio and...
28
The effects of pupil-teacher ratio and expenditure per pupil on educational attainment in South Africa Esther Mumbi Kimani * and Haroon Bhorat 1st September 2014 Abstract In this study we examine the relationship between school inputs -pupil-teacher ratio and expen- diture per pupil- and educational attainment in South Africa. Following a reduced form production function we apply a partial generalized ordered probit which allows us to identify heterogeneous ef- fects of the controls at different levels of education. The government has increased its spending in basic education mainly through an increase in government employed teachers in an effort to reduce the pupil-teacher ratio, and through an increase in expenditure per pupil allocated by school quintile in a bid to attain equality in resources at school. Controlling for individual, socio-economic and neigh- borhood characteristics we find both pupil-teacher ratio and expenditure per pupil have strong and significant effects on educational attainment of Africans in South Africa. These inputs have higher effects on attainment of lower education levels. 1 Introduction In accordance with the UN Millennium Development (MDGs) Goal 2 (United Nation; 2010, p15) quality education and increasing educational attainment are key parts in achieving universal primary education by 2015. There have been substantial gains in achieving universal education with net enrollment reaching 90% in developing countries, and 77% in Sub-Saharan Africa in 2011; a 7 percentage point increase from 2000 (United Nation; 2013, p15). Sadly this increase in enrollment has not been accompanied by an increase in school quality where by school quality we refers to effects of school inputs. Studying the role of education in economic growth in developing countries, Hanushek (2013) finds most students who have completed 9 years of schooling in developing countries have skills below the international levels and cannot compete with their peers. Hanushek argues that for the type of education offered to be of value it should at least impart some basic skills. However, he adds that the provision of a quality education * for comments please email: [email protected] 1
Transcript of The effects of pupil-teacher ratio and expenditure per … effects of pupil-teacher ratio and...
The effects of pupil-teacher ratio and expenditure per pupilon educational attainment in South Africa
Esther Mumbi Kimani∗and Haroon Bhorat
1st September 2014
Abstract
In this study we examine the relationship between school inputs -pupil-teacher ratio and expen-diture per pupil- and educational attainment in South Africa. Following a reduced form productionfunction we apply a partial generalized ordered probit which allows us to identify heterogeneous ef-fects of the controls at different levels of education. The government has increased its spending inbasic education mainly through an increase in government employed teachers in an effort to reducethe pupil-teacher ratio, and through an increase in expenditure per pupil allocated by school quintile ina bid to attain equality in resources at school. Controlling for individual, socio-economic and neigh-borhood characteristics we find both pupil-teacher ratio and expenditure per pupil have strong andsignificant effects on educational attainment of Africans in South Africa. These inputs have highereffects on attainment of lower education levels.
1 Introduction
In accordance with the UN Millennium Development (MDGs) Goal 2 (United Nation; 2010, p15) qualityeducation and increasing educational attainment are key parts in achieving universal primary education by2015. There have been substantial gains in achieving universal education with net enrollment reaching90% in developing countries, and 77% in Sub-Saharan Africa in 2011; a 7 percentage point increasefrom 2000 (United Nation; 2013, p15). Sadly this increase in enrollment has not been accompanied byan increase in school quality where by school quality we refers to effects of school inputs. Studying therole of education in economic growth in developing countries, Hanushek (2013) finds most students whohave completed 9 years of schooling in developing countries have skills below the international levels andcannot compete with their peers. Hanushek argues that for the type of education offered to be of valueit should at least impart some basic skills. However, he adds that the provision of a quality education∗for comments please email: [email protected]
1
requires both infrastructure and access (Hanushek; 2013). Given that public provision of basic educationhas mainly been a prerogative of governments a continued increase in public expenditure on education islargely inevitable.
In South Africa, the apartheid era government was discriminatory in its provision of educationalservices and resources; it prioritized White schools at the expense of Black1 schools. This meant thatthere were fewer and less qualified teachers and less (if any) expenditure allocated to schools meant forBlacks, the majority of the population. At the end of apartheid the teacher-pupil ratio2 stood at between1:20 and 1:30 for Whites and between 1:40 and 1:70 for African pupils (Case and Deaton; 1999). Equally,in this era, there was racial divergence in allocation of expenditure per pupil; for instance, for every R1spent on a White pupil only 19 cents per capita expenditure was spent on an African pupil (Moulder1992 as cited in Bhorat and Oosthuizen 2008, p2). Resources allocated for Indians and Coloureds fellbetween these two population groups. This divergence in resource allocation had implications for thequality of education offered in the different schools. White schools had the highest quality while Africanschools had the lowest quality. To date, these formerly White schools (commonly known as ‘Model C’schools) are better resourced and have had the best educational outcomes; the high matriculation3 passrate in these schools is a case in point. Although resource provision has changed a great deal, to redresspast equity issues, inequality in school quality still persists (Van der Berg; 2007 and Yamauchi; 2011).This persistence has been in spite of the efforts by the various education stakeholders to transform theeducation system.
In accordance with the Constitution and the School Act, South African’s are free to apply for admis-sion into any school regardless of their race or religion. Heterogeneity in student population by race is,however, yet to be achieved in most schools. The population structure in schools is still homogeneouswith 96% of Black pupils still attending formerly Black schools (Van der Berg; 2007). This lack ofracial mixing can be associated with two main factors. First, the school admission policy gives priorityto students within a 5km radius of the school. This spatial rule has meant that, in a racially homogeneouscommunity, schools have mainly remained racially homogeneous. Spatial boundaries and the apartheidreinforcing past of populations being clustered by race have been critical barriers to entry in schools ofchoice particularly entry into ‘model C’ schools. In some cases, particularly in private schools, formerWhite’s Schools have been found to inflate school fees in an effort to discourage Black students fromentry (Selod and Zenou; 2003). Second, financial constraints have been partly to blame for this lack ofracial mixing in schools. These have been in the form of labour market constraints, and high land andhousing prices which make it impossible for low income households to move to particularly formerlyWhite areas (Yamauchi; 2011). As it stands, barriers to equal opportunities for entry into a school of
1Black in this case refers to Africans, Indians/Asians, and Coloured2The pupil-teacher ratio indicates the number of educator provided in a school, it includes staff that might not be teaching
such as the school management staff. The class size is the average number of learners(learner and pupil are used interchange-ably throughout the text) in a class (DBE 2010b).
3Matriculation examination is undertaken at the end of grade 12 and is a prerequisite for university admission.
2

choice for some South African students still exist in spite of the various efforts by education stakeholdersto erode them.
The heterogeneous provision of- and access to- education in the apartheid-era led to disparity ineducational attainment by race and type (or level) of skill acquired by the different population groups.Van der Berg and Moses (2011) attributes the persistent income inequality to this heterogeneity in ed-ucation attainment while Bhorat et al. (2009) finds wage income to be the main driver of the incomeinequality in the country. Income inequality is highly skewed by skill and by race; on the one handBhorat et al. (2009) show that in a decade, that is, between 1995 and 2005 wage inequality increased by14%. They associate this increase with a skill premium. Gradin (2014, p75) on the other hand show thatin 2005/06 the median income of Africans in South Africa was 9% that of Whites. The need to closethe gap in skills particularly between the different population groups from a position where Whites werehighly skilled, and Blacks mainly had low to no skills at all has been a priority in the country and theprovision of a high quality education to all has been a necessary requirement. Education policies suchas allocation of expenditure per pupil by school poverty quintile and increase in employment of teachersto lower the pupil-teacher ratio in all schools have been put in place by the government in an effort toimprove quality and offer equal educational opportunities to all South Africans. Provision of opportunityto access equal education to all is perceived to enhance social mobility (CHE, 2004); a necessary con-stituent in post-apartheid South Africa overall transformation making a study of school quality in SouthAfrica imperative.
In the recent years, government efforts to bring down the barriers, and to deal with inequality in pro-vision of education have been through subsidies (Republic of South Africa; 1998b). Specifically, thishas been through school-fee exemption for students from poor backgrounds attending fee paying schools(quintile 4 and 5 schools) as stipulated in the School Act of 1996, and no-fees4 school as per the Na-tional Norms and Standards for School Funding of 2006. The objectives of these policies have been totry and ease the financial burden of education on poor families and to promote equitable access to qual-ity education for all. The government implements this through a school quintile5 system that is used todetermine allocation of expenditure per pupil to schools. All ordinary public schools are assigned to aquintile based on the poverty level of the surrounding community6, and the physical condition, facilitiesand population of the school 7(South African School Amendment Act, no 84 of 1996, as amended: 2006
4The no fee status of a school is determined by the school quintile which is arrived at following the national povertyranking. It initially applied to 40% of the poorest schools (bottom two quintiles); both primary and secondary schools. Theseare supposed to receive 60% of the available resources. In 2011, no-fee policy was extended to 3rd quintile (South AfricanSchool Act of 1996, Amended National Norms and Standards for School Funding Notice 33723, as amended: 2010 p2)
5The school quintile determines how much money is allocated per learner in a school. Schools in quintile 1 receive thehighest while those in quintile 5 receive the least amount.
6In determining school poverty score the geographical area of the school and three indicators of poverty: income; depen-dency ratio (or unemployment rate); and level of education (or literacy rate) of the community are weighted (South AfricanSchool Amendment Act, no 84 of 1996, as amended: 2006 p29).
7The provincial education department is mandated to create indices based on the range of physical facilities at the school,
3
p24-29). Schools in quintile 1 are the poorest schools and receive the highest per pupil allocation, andthose in quintile 5 are the least poor schools and receive the lowest allocation per pupil. This allocation ofexpenditure per pupil ensures that more funds are allocated to pupils in the largest and neediest schools.The National Norms and Standards for School Funding stipulates that these funds are for recurrent ex-penditure that may comprise of: purchase of textbooks, and educational material or equipment for theschool; school buildings improvement and maintenance; extra-mural curriculum; provision of servicesto the school. They, however, are not to be used for hiring teachers or personnel and/or for capital ex-penditure (South African School Act of 1996, National Norms and Standards for School Funding Notice2362 of 1998 p30). Assessment of the impact of these funds has been minimal. In a qualitative analysisof the effect of school fees and funding on school quality, Hall and Giese (2008) finds that school fee ex-emption and no-fee schools have undoubtedly increased funding to poor schools; however, this increasehas not culminated in school quality improvement (Hall and Giese, 2008). According to Hall and Giesethese policies have failed to deal with unequal allocation of teaching capacity since there is no pro-poorallocation of funding to teachers, an important element in improving school quality. Although not manystudies have been done on the effect of increased education funding in developing countries, existingstudies on the effect of expenditure per pupil on educational outcome in developing countries have con-flicting findings. In the case of South Africa, there are hardly any studies examining the relationship (ifany) between this expenditure per pupil and educational attainment particularly for Africans. Using anationally representative sample this is one of the objectives of this study. Given the existing debate onthe effect of the increased funding on educational outcomes, there is a need for empirical evidence.
There is consensus that the quality of education in South Africa is low relative to what is spent; aview that even the government agrees with (Department of Education; 2003, p107). Discontent withthe quality of education provided particularly in public schools among the general public has been onthe increase. In addition to these quality concerns, inefficiency from the education department at thenational level to the school level has been a concern (Taylor et al.; 2008). There has hardly been anygrowth in the quality of education for 80% of children in South Africa (Van der Berg and Moses; 2011)and the increase in resources to poor schools has not reduced the quality differentials between schools(Van der Berg; 2007). These concerns cannot be overemphasized particularly with education viewed asan equalizer of income inequality through better job prospects and as an engine for economic growth. Inaddition to the human capital needs of the economy, the argument for public provision of education hasbeen based on the need to distribute incomes and build social cohesion. The issues of how governmentpolicies on schooling affects educational outcome of students are not just essential to policy makers butare important research questions in their own right.
Empirical research on the effects of school inputs (commonly referred to as school quality in litera-ture) on educational attainment for South Africa is limited. Existing research has mainly focused on test
learner:classroom ratio, the overall condition and need for repairs, availability of basic services (South African School Act of1996, National Norms and Standards for School Funding Notice 2362 of 1998 p28).
4
scores as the outcome variable and pupil-teacher ratio as the quality measure using survey data sets thatare not nationally representative. The findings from these studies are, however, conflicting. In a studyof school quality in the apartheid-era, Case and Deaton (1998) find that the pupil-teacher ratio had amarked effect on three educational outcomes -enrollment, education attainment and test score- of Blackchildren. Two studies in post-apartheid South Africa find conflicting results despite the fact that theyuse similar data. Using 1999 and 2000 matriculation results Van der Berg (2007) on the one hand findsthe teacher-pupil ratio has a negative effect on the matriculation score overall except in Black schoolswhile Bhorat and Oosthuizen (2008) on the other hand find that the teacher-pupil ratio had no effect onthe 2000 matriculation pass rate. This study extends the existing literature on effects of school inputs oneducational attainment by examining the relationship between the pupil-teacher ratio and expenditure perpupil, and highest education level attained.
In literature the most commonly used measures in educational outcome studies are class size, pupil-teacher ratio and expenditure per learner. About a third of studies on effects of school quality on educa-tional outcome consider test score as the outcome variable (Wilson; 2001). In this study we consider thehighest level of education attained as the outcome measure, expenditure per pupil; a non-capital and non-personnel allocation by the South African government, and the pupil-teacher8 ratio as our school qualitymeasures (which in this study we refer to them as school inputs). In addition to data availability, thereis a motivation to this choice: One, the pupil-teacher ratio is the most common quality measure in SouthAfrican school quality literature. Second, there is hardly any consensus on the relationship between thepupil-teacher ratio and educational outcome in South Africa. Third, this specific type of expenditure perpupil is yet to be considered in an analysis involving a household survey data in South Africa -at leastto the best of our knowledge. Lastly, most education school quality studies in South Africa considerthe test score as the outcome variable. An analysis of the effect of school quality on education levelattained would be an addition to the literature. The study’s hypotheses are therefore: one a reductionin pupil-teacher ratio leads to an improvement in classroom instruction quality resulting from improvedinteraction between pupils and their teacher which in turn leads to an increase in the educational attain-ment. Second, an increase in expenditure per learner leads to an increase in the resources available tostudents resulting in an improved learning experience which in turn leads to an increase in educationalattainment.
Our analysis educational attainment of Africans in Wave 1 (administered in 2008) of the NationalIncome Dynamic Study (NIDS) a national representative panel using a partial generalised ordered probitIndicate that... Our least square analysis support this results
The remainder of the study is organized as follows: section 2 reviews the relevant literature, section3 outlines the approach and method of analysis, and discussion on the data used. Descriptive statisticsfollow in section 4 followed by empirical results where a discussion on results from education levelachieved and education level index. A conclusion is given in the last section.
8Teachers in the majority of schools are employed by the government.
5

2 Econometric estimation approach
Our outcome variable is the individual’s highest education level attained. In the sample, this variable isdiscrete and non-normally distributed, that is, it is spiked at no schooling and at matriculation level. Someof the observations on highest level of education attained are right censored for respondents who werecurrently enrolled in 2008. Further, given our variable of interest are pupil-teacher ratio and expenditureper pupil we do not consider individuals with no schooling which makes education level attained leftcensored. In the presence of non-normality, discreteness, and censoring, using an ordinary least squareestimation would potentially yield biased and inconsistent estimates (Tansel; 1997, Glick and Sahn; 2000and Mani et al.; 2009, p12). Glick and Sahn (2000, p69) argues that the censoring problem can be over-come by restricting the sample to individuals old enough to have completed at a risk of considering olderindividuals whose schooling determinants could have changed at the time of the survey. We thereforerestrict our sample to younger respondents (15 to 30 year old’s) and to address the problem of censor-ing, we restrict respondents who have completed education into one sample and use an ordered probitspecification to obtain unbiased and consistent estimates.
We employ an ordered probit to estimate the effect of school inputs on educational attainment forAfricans not currently enrolled, that is, those who have achieved a given level. Education level attainedhas a natural order relation to it. However, the difference between having no schooling and having aprimary(general) education is not the same as the difference between having a matriculation and havinga higher education. The benefits of schooling are, therefore, unlikely to be the same thus ruling out theuse of an ordinary least square that assumes a linear expected value locus. An ordered probit gives us theadvantage of not treating the dependent variable as normally distributed since education level attained isdiscrete and bimodal, that is, it is spiked at no schooling and at matriculation level. We assume that wecan explain all educational outcomes using a single index model. The underlying latent variable modelin consideration is:
l∗i = xiα + εi with ε ∼ N(0,σ2) (1)
where l∗i linearly dependent on xi and xi = [mi, fi,ci,hi] represents all the observable variables. Weassume the disturbance term εi is independently and normally distributed with a mean 0 and variance σ2.We also assume a standard normal distribution hence ε ∼N(0,1). Although l∗i is unobserved, we observewhere an individuals index lies given categories j = 1, ...,J. The index is defined by its unknown lowerbound µ j−1 and upper bound µJ . We assume that µ j−1 =−∞ such that F(−∞) = 0 and µJ = ∞ such thatF(∞) = 1. Education level attained is divided into four ordinal categories namely: general level (Grade 1to grade 9), some secondary education (Grade 10, 11), matriculation(grade 12), and higher level (Grade9 plus any further education and training certificate, and grade 12 plus any additional higher educationlevel attained including certificate, diploma, or degree).
In the ordered probit model, the cumulative probability of the discrete outcome is related to the single
6

index as follows:Pr [l ≤ j|x] = F(µ j− x′α) j = 1, ...,J (2)
where µ j and β(k×1)denote unknown parameters in the model, and F(.) is a standard normal distributionfunction. For well defined probabilities we restrict µ j>µ j−1 ,∀ j, and the bounds of F(.) are as definedabove. To ensure identification of these parameters we assume that α0 = 0, that is, x does not contain aconstant, and we normalize the variance of the distribution of function F .
A common practice is to employ a standard probit in this kind of analysis, however, in analyzingmarginal product effects, the standard ordered probit is not without limitations which mainly stems fromits assumptions. These assumptions are the single crossing property, the constant threshold, and the dis-tributional assumption that does not allow for heterogeneity between individual realization (Boes andWinkelmann; 2006). We first run a standard ordered probit and test for the assumption of parallel lines.A likelihood ratio test (using omodel in Stata) on the assumption of the parallel lines assumption in thestandard ordered probit gives us a χ2
32 = 131.72 with a p−value = 0 an indication that this assumption isviolated at 1%-level. Due to this violations and to deal with the limitations of the standard ordered pro-bit we follow a generalization of this model as proposed by Boes and Winkelmann (2006). This modelrelaxes the three assumptions of the standard ordered probit, and a partial generalization of this modelby Williams (2006) gives more flexibility. This partial generalized ordered probit allows for heteroge-neous controls that vary to vary in each category, and those that are constant to remain constant in eachcategory. A test of the parallel lines for each variable in the partial generalized model indicate that thequadratic logarithmic pupil-teacher ratio, both the logarithmic expenditure per pupil and its quadratic,quadratic age, gender, attending independent homeland or a self-governing territory school, and distanceto school violate the parallel line assumption and are therefore allowed to vary. A Wald test of the partialgeneralized model gives us a χ2
26 = 30.64 with a p− value = 0.242 indicating that this model does notviolate the parallel lines regression. This means that the effects of some of our controls vary with theeducation level attained while others remain constant at each level. This model generalizes the thresholdparameters by making them dependent on covariates as follows:
µ j = µ̃ j + x′ω j (3)
where ω j is a k×1-dimensional vector of response specific parameters. We replace µ j in equation 2to obtain the cumulative probabilities in the generalized threshold model as:
Pr [l ≤ j|x] = F(µ̃ j + x′ω j− x′α) = F(µ j− x′α j) j = 1, ...,J
where similarly µ j = −∞ and µ j = ∞ as before, and α j ≡ ω j−α since ω j and α cannot to sepa-rately identified using the same x entering the index and generalized threshold models. This allows us toestimate the different parameters of x for each category.
7

2.0.1 Data
The National Income Dynamic Study (NIDS) is a nationally representative household and individual levelpanel that commenced in 2008 and is undertaken every two years. It focuses on household compositionand structure, education, labour market participation and economic activity, health, agriculture amongother issues (Leibbrandt et al.; 2009). These issues are covered in four questionnaires namely: house-hold, individual adult, individual proxy, and child. In arriving at the households sample, it employed astratified two-stage cluster sample design. Wave 1 response rate was 69% that is 7305 households and28225 individuals responded across South Africa (Leibbrandt et al.; 2009). To take care of sample non-response and representativity, NIDS has both design weights and post-stratification weights (Wittenberg;2002). We use Wave 1 to study the effects of pupil-teacher ratio and expenditure per pupil on educationattainment. To ensure that we can make inferences from the African sample to the African population inSouth Africa we use post-stratification weights in the analysis.
In post-apartheid South Africa there remain differences between the different population groups. Oursample of interest in NIDS is Africans9 respondents. Given the legacy of apartheid that differentiatededucation provision by race, a pooled analysis of all population groups is likely to mask effects of schoolinputs on African’s educational attainment, hence our focus on this population group. We consider thesample of African youth aged between 15 and 30 in the NIDS 2008 wave 1. Our choice of this age groupis motivated by the following policies: in South Africa, schooling is compulsory until age 15 or grade9 whichever comes first, and the South African National Youth policy defines the youth as individualsaged between 14 to 35 years. These two conditions imply that our sample focuses on individual who arepast the legal age of minimum schooling and are considered as the youth of South Africa. An additionalcondition is that NIDS adult questionnaire has a focus on 15 to 30 year old on education responses.Further, in our view, it is more probable that the family background and neighborhood characteristics inNIDS are more likely to be accurate for this age group than for older respondents. This is because thisgroup is more likely to be residing at their parents home. Ideally, a study of determinants of educationalattainment ought to account for final level of education level attained and relate it to characteristics ofthe environment the individual grew up in. To ensure that our sample is that of respondents who aremost likely to have been raised in a given household and are dependents of the household head, wefurther restrict our sample to respondents who are not the household head (resident or absent), and whoserelationship with household head is not: husband or wife or partner, father or mother, father or mother-in-law, grandparent, great grandparent, uncle or aunt, household help, lodger or relative of lodger, otherfamily member, and other non-family member. Our estimation sample is therefore made up of 3023African individuals who are either not enrolled (1352) or enrolled in institutions of learning (1671).
9As of census 2011, Africans were 79.2% of the South African population. In NIDS our sample of individuals who are15-30 year old and are dependents, Africans are over represented at 90%.
8
3 Descriptive statistics
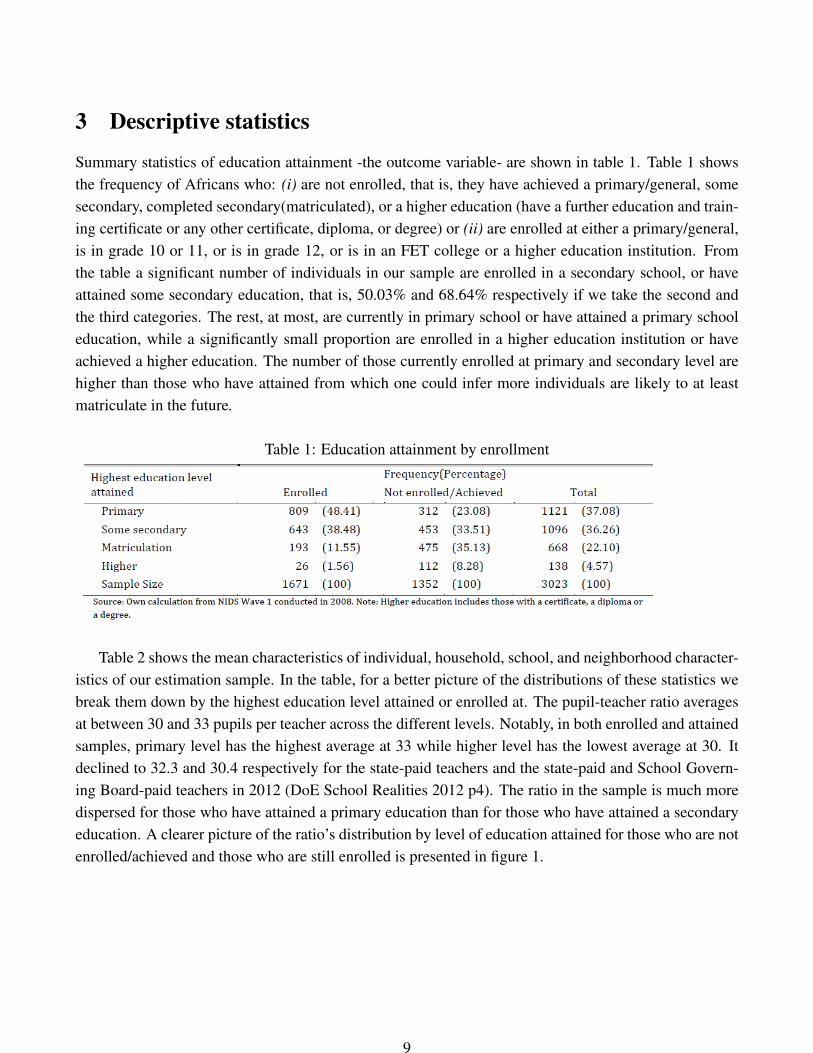
Summary statistics of education attainment -the outcome variable- are shown in table 1. Table 1 showsthe frequency of Africans who: (i) are not enrolled, that is, they have achieved a primary/general, somesecondary, completed secondary(matriculated), or a higher education (have a further education and train-ing certificate or any other certificate, diploma, or degree) or (ii) are enrolled at either a primary/general,is in grade 10 or 11, or is in grade 12, or is in an FET college or a higher education institution. Fromthe table a significant number of individuals in our sample are enrolled in a secondary school, or haveattained some secondary education, that is, 50.03% and 68.64% respectively if we take the second andthe third categories. The rest, at most, are currently in primary school or have attained a primary schooleducation, while a significantly small proportion are enrolled in a higher education institution or haveachieved a higher education. The number of those currently enrolled at primary and secondary level arehigher than those who have attained from which one could infer more individuals are likely to at leastmatriculate in the future.
Table 1: Education attainment by enrollment
Table 2 shows the mean characteristics of individual, household, school, and neighborhood character-istics of our estimation sample. In the table, for a better picture of the distributions of these statistics webreak them down by the highest education level attained or enrolled at. The pupil-teacher ratio averagesat between 30 and 33 pupils per teacher across the different levels. Notably, in both enrolled and attainedsamples, primary level has the highest average at 33 while higher level has the lowest average at 30. Itdeclined to 32.3 and 30.4 respectively for the state-paid teachers and the state-paid and School Govern-ing Board-paid teachers in 2012 (DoE School Realities 2012 p4). The ratio in the sample is much moredispersed for those who have attained a primary education than for those who have attained a secondaryeducation. A clearer picture of the ratio’s distribution by level of education attained for those who are notenrolled/achieved and those who are still enrolled is presented in figure 1.
9
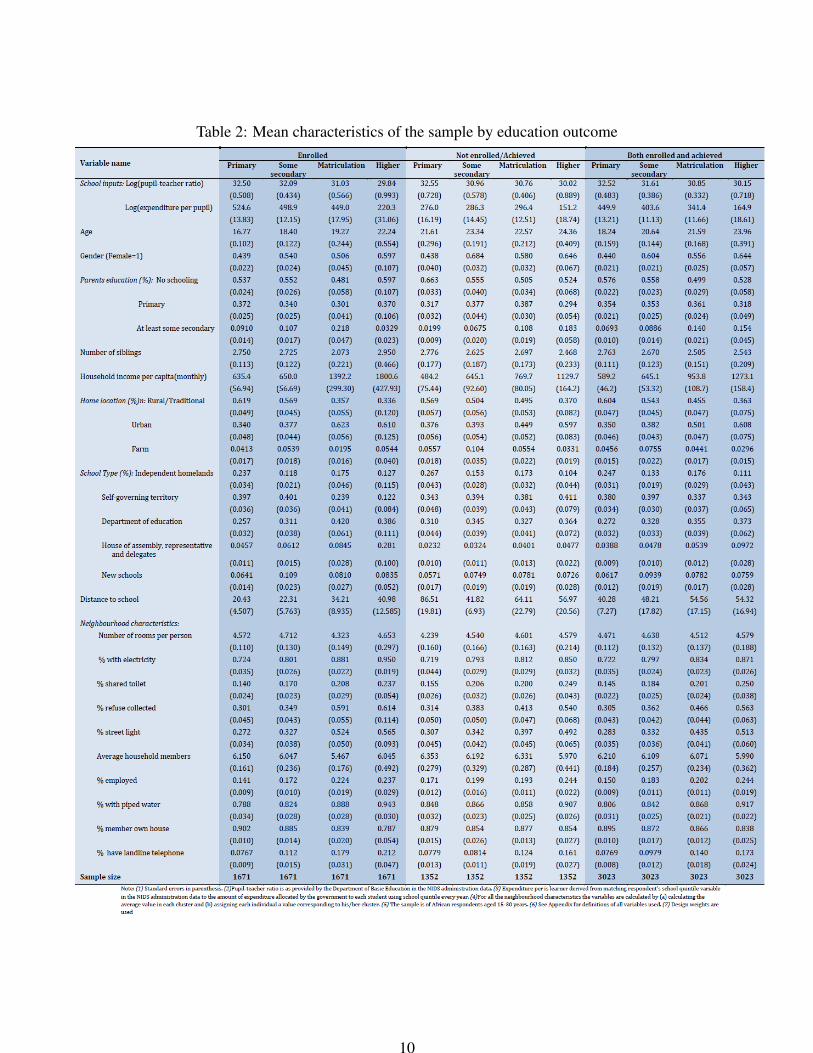
Table 2: Mean characteristics of the sample by education outcome
10

From figure 1, in both enrolled and achieved samples, on the one hand primary education is moreskewed to the right, has a lower peaks, and has longer tails than the other levels. On the other hand,higher education is skewed to the left, has the highest peak for those enrolled, and has the shortesttail. A naive interpretation of these distributions is that a lower pupil-teacher ratio is associated withenrolling or attaining a higher education while a higher ratio is associated with enrolling or attaining aprimary education. We conduct a Kolmogorov-Smirnov test to test whether individuals who are enrolledat institutions of learning, and those who have achieved a given level of education are from a populationwith identical distribution functions. The results for pupil-teacher ratio show that the individuals whoare enrolled and individuals who have achieved a primary, some secondary, a matriculation, or a highereducation are from a population with identical distribution functions. This means that at all levels ofeducation there is no significant difference between the ratio for those enrolled and for those who haveachieved.
Figure 1: Distribution of the logarithmic pupil-teacher ratio and the logarithmic expenditure per pupilfor Africans who are enrolled
11

From table 2 the average expenditure per pupil10 is significantly different for those enrolled as com-pared with those not enrolled, that is, the average expenditure per pupil is R497 and R274 for those whoare enrolled and those who have attained (not enrolled) respectively. The difference is evident in the den-sities presented in figure 2. From the figure, the distribution of expenditure per pupil for those enrolled inprimary and secondary schools has multiple spikes and is skewed to the right. However, the distributionfor those in higher education is rather flat, that is, platykurtic which could be an indication insensitivityto- or independence of- expenditure per pupil in individual’s enrollment in higher education. The figurealso indicates a bimodal distribution for those who have attained a given level of education. This distri-bution structure is dominant in the distribution of the full sample and is consistent with the ‘advantaged’and ‘disadvantaged’ schools where the ‘advantaged’ schools which are mainly formerly White schoolsreceive less funding but have higher matriculation rate and progression through higher education, andthe ‘disadvantaged’ schools are mainly formerly Black schools which receive more funding per pupil buthave lower matriculation rate and progression to higher education. A notable feature of the distributionsof those who have attained a given level is the change in peaks between the different education levels asexpenditure per pupil increases. At lower expenditure per pupil, higher education has the highest peakwhile matriculation has the lowest peak which implies that at low expenditure more individuals attained ahigher education than at a matriculation. At higher expenditure per pupil more individuals have attaineda matriculation, primary or some secondary education while fewer have attained a higher education.
10We use CPI to deflate the values taking 2008 is the base year.
12

Figure 2: Distribution of the logarithmic pupil-teacher ratio and the logarithmic expenditure per pupilfor Africans not enrolled/Achieved
The full sample indicates all distribution are bimodal, but, both primary and secondary are moreskewed to the right and higher education is skewed to the left. The skewness is, however, not surprisingbecause the average age of those who have attained a given level of education is higher by about 3 yearsrelative to those who are still enrolled and those who have attained a higher education are 4 percentagemore than those still enrolled in higher education institutions. These differences in the distributions be-tween enrollment and attainment are therefore more likely driven by time. The bimodal distribution islikely to be as a result of allocations pattern where quintile 1, 2, and 3 schools have progressively beenallocated higher expenditure per pupil than quintile 4 and 5. Schools in quintile 1 and 2 were categorizedas non-fee paying schools in 2007/08 and in 2012 schools in quintile 3 were also included. A significantproportion of Africans attend schools in quintile 1, 2, and 3. Schools in quintile 4 and 5 are mainly’model C’ schools, they receive substantially less allocation per pupil and have had a higher success rateat matriculation and enrollment into higher education. A naive comparison of these distributions tell usthat, one there is no significant difference in expenditure per pupil between those who are enrolled orhave attained a primary or some secondary education, second respondents who have attained a higher ed-
13

ucation have a lower expenditure per pupil than those who are currently enrolled, and third respondentswho are enrolled in grade 12 or have achieved a matriculation received a higher expenditure per pupilwhich could be an indication that the increase in expenditure per pupil in formerly disadvantaged schoolsis increasing educational attainment. A Kolmogorov-Smirnov test to test show the distributions of ex-penditure per pupil for individuals who are enrolled, and for individuals who have achieved a primary,some secondary, and a matriculation are at 1%-level, and for higher education at 10% from a populationwith different distribution functions. This means that there is a significant difference between the expen-diture per pupil for those enrolled and those who have achieved across the different levels of education.At all levels of education those who have attained are consistently from a lower expenditure per pupildistribution than those who are still enrolled in institutions of learning.
From table 2 the sample is of Africans on average in their 20’s. The average age difference betweenthose enrolled and those who have attained is 5 years. Those enrolled in primary school and at grade 12are older for their age by 2 and 1 year respectively (This is based on grade 1 enrollment age of 7.). Thesample is predominantly female with the exception of those enrolled or have attained a primary level at44%. The majority of the individual’s parents have on average no formal education while a relativelysmall proportion have at least some secondary education. Notably, 21.8% of individuals enrolled ingrade 12(matriculation) have parents with at least some secondary education, and 10.8% and 18.3% ofindividuals who have attained a matriculation and higher education respectively have parents with at leastsome secondary education. One can naively infer from this that parental education does matter in theirchildren’s educational attainment. On average respondents have 3 siblings, which is a relatively smallnumber. The average household monthly income per capita in the sample increases with education levelthe individual is enrolled at or has attained. The average income is lowest for individuals enrolled or haveattained a primary education, and is highest for individuals enrolled or have attained a higher education.There is almost a threefold difference in the average household income for respondents enrolled or haveattained a primary education and those enrolled or have attained a higher education.
In South Africa students in urban areas perform better than those in rural areas (van der Berg andMoses 2011). In the sample as indicated in table 2 the majority of individuals who are enrolled in pri-mary, or in grade 10 or 11 live in traditional areas (which are defined as communally-owned land area andare mainly rural villages) while majority of those enrolled in grade12 or in higher institution of learninglive in urban areas (cities, towns, ’townships’, small towns, and hamlets). A similar pattern is repeated forthose who have attained a given level except for those with a matriculation where about 50% live in ruralareas. The majority (more than 80% except those enrolled in higher education at 63.5%) of individualsare enrolled or attended a formerly African only school, that is, independent homeland, self-governingterritory, and Department of Education schools. On average 40% of individuals enrolled in primaryschool, or in secondary school at grade 10 or grade 11 attend formerly self-governing territory schools,and 42% and 38.6% of individuals enrolled in grade 12 and higher education respectively attend(ed)formerly Department of Education schools. It is interesting to note that a significantly higher propor-
14

tion of individuals enrolled in higher education attended formerly Department of Education schools ascompared with those who have attained a higher education, a 24.3 percentage point difference. On aver-age the highest proportion of individuals that have attained a given level of education attended formerlyself-governing school at 38% followed by formerly Department of Education at 33.3%.
Most of these 10 neighborhood characteristics are related, we therefore consider it optimal to con-solidate these characteristics into fewer categories for the regression analysis.We opt to use principalcomponent analysis to identify and compute composite scores for these neighborhood characteristics.We name these components as: (i) serviced by local municipality, (ii) Community economic status ,and (iii)Population density and housing quality In table 4 we present the mean characteristics of thesecomponents.
Table 3: Mean components
From table 4 fewer individuals who are enrolled or have attained a primary or grade 10 or 11 livein neighborhoods serviced by municipality while more individuals enrolled or have attained a highereducation live in neighborhoods serviced by municipality. The majority of individuals enrolled or holdinga primary education live in communities with better economic status as compared with other educationlevel. More individuals enrolled or with a higher education live in neighborhoods of high density andlower quality of housing.
15
4 Empirical results
In this section we estimate the relationship between school inputs (pupil-teacher ratio and expenditure perpupil) and education level attained. We consider this relationship when other determinants of educationalattainment are included. We present the estimated parameters under several model specifications. Inthe analysis of educational attainment we use a partial generalized ordered probit (Goprobit) to analyzeactual education level attained on a sample of Africans who have achieved a given level of education,that is, those who are not currently enrolled in any educational institution.
4.1 Educational attainment
4.1.1 School inputs effects
Table 4 displays the estimated coefficients on logarithmic pupil-teacher ratio and logarithmic expenditureper pupil from the partial generalized ordered model. In the model, three different parameter vectors θ1,θ2, and θ3 are estimated. The vectors give a series of estimated probit analyses, that is, θ1 presents aprobit analysis of having a primary education versus having some secondary, matriculation, and highereducation, θ2 presents a probit analysis of having primary and some secondary education versus havingmatriculation and higher education, and θ3 presents a probit analysis of having a primary, some sec-ondary, and matriculation versus having a higher education. The results are from our full specificationwhich in addition to the school inputs controls for age, age squared, gender, parent’s education, num-ber of siblings, household monthly income per capita, home location, classification of school attended,distance to school, and neighborhood characteristics.
16

Table 4: Generalized ordered probit (Goprobit) education attainment models with school inputs as ex-planatory variables
The coefficient on the logarithmic pupil-teacher ratio are negative and statistically significant at 5%-level11, but they are nonlinear for θ2 only. The pupil-teacher ratio has an identical effect on the likelihoodof attaining any of the levels of education considered, that is, the ratio does not violate the parallel linesregression assumption. This can be interpreted to mean that a larger ratio increases the likelihood ofattaining a primary education level or lower and decreases the likelihood of attaining a higher educationholding all other characteristics constant. The quadratic ratio indicates the ratio is concave downward inall the categories, albeit only significantly so for θ2. The coefficient on logarithmic expenditure per pupilhave mixed signs an indication that it has a heterogeneous effect on educational attainment. A higherexpenditure per pupil makes it more likely to attain more than a primary education as indicated by thepositive and significant θ1, has no effect on the probability of attaining a primary and some secondaryeducation level as indicated by an insignificant θ2, and has a negative and significant effect on the proba-bility of attaining a matriculation or a lower education level as indicated by the coefficient for θ3. Overall,these results imply that a higher expenditure per pupil is more likely to increase the likelihood of primaryeducation attainment, but it is less likely to increase the likelihood of higher education attainment. Theeffect of an increase in expenditure per pupil decreases with the level of education. This makes senseto us since this expenditure per pupil represents current expenditure per pupil and is more likely to in-fluence primary education attainment. Besides, expenditure per pupil has non-linear effects only on thelikelihood of attaining a primary education or lower. See table 8 for estimates of the rest of the controls.
11This coefficient is larger both when we include no additional controls other than school inputs, and when we control forexogeneous variables, that is, age and gender and school inputs.
17
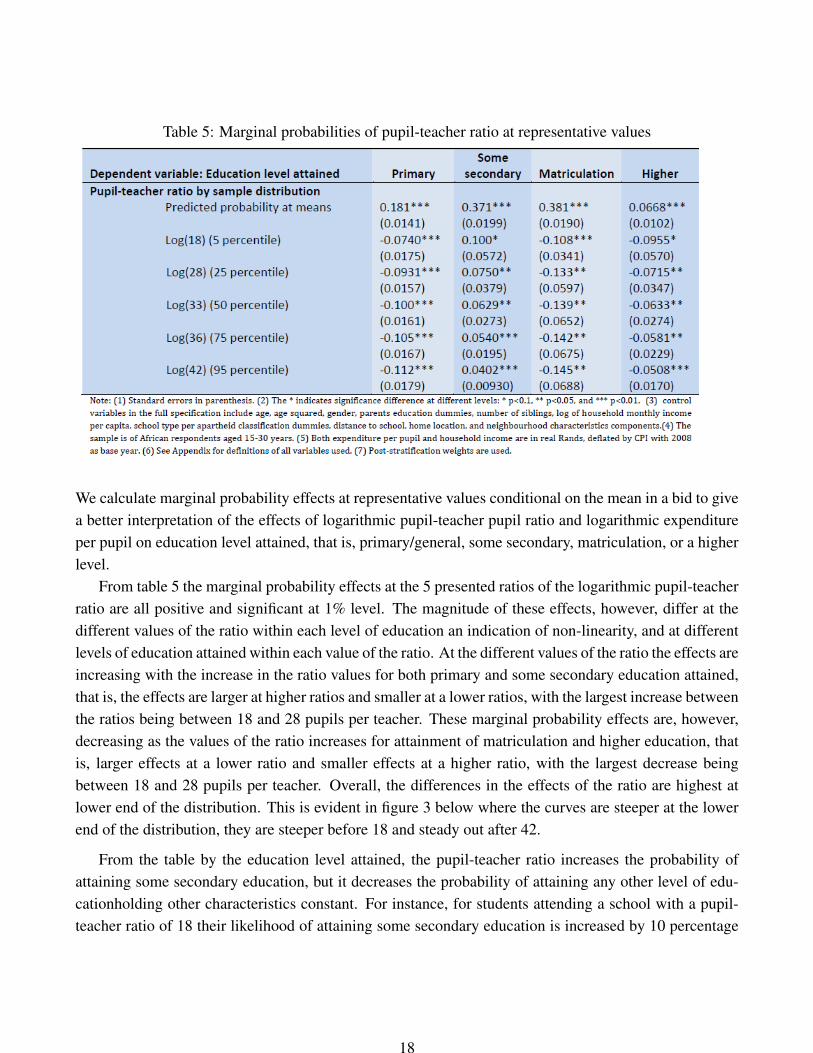
Table 5: Marginal probabilities of pupil-teacher ratio at representative values
We calculate marginal probability effects at representative values conditional on the mean in a bid to givea better interpretation of the effects of logarithmic pupil-teacher pupil ratio and logarithmic expenditureper pupil on education level attained, that is, primary/general, some secondary, matriculation, or a higherlevel.
From table 5 the marginal probability effects at the 5 presented ratios of the logarithmic pupil-teacherratio are all positive and significant at 1% level. The magnitude of these effects, however, differ at thedifferent values of the ratio within each level of education an indication of non-linearity, and at differentlevels of education attained within each value of the ratio. At the different values of the ratio the effects areincreasing with the increase in the ratio values for both primary and some secondary education attained,that is, the effects are larger at higher ratios and smaller at a lower ratios, with the largest increase betweenthe ratios being between 18 and 28 pupils per teacher. These marginal probability effects are, however,decreasing as the values of the ratio increases for attainment of matriculation and higher education, thatis, larger effects at a lower ratio and smaller effects at a higher ratio, with the largest decrease beingbetween 18 and 28 pupils per teacher. Overall, the differences in the effects of the ratio are highest atlower end of the distribution. This is evident in figure 3 below where the curves are steeper at the lowerend of the distribution, they are steeper before 18 and steady out after 42.
From the table by the education level attained, the pupil-teacher ratio increases the probability ofattaining some secondary education, but it decreases the probability of attaining any other level of edu-cationholding other characteristics constant. For instance, for students attending a school with a pupil-teacher ratio of 18 their likelihood of attaining some secondary education is increased by 10 percentage
18

points. These effects are substantial compared to the average predicted probability of attaining some sec-ondary education of about 37%. This increase is matched by a decrease of 9.6 percentage points of thelikelihood of attaining a higher education. However, this effect is minimal given the average predictedprobability of attaining a higher education of about 6.7%. The results of different ratios show the effectsare increasing in magnitude as the ratio increase for primary and matriculation, but are decreasing forsome seconday and higher education. For example, a doubling of the ratio from 18 to 36 leads to a 42%decrease in the likelihood of attaining a primary level as compared to 39% decrease in the likelihood ofattaining a higher education. A higher ratio, therefore, has a larger effect on the likelihood of attaininga primary education than that of a higher education, and these effect is even larger the higher the ratio.From these results we can infer that the pupil-teacher ratio has varied effects on different education level,but a higher ratio is more detrimental at primary level.
Figure 3: Distributions of marginal probability of pupil-teacher ratio effects at representative values
Figure 3 displays the marginal probability effects at different points of the sample distribution of thelogarithmic pupil-teacher ratio from the partial generalized ordered model plotted against values of thepupil-teacher. From the figure an increase in the pupil-teacher ratio decreases the likelihood of attainingsome secondary education and matriculation but increases the likelihood of attaining a primary educationand a higher education but at a decreasing rate. A possible explanation for this is that: on the one handyounger children are more reliant on teachers than older children hence a decline in attainment with a
19
higher ratio for primary, and on the other hand a minimum class size is important in increasing the prob-ability of attaining some secondary education or a matriculation a likely benefit of peer learning whichis likely to occur in older children. Peer relations have been argued to influence education aspiration andachievement and attitude towards schooling (Johnson; 1981). From the figure and the results in table 5we can conclude that a large pupil-teacher ratio has the least effect on higher education.
Table 6: Marginal probabilities of expenditure per pupil at representative values
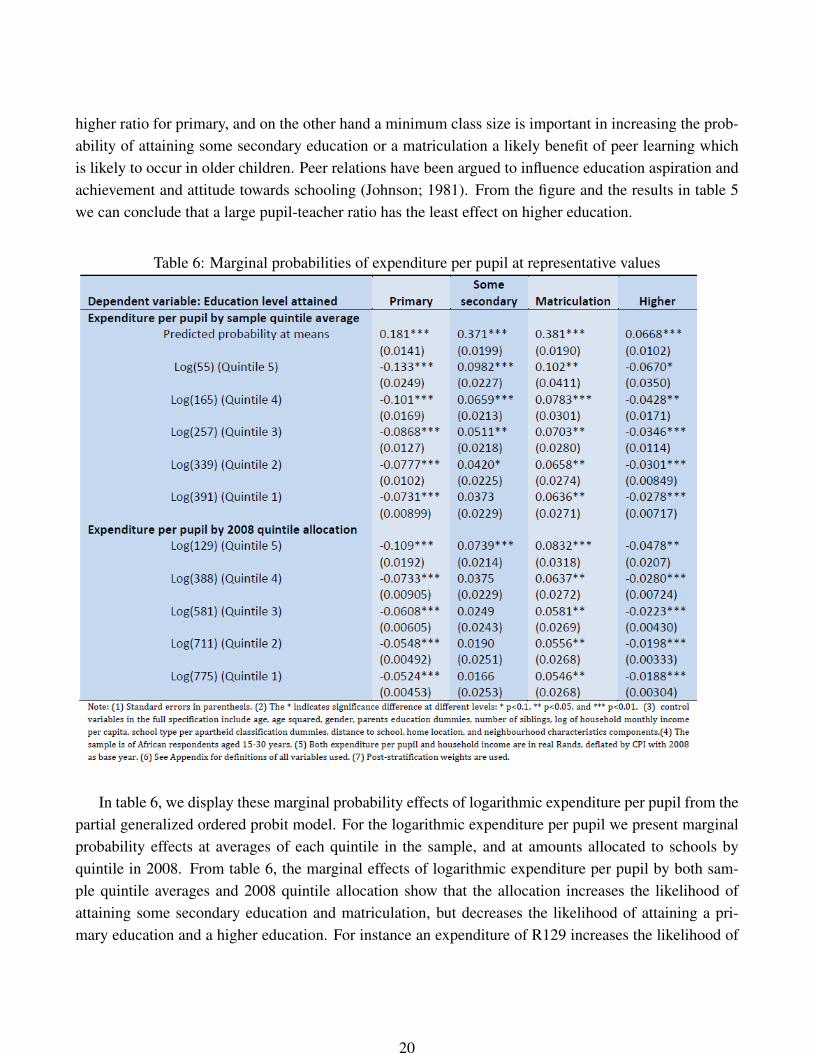
In table 6, we display these marginal probability effects of logarithmic expenditure per pupil from thepartial generalized ordered probit model. For the logarithmic expenditure per pupil we present marginalprobability effects at averages of each quintile in the sample, and at amounts allocated to schools byquintile in 2008. From table 6, the marginal effects of logarithmic expenditure per pupil by both sam-ple quintile averages and 2008 quintile allocation show that the allocation increases the likelihood ofattaining some secondary education and matriculation, but decreases the likelihood of attaining a pri-mary education and a higher education. For instance an expenditure of R129 increases the likelihood of
20

Figure 4: Distributions of marginal probability of expenditure per pupil effects at representative values
attaining a matriculation by 8.3 percentage points, but it decreases the likelihood of attaining a primaryeducation by 10.9 percentage points. The effect on matriculation is substantial given the average pre-dicted probability of attaining this level of about 38%. Higher allocations, however, have no effect on thelikelihood of attaining some secondary education. The results also show the magnitude of the effect tobe decreasing with the increase in the allocation. From both table 6 and figure 4 expenditure per pupilhas the least effect on attainment of higher education, at least a twofold difference between the effect onprimary and on higher education.
Figure 4 displays the marginal probability effects at different points of the sample distribution ofthe the logarithmic expenditure per pupil from the partial generalized ordered model plotted againstvalues of the expenditure per pupil. From figure 4, the results show two distinct patterns: the likelihoodof attaining a primary or a higher education increases as expenditure increases, but the likelihood ofattaining some secondary education or matriculation decreases as expenditure increases. Although notmuch research has been done, the existing research shows that an increase in expenditure per pupilincreases educational attainment. These findings agree with some studies (Hanushek; 1995, Glewweet al.; 2011, and Gustafsson; 2007) which find expenditure per pupil has positive and significant effectson attainment particularly when used for items such as textbooks, workbooks, school equipment amongothers. This are essential items particularly for matriculation. In South Africa Van der Berg (2007)
21
and Bhorat and Oosthuizen (2008) also find resources to positively affect matriculation pass rate. Ourresults are also in agreement Yamauchi (2011) who finds increase in expenditure per pupil improvesschool quality. This results therefore indicate that increased expenditure per pupil increases educationattainment particularly matriculation which is contrary to the public sentiment.
4.1.2 Individual, family and neighborhood effects
In table 7 we present our full specification results from the partial generalized ordered probit model,and two least square estimation of the relative education index and years of schooling. In all modelswe control for individual, family and neighborhood characteristics which have empirically been shownto be important determinants of educational attainment. In this section we discuss the results for thepartial generalized ordered probit analysis as presented in the first three columns. We find age to bean insignificant determinant of the education level attained, however, it has the ‘wrong’ sign and hassignificant nonlinear effects. This is a likely to be as a result of small variation in age likely to be drivenby the sub-sampling of 15-30 year old. We find being female increases the probability of attaining ahigher education implying women are more likely to attain a primary education than men. Both age andgender have varying effects on the different education levels attained.
Family characteristics are important determinants of educational attainment. We consider parentaleducation both as an indicator of parental taste in education and as a variable in its own right. Theresults shows that having a parent with at least some secondary education increases the likelihood ofattaining a higher level of education relative to having a parent with no formal education. We can inferfrom these results that more educated parents are likely to give more educational opportunities to theirchildren hence offering more social mobility for their generations. Gustafsson (2007) finds similar resultsfor South Africa. An increase in household per capita income increases the likelihood of attaining ahigher education. The positive correlation between household income and education attainment impliesthat education is a normal good. The effects of family characteristics on the likelihood of educationalattainment do not vary with education level. We, however, find number of siblings and location to be ofno importance.
Educational attainment is dependent on the type of school attended, in the case of South Africaschools differ by historical (apartheid) classification. From table 8 attending a formerly self-governingschool significantly (at 10%-level) increases the likelihood of attaining a primary education or lowerwhile attending any other school category has no significant effect relative to attending a formerly inde-pendent homeland school. The importance classification of school attended is in line with the findingsbyBhorat and Oosthuizen (2008) who found the matriculation pass was positively determined by type ofschool attended as defined by apartheid classification. A long distance to school increases the likelihoodof attaining a primary education or lower. School classification and distance to school have heterogeneouseffects at different levels of education.
22

Neighborhood characteristics are important in the determination of educational attainment particu-larly due to associated externalities. We find that living in a neighborhood that is serviced by the mu-nicipality has no effect on the likelihood of educational attainment. However living in a neighborhoodof high economic status increases the likelihood of attaining a primary education or lower while, livingin a less densely populated area with better quality housing increases the likelihood of attaining a highereducation. Although we do not discuss the marginal effects of these characteristics at their mean, table 8in the appendix presents these results.
23

Table 7: Determinants of education attainment for Africans
24
5 Summary and conclusion
The objective of this study has been to investigate the determinants of educational attainment for Africansin South Africa with a specific interest on school inputs -pupil-teacher ratio, and expenditure per pupil.We considered both actual education attained and relative educational attainment index. We used theNational Income Dynamics Survey Wave 1, a household survey that has been matched with nationalschool data to identify the impacts of school quality (pupil-teacher ratio and expenditure per pupil) andsocioeconomic characteristics such as parental education, home language, and location on educationattainment. We also consider neighborhood characteristics such as access to piped water, availabilityof electricity and street lighting, availability landline telephone, collection of refuse by municipality,availability of toilet facility, average household size and house size, and community unemployment rateWe focus on Africans aged 15 to 30 years who are not household heads or in a position of havingdependents.
We find that school inputs and some of socio-economic factors considered are important determinantof educational attainment. Our findings suggest that a low pupil-teacher ratio increases the likelihoodof attaining some secondary education and similarly a larger expenditure per pupil increases of attainingsome secondary education. The pupil teacher ratio has different effects: at different values, that is,it is nonlinear, and on attainment of different education levels. We find a smaller pupil-teacher ratiohas higher effects at lower education levels. The ratio is therefore more important in influencing thelikelihood of educational attainment at lower level of education than at higher levels. We also find a largerexpenditure per pupil increases the likelihood of attaining a higher education. our results indicate thatsmaller allocations of expenditure per pupil have larger effects on the likelihood of attainment and theseeffects vary by education level attained. The effects of larger allocations mainly increase the likelihoodattaining a primary education and higher education levels but, has decreasing effects on the likelihoodof attaining some secondary education and matriculation. We infer that the higher effects on primaryeducation attainment are an indication that the increased expenditure per pupil is having significant effectsin improving matriculation. We, however, caution that the fact that education is compulsory till end ofprimary school could be an important factor in increased attainment at this level thereby is likely to beconfounding our results.
25

Appendix 1
Table 8: Definition of variables
26
References
Bhorat, H. and Oosthuizen, M. (2008). Determinants of grade 12 pass rates in the post-apartheid southafrican schooling system, Journal of African Economies 18(4): 634–666.
Bhorat, H., Van der Westhuizen, C. and Jacobs, T. (2009). Income and non-income inequality in post-apartheid South Africa: what are the drivers and possible policy interventions?, Development PolicyResearch Unit, University of Cape Town.
Boes, S. and Winkelmann, R. (2006). Ordered response models, Modern Econometric Analysis, Springer,pp. 167–181.
Case, A. and Deaton, A. (1998). School quality and educational outcomes in south africa, Technicalreport.
Case, A. and Deaton, A. (1999). School inputs and educational outcomes in south africa, The QuarterlyJournal of Economics 114(3): 1047–1084.
Department of Education, . (2003). A review of financing, resourcing and costs of education in publicschools, Technical report, Department of Education, pretoria, South Africa.
Glewwe, P. W., Hanushek, E. A., Humpage, S. D. and Ravina, R. (2011). School resources and edu-cational outcomes in developing countries: A review of the literature from 1990 to 2010, Technicalreport, National Bureau of Economic Research.
Glick, P. and Sahn, D. E. (2000). Schooling of girls and boys in a west african country: the effects ofparental education, income, and household structure, Economics of education review 19(1): 63–87.
Gradin, C. (2014). Race and income distribution: Evidence from the usa, brazil and south africa, Reviewof Development Economics 18(1): 73–92.
Gustafsson, M. (2007). Using the hierarchical linear model to understand school production in southafrica, South African Journal of Economics 75(1): 84–98.
Hall, K. and Giese, S. (2008). Addressing quality through school fees and school funding, South Africanchild gauge 2009: 35–40.
Hanushek, E. (2013). Economic growth in developing countries: The role of human capital, Economicsof Education Review .
Hanushek, E. A. (1995). Interpreting recent research on schooling in developing countries, The worldbank research observer 10(2): 227–246.
27
Johnson, D. W. (1981). Student-student interaction: The neglected variable in education, Educationalresearcher pp. 5–10.
Leibbrandt, M., Woolard, I. and de Villiers, L. (2009). methodology: report on nids wave 1, technicalpaper no. 1, South African Labour and Development Research Unit.
Mani, S., Hoddinott, J. and Strauss, J. (2009). Determinants of schooling outcomes: Empirical evidencefrom rural ethiopia, Fordham University, Department of Economics Discussion Paper (2009-03).
Republic of South Africa, . (1998b). National norm and standards for school funding, south africanschool act, 1996, Technical report, Department of Education.
Selod, H. and Zenou, Y. (2003). Private versus public schools in post-apartheid south african cities:Theory and policy implications, Journal of Development Economics 71(2): 351–394.
Tansel, A. (1997). Schooling attainment, parental education, and gender in cote d’ivoire and ghana,Economic Development and Cultural Change 45(4): 825–856.
Taylor, N., Fleisch, B. and Shindler, J. (2008). Changes in education since 1994, Higher Education32: 3–5.
United Nation, . (2010). Keeping the promise: united to achieve the millennium development goals,technical manual, United Nation.
United Nation, . (2013). The millennium development goals report 2013, Technical report, United Nation.
Van der Berg, S. (2007). Apartheid’s enduring legacy: Inequalities in education, Journal of AfricanEconomies 16: 849–880.
Van der Berg, S. and Moses, E. (2011). Inertia in south african education quality: evidence from sacmeqii and iii, Policy brief, department of economics, University of Stellenbosch.
Williams, R. (2006). Generalized ordered logit/partial proportional odds models for ordinal dependentvariables, Stata Journal 6(1): 58–82.
Wilson, K. (2001). The determinants of educational attainment: Modeling and estimating the humancapital model and education production functions, Southern Economic Journal pp. 518–551.
Wittenberg, M. (2002). Job search in south africa: a nonparametric analysis, South African Journal ofEconomics 70(8): 1163–1196.
Yamauchi, F. (2011). School quality, clustering and government subsidy in post-apartheid south africa,Economics of Education Review 30(1): 146–156.
28


![Equity & Excellence in Maine Schools · [District àFinance Section àTake Snapshot] Finance –Per Pupil Expenditure [Finance Section àClick Regular Instruction àTake Snapshot]](https://static.fdocuments.in/doc/165x107/5fd03a6d09799b1d91116a5b/equity-excellence-in-maine-schools-district-finance-section-take-snapshot.jpg)