THE EFFECTS OF PRECIPITATION ON RADAR TARGET ...
22
THE EFFECTS OF PRECIPITATION ON RADAR TARGET IDENTIFICATION AND IMAGING D. B. Hodge Th< J diversity ElectroScience Laboratory Depc Columbus, Ohio 43212 TECHNICAL REPORT 2374-19 November 1975 Grant No. NGR 36-008-080 National Aeronautics and Space Administration Goddard Space Flight Center Greenbelt, Maryland 20771
Transcript of THE EFFECTS OF PRECIPITATION ON RADAR TARGET ...
THE EFFECTS OF PRECIPITATION ON RADARTARGET IDENTIFICATION AND IMAGING
D. B. Hodge
Th< J diversity
ElectroScience LaboratoryDepc
Columbus, Ohio 43212
TECHNICAL REPORT 2374-19
November 1975
Grant No. NGR 36-008-080
National Aeronautics and Space AdministrationGoddard Space Flight Center
Greenbelt, Maryland 20771

NOTICES
When Government drawings, specifications, or other data areused for any purpose other than in connection with a definitelyrelated Government procurement operation, the United StatesGovernment thereby incurs no responsibility nor any obligationwhatsoever, and the fact that the Government may have formulated,furnished, or in any way supplied the said drawings, specifications,or other data, is not to be regarded by implication or otherwise asin any manner licensing the holder or any other person or corporation,or conveying any rights or permission to manufacture, use, or sellany patented invention that may in any way be related thereto.

THE EFFECTS OF PRECIPITATION ON RADAR
TARGET IDENTIFICATION AND IMAGING*
D. B. Hodge
ABSTRACT. The properties of precipitation which will influenceradar system design are discussed. The spatial characteristicsof rainfall and the sizes and shapes'of raindrops are de-scribed. The dielectric behavior of water is combined withthese characteristics to determine the effects of rain onelectromagnetic waves. These effects include: absorption,scatter, noise emission, phase shift, and depolarization.
******
The treatment of microwave propagation in the tropospherecan be a difficult task even in the case of a clear atmosphere.The presence of precipitation along a propagation path adds evenfurther complication to this task. This fact is primarily dueto the extreme spatial and temporal variability of precipitation.Fortunately, the basic interactions between electromagnetic wavesand precipitation are well understood and may be quantitativelydescribed with a reasonable degree of. certainty. It is th.e finescale spatial and temporal statistics of precipitation which,are not known adequately to permit detailed statistical de-scriptions of these interactions at the present time.
*Note: This report consists of the text of an invited paperpresented at the NATO Advanced Study Institute onAtmospheric Effects on Radar Target Identification andImaging held at Goslar, Federal Republic of Germany,from September 22 to October 3, 1975.
The objective of this tutorial paper is to provide theradar design engineer with enough basic, quantitative in-formation that he may establish realistic bounds on theperformance of a given radar system in the presence ofprecipitation. A great deal of information concerning thistopic is available in the literature, and much of this in-formation has been collected and summarized at the recentIUCRM Colloquium on the Fine Scale Structure of Precipitationand Electromagnetic Propagation, Nice, France, October, 1973.The entire proceedings of this meeting, including reviewpapers, are readily available in Reference 1 for furtherdetails covering these topics.
The likelihood of the occurence of precipitation ishighly variable and may be strongly dependent upon theclimatic region of the earth, the season of the year, thetime of day, and even, in some cases, the local topography.Nevertheless, one may expect precipitation at many points onthe earth's surface more than 5 per cent of the time and, ofcourse, considerably higher percentages of time for theoccurrence of precipitation along extended propagation paths.Therefore, if the impact of precipitation on system per-formance is significant, the reliability of the system maybe impaired beyond tolerable limits.
For our purposes, precipitation may be divided Intothree types: rain, snow, and hail. Rain consists of liquidwater drops which may be supercooled if they are carried abovethe 0°C isotherm by updrafts. These liquid water dropletsinteract strongly with propagating EM waves in the microwaveand millimeter wavelength portions of the spectrum; theseinteractions include attenuation, phase shift, scattering,depolarization, and noise emission. It must be emphasizedthat these effects are distinct from the effects of watervapor, i.e., water in its gasequs form, which is present inthe clear atmosphere. Snow and hail are normally forms ofsolid water which dp not interact strongly with EM waves inthis portion of the spectrum. One exception is, however,the case of melting hail or snow where scattering may beenhanced substantially; this effect leads to the bright bandwhich is often observed near the 0°C isotherm on RHI radardisplays. Since the effects of snow and hail are, in general,much less severe than those due to rain, the remainder ofthis paper will emphasize the impact of rain on radar systemperformance.
Three distinct types of rain merit discussion in thiscontext: convective, stratiform, and orographic, Convectiverain usually occurs in cells, i.e., discrete spatial regions,having horizontal dimensions of only a few kilometers. This
type of rain is generally associated with thunderstormactivity which can occur due to local convection on hotsummer days or due to the passage of a cold front. Thesecells may occur in clusters or in bands with regions of norainfall between the cells. The highest rain rates aregenerally associated with this type of rain. In contrast,stratiform rain occurs over widespread regions having dimen-sions on the order of tens of kilometers. Cellular regionsof higher rain rate may occur embedded in this light rain ratebackground; but, nevertheless, the maximum rain rates areusually considerably lower than those found in convectivestorms. Finally, orographic rain is that rainfall whichresults from local topographic effects; for example, thelifting of warm air masses over a mountain range may produceorographic rain having characteristics which are quite de-pendent upon the topography and local climatology. Since themost intense rain rates and, consequently, the most severeelectromagnetic interactions1 are associated with convectivecells we will specialize further to this case in the following.
It is well known that rain rate probability distributionsvary dramatically over the earth's surface. Nevertheless, itmay be argued that the physical processes leading to precipi-?tation, e.g., convection, are fairly universal and, therefore,that one may expect the physical properties of precipitation,cell shape and size, to be reasonably uniform even in differentclimatic regions. Thus, if this assumption is correct, one may.with care, be able to extrapolate some characteristics of rain-fall from one region to another with the understanding that theprobability of occurrence may vary drastically.
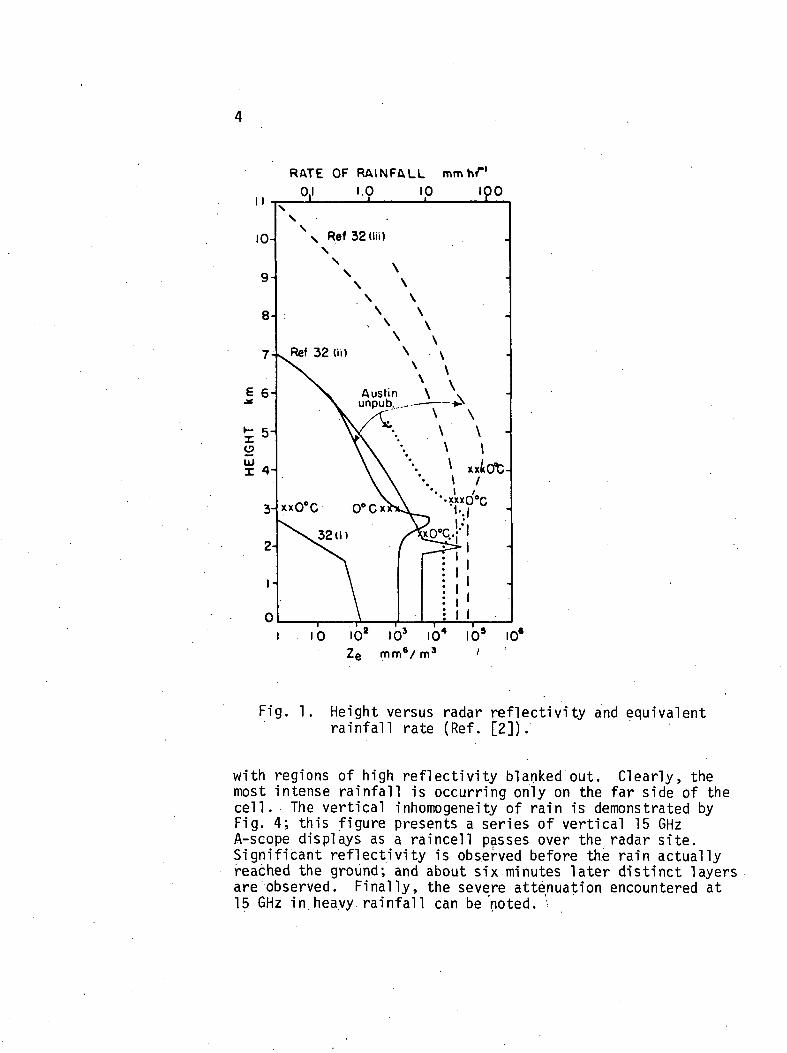
Convective rain cells typically have horizontal dimensionsof only a few kilometers but may be as large as 10-20 km insome cases [2]. The vertical extent of these cells may rangeup to 20 km; some sample plots of height versus radar re-flectivity and equivalent rainfall are shown in Fig. 1.
The cellular nature of such rainfall is exemplified by the10 GHz PPI display shown in Fig. 2. This figure shows a col-rlection of at least 7 clearly discernible rain cells within aradius of 12 miles of the radar site at Columbus, Ohio, USA,on a July day; several cells having nonsymmetrical shapes andthe clear areas between cells can also be noted. Cell orienta-tion as well as orientation between cells tends to show aniso-tropic characteristics with preferred directions related tothe climatology of the region [3]. The spatial inhomogeneityof rainfall can be quite significant as demonstrated by Fig. 3;in this figure two 15 GHz PPI displays of the same rain cellare presented. The first PPI display shows the shape of thecell; and the second contour mode PPI display shows the cell
RATE OF RAINFALL mm hr1
0,1 1.9 10 ipo
xxO'C O eCx
32(1)
I 10 10* I03 10* 10* I06
Ze mm6/ m3 /
Fig, 1. Height versus radar reflectivity and equivalentrainfall rate (Ref. [2]j.
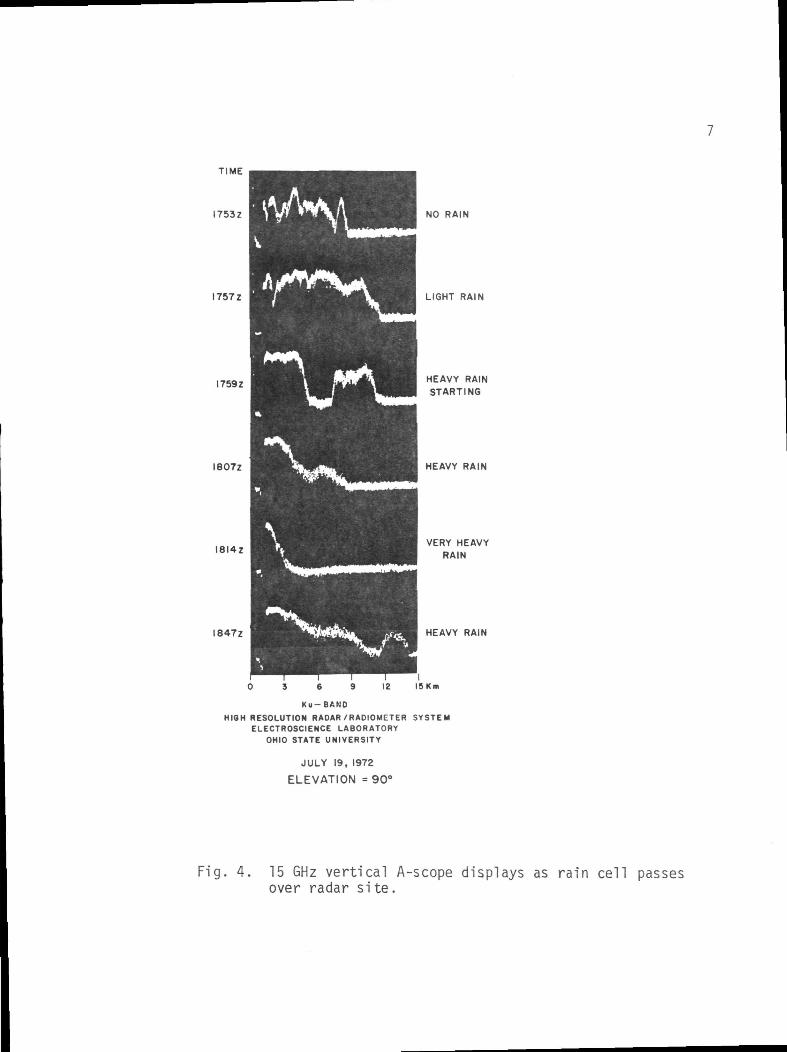
with regions of high reflectivity blanked out. Clearly, themost intense rainfall is occurring only on the far side of thecell. The vertical inhomogeneity of rain is demonstrated byFig. 4; this figure presents a series of vertical 15 GHzA-scope displays as a raincell passes over the radar site.Significant reflectivity is observed before the rain actuallyreached the ground; and about six minutes later distinct layersare observed. Finally, the severe attenuation encountered at15 GHz in heavy rainfall can be noted.
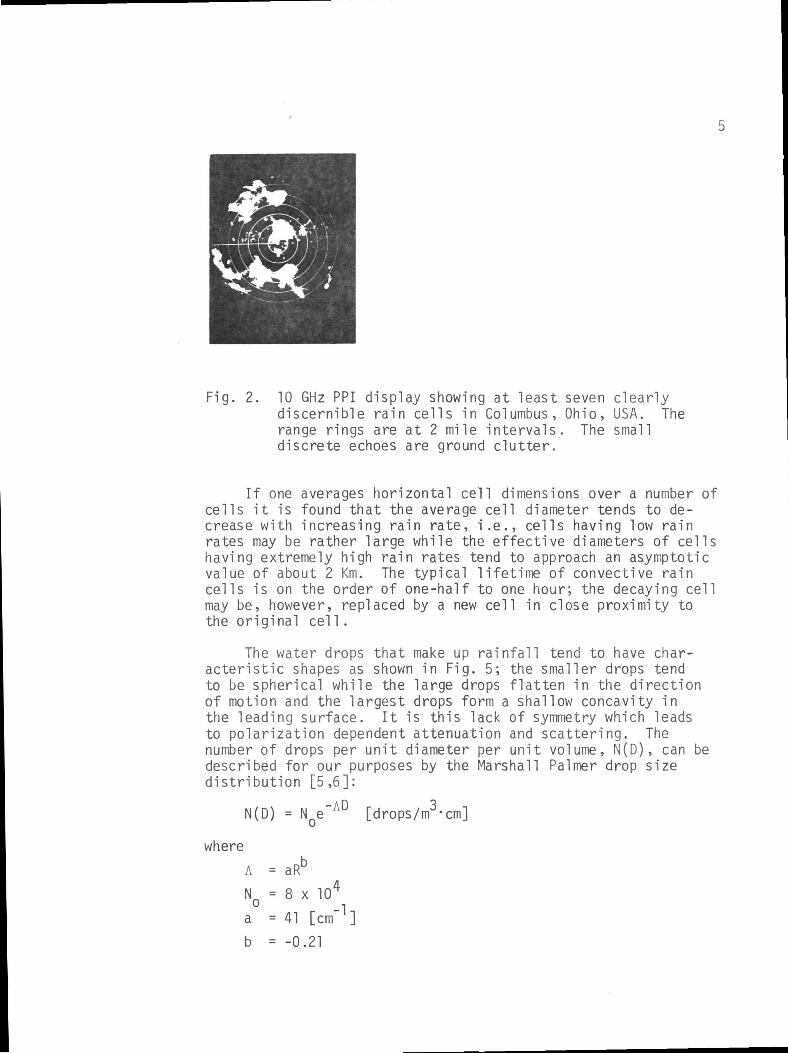
Fig. 2. 10 GHz PPI display showing at least seven clearlydiscernible rain cells in Columbus, Ohio, USA. Therange rings are at 2 mile intervals. The smalldiscrete echoes are ground clutter.
If one averages horizontal cell dimensions over a number ofcells it is found that the average cell diameter tends to de-crease with increasing rain rate, i.e., cells having low rainrates may be rather large while the effective diameters of cellshaving extremely high rain rates tend to approach an asymptoticvalue of about 2 Km. The typical lifetime of convective raincells is on the order of one-half to one hour; the decaying cellmay be, however, replaced by a new cell in close proximity tothe original cell.
The water drops that make up rainfall tend to have char-acteristic shapes as shown in Fig. 5; the smaller drops tendto be spherical while the large drops flatten in the directionof motion and the largest drops form a shallow concavity inthe leading surface. It is this lack of symmetry which leadsto polarization dependent attenuation and scattering. Thenumber of drops per unit diameter per unit volume, N ( D ) , can bedescribed for our purposes by the Marshall Palmer drop sizedistribution [5,6]:
N(D) = N e AD [drops/m3-cm]
where
A
Nca
b
= aRu
= 8 x 104
= 41 [cm"1]
- -0.21
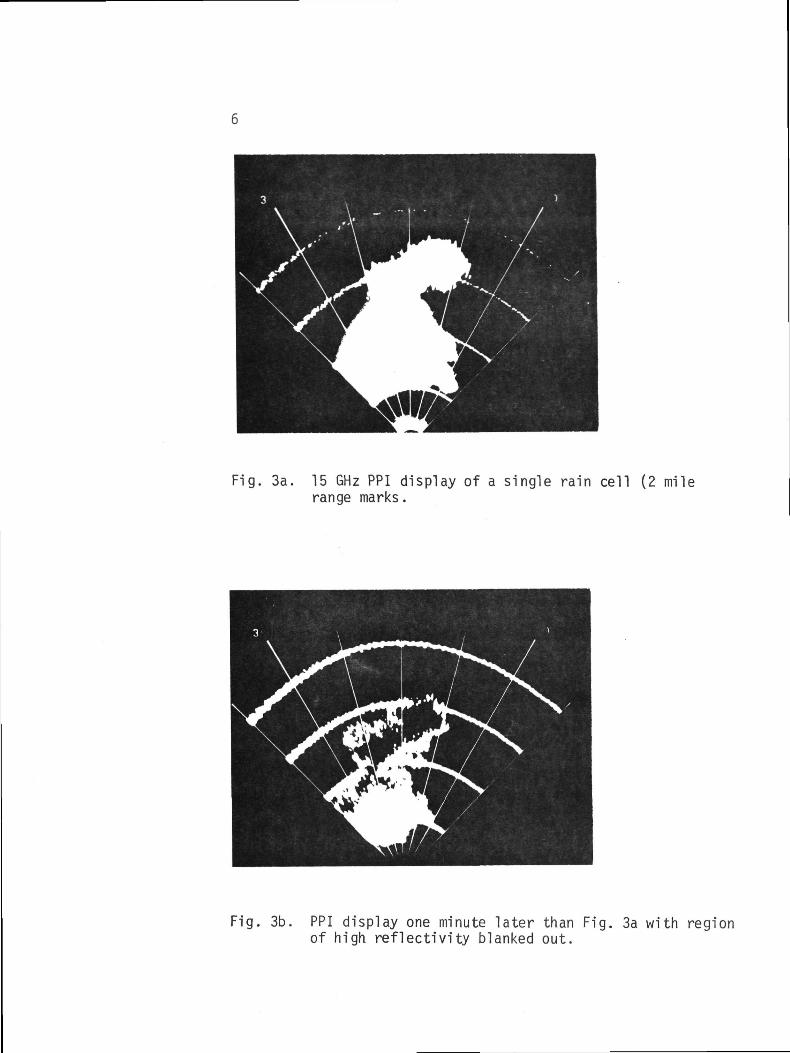
Fig. 3a. 15 GHz PPI display of a single rain cell (2 milerange marks.
Fig. 3b. PPI display one minute later than Fig. 3a with regionof high reflectivity blanked out.
TIME
I753Z
I757Z
17592
I807Z
I8 I4Z
I847Z
6 12
NO RAIN
LIGHT RAIN
HEAVY RAINSTARTING
HEAVY RAIN
VERY HEAVYRAIN
HEAVY RAIN
15 Km
Ku-BANDHIGH RESOLUTION RADAR /RADIOMETER SYSTEM
ELECTROSCIENCE LABORATORYOHIO STATE UNIVERSITY
JULY 19, 1972
ELEVATION = 90°
Fig. 4. 15 GHz vertical A-scope displays as rain cell passesover radar site.

8
a0= l.lmm a0=2mm a0=4mm
Fig. 5. Characteristic rain drop shapes for drops withrotational symmetry (Ref. [4]). (a0 = radius ofsphere having equal volume.)
and D is in centimeters and R in mm/hr. This distribution isshown in Fig. 6 for various rain rates; it can be noted thatdrop sizes larger than 5 mm are extremely rare. As the rainrate increases, the number of large drops increases; and theseelectrically large drops tend to dominate the electromagneticinteractions. It is of interest to note that the liquid watercontent of rainfall is normally much less than the equivalentliquid water content of the water vapor contained in even anormal dry day as shown in Fig. 7. The parameter rain rate isused widely in describing precipitation since it is a quantitywhich is easily measured at the surface of the earth. Thisparameter can, however, be misleading since rain drops may becarried upward within a rain cell due to strong updrafts;therefore, this parameter must be used with a degree of caution.
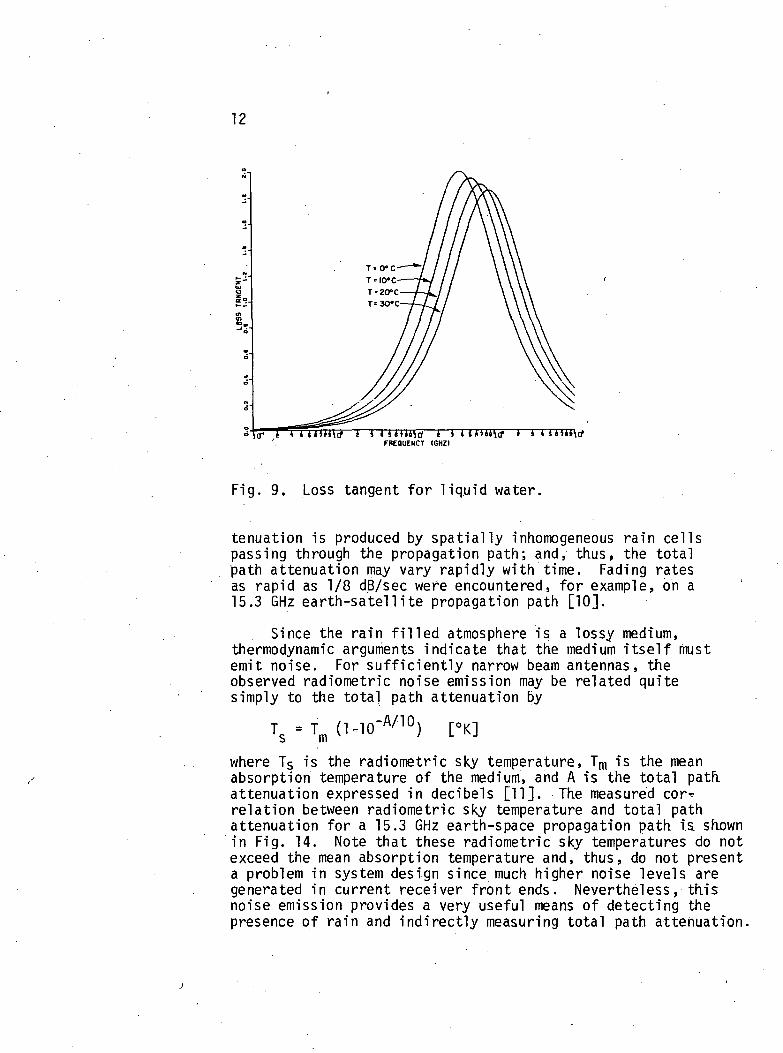
The relative dielectric constant and loss tangent of liquidwater are shown in Figs. 8 and 9 [7]. Thesy curves show arather marked temperature dependence which tends to be maskedby other factors when attenuation and scattering calculationsare performed. We also observe that the loss tangent is largeover the frequency range of roughly 10 to 100 GHz,
The presence of these dielectric drops along the propaga^tion path of an electromagnetic wave gives rise to a number ofresultant effects as shown pictorially in Fig. 10. Theseeffects include; attenuation, dispersive phase shift, de-polarization, change in angle of arrival , backscatter, andnoise emission. The attenuation results from both absorptionand scattering loss and may be expressed as
a, = a + a [dB/Km]L a 5

1000
EEccUJa.
1CE
g 100
octo
o6
S '0
1.0
250mm/hr 'lOOmm/hr DOWN POUR50 mm/hr25mm/hr HEAVY RAIN12.5 mm/hr2.5 mm/hr LIGHT RAIN0.25 mm/hr DRIZZLE
2 3 4 5 6 7 8 9 10 II 12D.DROP DIAMETER (mm)
Fig. 6. Drop size distributions.
where
at = total attenuation rate
aa = rate of attenuation due to absorption
as = rate of attenuation due to scattering
and either attenuation rate is given by
a. = 4.343 Q.(D)N(D)dD.•"o

in .
100
Zo
o:UJ
0.01
HUMID ATMOSPHERE
DRY ATMOSPHERE
I I l l l l l0.1 1.0 10 100
RAIN RATE ( mm/hr >
1000
Fig. 7. Equivalent liquid water content of rainfall andwater vapor for typical dry and humid atmospheres,
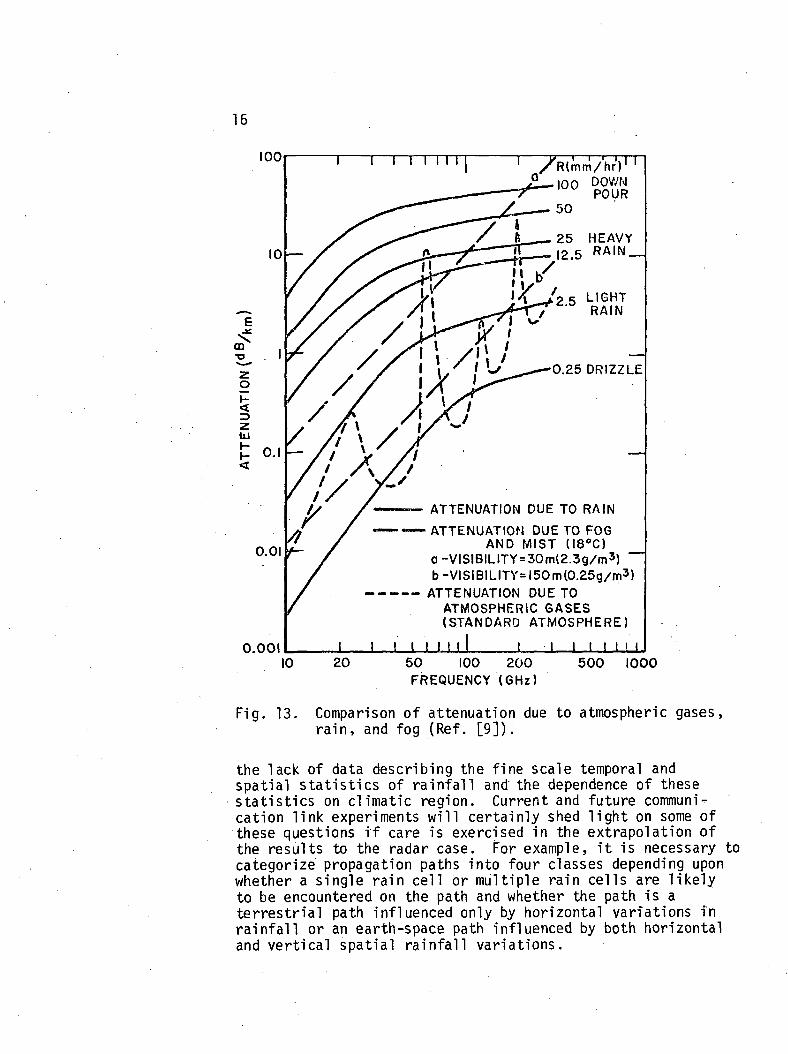
Here, Q-j is either the absorption or total scattering crosssection of a drop of diameter D [8]. These cross sections are,of course, dependent upon frequency as well as the drop tempera-. ture and drop size. Plots of these attenuation rates are givenin Fig. 11 for various rain rates; these calculations were basedupon the Marshall Palmer drop size distribution, Stogryn'sdielectric constant, and the Mie cross sections for spherical,lossy dielectric drops. For low rain rates and/or low fre-quencies the dominant effect is that of absorption; however,for higher frequencies and/or higher rain rates scattering losscan become significant. This characteristic is emphasized bythe plot of albedo, i.e., the ratio of scatter loss to totalattenuation, shown in Fig. 12; the albedo approaches 0.5 forhigh frequencies and high rain rates just as the albedo of asingle large drop approaches 0.5 with increasing size. Theattenuation rate is plotted along with the attenuation ratesdue to fog and atmospheric gases in Fig. 13; this figure In-*dicates that attenuation due to rain may be as much, as anorder of magnitude higher than that encountered in either fogor clean air at most frequencies of interest. This rain atr

. 8a.
T = 0"C•T=IO«C'
T = 20«c
•T. 30»c
""'"» <»«)ectr1c constant of
T * 0«c
T = IO°C
rntBUEWr (GHZJ '^ * * TT7TO\a-
FIQ. 8b. Imaginary part nf *i,^ "'quid waLV ^ "'"'« Iflectrte constant
12
FREflUEWCT (GHZ)
Fig. 9. Loss tangent for liquid water.
tenuation is produced by spatially inhomogeneous rain cellspassing through the propagation path; and, thus, the totalpath attenuation may vary rapidly with time. Fading ratesas rapid as 1/8 dB/sec were encountered, for example, on a15.3 GHz earth-satellite propagation path £10].
Since the rain filled atmosphere is a lossy medium,thermodynamic arguments indicate that the medium itself mustemit noise. For sufficiently narrow beam antennas, tfieobserved radiometric noise emission may be related quitesimply to the total path attenuation by
T s = T m ( l - 1 0 -A/10
where TS is the radiometric sky temperature, Tm is the meanabsorption temperature of the medium, and A is the total path,attenuation expressed in decibels [11]. The measured cor-relation between radiometric sky temperature and total pathattenuation for a 15.3 GHz earth-space propagation path is. shownin Fig. 14. Note that these radiometric sky temperatures do notexceed the mean absorption temperature and, thus, do not presenta problem in system design since much higher noise levels aregenerated in current receiver front ends. Nevertheless, thisnoise emission provides a very useful means of detecting thepresence of rain and indirectly measuring total path, attenuation.

13
TARGET
ATTENUATIONPHASE SHIFTDEPOLARIZATION
ANGLE OF ARRIVAL
Fig. 10. Interactions between an electromagnetic wave and rain,
It has. already been pointed out that scattering producesattenuation; in addition, the energy backscattered to theradar produces a radar return, i.e., clutter. The radar rangeequation for this clutter case is
c T PRCVD
TRANS
where A is the wavelength, G is the radar antenna gain, c isthe velocity of propagation, T is the radar pulse length, r isthe range to the scattering volume, n is the volumetric radarcross section of the rain, and PjRANS and PRCVD are the trans-mitted and received powers, respectively [12]. The r2 rangedependence is a consequence of the assumption that the radarresolution cell is filled with rain. The volumetric radarcross section is given by
-IJo a(D)N(D)dD
where a is the'usual radar backscatter cross section of asingle rain drop of diameter D; n is plotted in Fig. 15 forvarious rain rates. The calculation of the volumetric radarcross sections shown in Fig. 15 were based on the same as-sumptions as those noted earlier for the attenuation calcu-lation shown in Fig. 11. This radar backscatter signal isproduced by scattering from many randomly spaced rain drops;consequently, the signal varies randomly about a mean value

14
100
10
tn£
O.I
0.01
0.001
— T • 273
10 20 30 40f (GHz )
50
Fig. 11. Attenuation rates in rain.
as the relative positions of the drops change. The time to in-dependence, i.e., the time required for the drops to rearrangethemselves so that an uncorrelated signal is produced, is on theorder of milliseconds to tens of milliseconds for typical radarfrequencies [13].
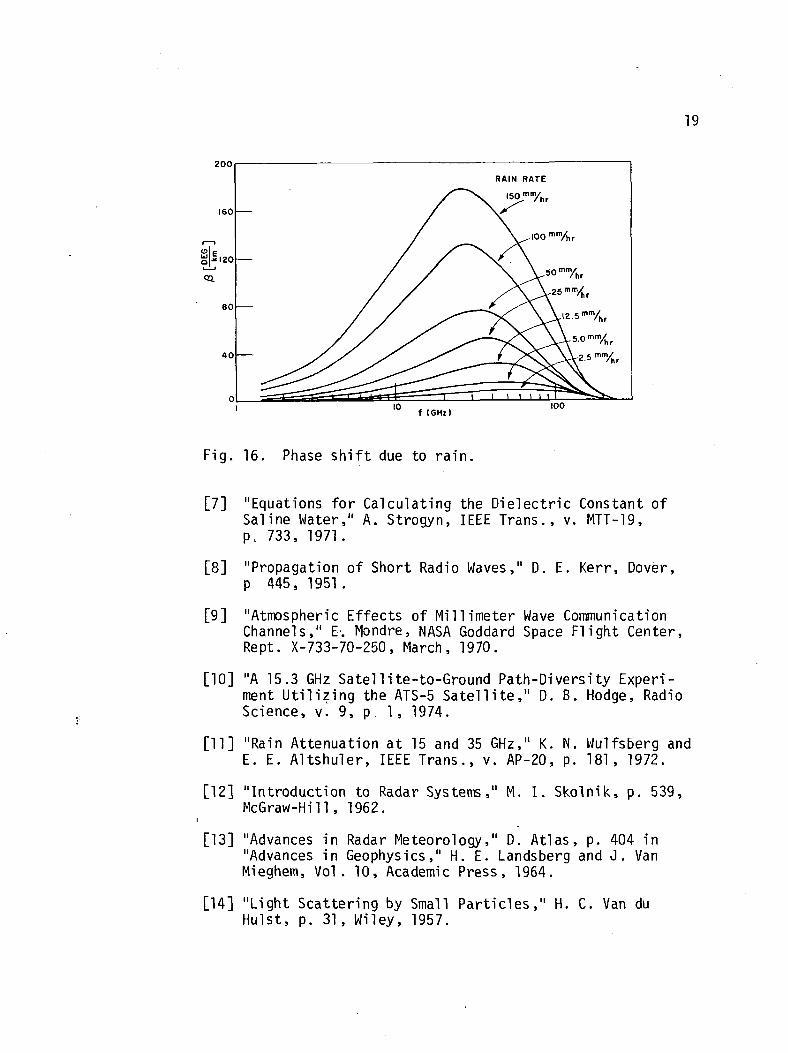
As a wave propagates through rain it suffers a phase shiftin addition to the attenuation described earlier. This phaseshift may be calculated using the methods of Van du Hulst [14].Phase shifts calculated in this manner are shown in Fig. 16 [15].These phase shifts are recognized to be comparable or, in somecases, less than the phase shifts produced by the atmosphericgases in clear air [16]. However, it may be that the inhomo-^geneity of the rainfall within the illuminated region may

15
Fig. 12. Albedo as a function of rain rate and frequency.
produce nonum'form phase shifts and attenuation across the beamwhich, in turn, may alter the direction of propagation. Thereis very little data available at the present time concerningthese effects.
It was noted earlier that nonspherical drop shapes producedepolarization. These effects are discussed in considerable de-tail in another paper presented at this meeting [17], Let itsuffice here to simply indicate the magnitude of this problemin intense rain; in this case, differential attenuations ashigh as 5 dB/Km, differential phase shifts as large as -20deg/Km, and cross polarization coupling exceeding -20 dB maybe encountered between orthogonal linear polarizations [18].
The preceding discussion has indicated the nature of theinteractions between propagating electromagnetic waves and rain.These effects are reasonably well understood and their grossinfluence on system performance may be estimated. In most cases,however, little information is available concerning the likeli-hood of occurrence of these effects. This is largely due to
16
100
10
zo
zUJ
O.I
0.01
0.001
I I I I I I I I /Rtfnm/hrV '100 DOWN
POUR50
25 HEAVY12.5 RAIN_
/25 LIGHTRAIN
0.25 DRIZZLE
ATTENUATION DUE TO RAIN
ATTENUATION DUE TO FOGAND MIST (I8°C)
a-VISIBILITY = 30m(2.3g/m3) ~b-VISIBILITY=l50ml0.25g/m3)
ATTENUATION DUE TOATMOSPHERIC GASES(STANDARD ATMOSPHERE)
I I I I I I I I I I I10 20 50 100 200
FREQUENCY (GHz)500 1000
Fig. 13. Comparison of attenuation due to atmospheric gases,rain, and fog (Ref. [9]).
the lack of data describing the fine scale temporal andspatial statistics of rainfall and the dependence of thesestatistics on climatic region. Current and future communi-cation link experiments will certainly shed light on some ofthese questions if care is exercised in the extrapolation ofthe results to the radar case. For example, it is necessary tocategorize propagation paths into four classes depending uponwhether a single rain cell or multiple rain cells are likelyto be encountered on the path and whether the path is aterrestrial path influenced only by horizontal variations inrainfall or an earth-space path influenced by both horizontaland vertical spatial rainfall variations.

17
— 122
— 124
— 126
— 128
- -130CD
ill ~132
>UJ
-136
csen
— 138
—140
— 142
—144
SIGNAL LEVELvs
- RADIOMETRIC TEMPERATURE
f= 15.3 GHzSITE NO. 1
JUNE 17, 197023I5Z — 2330z
10 SAMPLE AVERAGE
(Tm = 278°K)
100 200T ( ° K )
300
Fig. 14. Comparison of rain attenuation and radiometric skytemperature.
REFERENCES
[1] IURCUM Colloquium on the Fine Scale Structure ofPrecipitation and Electromagnetic Propagation, Nice,France, October, 1974. Entire proceedings contained inJournal de Recherches Atmospheriques, v. 8, No. 1-2, 1974.
[2] "The Structure of Precipitation Systems - A Review,"T. W. Harrold and P. M. Austin, Journal de RecherchesAtmospheriques, v. 8, No. 1-2, p. 41, 1974.
[3] "Radar Measurements of Site-Diversity Improvement DuringPrecipitation," J. I. Strickland, Journal de RecherchesAtmospheriques, v. 8, No. 1-2, p. 451, 19.74.

10'
icr
4O
io-IE<a<OL
10'
10'
RAIN RATE
250
10 20 30 . 40 50f ( G H z )
Fig. 15. Volumetric radar backscatter cross section of ratn.
[4] "A Semi-Empirical Determination of the Shape of Cloudand Rain Drops," H. R. Pruppacher and R. L. Fitter, Jour,Atmospheric Sci., v. 28, p. 86, 1971.
[5] "The Distribution of Raindrops with Size," 0. S. Marshalland W. M. Palmer, Jour, of Meteorology, v. 5, p. 165, 1948,
[6] "The Cloud Physics of Particle Size Distributions - AReview," R. C. Srivastava, Journal de RecherchesAtmospheriques, v. 8, No. 1*2, p. 23, 1974,
19
200
25mm/hr
12.5""%,
5.0mm/hr
2.5 "<•"/
f (GHz)
Fig. 16. Phase shift due to rain.
[7] "Equations for Calculating the Dielectric Constant ofSaline Water," A. Strogyn, IEEE Trans., v. MTT-19,p. 733, 1971.
[8] "Propagation of Short Radio Waves," D. E. Kerr, Dover,p 445, 1951.
[9] "Atmospheric Effects of Millimeter Wave CommunicationChannels," E. Mondre, NASA Goddard Space Flight Center,Rept. X-733-70-250, March, 1970.
[10] "A 15.3 GHz Satellite-to-Ground Path-Diversity Experi-ment Utilizing the ATS-5 Satellite," D. B. Hodge, RadioScience, vi 9, p. 1, 1974.
[11] "Rain Attenuation at 15 and 35 GHz," K. N. Wulfsberg andE. E. Altshuler, IEEE Trans., v. AP-20, p. 181, 1972.
[12] "Introduction to Radar Systems," M. I. Skolnik, p. 539,McGraw-Hill, 1962.
[13] "Advances in Radar Meteorology," D. Atlas, p. 404 in"Advances in Geophysics," H. E. Landsberg and J. VanMieghem, Vol. 10, Academic Press, 1964.
[14] "Light Scattering by Small Particles," H. C. Van duHulst, p. 31, Wiley, 1957.
20
[15] "Computed Transmission through Rain at Microwave andVisible Frequencies," D. E. Setzer, Bell Sys, Tech.Jour., v. 49, p. 1873, 1970.
[16] "Transit-Time Variations in Line-of-Sight TroposphericPropagation Paths," D. A. Gray, Bell Sys. Tech. Journ.,v. 49, p. 1059, 1970.
[17] "Some Polarization Effects for Millimeter Wave Propa-gation in Rain," W. Vogel, NATO Advanced Study Institute,Goslar, Germany, September 22-October 3, 1975.
[18] "Differential Attenuation and Differential Phase Shift ofRadio Waves due to Rain: Calculations at Microwave andMillimeter Wave Regions," T. Oguchi and Y. Hosoya, Jour,de Recherches Atmospheriques, v. 8, No. 1-2, p. 121, 1974.