The Effects of Micro-Dimple Texture on the Friction and ...
65
Wright State University Wright State University CORE Scholar CORE Scholar Browse all Theses and Dissertations Theses and Dissertations 2016 The Effects of Micro-Dimple Texture on the Friction and Thermal The Effects of Micro-Dimple Texture on the Friction and Thermal Behavior of a Point Contact Behavior of a Point Contact Utsav Kamleshbhai Parmar Wright State University Follow this and additional works at: https://corescholar.libraries.wright.edu/etd_all Part of the Mechanical Engineering Commons Repository Citation Repository Citation Parmar, Utsav Kamleshbhai, "The Effects of Micro-Dimple Texture on the Friction and Thermal Behavior of a Point Contact" (2016). Browse all Theses and Dissertations. 1478. https://corescholar.libraries.wright.edu/etd_all/1478 This Thesis is brought to you for free and open access by the Theses and Dissertations at CORE Scholar. It has been accepted for inclusion in Browse all Theses and Dissertations by an authorized administrator of CORE Scholar. For more information, please contact [email protected].
Transcript of The Effects of Micro-Dimple Texture on the Friction and ...

Wright State University Wright State University
CORE Scholar CORE Scholar
Browse all Theses and Dissertations Theses and Dissertations
2016
The Effects of Micro-Dimple Texture on the Friction and Thermal The Effects of Micro-Dimple Texture on the Friction and Thermal
Behavior of a Point Contact Behavior of a Point Contact
Utsav Kamleshbhai Parmar Wright State University
Follow this and additional works at: https://corescholar.libraries.wright.edu/etd_all
Part of the Mechanical Engineering Commons
Repository Citation Repository Citation Parmar, Utsav Kamleshbhai, "The Effects of Micro-Dimple Texture on the Friction and Thermal Behavior of a Point Contact" (2016). Browse all Theses and Dissertations. 1478. https://corescholar.libraries.wright.edu/etd_all/1478
This Thesis is brought to you for free and open access by the Theses and Dissertations at CORE Scholar. It has been accepted for inclusion in Browse all Theses and Dissertations by an authorized administrator of CORE Scholar. For more information, please contact [email protected].

The Effects of Micro-dimple Texture on the
Friction and Thermal Behavior of a Point
Contact
A thesis submitted in partial fulfillment Of the requirements for the degree of
Master of Science in Mechanical Engineering
By
Parmar Utsav AKA Sagar Kamleshbhai
B.Tech., Ganpat University, 2013
2016
Wright State University

WRIGHT STATE UNIVERSITY
GRADUATE SCHOOL
04/22/2016
I HEREBY RECOMMEND THAT THE THESIS PREPARED UNDER MY SUPER-
VISION BY Parmar Utsav AKA Sagar Kamleshbhai ENTITLED The Effects of Micro-
dimple Texture on the Friction and Thermal Behavior of a Point Contact BE ACCEPTED
IN PARTIAL FULFILLMENT OF THE REQUIREMENTS FOR THE DEGREE OF
Master of Science in Mechanical Engineering.
Sheng Li, Ph.D.
Thesis Director
George P.G. Huang, Ph.D.
Department Chair
Committee on Final Examination
Sheng Li, Ph.D.
Ahsan Mian, Ph.D.
Nikolai V. Priezjev, Ph.D.
Robert E. W. Fyffe, Ph.D.
Vice President for Research and
Dean of the Graduate School

iii
ABSTRACT
Parmar, Utsav AKA Sagar Kamleshbhai. M.S.M.E., Department of Mechanical and
Materials Engineering, Wright State University, 2016. The Effects of Micro-dimple Texture
on the Friction and Thermal Behavior of a Point Contact
This study investigates the effects of the micro-dimple texture on the friction and
surface temperature performances of a ball-on-disk contact, operating under the speed and
load ranges that cover typical gearing applications. Circular shaped micro-dimple arrays
with different dimple center distances and dimple depths are implemented on the ball
surface to quantify the impacts of these two parameters on the friction coefficient and the
maximum ball surface temperature. In addition, the contacts of three surface texture
combinations, namely micro-dimpled and polished ball surface versus polished disk
surface, polished ball surface versus polished disk surface and ground ball surface versus
ground disk surface, are compared to demonstrate any beneficial or detrimental effect of
micro-dimples in heavily loaded high speed applications. This study adopts a thermal
mixed EHL point contact model, whose capability and accuracy have been well
demonstrated by comparing to the experimental measurements, to quantify the
deterministic tribological behavior within the contact, allowing the exploration of the
underlying mechanism that governs the role of micro-dimples in the elastohydrodynamic
lubrication.

iv
TABLE OF CONTENTS
1 CHAPTER 1 INTRODUCTION ............................................................................. 1
1.1 Background and Motivation ................................................................................. 1
1.2 Literature Review ................................................................................................. 2
1.3 Thesis Objectives ................................................................................................. 7
1.4 Thesis Outline ...................................................................................................... 8
2 CHAPTER 2 A THERMAL MIXED EHL MODEL FOR POINT CONTACTS
..................................................................................................................................... 9
2.1 Governing Formulations ...................................................................................... 9
2.2 Numerical Solution Procedures .......................................................................... 14
3 CHAPTER 3 SIMULATIONS AND DISCUSSION ........................................... 16
3.1 Contact Set-up .................................................................................................... 16
3.2 Operating Conditions ......................................................................................... 21
3.3 Simulation Results.............................................................................................. 24
4 CHAPTER 4 CONCLUSION................................................................................ 46
4.1 Conclusions ........................................................................................................ 46
4.2 Recommendation for Future Work .................................................................... 47
5 REFERENCES ........................................................................................................ 49

v
LIST OF FIGURES
Figure 2-1 Flowchart of the thermal mixed EHL computation. ....................................... 15
Figure 3-1 The contact set-up between a circular ball and a flat disk .............................. 17
Figure 3-2 The surface topographies of (a) ball specimen and (b) disk specimen for the type
I surface texture combination defined in Table 3.1 .......................................................... 20
Figure 3-3 The surface topography of the ground surface. ............................................... 22
Figure 3-4 The variations of W and hp with time for one complete ball-on-disk contact
simulation. ......................................................................................................................... 23
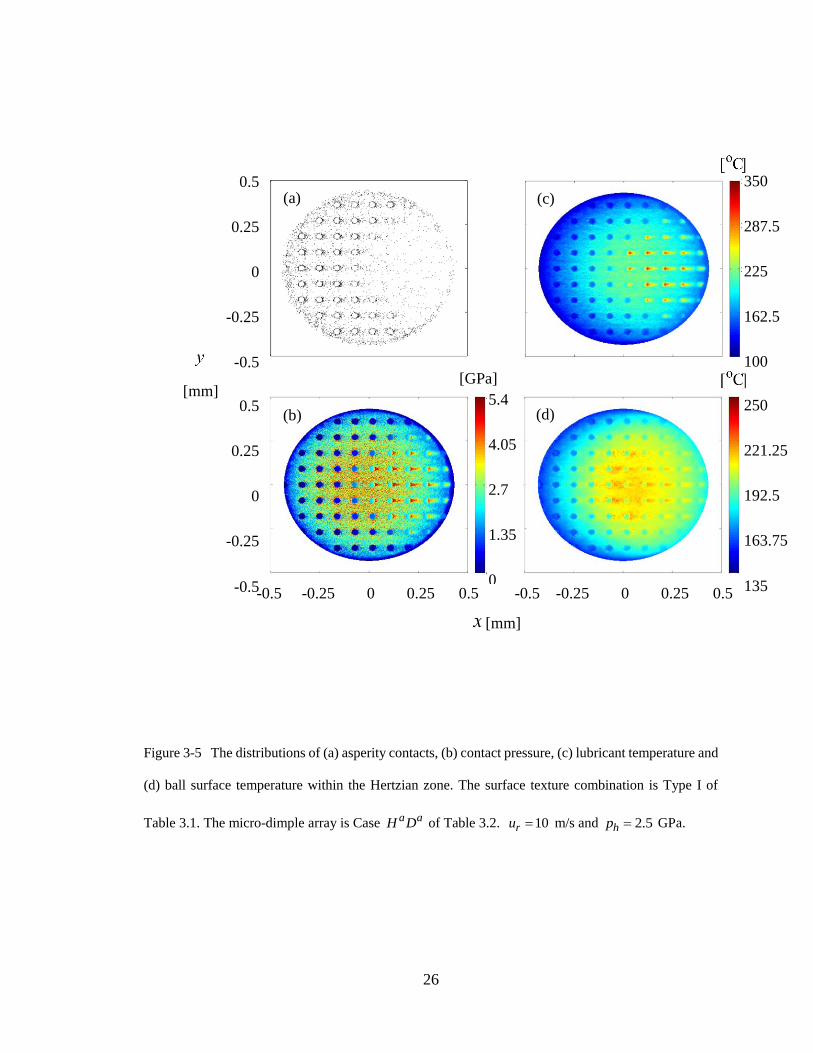
Figure 3-5 The distributions of (a) asperity contacts, (b) contact pressure, (c) lubricant
temperature and (d) ball surface temperature within the Hertzian zone. The surface texture
combination is Type I of Table 3.1. The micro-dimple array is Case a aH D of Table 3.2.
10ru m/s and 2.5hp GPa. ........................................................................................... 26
Figure 3-6 The comparisons of (a) and (b) max1T between the micro-dimple array Cases
a aH D , a bH D and a cH D (defined in Table 3.2) for the type I surface texture combination
(defined in Table 3.1) under 10ru m/s. .......................................................................... 28
Figure 3-7 The comparison of the asperity contact activity (left column) and the contact
pressure (right column) between the micro-dimple array cases (a) a aH D , (b) a bH D and (c)
a cH D within the Hertzian Zone. The surface texture combination is Type I of Table 3.1.
10ru m/s, and 2.5hp GPa. ........................................................................................... 29

vi
Figure 3-8 The comparisons of (a) and (b) max1T between the micro-dimple array Cases
b aH D , b bH D and b cH D (defined in Table 3.2) for the type I surface texture combination
(defined in Table 3.1) under 10ru m/s. .......................................................................... 30
Figure 3-9 The comparisons of (a) and (b) max1T between the micro-dimple array Cases
c aH D , c bH D ,and c cH D (defined in Table 3.2) for the type I surface texture combination
(defined in Table 3.1) under 10ru m/s. .......................................................................... 31
Figure 3-10 The comparisons of (a) and (b) max1T between the micro-dimple array Cases
a aH D , a bH D and a cH D (defined in Table 3.2) for the type I surface texture combination
(defined in Table 3.1) under 5ru m/s. ........................................................................... 32
Figure 3-11 The comparisons of (a) and (b) max1T between the micro-dimple array Cases
b aH D , b bH D and b cH D (defined in Table 3.2) for the type I surface texture combination
(defined in Table 3.1) under 5ru m/s. ........................................................................... 33
Figure 3-12 The comparisons of (a) and (b) max1T between the micro-dimple array Cases
c aH D , c bH D and c cH D (defined in Table 3.2) for the type I surface texture combination
(defined in Table 3.1) under 5ru m/s. ........................................................................... 34
Figure 3-13 The comparisons of (a) and (b) max1T between the micro-dimple array Cases
a aH D , a bH D and a cH D (defined in Table 3.2) for the type I surface texture combination
(defined in Table 3.1) under 0.5ru m/s. ........................................................................ 35

vii
Figure 3-14 The comparisons of (a) and (b) max1T between the micro-dimple array Cases
b aH D , b bH D and b cH D (defined in Table 3.2) for the type I surface texture combination
(defined in Table 3.1) under 0.5ru m/s. ........................................................................ 36
Figure 3-15 The comparisons of (a) and (b) max1T between the micro-dimple array Cases
c aH D , c bH D and c cH D (defined in Table 3.2) for the type I surface texture combination
(defined in Table 3.1) under 0.5ru m/s. ........................................................................ 37
Figure 3-16 The variations of (left column) and max1T (right column) with the dimple
center distance D and the dimple depth H at the rolling velocities (a) 10ru m/s, (b) 5ru
m/s and (c) 0.5ru m/s and the lowest loading stage 0.5hp GPa for the type I surface
texture combination (defined in Table 3.1). ...................................................................... 39
Figure 3-17 The variations of (left column) and max1T (right column) with the dimple
center distance D and the dimple depth H at the rolling velocities (a) 10ru m/s, (b) 5ru
m/s and (c) 0.5ru m/s and the median loading stage 1.5hp GPa for the type I surface
texture combination (defined in Table 3.1). ...................................................................... 40
Figure 3-18 The variations of (left column) and max1T (right column) with the dimple
center distance D and the dimple depth H at the rolling velocities (a) 10ru m/s, (b) 5ru
m/s and (c) 0.5ru m/s and the highest loading stage 2.5hp GPa for the type I surface
texture combination (defined in Table 3.1). ...................................................................... 41

viii
Figure 3-19 The comparisons of between Type I (with a aH D dimple array), II and III
surface texture combinations under (a) 10ru m/s, (b) 5ru m/s and (c) 0.5ru m/s. . 43
Figure 3-20 The comparisons of the asperity contact activity (left column) and the contact
pressure (right column) between the surface texture combinations of (a) Type I with a aH D
dimple array, (b) Type II and (c) Type III within the Hertzian zone. 10ru m/s, and
2.5hp GPa. ...................................................................................................................... 44
Figure 3-21 The comparisons of max1T between Type I (with a aH D dimple array), II and
III surface texture combinations under (a) 10ru m/s, (b) 5ru m/s and (c) 0.5ru m/s.
........................................................................................................................................... 45

ix
LIST OF TABLES
Table 3-1 List of the surface texture conditions of the contact pair. ................................ 18
Table 3-2 Definition of simulation case numbers for different combinations of dimple
depth, H and dimple center distance, D ........................................................................... 19

x
ACKNOWLEDGEMENTS
I would like to express my sincere gratitude to Dr. Sheng Li for believing in me and
giving me this opportunity. He is full of knowledge and mentored me through the project.
I gained tremendous amount of knowledge from him. He is so supportive and encouraged
me all the way from the beginning.
I would like to thank my committee members (Drs. Ahsan Mian and Nikolai
Priezjev) for their kindness and time. I would also like to thank Anusha Anisetti for guiding
me through things and for spending her time enlarging the scope of my work.
Last but most importantly to my Parents, my Sister Dhruva, my Brother Ronak and
my Fiancé Srushti for being so supportive from the beginning and for making what I am
today. Their love and belief in me made me pursue Masters in this esteemed university.
This study was sponsored by the Research Initiation Grant of the Wright State
University.

xi
Dedicated to my parents

1
1 CHAPTER 1
INTRODUCTION
1.1 Background and Motivation
The micro-scale surface topography of rolling mechanical elements (bearings and
gears for example) plays an important role in the frictional power loss [1-4], the surface
wear [5, 6], the rolling contact fatigue (micro and macro scale pitting) failure [7-12], and
the surface temperature related scuffing failure [13-15]. In the heavily loaded contacts of
gearing applications, the presence of the significant surface roughness profiles (tool marks)
due to the finishing processes, such as shaving and grinding, introduces frequent asperity
Contacts within the elastohydrodynamic lubrication (EHL) conjunction. These localized
asperity contacts coexist with the surrounding hydrodynamic fluid film, sharing the normal
contact load. Such a lubrication condition is commonly referred as the mixed EHL [16].
Owing to the asperity contacts, the lubrication film breaks down, where not only the surface
tractions but also the surface temperature peak, dictating the friction [1-3], and the failures
of fatigue [11] and scuffing [15]. To improve the rolling contact performances in these

2
aspects, the surface polishing process that eliminates the local roughness peaks has been
shown to be a successful method [1, 17-21]. The reduced roughness amplitude results in a
more continuous lubrication film, decreasing the possibility of asperity contacts. A
potential alternative to the surface polishing method is the micro-surface-texturing
approach, which implements arranged micro-dimples of various shapes and patterns onto
the contact surfaces [4]. These dimples contribute mainly by acting as lubricant reservoirs
to provide lubricant under the starved lubrication condition (for instance, when the surface
velocities are low or the surface roughness is significant), and micro-hydrodynamic
bearings to provide additional load-carrying capacity (when the surface velocities are
sufficiently high to allow hydrodynamic effects). In addition, the dimples can trap wear
particles to reduce the third-body induced surface stress concentrations, friction and wear.
This study thus aims at quantifying the impacts of micro-dimples on the tribological
behavior using a deterministic elastohydrodynamic model under typical gearing
application operating conditions.
1.2 Literature Review
In literature, a large group of works have been carried out, focusing on the effects of
the surface texturing on the friction and wear behavior under the relatively low speed and/or
low load condition for seal and thrust bearing type of applications [4, 22]. Kovalchenko et
al. [23] measured the friction of a unidirectional sliding contact under the speed range of
0.015 to 0.75 m/s and the load range of 0.16 to 1.6 MPa, utilizing a flat-pin-on-disk set-up.
The friction coefficient was successfully reduced by implementing the laser textured
dimples onto the disk surface. The most significant reduction was observed when the

3
sliding speed was at the low end of the adopted speed range. At the high end of the speed
range, however, the advantage of the dimple texture diminished. Andersson et al. [24]
measured the friction coefficient and the wear scar of the contact between a stationary ball
and an oscillating disk, with the sliding speed being limited between 0.04 m/s and 0.16
m/s. Under the starved lubrication condition, the laser-textured disk was shown to be able
to improve the friction and wear performance significantly in comparison to the non-
textured surface. It was also found the improvement was lubricant viscosity dependent.
For the low viscosity lubricant, the micro surface texture lost its effectiveness at the high
end of the sliding speed range considered. Galda et al. [25] investigated the impacts of the
surface texturing on the Stribeck curve considering the contact between a stationary
bearing sleeve and a rotating ring under the constant load of 18 MPa and the sliding speed
range of 0.08 to 0.69 m/s. The different dimple shapes were implemented onto the ground
surfaces, which have the RMS roughness amplitude 0.32 mqR . It was shown the
dimples were able to decrease the friction coefficient largely under the poorly lubricated
condition. The important roles of the shape and the distribution of the dimples in friction
reduction were also demonstrated. Qiu and Khonsari [26] examined the friction coefficient
performance of the contact formed by a stationary textured ring and a rotating non-textured
counterpart. It was observed the presence of the dimple texture can effectively reduce the
friction coefficient under the low loading condition. However, such improvement
decreased with the increase of the normal load. Segu et al. [27] applied hybrid dimple
arrays that consists of circular and elliptical micro-dimples to a flat-on-flat contact,
achieving the reduction in friction within the speed range of 0.09 to 0.55 m/s.

4
Wang et al. [28] studied the influence of the dimple size on the friction response of
a line contact within the sliding velocity range of 0.02 to 0.21 m/s under the low loading
condition. The results suggested the dimple size was a critical factor and there existed the
optimum dimple size, which corresponded to the high hydrodynamic load-carrying
capacity and the low friction coefficient. Using a reciprocating tribo-meter, Tang et al.
[29] investigated the influence of the dimple density on the friction and wear reduction
under the contact pressure of 8.3 MPa and the sliding velocity of 0.24 m/s. In general, the
friction of the contact was first observed to decrease with the decrease of the dimple
density. However, this trend reversed when the excessive reduction in the dimple density
is encountered. This finding is line with the other studies [23-25].
In addition to the above experimental studies, the numerical and computational
method has also been used for the quantification of the micro-surface-texture effect on the
tribological behavior. Through numerical simulations, Wang et al. [28] showed the
hydrodynamic pressure generation of the surface dimples was tightly related to the dimple
size. Tang et al. [29] demonstrated the strong influence of the adjacent dimple interactions
on the hydrodynamic pressure. Yu et al. [30] found the geometric shapes and orientations
of dimples have an evident impact on the load-carrying capacity, while considering a single
dimple instead of a dimple array on the surface. Brunetiere and Tournerie [31] simulated
the hydrodynamic lift mechanism of a mechanical seal with textured surfaces, pointing to
the importance of the dimple geometry and density in the friction reduction.
Another group of works extended the investigation of the effectiveness of the
surface texturing in the enhancement of the tribological performance from the low load to
the medium load range, while maintaining the low surface speed condition. Segu and Kim

5
[32] expanded an earlier study [27] from the conformal contact to the non-conformal point
contact, with the maximum Hertzian pressure increased to the range of 0.39 to 0.96 GPa.
It was shown the decrease in friction was still evident with the presence of the hybrid
dimple arrays under the speed range of 0.09 to 0.55 m/s. Employing a twin-disk contact
set-up, Nakatsuji and Mori [13] examined the rolling contact performance of micro-dented
surfaces in both the fatigue and scuffing aspects under the two maximum Hertzian pressure
levels of 0.28 and 0.66GPa and the rolling velocity of 0.6 m/s. The positive impacts of the
micro-dents were demonstrated. Wakuda et al. [33] studied the influences of the dimple
size, density, and shape on the friction behavior of a contact formed by the textured ceramic
disk and the non-textured steel pin under the contact pressure of 0.78GPa and the sliding
speed ranging from 0.012 to 1.2 m/s. The results showed the effects of the dimple size and
density on the friction reduction were similar to those under the low loading condition [23-
25, 29]. The shape of the dimple, however, was found to have negligible impact on the
friction, contradicting the findings of Galda et al. [25] and Yu et al. [30] where the loads
were much lower. Instead of relying on the experimental measurements, Meng et al. [34]
numerically simulated the friction behavior of parallel surfaces, and found that the
effectiveness of micro-dimples on the friction reduction was dependent on both the
operating condition and the surface roughness condition. Evident decreases in the friction
coefficient were observed when the ratio of the minimum film thickness to the roughness
amplitude was small, i.e. a poor lubrication condition.
Although these studies showed the potential of the micro surface dimples under the
medium loading range, some other works observed the contrary. For example,
Kovalchenko et al. [5] extended their work from the conformal contact [23] to the non-

6
conformal contact under the increased normal load of 0.7GPa with the same speed range
of 0.015 to 0.75 m/s. It was observed the textured surfaces (5 m depth dimple arrays)
introduced higher wear rates and higher friction coefficients in comparing to the non-
textured surfaces. As the tests continued, the accelerated wear changed the contact
geometry and alleviated the contact pressure, resulting in the friction coefficient reduction.
A third group of studies further increased the contact load to the high pressure range.
Considering the contact between needle rollers and rings under the maximum Hertzian
pressure of 2.5GPa, Akamatsu et al. [7] elongated the rolling contact fatigue life through
surface texturing under the starved lubrication condition. Borrowing the contact set-up of
Akamatsu et al. [7], Zhai et al. [8] showed the surface dents had adverse impacts on the
fatigue life when the contact was well-lubricated. Krupka et al. [9] showed the shallow
dents with the depth of 0.2 to 0.3 m failed to elongate the rolling contact fatigue life when
the load was above 3.5GPa and the rolling velocity was above 4 m/s, although the same
dents were found to be able to improve the lubrication under the load of 0.505GPa and the
very low speed levels of 0.0013 and 0.0054 m/s. When the dent depth was further increased
to 20 m, the fatigue life was significantly reduced. A similar study that yielded the same
observation was performed by Vrbka et al. [10]. These works [8-10] concluded the
enhancement of the fatigue life through surface denting could only be achieved when the
contact experienced the very poor lubrication condition, where the lubricant reservoir
mechanism of the micro-dents take effect.

7
1.3 Thesis Objectives
In view of the literature above, most of the studies have been focusing on the
applications of the micro-surface-texturing under the low to medium speed range and/or
low to medium load range, which hardly represent the common operating condition of gear
Contacts. Therefore, the specific technical objectives of this study are summarized as
below:
Investigate the effects of micro-dimples on the friction and surface
temperature performances of a lubricated point contact, which operates under
the speed ranging from 0.5 to 10 m/s and the load ranging from 0.5 to 2.5GPa,
using the thermal mixed EHL point contact model proposed by Li et al. [15],
Employing a ball-on-disk contact, the micro-dimple arrays with different
dimple center distances and dimple depths will be implemented on the ball
surface to quantify the impacts of these two parameters on the friction
coefficient and the maximum ball surface temperature.
The contacts of three surface texture combinations, namely micro-dimpled
and polished ball surface versus polished disk surface, polished ball surface
versus polished disk surface and ground ball surface versus ground disk
surface, will be compared to demonstrate any beneficial or detrimental effect
of micro-dimples in heavily loaded high speed applications.
Examine the deterministic tribological behavior within the contact to explore
the underlying mechanism that governs the role of micro-dimples in the EHL,
given the fundamental physics of the micro-dimple behavior has been

8
missing in most of the phenomenological experimental works [5, 7-10, 23-
27, 32, 33].
1.4 Thesis Outline
The outline of this thesis is listed below:
Chapter 2: The governing formulations of the thermal mixed
elastohydrodynamic lubrication for a ball-on-disk contact will be
introduced. The numerical procedure of will be discussed.
Chapter 3: Considering a ball-on-disk contact problem, the matrix for a
parametric simulation study will be constructed. The simulation results will
be documented and discussed.
Chapter 4: The research activity will be summarized. Conclusions and
recommendations for future work will be provided.

9
2 CHAPTER 2
A THERMAL MIXED EHL MODEL FOR POINT CONTACTS
2.1 Governing Formulations
For a non-conformal point contact of rough surfaces, the thin film hydrodynamic
fluid flow within the EHL channel follows the transient two-dimensional (2D) Reynolds
equation of [14-16]
( ) ( )x y r
p p h hf f u
x x y y x t
(1)
where, the coordinate system is set such that the x axis points in the rolling and sliding
direction, and the y axis is parallel to the rotation axis of the contact elements. As the
contact surfaces of body 1 and body 2 move at the surface tangential velocities of 1u and
2u , the lubricant is entrained into the contact zone at the rate of ru , which is usually
referred as the rolling or entraining velocity, and is defined as 11 22
( )ru u u . In the
process, a pressurized hydrodynamic lubrication film with the thickness h and pressure p
is established. Considering the contact between rough surfaces, the steady state condition
cannot be reached owing to the transient roughness profiles that bounds the EHL flow.

10
The time dependent squeeze term [last term on the right hand side of Eq. (1)] is thus
included, where represents the lubricant density and t represents time. Under the
circumstance of high sliding, the non-Newtonian shear thinning of the lubrication film is
expected. Such effect is included through the flow coefficients of xf and yf in Eq. (1).
Assuming an Eyring fluid, whose characteristic reference stress is 0 , these coefficients
take the forms of [14, 15]
3
0
cosh ,12
mx
hf
30
0
sinh12
my
m
hf
(2a, b)
where, is the lubricant viscosity, and m is the mean viscous shear stress that has the
expression of 10 0sinh [ ( )]m su h , in which, su represents the sliding velocity and
1 2su u u .
Because of the significant surface roughness irregularities of the mechanical
elements such as gears, the full film lubrication condition where the contact surfaces are
completely separated by the protective fluid film, is hardly achievable. When, for instance,
the circumstance of insufficient rolling velocity and/or high lubricant temperature that
reduces the lubricant viscosity and consequently the film thickness is encountered, frequent
local asperity contacts take place within the contact zone. At these local asperity
interaction spots, the film thickness is considered to be constant (infinitesimally small, i.e.
0h ), and the film thickness gradient along the x direction becomes zero as
0
h
x
(3)
Such a treatment allows a unified numerical system to be arrived [16], offering superior
numerical stability.

11
Within the EHL contact zone, the local film thickness at position ( , )x y and time t is
determined by the local curvature gap, 0( , )g x y the local instantaneous roughness heights
of surface 1, 1( , , )S x y t and surface 2, 2( , , )S x y t , and the surface deflection of ( , , )V x y t as
[14-16]
0 0 1 2( , , ) ( ) ( , ) ( , , ) ( , , ) ( , , )h x y t h t g x y V x y t S x y t S x y t
(4)
where, 0h is the reference film thickness, whose value is determined by enforcing the
equilibrium condition between the normal load,W and the resultant contact pressure
distribution over the entire EHL contact zone of
( , , )W p x y t dxdy
(5)
through an iterative adjustment of 0h . Under the elastic contact condition, the surface
deflection is the convolution between the contact pressure and the influence function
2 22 ( )K E x y as ( , ) ( , , )V K x x y y p x y t dx dy
[35]. Here, E represents
the reduced elastic modulus, and represents the computational domain.
For the determination of the temperature distribution, fT within the EHL fluid, who
has the thermal conductivity of fk and the specific heat of fc , the energy equation of
2
2
f f ff f
T T Tk c u
x tz
(6)
is applied [14, 15]. In Eq. (6), and represent the shear stress and the shear strain rate
of the fluid, u is the fluid velocity that varies along the z axis, which points from surface
1 to surface 2 across the film thickness, in a linear manner as

12
1 2
h z zu u u
h h
(7)
In order to reduce the degree-of-freedom of Eq. (6), the variation of fT along the z axis
is assumed to follow the parabolic form [36]
2
1 2 1 2 1(3 3 6 ) (4 2 6 )f m mz z
T T T T T T T Th h
(8)
where mT is the mean temperature of the fluid across the film thickness, and iT ( 1, 2i ) is
the surface temperature of the bounding solid i , which is the sum of the surface bulk
temperature, biT and the flash temperature rise, iT i.e.
bi i iT T T (9)
Considering solid i that is exposed to the heat flux iQ , the surface flash temperature rises
according to [37]
2 2
3 2
[( ) ( )] ( ) ( , , )( , , ) exp
4 ( ) 4 [ ( )]
i ii
st s s
x x u t t y y Q x y t dx dyT x y t dt
t t c t t
(10)
where, s is the thermal diffusivity, sc the specific heat, and s is density of the solid.
The heat fluxes of the mating surfaces are determined through a heat partition coefficient
as
1Q Q , 2 (1 )Q Q (11a, b)
where, satisfies the boundary condition of [14, 15]
1 2 (1 2 )
2 f
hT T Q
k (12)

13
and the total frictional heat flux,Q is the product of the sliding velocity and the shear stress,
q as
( , , ) ( , , )sQ x y t u q x y t (13)
Within the hydrodynamic areas of the EHL contact zone, q is attributed to the lubricant
viscous shear as sq u h , where is the effective viscosity and 0cosh( )m
for an Eyring fluid. For the local areas where the film thickness breaks down to allow the
asperity interaction, bq p where b is the boundary lubrication friction coefficient, and
is assumed to take the value of 0.1 [1-3, 14-16] in this study. Given the surface shear
distribution over the entire contact, the friction coefficient is found as qdxdy W
with W representing the applied normal load.
Regarding the determination of biT of the contacting surfaces that are required in Eq.
(9), the bulk temperature of the disk surface (surface 2) is maintained at the lubricant supply
temperature. The ball surface (surface 1) is heated by the frictional heat produced by the
contact and cooled through the convection between the ball and ambient air-lubricant
mixture. The simple 2D heat transfer formulation proposed by Li et al. [15] is used to
determine its bulk temperature. For the descriptions of the pressure and temperature
dependences of the lubricant viscosity and density, the relationships employed in Refs. [3,
14, 15, 38] are implemented in this study.

14
2.2 Numerical Solution Procedures
The numerical method for the point contact thermal mixed EHL problem is
illustrated in Fig. 2.1. Starting with the guesses of the initial contact pressure (Hertzian)
and the initial oil temperature (inlet temperature), the surface elastic deformation and film
thickness can be determined. According to the film thickness distribution, the asperity
contact spots are located and the fluid viscosity and density are computed for the areas
where 0h . The unified equation system of Eqs. (1-3) is then solved for p over the entire
contact zone. The pressure solution is checked for both the load balance convergence and
pressure convergence. The converged p and h are used to find the temperature
distributions of the bounding surfaces as well as the fluid. A thermal iteration loop is
utilized to ensure the temperature distribution convergences. The converged solutions are
then used for the initial guesses of the next time step. For the numerical simulation of the
point contact, the EHL computational domain is set to have the square shape that has the
dimension of 3L a in both the x and y directions, where a is the radius of the circular
Hertzian zone. The origin of the computational domain is selected such that
0.625 0.375L x L and 0.5 0.5L y L . The mesh size is set to be 2x m and
2y m. The time increment of rt x u is used with 500tN time steps.

15
Figure 2-1 Flowchart of the thermal mixed EHL computation.
No Yes
Check load balance
Initial fluid temperature Inlet oil temperature
Initial pressure Hertzian pressure
,
Compute surface elastic deformation
Check pressure convergence
Determine and record the asperity contact nodes
Determine and within fluid region
Solve for
Complete time step
Determine and
Check temperature convergence
No Yes
No Yes

16
3 CHAPTER 3
SIMULATIONS AND DISCUSSION
3.1 Contact Set-up
The point contact formed between a circular ball (body 1), whose diameter is 25.4
mm, and a flat disk (body 2) as shown in Fig. 3.1 is considered in this study. The normal
force,W applies in the vertical direction and pushes the ball down against the disk. The
rotational axis of the ball is set to be along the radial direction of the disk, whose rotational
axis while is in the vertical direction, such that the surface velocities of the two contact
elements, 1u and 2u , are parallel to each other. Three types of the ball-disk surface texture
combinations as listed in Table 3.1 are examined. For the type I combination, the micro-
dimple texturing, which is followed by the isotropic polishing process, is applied onto the
ball surface. The dimple array is defined by the radius of the circular dimples, R the depth
of the dimples, H , and the center distance between the adjacent dimples, D (The center
distances in the x and y directions are set to be equal).

17
Figure 3-1 The contact set-up between a circular ball and a flat disk
Disk (Body 2)
Ball (Body 1)
W

18
Table 3-1 List of the surface texture conditions of the contact pair.
Surface
Texture
Combination
Ball Surface Texture
Disk Surface
Texture
I
Micro-dimple textured +
Polished
Polished
II Polished Polished
III Ground Ground

19
Table 3-2 Definition of simulation case numbers for different combinations of dimple depth, H and
dimple center distance, D
H [m]
D [m]
90 60 45
1.5 a aH D a bH D
a cH D
3 b aH D b bH D
b cH D
15 c aH D c bH D
c cH D

20
Figure 3-2 The surface topographies of (a) ball specimen and (b) disk specimen for the type I surface
texture combination defined in Table 3.1
(a)
(b)
[m]
0.4
0.2
0
-0.2
-0.4
[m]
0
-1
-2

21
To investigate the impacts of H and D on the tribological behavior of the point
contact, three depth values 1.5H , 3 and 15 m, and three center distance values 45D
, 60 and 90 m as listed in Table 3.2 are considered, keeping the dimple radius fixed at
15R m. No micro-dimples are produced on the disk surface that is isotropically
polished only. Figure 3.2 shows the surface topography of the ball and disk specimens of
the type I surface texture combination, where the example dimple array has 1.5H m
and 45D m. The ball surface between the dimples and the disk surface have the root-
mean-square (RMS) roughness amplitude 0.1qR m. Neither the type II nor the type
III surface texture combination possesses the micro-dimple feature. The type II
combination has both the ball and the disk surfaces isotropically polished only, resulting
in the surface topography that is similar to Fig. 3.2 (b). The type III contact pair consists
of a ground ball surface and a ground disk surface, providing a rougher surface condition
with the RMS roughness amplitude 0.6qR m as shown in Fig. 3.3. It is observed the
roughness lay of the ground surface is oriented in the y direction, i.e. is normal to the
rolling and sliding direction of the contact elements. This set-up imitates the contact
condition of gears.
3.2 Operating Conditions
Three rolling velocities of ru 0.5, 5, and 10 m/s are employed. The slide-to-roll
ratio that is defined as s rSR u u is fixed at 0.5SR for all the simulations, where the
negative sign indicates the ball surface moves slower than the disk surface does. In the
vicinity of this sliding condition, the failures such as pitting and scuffing are commonly

22
Figure 3-3 The surface topography of the ground surface.
2
0
-2
-4
[m]

23
Figure 3-4 The variations of W and hp with time for one complete ball-on-disk contact simulation.
0
0.5
1
1.5
2
2.5
0
200
400
600
800
1000
1200
0 180 360 540 720 900 1080 1260
Lo
ad
(N
)
Time (S)0 3 6 9 12 15 18 21
Time duration [minute]
2.5
2
1.5
1
0.5
0
1200
1000
800
600
400
200
0
[N]
[GPa]
24
observed for gearing applications. For one complete simulation, the normal load in terms
of the maximum Hertzian pressure, hp , is increased stepwise from 0.5 to 2.5 GPa with the
increment of 0.1 GPa as shown in Fig. 3.4. The corresponding normal force,W , that varies
in the range from 7.95 to 990.9 N is also plotted in the figure. Each of these loading stages
has the operating time duration of one minute. For the lubrication of this ball-on-disk
contact, a typical turbine fluid, MIL-L23699, is used as the lubricant, whose inlet
temperature is set at100 C . The detailed viscosity and density parameters of this lubricant
is referred to Ref. [39]. During the contact, the bulk temperature of the disk is controlled
and maintained at the lubricant inlet temperature, .i.e. 2 100 CbT , while the ball bulk
temperature varies according to the frictional heat produced within the contact [Eq. (13)],
the heat convection between the ball surface and the surrounding air, and the operating
time period. The 2D heat transfer model that was proposed by Li et al. [15] is adopted here
to determine 1bT .
3.3 Simulation Results
Operating at the rolling velocity 10ru m/s and at the highest loading stage where
2.5hp GPa, the tribological behavior of the ball-disk contact pair, which has the type I
surface texture combination (defined in Table 3.1) and Case a aH D micro-dimple array
( 1.5H m and 90D m in Table 3.2), is depicted in Fig. 3.5 for one example time
instant. In Fig. 3.5 (a), the local asperity contacts are represented by the black areas. Within
the left half of the Hertzian zone ( 0x ), the asperity contact activities are seen to be more

25
frequent in comparing to the right half of the Hertzian zone ( 0x ), especially along the
circumferences of the dimples. At these asperity interaction spots, the contact pressures
are elevated to very high magnitudes as shown in Fig. 3.5 (b). Within the right half of the
Hertzian zone, the hydrodynamic fluid film dominates and the hydrodynamic pressure is
observed to be severe at the right edges of the dimples in Fig. 3.5 (b), owing to the micro-
EHD behavior, i.e. the dimples serve as micro-bearings when the disk surface slides against
the roller surface to the right. In addition, pressure tails are produced to the right of these
dimples. This phenomenon is in good agreement with the optical interferometry
measurements of Wedeven and Cusano [40] and Cusano and Wedeven [41]. The high
pressure peaks within the contact not only dictate the surface fatigue crack nucleation, but
also introduce high frictional heat to promote the flash temperature rise. In Fig. 3.5 (c), the
lubrication fluid temperature reaches as high as 350 C in the areas where the
hydrodynamic pressure takes the local maximum. The ball surface in Fig. 3.5 (d) has its
temperature approaching 250 C , where either the asperity contact pressure or the
hydrodynamic pressure peaks locally. These extreme temperatures are responsible for the
surface welding and consequently the onset of the scuffing failure [15].
Owing to the time-varying surface topographies of the ball and the disk when they
rotate, the tribological behavior in Fig.3.5 is time dependent. To include such variation in
the quantification of the friction and temperature performances, the means of the friction
coefficient and the maximum ball surface temperature over tN time instants ( 300tN in
this study) are defined as
26
Figure 3-5 The distributions of (a) asperity contacts, (b) contact pressure, (c) lubricant temperature and
(d) ball surface temperature within the Hertzian zone. The surface texture combination is Type I of
Table 3.1. The micro-dimple array is Case a aH D of Table 3.2. 10ru m/s and 2.5hp GPa.
[GPa]
5.4
4.05
2.7
1.35
0
-0.5 -0.25 0 0.25 0.5 -0.5 -0.25 0 0.25 0.5
0.5
0.25
0
-0.25
-0.5
0.5
0.25
0
-0.25
-0.5
[mm]
350
287.5
225
162.5
100
250
221.25
192.5
163.75
135
[mm]
(a)
(b)
(c)
(d)

27
1
1 tN
jt jN
(14)
and
max
1 11
1max ( , )
tN
jt j
T T x yN
(15)
respectively. Figure 3.6(a) compares in Casesa aH D ,
a bH D anda cH D , examining
the impact of the dimple center distance, D , on the friction of the type I surface texture
combination under the rolling velocity 10ru m/s. It is observed increases as D
decreases ( 90D , 60 and 45 m for Casesa aH D ,
a bH D anda cH D , respectively)
within the entire loading range 0.5 2.5hp GPa. This trend is mainly due to two
reasons. Firstly, the smaller center distance between the dimples allows to accommodate
more dimples within the contact zone, leading to increased asperity contact activity
occurring along the circumferences of the dimples, as shown in the left column of Fig. 3.7
under the loading condition of 2.5hp GPa for instance. At this loading stage, the
asperity contact area ratio that is defined as the ratio of the total asperity contact area to the
Hertzian zone area is found to be doubled when the dimple center distance is reduced from
90 to 60 m, and tripled when D decreases from 90 to 45 m. Secondly, the increased
number of the dimples means the increased number of the micro-bearings within the
contact, which introduce significant hydrodynamic pressure tails starting from the right
edges of the dimples. Both the high asperity contact pressures and the high micro-EHD
hydrodynamic pressures as illustrated in the right column of Fig. 3.7 contribute to the
increase in the friction coefficient when the dimple center distance is reduced.

28
Figure 3-6 The comparisons of (a) and (b) max1T between the micro-dimple array Cases a aH D ,
a bH D and a cH D (defined in Table 3.2) for the type I surface texture combination (defined in Table
3.1) under 10ru m/s.
0.5 1 1.5 2 2.5
0.06
0.05
0.04
0.03
0.02
0.01
0
350
300
250
200
150
100
[GPa]
(a)
(b)
[ ]

29
Figure 3-7 The comparison of the asperity contact activity (left column) and the contact pressure (right
column) between the micro-dimple array cases (a) a aH D , (b) a bH D and (c) a cH D within the
Hertzian Zone. The surface texture combination is Type I of Table 3.1. 10ru m/s, and 2.5hp GPa.
0.5
0.25
0
-0.25
-0.5
0.5
0.25
0
-0.25
-0.5
0.5
0.25
0
-0.25
-0.5 -0.5 -0.25 0 0.25 0.5 -0.5 -0.25 0 0.25 0.5
[mm]
[mm]
(a)
(b)
(c)
[GPa]
5.4
4.05
2.7
1.35
0
5.4
4.05
2.7
1.35
0
5.4
4.05
2.7
1.35
0

30
Figure 3-8 The comparisons of (a) and (b) max1T between the micro-dimple array Cases b aH D ,
b bH D and b cH D (defined in Table 3.2) for the type I surface texture combination (defined in Table
3.1) under 10ru m/s.
0.5 1 1.5 2 2.5
0.06
0.05
0.04
0.03
0.02
0.01
0
350
300
250
200
150
100
[GPa]
(a)
(b)
[ ]

31
Figure 3-9 The comparisons of (a) and (b) max1T between the micro-dimple array Cases c aH D ,
c bH D ,and c cH D (defined in Table 3.2) for the type I surface texture combination (defined in Table
3.1) under 10ru m/s.
0.5 1 1.5 2 2.5
0.06
0.05
0.04
0.03
0.02
0.01
0
600
500
400
300
200
100
[GPa]
(a)
(b)
[ ]

32
Figure 3-10 The comparisons of (a) and (b) max1T between the micro-dimple array Cases a aH D ,
a bH D and a cH D (defined in Table 3.2) for the type I surface texture combination (defined in Table
3.1) under 5ru m/s.
0.5 1 1.5 2 2.5
0.06
0.05
0.04
0.03
0.02
0.01
0
200
180
160
140
120
100
[GPa]
(a)
(b)
[ ]

33
Figure 3-11 The comparisons of (a) and (b) max1T between the micro-dimple array Cases b aH D ,
b bH D and b cH D (defined in Table 3.2) for the type I surface texture combination (defined in Table
3.1) under 5ru m/s.
0.5 1 1.5 2 2.5
0.06
0.05
0.04
0.03
0.02
0.01
0
350
300
250
200
150
100
[GPa]
(a)
(b)
[ ]

34
Figure 3-12 The comparisons of (a) and (b) max1T between the micro-dimple array Cases c aH D ,
c bH D and c cH D (defined in Table 3.2) for the type I surface texture combination (defined in Table
3.1) under 5ru m/s.
0.5 1 1.5 2 2.5
0.06
0.05
0.04
0.03
0.02
0.01
0
350
300
250
200
150
100
[GPa]
(a)
(b)
[ ]

35
Figure 3-13 The comparisons of (a) and (b) max1T between the micro-dimple array Cases a aH D ,
a bH D and a cH D (defined in Table 3.2) for the type I surface texture combination (defined in Table
3.1) under 0.5ru m/s.
0.5 1 1.5 2 2.5
0.06
0.05
0.04
0.03
0.02
0.01
0
600
500
400
300
200
100
[GPa]
(a)
(b)
[ ]

36
Figure 3-14 The comparisons of (a) and (b) max1T between the micro-dimple array Cases b aH D ,
b bH D and b cH D (defined in Table 3.2) for the type I surface texture combination (defined in Table
3.1) under 0.5ru m/s.
0.5 1 1.5 2 2.5
0.06
0.05
0.04
0.03
0.02
0.01
0
200
180
160
140
120
100
[GPa]
(a)
(b)
[ ]

37
Figure 3-15 The comparisons of (a) and (b) max1T between the micro-dimple array Cases c aH D ,
c bH D and c cH D (defined in Table 3.2) for the type I surface texture combination (defined in Table
3.1) under 0.5ru m/s.
0.5 1 1.5 2 2.5
0.06
0.05
0.04
0.03
0.02
0.01
0
200
180
160
140
120
100
[GPa]
(a)
(b)
[ ]

38
Comparing max1T in Cases a aH D , a bH D and a cH D in Fig. 3.6(b), it is concluded
that the smaller the dimple center distance, the higher max1T , owing to the increase of the
friction when D decreases. The comparisons for the other eight cases defined in Table 3.2
are performed in Figs. 3.8 – 3.15, showing similar observations.
In Fig. 3.16, the contour distributions of (left column) and max1T (right column) are
constructed versus the dimple center distance and the dimple depth under the lowest
loading condition 0.5hp GPa for the type I surface texture combination. It is observed
that increases with the increase of H and the decrease of D , resulting in the highest
friction occurring in Casec cH D , and the lowest friction taking place in Case
a aH D .
Correspondingly, max1T has its maximum in Case
c cH D and its minimum in Casea aH D
. This observation applies for all the three rolling velocities covering the range
0.5 10ru m/s. It is noted that although increases as the rolling velocity decreases,
max1T decreases. This is because the frictional heat flux within the contact zone is reduced
when the sliding velocity s ru u SR decreases with ru (The slide-to-roll ratio is fixed in
this study.), despite the slight increase in the friction coefficient. The same can be
concluded for the medium load 1.5hp GPa and the highest load 2.5hp GPa in Figs.
3.17 and 3.18, respectively.

39
Figure 3-16 The variations of (left column) and max1T (right column) with the dimple center distance
D and the dimple depth H at the rolling velocities (a) 10ru m/s, (b) 5ru m/s and (c) 0.5ru
m/s and the lowest loading stage 0.5hp GPa for the type I surface texture combination (defined in
Table 3.1).
15
10
5
15
10
5
15
10
5
45 60 75 90 45 60 75 90
[m]
[m]
(a)
(b)
(c)

40
Figure 3-17 The variations of (left column) and max1T (right column) with the dimple center distance
D and the dimple depth H at the rolling velocities (a) 10ru m/s, (b) 5ru m/s and (c) 0.5ru
m/s and the median loading stage 1.5hp GPa for the type I surface texture combination (defined in
Table 3.1).
15
10
5
15
10
5
15
10
5
45 60 75 90 45 60 75 90
[m]
[m]
(a)
(b)
(c)

41
Figure 3-18 The variations of (left column) and max1T (right column) with the dimple center distance
D and the dimple depth H at the rolling velocities (a) 10ru m/s, (b) 5ru m/s and (c) 0.5ru
m/s and the highest loading stage 2.5hp GPa for the type I surface texture combination (defined in
Table 3.1).
15
10
5
15
10
5
15
10
5
45 60 75 90 45 60 75 90
[m]
[m]
(a)
(b)
(c)

42
In view of the above comparisons, the dimple array defined by Case a aH D has the
best performance in terms of the friction and the ball surface temperature. Using the type
I surface texture combination with the a aH D dimple array as the baseline, it is compared
to the type II and type III surface texture combinations in Fig. 3.19 in terms of . Within
the entire pressure range and the rolling velocity range, the ground surfaces of Type III
combination are seen to lead to the highest friction owing to the significant surface
roughness condition as shown in Fig. 3.3. The polished surfaces of Type II combination
results in the lowest friction and the baseline offers the performance that is in between.
Figure 3.20 shows the asperity contact activity and the contact pressure under these three
surface texture conditions at the 10 m/s rolling velocity and the 2.5 GPa maximum Hertzian
pressure. Comparing Fig. 20 (a) and (b), the addition of the dimples on the ball surface
introduces more asperity contacts along the dimple circumferences and significant
hydrodynamic pressure tails, therefore, resulting in the friction increase. Figure 3.20 (c)
demonstrates the severe asperity contact activity for the ground surfaces, which leads to
the large areas of the substantial asperity contact pressures and consequently the large
friction. The same type of comparison as that in Fig. 3.19 is performed for max1T in
Fig. 3.21 Corresponding to the friction performance, the type III and type II surfaces,
respectively, have the highest and lowest max1T and the baseline is again in between.

43
Figure 3-19 The comparisons of between Type I (with a aH D dimple array), II and III surface
texture combinations under (a) 10ru m/s, (b) 5ru m/s and (c) 0.5ru m/s.
0.5 1 1.5 2 2.5
0.08
0.06
0.04
0.02
0
0.08
0.06
0.04
0.02
0
0.08
0.06
0.04
0.02
0
[GPa]
(a)
Type I &
Type II
Type III
(b)
(c)

44
Figure 3-20 The comparisons of the asperity contact activity (left column) and the contact pressure
(right column) between the surface texture combinations of (a) Type I with a aH D dimple array, (b)
Type II and (c) Type III within the Hertzian zone. 10ru m/s, and 2.5hp GPa.
0.5
0.25
0
-0.25
-0.5
0.5
0.25
0
-0.25
-0.5
0.5
0.25
0
-0.25
-0.5 -0.5 -0.25 0 0.25 0.5 -0.5 -0.25 0 0.25 0.5
[mm]
[mm]
(a)
(b)
(c)
[GPa]
5.4
4.05
2.7
1.35
0
5.4
4.05
2.7
1.35
0
5.4
4.05
2.7
1.35
0

45
Figure 3-21 The comparisons of max1T between Type I (with a aH D dimple array), II and III surface
texture combinations under (a) 10ru m/s, (b) 5ru m/s and (c) 0.5ru m/s.
0.5 1 1.5 2 2.5
500
400
300
200
100
500
400
300
200
100
500
400
300
200
100
[GPa]
(a)
[ ]
Type I &
Type II
Type III
(b)
(c)

46
4 CHAPTER 4
CONCLUSION
4.1 Conclusions
Considering a ball-on-disk contact problem, this study investigated the influences of
the micro-dimple texture on the friction and surface temperature performances of
engineered rough surfaces, operating under wide speed and load ranges that cover typical
gearing applications. Circular shaped micro-dimple arrays with different dimple center
distances and dimple depths were implemented on the ball surface to quantify the impacts
of these two parameters on the friction coefficient and the maximum ball surface
temperature. It was shown both the friction and the surface temperature decrease with the
increase of the dimple center distance and the decrease of the dimple depth within the entire
speed and load ranges adopted. In addition, the contacts of three surface texture
Combinations, namely micro-dimpled and polished ball surface versus polished disk
surface, polished ball surface versus polished disk surface and ground ball surface versus
ground disk surface, were compared to show detrimental impact of micro-dimples.

47
By examining the deterministic tribological behavior within the contact, including the
asperity contact activity and the contact pressure distribution, the underlying mechanisms
are summarized as (i) the introduction of the micro-dimples increases the asperity contact
activity along the dimple circumferences; (ii) the micro-dimples act as micro-bearings and
results in significant hydrodynamic pressure tails starting from the right edges of the
dimples. Both the high asperity contact pressures and the high micro-EHD hydrodynamic
pressures contribute to the increase in the friction coefficient and consequently the surface
temperature.
4.2 Recommendation for Future Work
Besides the dimple center distance and the dimple depth, the other influential
parameters of a dimple array include the shape of the dimple (circular, rectangular,
triangular, etc.) and the size of the dimple. Additionally a dimple array can consists of
dimples with different shapes instead of one. All such parameters are not considered in
this study. The comparison of the friction and temperature performances between surfaces
with and without micro-dimples were only performed for polished surfaces. The operating
speed range also only represents a medium to high gearing application range. Therefore,
the following works are recommended for the future study:
Examine the effects of the circular dimple radius;
Investigate the effects of micro-dimples with other shapes;
Construct hybrid dimple arrays with multiple dimple shapes coexisting, and compare with
the conventional dimple arrays with a single dimple shape;
Extend the speed parameter to a lower range, where heavy machinery operates;

48
Investigate the dimple effects on contact fatigue.

49
5 REFERENCES
[1] Li, S., and Kahraman, A., 2010, “Prediction of spur gear mechanical power losses
using a transient elastohydrodynamic lubrication model,” Tribology Transaction, 53(4),
pp. 554-563.
[2] Kolivand M., Li S., Kahraman A., 2010, “Prediction of mechanical gear mesh
efficiency of hypoid gear pairs,” Mechanisms and Machine Theory, 45(11), pp. 1555-1567.
[3] Li S., 2015, “A thermal tribo-dynamic mechanical power loss model for spur gear
contacts,” Tribology International, 88, pp. 170-178.
[4] Etsion, I., 2005, “State of the art in laser surface texturing,” ASME Journal of
Tribology, 127(1), pp. 248–253.
[5] Kovalchenko, A., Ajayi, O., Erdemir, A. and Fenske, G., 2011, “Friction and wear
behavior of laser textured surface under lubricated initial point contact,” Wear, 271, pp.
1719–1725.
[6] Janakiraman V., Li S., Kahraman A., 2014, “An investigation of the impacts of
contact parameters on wear coefficient,” ASME Journal of Tribology, 136, 031602 (7
pages).
[7] Akamatsu, Y., Tsushima, N., Goto, T. and Hibi, K., 1992, “Influence of surface
roughness skewness on rolling contact fatigue life,” Tribology Transactions, 35(4), pp.
745–750.

50
[8] Zhai, X., Chang, L., Hoeprich, M.R. and Nixon, H.P., 1997, “On mechanisms of
fatigue life enhancement by surface dents in heavily loaded rolling line contacts,”
Tribology Transactions, 40(4), pp. 708–714.
[9] Krupka, I., Vrbka, M. and Hartl, M., 2008, “Effect of surface texturing on mixed
lubricated non-conformal contacts,” Tribology International, 41, pp. 1063–1073.
[10] Vrbka, M., Samanek, O., Sperka, P., Navrat, T., Krupka, I. and Hartl, M., 2010,
“Effect of surface texturing on rolling contact fatigue within mixed lubricated non-
conformal rolling/sliding contacts,” Tribology International, 43, pp. 1457–1465.
[11] Li S., and Kahraman A., 2011, “A fatigue model for contacts under mixed
elastohydrodynamic lubrication condition,” International Journal of Fatigue, 33(3), pp.
427-436.
[12] Li S., 2015, “A computational study on the influence of surface roughness lay
directionality on micropitting of lubricated point contacts,” ASME Journal of Tribology,
137(2), 021401 (10 pages).
[13] Nakatsuji, T. and Mori, A., 2001, “The tribological effect of mechanically produced
micro-dents by a micro diamond pyramid on medium carbon steel surfaces in rolling-
sliding contact,” Meccanica, 36, pp. 663–674.
[14] Li, S., 2013, “Influence of surface roughness lay directionality on scuffing failure of
lubricated point contacts,” ASME Journal of Tribology, 135(4), 041502 (10 pages).
[15] Li, S., Kahraman, A., Anderson N. E., and Wedeven, L. D., 2013, “A model to predict
scuffing failures of a ball-on-disk contact,” Tribology International, 60, pp. 233–245.
[16] Li S., and Kahraman A., 2009, “A mixed EHL model with asymmetric integrated
control volume discretization,” Tribology International, 42(8), pp. 1163-1172.

51
[17] Petry-Johnson, T., Kahraman, A., Anderson, N.E. and Chase, D., 2008, “An
experimental investigation of spur gear efficiency,” ASME Journal of Mechanical Design,
130(6), 062601 (10 pages).
[18] Li, S., Kahraman, A., and Klein, M., 2012, “A fatigue model for spur gear contacts
operating under mixed elastohydrodynamic lubrication conditions,” ASME Journal of
Mechanical Design, 134(4), 041007 (11 pages).
[19] Li S., and Kahraman A., 2013, “Micro-pitting fatigue lives of lubricated point
contacts: Experiments and model validation,” International Journal of Fatigue, 48, pp. 95-
18.
[20] Patching, M. J., Kweh, C. C., Evans, H. P. and Snidle,R. W., 1995, “Conditions for
scuffing failure of ground and superfinished steel disks at high sliding speeds using a gas
turbine engine oil,” Journal of Tribology, 117, pp. 482–489.
[21] Nakatsuji, T. and Mori, A., 1998, “Tribological properties of electrolytically polished
surfaces of carbon steel,” Tribology Transactions, 41(2), pp. 179–188.
[22] Etsion, I. and Sher, E., 2009, “Improving fuel efficiency with laser surface textured
piston rings,” Tribology International, 42, pp. 542–547.
[23] Kovalchenko, A., Ajayi, O., Erdemir, A., Fenske, G. and Etsion, I., 2005, “The effect
of laser surface texturing on transitions in lubrication regimes during unidirectional sliding
contact,” Tribology International, 38, pp. 219–225.
[24] Andersson, P., Koskinen, J., Varjus, S., Gerbig, Y., Haefke, H., Georgiou, S., Zhmud,
B. and Buss, W., 2007, “Microlubrication effect by laser-textured steel surfaces,” Wear,
262, pp. 369–379.

52
[25] Galda, L., Pawlus, P. and Sep, J., 2009, “Dimples shape and distribution effect on
characteristics of Stribeck curve,” Tribology International, 42, pp. 1505–1512.
[26] Qiu, Y. and Khonsari, M.M., 2011, “Experimental investigation of tribological
performance of laser textured stainless steel rings,” Tribology International, 44, pp. 635–
644.
[27] Segu, D.Z., Choi, S.G., Choi, J.H. and Kim, S.S., 2013, “The effect of multi-scale
laser textured surface on lubrication regime,” Applied Surface Science, 270, pp. 58–63.
[28] Wang, X., Liu, W., Zhou, F. and Zhu, D., 2009, “Preliminary investigation of the
effect of dimple size on friction in line contacts,” Tribology International, 42, pp. 1118–
1123.
[29] Tang, W., Zhou, Y., Zhu, H. and Yang, H., 2013, “The effect of surface texturing on
reducing the friction and wear of steel under lubricated sliding contact,” Applied Surface
Science, 273, pp. 199–204.
[30] Yu, H., Wang, X. and Zhou, F., 2010, “Geometric shape effects of surface texture on
the generation of hydrodynamic pressure between conformal contacting surfaces,”
Tribology Letters, 37, pp. 123–130.
[31] Brunetiere, N. and Tournerie, B., 2012, “Numerical analysis of a surface-textured
mechanical seal operating in mixed lubrication regime,” Tribology International, 49, pp.
80–89.
[32] Segu, D.Z. and Kim, S.S., 2014, “Influence on friction behavior of micro-texturing
under lubricated non-conformal contact,” Meccanica, 49, pp. 483–492.

53
[33] Wakuda, M., Yamauchi, Y., Kanzaki, S. and Yasuda, Y., 2003, “Effect of surface
texturing on friction reduction between ceramic and steel materials under lubricated sliding
contact,” Wear, 254, pp. 356–363.
[34] Meng, F., Zhou, R., Davis, T., Cao, J., Wang, Q.J., Hua, D. and Liu, J., 2010, “Study
on effect of dimples on friction of parallel surfaces under different sliding conditions,”
Applied Surface Science, 256, pp. 2863–2875.
[35] Johnson K. L., Contact Mechanics, Cambridge University Press, Cambridge, 1985.
[36] Kim, K. H. and Sadeghi, F., 1992, “Three-dimensional temperature distribution in
EHD lubrication. Part I: circular contact,” ASME Journal of Tribology, 114(1), pp. 32–41.
[37] Carslaw, H. S. and Jaeger, J. C., Conduction of Heat in Solids, Oxford Press, 1959.
[38] Li, S. and Anisetti, A., 2016, “On the flash temperature of gear contact under the
tribo-dynamic condition,” Tribology International, 97, pp. 6-13.
[39] Li, S. and Kahraman, A., 2011, “A method to derive friction and rolling power loss
formulae for mixed EHL contacts,” Journal of Advanced Mechanical Design, Systems, and
Manufacturing, 5(4), pp. 252–263.
[40] Wedeven, L.D. and Cusano, C., 1979, “Elastohydrodynamic film thickness
measurements of artificially produced surface dents and grooves,” ASLE Transactions,
22(4), pp. 369–381.
[41] Cusano, C. and Wedeven, L.D., 1982, “The effects of artificially-produced defects
on the film thickness distribution in sliding EHD point contacts,” Journal of Lubrication
Technology, 104, pp. 365–375.
[42] Liou, J.J., A theoretical and experimental investigation of roller and gear scuffing,
PhD Dissertation, The Ohio State University, 2010.


![Modeling and Synthesis of Tactile Texture with Spatial ...€¦ · texture perception on a surface haptic device. Friction mod-ulation surface haptic devices, such as TPad [19], [20],](https://static.fdocuments.in/doc/165x107/5f884e64f0f0ef583f5894b3/modeling-and-synthesis-of-tactile-texture-with-spatial-texture-perception-on.jpg)