The effects of landform and plant size on mortality and ...
9
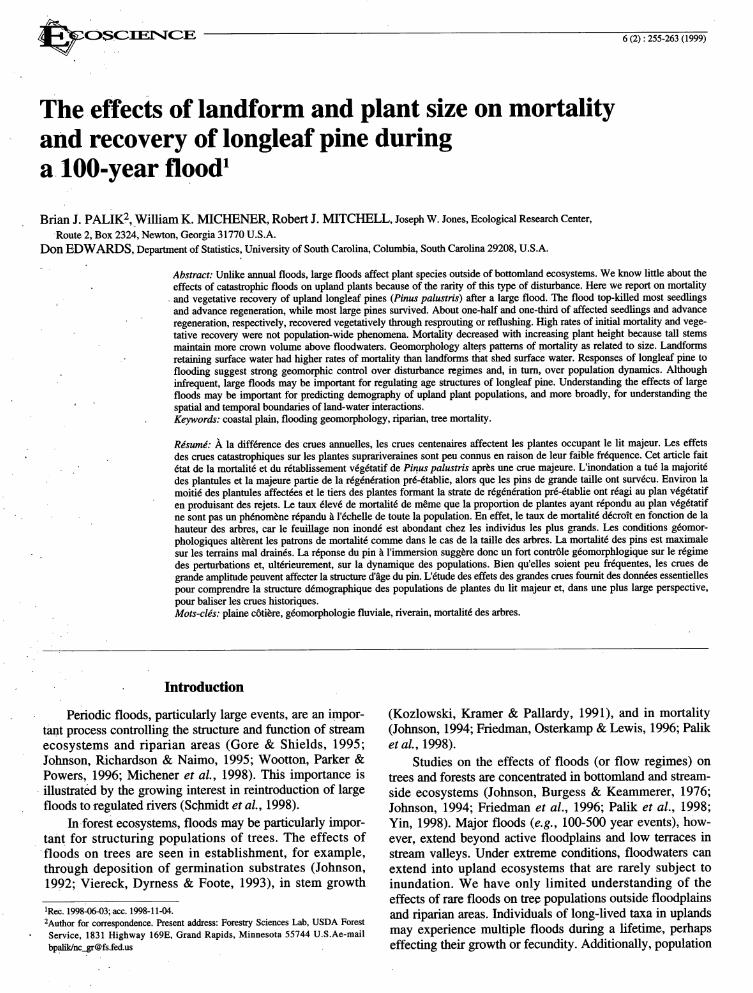
OSCIEPqCE 6 (2)" 255-263 (1999) ° The effects of landform and plant size on mortality and recovery of longleaf pine during a 100-year flood 1 Brian J. PALiK 2,William K. MICHENER, Robert J. MITCHELL, JosephW. Jones, EcologicalResearch Center, Route 2, Box 2324, Newton, Georgia 31770 U.S.A. Don EDWARDS, Department of Statistics, University of South Carolina, Columbia, South Carolina 29208, U.S.A. Abstract: Unlike annual floods, large floods affect plant species outside of bottomland ecosystems. We know little about the effects of catastrophic floods on upland plants because of the rarity of this type of disturbance. Here we report on mortality and vegetative recovery of upland longleaf pines (Pinus palustris) after a large flood. The flood top-killed most seedlings J and advance regeneration, while most large pines survived. About one-half and one-third of affected seedlings and advance regeneration, respectively, recovered vegetatively through resprouting or reflushing. High rates of initial mortality and vege- tative recovery were not population-wide phenomena. Mortality decreased with increasing plant height because tall stems maintain more crown volume above floodwaters. Geomorphology alters patterns of mortality as related to size. Landforms • retaining surface water had higher rates of mortality than landforms that shed surface water. Responses of longleaf pine to flooding suggest strong geomorphic control over disturbance regimes and, in turn, over population dynamics. Although infrequent, large floods may be important for regulating age structures of longleaf pine. Understanding the effects of large floods may be important for predicting demography of upland plant populations, and more broadly, for understanding the ' spatial and temporal boundaries of land-water interactions. • Keywords: coastal plain, flooding geomorphology, riparian, tree mortality. R_sumd: A, la difftrence des crues annuelles, les crues centenaires affectent les plantes occupant le lit majeur. Les effets . des crues catastrophiques sur les plantes suprariveraines sont peu connus en raison de leur faible frtquence. Cet article fait dtat de la mortalit6 et du rttablissement vtgttatif de Pinus palustris aprbs une crue majeure. L'inondation a tud la majoritd des plantules et la majeure partie de la rtgtntration prt-ttablie, alors que les pins de grande taille ont survtcu. Environ la moiti6 des plantules affecttes et le tiers des plantes formant la strate de rdgtntration prt-ttablie ont rtagi au plan vtgttatif en produisant des rejets. Le taux dlev6 de mortalit6 de mSme que la proportion de plantes ayant rtpondu au plan vtgttatif ne sont pas un phtnombne rtpandu/i rtchelle de toute la population. En effet, le taux de mortalit6 dtcroR en fonction de la hauteur des arbres, car le feuillage non inond6 est abondant chez les individus les plus grands. Les conditions gtomor- phologiques alt&ent les patrons de mortalit6 comme darts le cas de la taille des arbres. La mortalit6 des pins est maximale sur les terrains mal drainds. La rtponse du pin/i rimmersion suggbre done un fort contr61e gtomorphlogique sur le rtgime des perturbations et, ulttdeurement, sur la dynamique des populations. Bien qu'elles soient peu fr&luentes, les crues de grande amplitude peuvent affecter la structure d'_ge du pin. L'ttude des effets des grandes crues foumit des donntes essentielles pour comprendre la structure dtmographique des populations de plantes du lit majeur et, darts une plus large perspective, pour baliser les crues historiques. Mots-clds: plaine c6ti&e, gtomorphologie fluviale, riverain, mortalit6 des arbres. • Introduction Periodic floods, particularly largeevents, are an impor- (Kozlowski, Kramer & Pallardy, 1991), and in mortality tant process controlling the structure and function of stream (Johnson, 1994; Friedman, Osterkamp & Lewis, 1996; Palik ecosystems and riparian areas (Gore &Shields, 1995; et al., 1998). Johnson, Ri'chardson & Naimo, 1995;Wootton, Parker& Studies on the effects of floods (or flow regimes) on Powers, 1996; Michener et al., 1998).This importance is trees and forests are concentrated in bottomland andstream- illustrated by the growing interest in reintroduction of large side ecosystems (Johnson, Burgess & Keammerer, 1976; floods toregulated rivers (Sc.hmidt et HI., 1998). Johnson, 1994; Friedman et al., 1996; Palik et al., t998; In forest ecosystems, floods may be particularly impor- Yin,1998). Major floods (e.g., 100-500 year events), how- tant for structuring populations of trees. The effects of ever, extend beyond active floodplains and low terraces in floods on trees are seen in establishment, for example, stream valleys. Under extreme conditions, floodwaters can through deposition of germination substrates (Johnson, extend into upland ecosystems that are rarely subject to 1992; Viereck, Dymess & Foote, 1993), in stem growth inundation. We have only limited understanding of the effects of rare floods on tree populations outside floodplains :Ree. 1998d_-03; ace. 1998-11-04. and riparian areas. Individuals of long-lived taxa in uplands 2Author for correspondence. Present address: Forestry Sciences Lab, USDA Forest . Service, 1831 Highway 169E, Grand Rapids, Minnesota 55744 O.S.Ae-mail may experience multiple floods during a lifetime, perhaps bPalik/nc_gr@fs.fed.us effecting their growth or fecundity. Additionally, population
Transcript of The effects of landform and plant size on mortality and ...
OSCIEPqCE 6 (2)" 255-263 (1999)°
The effects of landform and plant size on mortalityand recovery of longleaf pine duringa 100-year flood 1
Brian J. PALiK 2,William K. MICHENER, Robert J. MITCHELL, JosephW. Jones, EcologicalResearchCenter,
Route 2, Box 2324, Newton, Georgia 31770 U.S.A.
Don EDWARDS, Department of Statistics, University of South Carolina, Columbia, South Carolina 29208, U.S.A.
Abstract: Unlike annual floods, large floods affect plant species outside of bottomland ecosystems. We know little about the
effects of catastrophic floods on upland plants because of the rarity of this type of disturbance. Here we report on mortalityand vegetative recovery of upland longleaf pines (Pinus palustris) after a large flood. The flood top-killed most seedlingsJ
and advance regeneration, while most large pines survived. About one-half and one-third of affected seedlings and advanceregeneration, respectively, recovered vegetatively through resprouting or reflushing. High rates of initial mortality and vege-tative recovery were not population-wide phenomena. Mortality decreased with increasing plant height because tall stemsmaintain more crown volume above floodwaters. Geomorphology alters patterns of mortality as related to size. Landforms
• retaining surface water had higher rates of mortality than landforms that shed surface water. Responses of longleaf pine toflooding suggest strong geomorphic control over disturbance regimes and, in turn, over population dynamics. Althoughinfrequent, large floods may be important for regulating age structures of longleaf pine. Understanding the effects of largefloods may be important for predicting demography of upland plant populations, and more broadly, for understanding the
' spatial and temporal boundaries of land-water interactions.• Keywords: coastal plain, flooding geomorphology, riparian, tree mortality.
R_sumd: A, la difftrence des crues annuelles, les crues centenaires affectent les plantes occupant le lit majeur. Les effets
. des crues catastrophiques sur les plantes suprariveraines sont peu connus en raison de leur faible frtquence. Cet article faitdtat de la mortalit6 et du rttablissement vtgttatif de Pinus palustris aprbs une crue majeure. L'inondation a tud la majoritd
des plantules et la majeure partie de la rtgtntration prt-ttablie, alors que les pins de grande taille ont survtcu. Environ lamoiti6 des plantules affecttes et le tiers des plantes formant la strate de rdgtntration prt-ttablie ont rtagi au plan vtgttatifen produisant des rejets. Le taux dlev6 de mortalit6 de mSme que la proportion de plantes ayant rtpondu au plan vtgttatifne sont pas un phtnombne rtpandu/i rtchelle de toute la population. En effet, le taux de mortalit6 dtcroR en fonction de lahauteur des arbres, car le feuillage non inond6 est abondant chez les individus les plus grands. Les conditions gtomor-
phologiques alt&ent les patrons de mortalit6 comme darts le cas de la taille des arbres. La mortalit6 des pins est maximalesur les terrains mal drainds. La rtponse du pin/i rimmersion suggbre done un fort contr61e gtomorphlogique sur le rtgimedes perturbations et, ulttdeurement, sur la dynamique des populations. Bien qu'elles soient peu fr&luentes, les crues degrande amplitude peuvent affecter la structure d'_ge du pin. L'ttude des effets des grandes crues foumit des donntes essentiellespour comprendre la structure dtmographique des populations de plantes du lit majeur et, darts une plus large perspective,pour baliser les crues historiques.Mots-clds: plaine c6ti&e, gtomorphologie fluviale, riverain, mortalit6 des arbres.
• Introduction
Periodic floods, particularly large events, are an impor- (Kozlowski, Kramer & Pallardy, 1991), and in mortalitytant process controlling the structure and function of stream (Johnson, 1994; Friedman, Osterkamp & Lewis, 1996; Palikecosystems and riparian areas (Gore & Shields, 1995; et al., 1998).Johnson, Ri'chardson & Naimo, 1995; Wootton, Parker & Studies on the effects of floods (or flow regimes) onPowers, 1996; Michener et al., 1998). This importance is trees and forests are concentrated in bottomland and stream-
illustrated by the growing interest in reintroduction of large side ecosystems (Johnson, Burgess & Keammerer, 1976;floods toregulated rivers (Sc.hmidt et HI., 1998). Johnson, 1994; Friedman et al., 1996; Palik et al., t998;
In forest ecosystems, floods may be particularly impor- Yin, 1998). Major floods (e.g., 100-500 year events), how-tant for structuring populations of trees. The effects of ever, extend beyond active floodplains and low terraces in
floods on trees are seen in establishment, for example, stream valleys. Under extreme conditions, floodwaters canthrough deposition of germination substrates (Johnson, extend into upland ecosystems that are rarely subject to1992; Viereck, Dymess & Foote, 1993), in stem growth inundation. We have only limited understanding of the
effects of rare floods on tree populations outside floodplains:Ree. 1998d_-03; ace. 1998-11-04. and riparian areas. Individuals of long-lived taxa in uplands2Author for correspondence. Present address: Forestry Sciences Lab, USDA Forest
. Service, 1831 Highway 169E, Grand Rapids, Minnesota 55744 O.S.Ae-mail may experience multiple floods during a lifetime, perhapsbPalik/[email protected] effecting their growth or fecundity. Additionally, population

PALIK ETAL'"FLOODING 'ANDLONGLEAF PINE
°
. •age structures may carry the imprint of past floods, as a low-lying areas. The Jones Center contains 7 500 ha of 70 toresult of either increased mortality or establishment. 90 year-old second-growth longleaf pine forests (Palik &
A 100-Year flood occurring in the southeastern U.S.A. Pederson, 1996; Palik et al., 1997). These forests span aduring 1994 provided us with an opportunity to document xeric to wet-mesic hydrologic gradient across the uplandthe effects of flooding on tree populations in an upland landscape (Goebel et aL, 1997).landscape. Specifically, we examined the influence of theflood on mortality of longleaf pine (Pinus palustris Mill.) in CHARACTERISTICSOFTROPICALSTORMALBERTO
the southWestern Georgia Coastal Plain. Longleaf pine is a Tropical Storm Alberto made landfall on the Florida pan-long-lived species (> 400 years) that grows across a wide handle near Fort Walton Beach on July 3, 1994, and traveledhydrologic gradient, ranging from xeric sand deposits to inland. Because of weak steering currents, the stormwet-mesic fine-textured soils adjacent to wetlands (Ware, remained relatively stationary over southwestern GeorgiaFrost.& Doerr, 1993). While not strictly an upland species, and southeastern Alabama. Over a period of six days (Julylongleaf pine is uncommon in bottomland and wetland 2-7, 1994), one-third of Georgia and one-sixth of Alabamaecosystems (Goebel et al., 1996) and i_pparently is intoler- recorded over 17 cm of precipitation (Garza, 1995). Rainfallant of flooding (Wahlenberg, 1946). Because of longleaf was especially heavy (up to 53 Cm) in the Flint andpine's rarify in bottomlands, studies of natural disturbance Ocmulgee River basins in southwestern Georgia. Flow onregimes for this ecosystem have ignored flooding, instead tributaries and mainstems of the two rivers (including ourfocusing on fire, lightning, and wind (Platt, Evans & study area) exceeded 100-year flood discharges along mostRathbun, 1988; Palik & Pederson, 1996). reaches (Stamey, 1995; Michener et al., 1998).
We are not aware of any studies that have examinedfloodmortality of a single upland tree species across a wide FLOODEXTEN'gANDELEVATIONCONTOURS
ecological gradient. We speculated that flood mortality of We monitored the progression of the floodwaters onlongleaf pine would differ across an elevation gradient in site using a global positioning system (GPS) having sub-the flood zone, and among different landforms, because of meter accuracy. Using the GPS, we recorded the maximumvariation in soil drainage properties, water holding ca[gabili- elevation of floodwaters at approximately 350 locationsties of landforms, duration of inundation, and current veloc- along Ichawaynochaway Creek and the Flint River. We
. ities. Our intent here is to assess the ability of landforms used ARC/INFO to digitize elevation spot heights andand landscape positions to mediate the effects of flooding 1.5 m (5 ft.) contours, from United States Geologicalonlongleaf pine populations. The conceptual framework for Survey quadrangles. We developed a flood boundary mapexamining the interaction of disturbance and geomorpholo- by overlaying maximum water levels on topography, andgy on ecological processes comes mainly from observations extrapolating along contour lines between the points to formin steep gradient systems of the Pacific Northwest a flood polygon (Figure 1). Within this polygon, we used(Swanson et al., 1988; Swanson et al., 1998). We know the 1.5 m contours to delineate a series of flood zones thatComparatively little about how similar interactions affect occur between stream bank-full (baseline) and maximumspecies and ecosystems in the low gradient Coastal Plain.We also examine how plant size influences flood mortality, Ichawaynochaway Creek (-----_--)
particularly as it interacts with landscape position to deter-mine extent and duration of inundation. Specific objectivesof our study are to: i) quantify longleaf pine mortalityamong populations distributed across a Coastal Plain land-Scape; and//)relate mortality and vegetative recovery ofindividuals to elevation above flood waters, landform shape,
• soil texture within landforms, and plant height.
Material and methods
STUDY AREAwe conducted our study at Ichauway, a 115 km 2 eco-
logical reserve located at the J. W. Jones Ecological . ._,, m ver
Research Center in southwestern Georgia (Figure 1). Thelocation of thesite is along the' Flint River at its confluencewith Ichawaynochaway Creek. Approximately 22 km of .-. Floodboundary -q'_ /¢,.!chawaynochaway Creek bisects the study area, while anadditional 19 km of the Flint River delineates the southeastern
border. Average annual discharges range from 236 m3 sec 1for Ichawaynochaway Creek, to approximately 2060 m3 Scale
.... Kilometerssec-1 for the Flint River (Stokes, McFarlane & Buell, 1992). 2 bFlows are generally low and stable from early summer
FIGURE1. Location of the study area showing extent of flooding associ-.through autumn. Winter and early spring storms frequently ated with Tropical Storm Alberto. Note that only one side of the Flintresult in bankfull discharges and seasonal inundation of River is included within the study area.
256

G ,iw
I_COSCIENCE,VOL.6 (2), 1999
flood elevations. Flood zones characterize the magnitude of 1997). Soil textures are generally homogeneous within theflooding. For example, the first flood elevation contour is small landforms of our study. We passed air-dried samplesthat area within 1.5 m (_ 0.75 m) vertical elevation of the through a 2 mm mesh sieve to remove coarse fragmentsstream at bankfull conditions. This zone experienced the (2-75 mm; a small percentage of total soil weight in alllongest period of inundation and deepest floodwaters, samples) and determined silt + clay (< 0.05 mm) and sandDetails of the processing steps for developing flood con- contents by wet sieving after dispersion in a Calgon solu-tours are in Michener & Houhoulis (1997). tion. We separated sand size fractions at the 100-cm depth,
including very coarse + coarse sand (0.5-2.0 mm), mediumFIELD SAMPLING ANDLABORATORYPROCESSING sand (0.25-0.5 mm), and fine + very fine sand (0.05-
We characterized the general effects of flooding on 0.25 mm), by dry sieving.longleaf pine populations during an initial reconnaissanceof the study are/t in mid-July, 1994. We determined that STATISTICAL ANALYSISflooding did not kill pines larger than about 10 m in height, We used logistic multiple regression (Hosmer &apparently because total submergerice of larger trees was Lemeshow, 1989) to model mortality and resprouting/re-rare. Because of this, we restricted sampling to populations flushing ability of seedlings and advance regeneration. Wethat contained some individuals < 10 m tall, whether they fit regression models to a single binary (0-1) dependentwere alive or dead. L0ngleaf pine in these populations variable using the SAS LOGISTIC procedure (SAS Instituteoccur in patches that range in size from 0.1 to several Inc., 1990). The logistic model has the form:
hectares, with the patches themselves dissociated from logit (_) - log(_,(1- _)-1) = I + _9'x, [1]large overstory trees. We located populations by walking
transects runriing perpendicular to Ichawaynochaway where I is the intercept, _ is the set of slope parametersCreek and the Flint River. Sampled populations contained associated with the predictor variables x, and _ is the proba-at least 50 individuals that were < 10 m tall. We located bility that the response (Y) equals 1 given its vector (x) ofand sampled 138 populations meeting the minimum size predictor variables (i.e. _r=Pr (Y=I Ix). We modeled mor-requirements. This'represented a near total enumeration of tality by assigning 0 for both "crown dead" at the time ofthe entire population of regeneration patches within the sampling and "crown resprouting/reflushing" at the time of
. zone of flooding. Sampling occurred once during January- sampling (i.e., top-killed, but recovering) and 1 for "crownFebruary 1995, six months after the flood, live" at the time of sampling. Similarly, we modeled
For each patch, we recorded the total number of longleaf resprouting/reflushing ability by assigning 0 for "crownpines and assigned each to one of two size classes; grass- dead" at the time of sampling and 1 for "crown resprouting/stage seedlings and advance regeneration. The grass-stage is reflushing." We chose to model mortality as dead plusa life-history stage characterized by short stature (< 0.1 m), resprouting/reflushing individuals, rather than strictly deadlittle height growth, and a dense tuft of needles protecting individuals, so as to increase sample sizes for the logistic-the apical meristem of the seedling (Wahlenberg, 1946). We regressions. Further, it is common to assess mortality ofmeasured the height of advance regeneration (i.e., individu- trees in this way, despite the fact that many species mayals that had begun height growth) to the tip of the dominant recover from living root systems. Predictor variables in theleader. We assigned stems to one of three physiological models include:
conditions: live, dead, or resprouting/reflushing. An individ- i) stem height (cm; advance regeneration models only)ual was resprouting if a new shoot had initiated from a liv- expressed in log l0 transformed values (transformed to meeting root system (restricted to grass-stage seedlings), and normality assumption), together with the square of thereflushing if any new needles had developed on the dead transformed values [(logl0(height))2];
croWn (usually restricted to advance regeneration), ii) elevation contour indicators (height interval in meters• We determined flood zone (1.5 m elevation contour) above bankfull conditions: 0-1.5, 1.6-3.0, 3.1-4.6, 4.7-6.0,
and local landform for each population. Landforms ranged in 6.1-7.6, 7.7-9.1 9.2-10.7)"size from several hundred to several thousand m2. We coded ' '
landform Shape into the following classes: depressions (deep iii) interactions between height and elevation contour indi-concave' landforms, slopes > 5%); hollows (shallow concave cators; andlandforms, slopes < 5%); fiats (no identifiable depression, iv) soil texture expressed as percentages of very coarse + coarseslopes < 5%); slopes (linear features, slopes > 5%); hills sand, medium sand, very fine + fine sand, and silt + clay.
(convex features, slopes < 5% on most sides); and ridges The potential for model over-specification and(linear convex features, slopes > 5% on two sides). These observed statistically significant interactions among height,landform classes represent an categorization from those landform, and elevation contour in preliminary analysesmost likely to retain surface water to those most likely to required development of individual models for each land-shed Surface water, form. We used stepwise backward elimination to select sta-
We collected soil samples for texture determination tistically significant (p < 0.05) predictors. For the elevationfrom a depth of 100 cm at a central location within each contours, we choose the 4.7-6 m interval as a reference zonelandform. While not diagnostic of the entire soil profile, since this elevation was most consistently representedtexture at 100 cm does reveal the presence or absence of among all landforms. Thus, indicator regressors and predic-
. clay horizon that is reflective of drainage conditions in Ion- tors for the other zones model the differences between thesegleaf pine ecosystems of the study area (Goebel et al., zones and the 4.7-6 m contour.
257

PALIK er AL: FI_OODINGAND LONGLEAFPINE
o
Indices used for evaluating the quality and predictive relationships between percentages of sands and fines andability of the individual logistic multiple regression models the probability of mortality and resprouting/reflushing. Thisinclude: (i) likelihood ratio tests; (ii) fraction of concordant suggests high inter-landform variability in soil properties,and discordant pairs; and (iii) Somer's D. The Likelihood rather than any specific relationship between dependent andratio statistic provides a test for the statistical significance independent variables.of the regressors based on -2 log likelihood and has an
asymptotic chi-square distribution under the null hypothesis ADVANCEREGENERATIONthat coefficients of explanatory variables in the model arezero. A large value for -2 log likelihood is analogous to a Mortality of advance regeneration in the flooded arearegression sum of squares, reflecting greater variance approached 70% (Table I). Less than one-third of all stemsexplained by the model. For all live versus dead (or dead (21.3%) had reflushed by the time of sampling.versus resprouting/reflushing) pairwise combinations, con- Approximately one-third (30.9%) were unaffected by floodcordance (discordance) is the percentage of pairs in which waters. Taken together, live stems and those that reflushedthedead observation has a higher (lower) predicted proba- accounted for 52% of all advance regeneration. Overall,bility of mortality than the live observation. Ties result advance regeneration had higher rates of mortality andwhen the pair is neither concordant nor discordant. Somer's lower probability of vegetative recovery than did grass-D is an index of rank correlation between predicted proba- stage seedlings (Table I).
bilities and observed responses (Hosmer & Lemeshow, Mortality (percent top-killed; percent dead) of advance1989; SAS Institute Inc., 1990). regeneration was highest in depressions (91.0%; 70.2%) and
hollows (82.5%; 62.8%), intermediate in flats (74.4%;Results 52.4%) and slepes (69.6%; 45.4%), and lowest on hills
(42.5%; 25.5%) and ridges (20.0%; 3.7%) (Table I). TheGRASS-STAGESEEDLINGS proportion of advance regeneration that reflushed following
Two-thirds (66.4%; 4808 of 7244) of the grass-stage death was relatively consistent across all landforms, rangingseedlings in the flooded area were top-killed by the flood from 16.3 to 24.2% (Table I).(Table I). However, over half of these seedlings (2585)
Advance regeneration exhibited complex responses to'resprouted (or reflushed) by the time of sampling. One-thirdof all Seedlings were unaffected by flood waters (33.6%). flooding within individual landforms. The best logisticUltimately, nearly 70% of all seedlings (living plus regression models of mortality (in terms of predictabilityresprouts) survived the flood to the time of sampling, and interpretability) for depressions, flats, and slopes
Mortality rates of grass-stage seedlings varied among include plant height (and/or height2), one or more elevationcontours, all soil texture parameters, and numerous two-waylandforms. Pooled across flood elevation zones, mortality interaction terms between height (or height 2) and elevation(.percent top-killed; percent dead) was highest in hollows(92.3%; 65.3%) and depressions (85.2%; 46.8%), interme- contour (Tables IV and V). Model performance was good indiate in fiats (69.3%; 34.8%) and slopes (63.6%; 24.7%), most cases (Table IV), but was somewhat better for predict-and lowest on hills (58.6%; 18.8%) and ridges (24.0%; ing mortality than reflushing ability. (Sample sizes were0_7%; Table I). There were no obvious trends related to insufficient on hollows, ridges, and hills for logistic regres-landform in resprouting ability of grass-stage seedlings sion models to statistically discriminate differences in eco-(Table I). logical responses among elevation contours [p > 0.05]; see
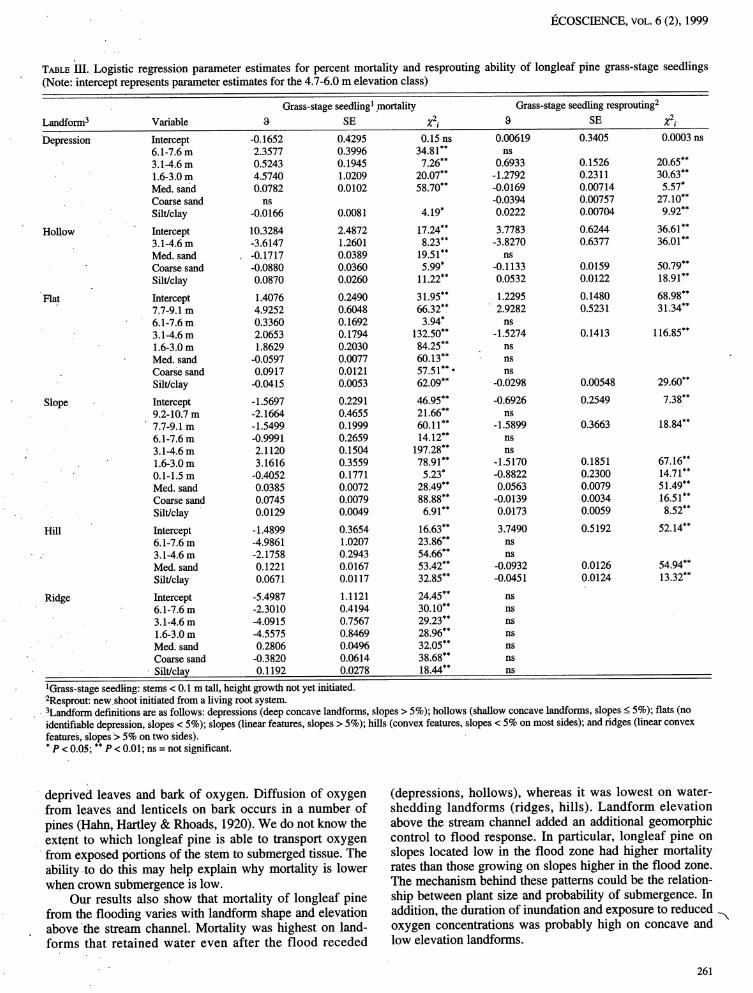
Logistic regression models for the probability of grass- Table I)stage seedling mortality (includes percent dead plus percent The models suggest several general patterns in mortalitytop-killed, but resprouting) and resprouting/reflushing as related to stem heights and flood elevation zones. First,(Table II) retained one or more elevation contours and one the probability of mortality decreased with increasing plantor more soil texture parameters (Table III). The various height (Figures 2a-c). The exception to this general trendmeasures of model performance (Table II) indicated high occurred at the 7.7-9.1 m elevation contour on slopes (Figurestatistical .significance and good predictive capabilities in 2c), probably because of the presence of a single 8.0-m stemmost landforms (somewhat better for modeling mortality that died. Second, the probability of mortality oftenthan resprouting ability). Although grass-stage seedling increased once regeneration reached a height of 20 cm. Theresponses to flooding were complex, some general trends bell-shaped curves for several of the elevation contours showare evident. First, mortality was consistently high across all this trend (Figures 2a-c), as does the statistically significantflood zones for both depressions and flats (Table I). Second, (P < 0.05) height 2 parameters and heightE-elevation contourmorta!ity declined with flood elevation for slopes (except interactions in the logistic regression models (Table V).for the lowest flood zone), and was consistently low for Third, mortality on depressions and slopes was negativelyridges (Table I). Hollows and hills did not occur on enough related to flood zone elevation (Figure 2; Table V), i.e.,elevation contours to suggest any clear trends. Further, no highest at sites closest to the active channels. Finally, theclear trends were evident for the probability of resprouting probability of mortality increased with increasing amountsacross elevation contours (Table I). of coarse sands and decreasing amounts of medium sands
• Man), soil texture parameters in the models were signif- and silt + clay (Table V). However, the biological signifi-icant (Table III). However, there were inconsistencies in cance of these soil relationships is not apparent.
258

t_COSCIENCE, VOL.6 (2), 1999
TABLEI. Percent mortality and vegetative recovery of longleaf pine grass-stage seedlings and advance regeneration by landform and floodelevation zone
Landform6 Elevation Grass-stage seedlings1 Advance regeneration 2zone (m) Top-killed3 Top-killed
Live Dead Resprout4 Total Live Dead Reflush5 Total% % % n % % % n
Depression 0.1- 1.5 0.0 76.5 23.5 17 5.7 87.1 7.1 70• (n - 27) 1.6 - 3.0 0.6 73.5 25.9 162 12.9 64.7 22.4 85
3.14.6 16.0 38.9 45.1 736 4.3 73.4 22.2 8994.7 - 6.0 24.0 45.1 30.9 275 24.6 49.3 26.1 2116.1 - 7.6 7.2 58.4 34.4 125 15.7 76.9 7.4 121Subtotal 14.8 46.8 38.4 1315 9.0 70.2 20.8 1386
Hollow 3.1 - 4.6 9.9 . 55.8 34.3 233 7.9 57.9 34.2 76(n=6) 4.7-6.0 5.2 75.8 19.0 211 29.5 68.9 1.6 61
Subtotal ' 7.7 65.3 27.0 444 17.5 62.8 19.7 137Flat 1.6- 3.0 13.4 33.6 53.0 336 32.0 52.3 15.7 153(n = 33) 3.1 - 4.6 14.2 64.4 21.3 506 16.4 72.3 11.4 483
4.7 - 6.0 57.9 14.5 27.6 359 35.7 44.3 20.0 255' 6.1 - 7.6 46.8 18.1 35.1 365 25.3 27.0 47.7 237
7.7- 9.1 5.5 18.2 76.4 55 4.2 16.7 79.2 249.2 - 10.7 22.2 11.1 66.7 9 54.7 39.6 5.7 53Subtotal 30.7 34.8 34.5 1630 25.6 52.4 22.0 1205
Slope 0.1 - 1.5 47.2 29.8 23.0 161 27.4 46.8 25.8 62(n = 44) 1.6 - 3.0 5.1 59.0 36.0 178, 3.8 72.0 24.2 186
3.1 - 4.6 9.3 33.1 57.6 774 13.1 55.5 31.3 6324.7 - 6.0 39.7 18.0 42.3 983 37.2 36.1 26.8 4526.1 - 7.6 83.3 6.3 10.3 126 96.6 1.4 2.0 1487.7 - 9.1 84.5 11.1 4.4 297 50.5 48.4 1.1 93
• 9.2- 10.7 81.8 6.1 12.1 33 90.5 0.0 9.5 21Subtotal 36.4 24.7 38.9 2552 30.4 45.4 24.2 1594
Hill 3.1 - 4.6 50.0 13.7 36.3 256 56.0 28.3 15.7 382(n = 14) 4.7 - 6.0 20.8 27.6 51.5 293 45.2 23.3 31.5 73
6.1 - 7.6 98.5 0.0 1.5 67 100.0 0.0 0.0 34Subtotal 41.4 18.8 39.8 616 57.5 25.5 17.0 489
Ridge 1.6- 3.0 96.8 0.0 3.2 63 75.0 25.0 0.0 4(n= 13): 3.1 - 4.6 36.8 0.0 63.2 87 13.8 0.0 86.2 29
4.7 - 6.0 66.6 0.0 33.4 293 82.4 4.0 13.6 4276.1 - 7.6 95.9 2.0 2.0 244 91.9 2.7 5.4 74Subtotal 76.0 0.7 23.3 687 80.0 3.7 16.3 534
Total 33.6 30.7 35.7 7244 30.9 47.9 21.3 5345
1Grass-stageseedling: stems < 0.1 m tall, height growth not yet initiated.2Advanceregeneration: stems >_0.1 m tall, height growth initiated.aTop-killed individuals include those stemsthat were dead at the time of sampling and those that recovered vegetatively through living root systems.4Resprout:new shoot initiated from a living root system (restricted to grass-stage seedlings).5Reflush:new needles developed in the original crown (usually restricted to advance regeneration).6Laladformdefinitions are as follows: depressions (deep concave landforms, slopes > 5%); hollows (shallow concave landforms, slopes _<5%); flats (noidentifiable depression, slopes < 5%); slopes (linear features, slopes > 5%); hills (convex features, slopes < 5% on most sides); and ridges (linear convex
• - features, slopes > 5% on two sides).
Like mortality, the best models for explaining reflush- Discussioning of advance regeneration on depressions, flats, andslopes typically include plant height (and/or height2), one or A remarkable result of this study is that a large percent-more elevation contours, soil texture parameters (except age of longleaf pine seedlings (70%) and advance regenera-
flats), and one or more two-way interaction terms between tion (50%) survived, to the time of sampling, or recoveredheight (,or height 2) and elevation contour (Tables IV and V). from the flood despite the catastrophic nature of the distur-
Two general trends for probability of reflushing are evident, bance. Continued observations for several months after ourFirst, the inverted bell-shaped curves for four of the eleva- initial sampling suggest that no additional flood mortalitytion contours in depressions illustrate the disproportionately occurred in the study populations. Additional evidence sug-
higher probability of resprouting in the smallest, but also gests high survival of grass-stage seedlings with short periodsthe largest size classes (Figure 2d, Table V). Second, for of inundation. Submerged seedlings in another study allmost advance regeneration (Figures 2d-f)the probability of survived, although growth was less than in unflooded
reflushing decreased with height. An exception is the 0.1- seedlings (Palik et al., 1997). This is contrary to the belief1.5 m contour in depressions and slopes, possible because that mortality of longleaf pine with submergence is generallyof small sample sizes (n - 5 and 16, respectively), high (Wahlenberg, 1946). However, repeated flooding, such
. Reiationships between soil texture and probability of as occurs on floodplains, may result in greater mortality overreflushing were not consistent among landforms (Table V). time than single floods. Indeed, the absence of longleaf pine
259

dr" - .o
PALIKET AL: FLOODING AND LONGLEAF PINE
1.0- "a) _._ _ 1.6-3.0 -:_2.__,,,_ _ ._1-1.5 1.0-- d)0.8-- "_._ - 6.0 6.1 ._.6"",_, _ __ N
"k \\\ 0,_•,. " • 7 - 6.0
0.6 -- 0.6 •
0.2 -- '_ 0.2 -- 6.1-7.6__ •.3.1 o4.6_
0 .. 0 -- 0.1 - 1.5--- ---- ---. _--..-._r _.r_-- -I I I I I I l I I I I I I I
__ 9.2--10.7 -- --.
1.0 b) 4.7-_6.0 _._ _ , 1.0-- e)6.1-7.6 _-----_-'_\'_--'''"_,, \0.8 -._. -,, -_. 0.8 --
" 1.6 3.1.4.60.6 0.6-
9.2-10.7 "_
,,O 0.4 , 4.7 - 6.0 _ " _ ,.
1__ "i __'_ 0.4 3.1 - 4.6 _
0 _•_, _ 0.2 ....
i i I I I I a a " i i I 1 I i
1.0-- "C) 1.6- 3.0........ _- - ,_,.. 1.0 -- f)
3.1- 4-_5"_ ---- __ ", _-_,_ 0.8 - /" 9.2-10.7 _ _ ,.._-"" 0.8 --
"_ 0.6 - ,,," _ _ ",, _,_. _ 0.6 --
"_ ,L " "_.7-9.1 _ XX k _._ 7.7-9.1 _"
I__ 0.20"4----/4.7 -"6.06.1-7.6 ' "_*_" _ NNN., 'k • 0.20"4----4"7"6"0_-7"63.1-4166___ 0.1 - 1.5-- _- _-.. _. _ 'r'__ - m 0_ -
' 0 1 • 0.2 0.5 1 2 5 10 0 1 0 2 0.5 1 2 5 10
Stem height (log m) Stem height (log m)
FIGURE 2. Estimated probability of longleaf pine advance regeneration mortality in (a) depressions, (b) flats, and (c) slopes, and crown reflushing ability
in the same landforms(d - depressions, e flats, f- slopes), for each elevation zone (1.5 m contours) based on logistic multiple regression. Mortality values
are based on initial mortality, i.e., the combination of stems that were dead at the time of sampling plus those that were top-killed but had reflushed by thetime of sampling. Individual models are based on average soil texture characteristics for specific landforms. Note: in some instances, several elevation con-
tours shared identical response curves on the graphs (e.g., 9.2-10.7 and 4.7-6.0 m in graph e); only one curve is visible in these instances.
TABLEI!. Summaries of logistic multiple regression models by on floodplains (Goebel et al., 1996) suggests that thelandform for probability of longleaf pine grass-stage seedling species is intolerant of frequent flooding.
mortality and resprouting The second important result of our study is that highModel fit Indicesof modelpredictive ability survival and vegetative recovery are not population- or
-2 Log likelihood Concord. Discord. Somer's D landscape-wide phenomena; both vary with plant size andLandform 1 statistic (%) (%) flood-zone geomorphology. Probability of mortality generallya) GRAss-STAGE SEEDLING2 MORTALITY increased with decreasing stem height of advance regenera-'Depression 219.78"** (5 df) 80.4 16.1 0.643 tion. This occurred because complete crown submergence
-Hollow 48.55*** (4d f) 79.3 10.5 0.688 was more likely for smaller stems, particularly at lowerFlat- 456.06*** (7 df) 80.7 17.2 0.635 elevations in the landscape. However, as a group, grass-stage•1 ***Slope 050.63. (9 df) 84.7 13.8 0.709
Hill 255.15"**(4df) 79.1 18.5 0.606 seedlings had lower mortality rates than advance regenera-Ridge 246.00*** (6 df) 80.9 14.3 0.66 tion, perhaps because faster height growth rates in the latterb) GRASS-STAGE SEEDLINGRESPROIYrING3 reduce carbohydrate reserves available for recovery (Brown,Depression 219..12"**(5df) 72.5 23.9 0.486 1964). The 10-m height threshold for mortality that weHollow 112.15"** (3 df) 70.8 16.7 0.541 observed reflects the position of live crowns above maximumFlat 2.t6.86"**(3 df) 72,8 24.7 0.480 water depth in the flood zone. Stems taller than 10 m hadSlope 151.88"** (6 df) 62.8 33.6 0.292 some live crown above the water, even in the lowestHill 75.64*** (2 dr) 65.6 27.5 0.381
Ridge ns landscape positions.
1Landform definitions are as follows: depressions (deep concave land- The mechanism causing increased mortality with crownforms, slopes > 5%); hollows (shallow concave landforms, slopes < 5%); submergence may have been oxygen deficiency of sub-flats (no identifiable depression, slopes < 5%); slopes (linear features, merged tissue. Lack of oxygen may be the primary cause ofslopes > 5%); hills (convex features, slopes < 5% on most sides); ridges mortality in inundated trees, although toxic metabolites(linear convex features, slopes > 5% on two sides).
2Grass-stage seedling: stems < 0.1 m tall, height growth not yet initiated. (e.g., iron, fatty acids, ethylene) also inhibit root growth of3R_sprout: new shoot initiated from a living root systems, submerged conifers (Sanderson & Armstrong, 1980).***p < 0.001; ns = not significant. Complete or nearly complete inundation could have
260
'lb _ •
I_COSCIENCE, VOL.6 (2), 1999
TABLE III.. Logistic regression parameter estimates for percent mortality and resprouting ability of longleaf pine grass-stage seedlings(Note: intercept represents parameter estimates for the 4.7-6.0 m elevation class)
Grass-stage seedling: mortality Grass-stage seedling resprouting2
Landform3 Variable 8 SE Z2i 8 SE Z2i
Depression Intercept -0.1652 0.4295 0.15 ns 0.00619 0.3405 0.0003 ns6.1-7.6 m 2.3577 0.3996 34.81"* ns3.1-4.6 m 0.5243 0.1945 7.26** 0.6933 0.1526 20.65**1.6-3.0 m 4.5740 1.0209 20.07** -1.2792 0.2311 30.63**Med. said 0.0782 0.0102 58.70** -0.0169 0.00714 5.57*Coarse sand ns -0.0394 0.00757 27.10"*Silt/clay -0.0166 0.0081 4.19* 0.0222 0.00704 9.92**
Hollow Intercept 10.3284 2.4872 17.24"* 3.7783 0.6244 36.61"*3.1-4.6 m -3.6147 1.2601 8.23** -3.8270 0.6377 36.01"*Med. sand , -0.1717 0.0389 19.51"* nsCoarse sand -0.0880 0.0360 5.99* -0.1133 0.0159 50.79**Silt/clay 0.0870 0.0260 11.22"* 0.0532 0.0122 18.91"*
Flat Intercept 1.4076 0.2490 31.95"* 112295 0.1480 68.98**' 7.7-9.1 m 4.9252 0.6048 66.32** 2.9282 0.5231 31.34"*
6.1-7.6 m 0.3360 0.1692 3.94* ns• 3.1-4.6 m 2.0653 0.1794 132.50"* -1.5274 0.1413 116.85**
1.6-3.0 m 1.8629 0.2030 84.25** nsMed. sand -0.0597 0.0077 60.13** nsCoarse sand 0.0917 0.0121 57.51"*° nsSilt/clay -0.0415 0.0053 62.09** -0.0298 0.00548 29.60**
Slope Intercept -1.5697 0.2291 46.95** -0.6926 0.2549 7.38**9.2-10.7 m -2.1664 0.4655 21.66"* ns
' 7.7-9.1 m -1.5499 0.1999 60.11"* -1.5899 0.3663 18.84"*6.1-7.6 m -0.9991 0.2659 14.12"* ns3.1-4.6 m 2.1120 0.1504 197.28"* ns
' 1.6-3.0m 3.1616 0.3559 78.91"* -1.5170 0.1851 67.16"*0.1-1.5 m -0.4052 0.1771 5.23" -0.8822 0.2300 14.71**Med. sand 0.0385 0.0072 28.49** 0.0563 0.0079 51.49"*Coarse sand 0.0745 0.0079 88.88** -0.0139 0.0034 16.51"*Silt/clay 0.0129 0.0049 6.91"* 0.0-173 0.0059 8.52**
Hill Intercept - 1.4899 0.3654 16.63"* 3.7490 0.5192 52.14"*6.1-7.6 m -4.9861 1.0207 23.86** ns
. 3.1-4.6 m -2.1758 0.2943 54.66** nsMed. sand 0.1221 0.0167 53.42** -0.0932 0.0126 54.94**Silt/clay 0.0671 0.0117 32.85** -0.0451 0.0124 13.32**
•Ridge Intercept -5.4987 1.1121 24.45** ns6.1-7.6 m -2.3010 0.4194 30.10"* ns3.1-4.6 m -4.0915 0.7567 29.23** ns1.6-3.0 m -4.5575 0.8469 28.96** nsMed. sand 0.2806 0.0496 32.05** nsCoarse sand -0.3820 0.0614 38.68** ns• ,
Silt/clay 0.1192 0.0278 18.44"* ns
• !Grass-stage seedling: stems < 0.1 m tall, height growth not yet initiated.2Resprout: newshoot •initiatedfrom a living root system.3Landform definitions are as follows: depressions (deep concave landforms, slopes > 5%); hollows (shallow concave landforms, slopes < 5%); fiats (noidentifiable depression, slopes < 5%); slopes (linear features, slopes > 5%); hills (convex features, slopes< 5% on most sides); and ridges (linear convexfeatures, slopes> 5% on two sides).*P < 0.05; **P < 0.01; ns = not significant.
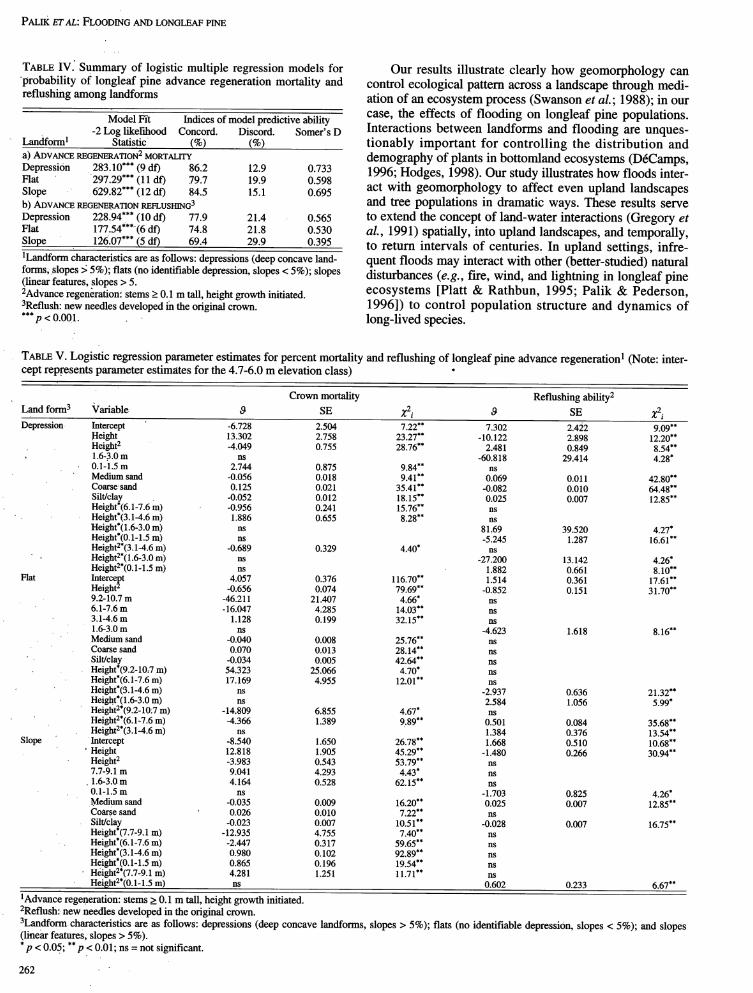
deprived leaves and bark of oxygen. Diffusion of oxygen (depressions, hollows), whereas it was lowest on water-from leaves and lenticels on bark occurs in a number of shedding landforms (ridges, hills). Landform elevation
pines (Hahn, Hartley & Rhoads, 1920). We do not know the above the stream channel added an additional geomorphicextent to which longleaf pine is able to transport oxygen control to flood response. In particular, longleaf pine on
from exposed portions of the stem to submerged tissue. The slopes located low in the flood zone had higher mortalityability to do •this may help explain why mortality is lower rates than those growing on slopes higher in the flood zone.when crown submergence is low. The mechanism behind these patterns could be the relation-
Our results also show that mortality of longleaf pine ship between plant size and probability of submergence. In
from the flooding varies with landform shape and elevation addition, the duration of inundation and exposure to reduced ..\above the stream channel. Mortality was highest on land- oxygen concentrations was probably high on concave and
' forms that retained water even after the flood receded low elevation landforms.
261
PALIKm'AL: FLOODING AND LONGLEAF PINE
TABLE IV: Summary of logistic multiple regression models for Our results illustrate clearly how geomorphology can"probability of longleaf pine advance regeneration mortality and control ecological pattern across a landscape through medi-reflushing among landforms ation of an ecosystem process (Swanson et al.; 1988); in our
Model Fi_ Indices of model predictive ability case, the effects of flooding on longleaf pine populations.-2 Log likelihood Concord. Discord. Somer's D Interactions between landforms and flooding are unques-
Landform 1 Statistic (%) (%) tionably important for controlling the distribution and
a) ADVANCEREGENERATION2MORTALITY demography of plants in bottomland ecosystems (D6Camps,Depression 283.10"**(9 df) 86.2 12.9 0.733 1996; Hodges, 1998). Our study illustrates how floods inter-Flat 297.29*** (11 df) 79.7 19.9 0.598
Slope 629.82*** (12 df) 84.5 15.1 0.695 act with geomorphology to affect even upland landscapesb) ADVANCEREGENERATION REFLUSHING3 and tree populations in dramatic ways. These results serveDepression 228.94***(10 df) 77.9 21.4 0.565 to extend the concept of land-water interactions (Gregory etFlat 177.54"**(6 df) 74.8 21.8 0.530 al., 1991) spatially, into upland landscapes, and temporally,Slope 126.07"**(5 df) 69.4 29.9 0.395 to return intervals of centuries. In upland settings, infre-1Landform characteristics are as follows: depressions (deep concave land- quent floods may interact with other (better-studied) naturalforms, slopes > 5%); fiats (no identifiable depression, slopes < 5%); slopes disturbances (e.g. fire, wind, and lightning in longleaf pine(linear features, slopes > 5.
2Advance regeneration: stems > 0.1 m tall, height growth initiated, ecosystems [Platt & Rathbun, 1995; Palik & Pederson,3Reflush:new needles developed in the original crown. 1996]) to control population structure and dynamics of***p < 0.001. long-lived species.
TABLEV. Logistic regression parameter estimates for percent mortality and reflushing of longleaf pine advance regeneration 1 (Note: inter-cept represents parameter estimates for the 4.7-6.0 m elevation class) °
Crown mortality Reflushing ability2
Land form 3 Variable ,9 SE Z2i _ SE Z2i
Depression Intercept ' -6.728 2.504 7.22** 7.302 2.422 9.09**Height 13.302 2.758 23.27** - 10.122 2.898 12.20**Height 2 -4.049 0.755 28.76** 2.481 0.849 8.54**
. 1.6-3.0 m ns -60.818 29.414 4.28*0.1-1.5 m 2.744 0.875 9.84** nsMedium sand -0.056 0.018 9.41 ** 0.069 0.011 42.80**Coarse, sand 0.125 0.021 35.41 ** -0.082 0.010 64.48"*Silt/clay -0.052 0.012 18.15** 0.025 0.007 12.85"*Height*(6.1-7.6 m) -0.956 0.241 15.76.. nsHeight*(3.1-4.6 m) 1.886 0.655 8.28** ns
Height*( 1.6-3.0 m) ns 81.69 39.520 4.27*Height*(0.1-1.5 m) ns -5.245 1.287 16.61 **Height2*(3.1-4.6 m) -0.689 0.329 4.40* ns
Height2*(1.6-3.0 m) ns -27.200 13.142 4.26*Height2*(0.1-1.5 m) ns 1.882 0.661 8.10"*
Flat Intercept 4.057 0.376 116.70** 1.514 0.361 17.61"*Height z -0.656 0.074 79.69** -0.852 0.151 31.70**9.2-10.7 m -46.211 21.407 4.66* ns6.1-7.6 m - 16.047 4.285 14.03"* ns3.1-4.6 m 1.128 0.199 32.15"* ns1.6-3.0 m ns -4.623 1.618 8.16"*Medium sand -0.040 0.008 25.76** nsCoarse sand 0.070 0.013 28.14"* ns
• . Silt/clay -0.034 0.005 42.64** nsHeight*(9.2-10,7 m) 54.323 25.066 4.70* nsHeight*(6.1-7.6 m) 17.169 4.955 12.01 ** ns
• Height*('3.1-4.6 m) ns -2.937 0.636 21.32"*Height*(1.6-3.0 m) ns 2.584 1.056 5.99*Height2*(9.2-10.7 m) -14.809 6.855 4.67* nsHeight2*(6.1-7.6 m) -4.366 1.389 9.89** 0.501 0.084 35.68**
" 2*Height (3.1-4.6 m) ns 1.384 0.376 13.54"*
Slope Intercept -8.540 1.650 26.78** 1.668 0.510 10.68"*' Height 12.818 1.905 45.29"* - 1.480 0.266 30.94**
Height 2 -3.983 0.543 53.79** ns7.7-9.1 m 9.041 4.293 4.43* ns1.6,3.0 m 4.164 0.528 62.15"* ns0.1-1.5 m ns -1.703 0.825 4.26*
Medium sand -0.035 0.009 16.20"* 0.025 0.007 12.85"*Coarse sand ' 0.026 0.010 7.22** nsSilt/clay -0.023 0.007 10.51 ** -0.028 0.007 16.75"*Height*(7.7-9.1 m) -12.935 4.755 7.40** nsHeight*(6.1-7.6 m) -2.447 0.317 59.65** nsHeight*(3.i-4.6 m) 0.980 0.102 92.89** nsHeight*(0.1-1.5 m) 0.865 0.196 19.54"* nsHeight2*(7.7-9.1 m) 4.281 1.251 11.71"* nsHeight2*(0.1-1.5 m) ns 0.602 0.233 6.67**
1Advance regeneration: stems >_0.1 m tall, height growth initiated.
2Reflush: new needles developed in the original crown.
3Landform characteristics are as follows: depressions (deep concave landforms, slopes > 5%); flats (no identifiable depression, slopes < 5%); and slopes(linear features, slopes > 5 %).
*p < 0.05; **p < 0.01; ns = not significant.
262

I_COSCIENCE, VOL.6 (2), 1999
Acknowledgements Michener, W. K., E. R. Blood, J. M. Brim Box, C. A. Couch, S.W. Golladay, D. J. Hippe, R. J., Mitchell & B. J. Palik, 1998.
The National Science Foundation (DEB-9520878) provided Tropical storm flooding of a Coastal Plain landscape.funding for this study, with additional support from the USDA BioScience 48" 696-705.Forest Service, North Central Research Station, and the J. W.Jones Ecological Research Center. J. Brock, W. Callahan, K. Palik, B. J. & N. Pederson, 1996. Natural disturbance and oversto-Coffey, M. Drew, D. Fussell, P. H0uhoulis, G. Houseal, M. Lauck, ry mortality in longleaf pine ecosystems. Canadian Journal ofP. Parker, N. Pederson, S. Phillips, R. Reardon, B. Taylor, and L. Forest Research, 26: 2035-2047.West provided technical support. Palik, B. J., R. J. Mitchell, G. Houseal & N. Pederson, 1997.
Effects of canopy structure on resource availability and• Literature cited seedling responses in a longleaf pine ecosystem. Canadian
Brown, C. L., 1964. The seedling habit of longleaf pine. Georgia Journal of Forest Research, 27: 1458-1464.Forestry Research Council. Report 10, Atlanta, Georgia. Palik, B. J., S. W. Golladay, P. C. Goebel & B. W. Taylor, 1998.
D6Camps, H., 1996. The renewal of floodplain forests along Geomorphic variation in riparian tree mortality and streamrivers: A landscape perspective. Vereinigung ftir Therotishe coarse woody debris recruitment from record flooding in aund Angewandte Limnologie, 26: 35-59. coastal plain stream, l_coscience, 5" 551-560.
Friedman,. J. M., W. R. Osterkamp & W. M. Lewis Jr., 1996. Platt, W. J. & S. L. Rathbun, 1995. Population dynamics of an old-,Channel narrowing and vegetation development following a growth population of longleaf pine (Pinus palustris). Pagesgreat plains flood, Ecology, 77: 2167-2181. 200-214 in S. M. Hermann (ed.). Proceedings of the 18th Tall
Garza, C., 1995. Alberto: A hydrometeorologic nightmare. Pages Timbers Fire Ecology Conference. Tall Timbers Research, Inc.,310-312 in K. J. Hatcher (ed.). ProCeedings of the 1995 Tallahassee, Florida.
Georgia Watex Resources Conference. University of Georgia, Platt, W. J., G. W. Evans & S. L. Rathbun, 1988. The populationAthens, Georgia. dynamics "ofa long-lived conifer (Pinus palustris). American
Goebel, P. C.,B. J. Palik, L. K. Kirkman & L. West, 1996. Naturalist, 131: 491-525.Geomo_hic influences on riparian forest composition andstructure in a karst landscape of southwestern Georgia. Pages Sanderson, P. L. & W. A. Armstrong, 1980. The response of110-114 in K. M: Flynn (ed.). Proceedings of the Southern conifers to some of the adverse factors associated with waterForested Wetlands Ecology and Management Conference. logged soils. New Phytologist, 85: 315-362.•Consortium for Research on Southern Forested Wetlands, SAS Institute Inc., 1990. SAS/STAT User's Guide. SAS Institute
' Clemson University, Clemson, South Carolina. Inc., Cary, North Carolina.Goebel, P. C., B. J. Palik, L. K. Kirkman & L. West, 1997. A mul- Schmidt, J. C., R. H. Webb, R. A. Valdez, R. Marzolf & L. E.
tifactor ecosystem classification of Ichauway Plantation, South Stevens, 1998. Science and values in fiver restoration in theGeorgia; field manual. Joseph W. Jones Ecological Research Grand Canyon. BioScience, 48" 735-748.
Center Document, Newton, Georgia. Stamey, T. C., 1995. Floods in central and southwestern GeorgiaGore, J. A & F. D. Shields Jr., 1995. Can large rivers be restored? in July 1994. Pages 313-316 in K. J. Hatcher (ed.). Proceedings
BioScience, 45: 142-152. of the 1995 Georgia Water Resources Conference. UniversityGregory, S. V., F. J. Swanson, W. A. McKee & K. W. Cummins, of Georgia, Athens, Georgia.
1991. An ecosystem perspective of riparian zones. BioScience,41: 540-551. Stokes, W. R., III, R. D. McFarlane & G. R. Buell, 1992. Water
Resources Data Gex)rgia,Water Year 1991. U.S. Geological Survey,Hahn, G. G., C. Hartley & A. S. Rhoads, 1920. Hypertrophied Water-DataReportGA,91-1,Athens, Georgia.
lenticels on roots of conifers and their relation to moisture and
aeration. Journal of Agricultural Research, 20: 253-265. Swanson, F. J., T. K. Kratz, N. Caine & R. G. Woodmansee, 1988.Hodges, J. D. _,1997. Minor alluvial floodplains. Pages 325-341 in M. Landform effects on ecosystem patterns and processes.
G. Messina & W. H. Conner (ed.). Southern Forested Wetlands: BioScience, 38: 92-98.• " Ecology and Management. Lewis Publishers, New York. Swanson, F. J., S. L. Johnson, S. V. Gregory & S. A. Acker, 1998.
• Hosmer, D. W. & S. Lemeshow, 1989. Applied Logistic _ , Flood disturbance in a forested mountain landscape.
Regression. John Wiley & Sons, New York. BioScience, 48:681-695.Johnson, W. C., 1992. Dams and riparian forests: Case study from Viereck, L. A., C. T. Dyrness & M. J. Foote, 1993. An overview
theupper Missouri River. Rivers, 3: 229-242. of the vegetation and soils of the floodplain ecosystems of the
Johnson, W. C., 1994. Woodland expansion in the Platte River, Tanana river, interior Alaska. Canadian Journal of ForestNebraska: Patterns and causes. Ecological Monographs, 64: 45-84. Research, 23: 889-898.
Johnson, B. L., W. B. Richardson & T. J. Naimo, 1995. Past, pre- Wahlenberg, W. G., 1946. Longleaf pine: Its use, ecology, regen-sent, and future concepts in large fiver ecology. BioScience, eration, protection, growth and management. Charles Lathrop45" 134-141. Pack Forestry Foundation, Washington, D.C.
Johnson, W. C., R. L. Burgess & W. R. Keammerer, 1976. Forest Ware, S., C. Frost & P. D. Doerr, 1993. Southern mixed hardwoodoverstory vegetation and environment on the Missouri River forest: The former longleaf pine forest. Pages 447-493 in W.H.
floodplain in North Dakota. Ecological Monographs, 46: 59-84. Martin, S.G. Boyce & A.C. Echternacht (ed.). Biodiversity ofKozlowski, T. T., P. J. Kramer & S. G. Pallardy, 1991. The physi- the southeastern United States. John Wiley & Sons, New York.
ological ecology of woody plants. Academic Press, San Diego,Calfl'ornia. Wootton, J. T., M. S. Parker & M. E. Powers, 1996. Effects of dis-
turbance on fiver food webs. Science, 273: 1558-1561.Michener, W. K. & P. F. Houhoulis, 1997. Detection of vegetation
changes associated with extensive flooding in a forested Yin, Y., 1998. Flooding and forest succession in a modified stretchecosystem_ Photogrammetric Engineering and Remote Sensing, along the Upper Mississippi River. Regulated Rivers: Research
. 63" 1363-1374. and Management, 14: 217-225.
263