How to beat hyper-inflation without eroding shareholders value?

IFC Technical Paper Number 3
The Effects of Hyper-Inflation on Accounting RatiosFinancing Corporate Growth in Industrialising Economies
Geoffrey WhittingtonVictoria Saporta
Ajit Singh

iii
CONTENTS
Foreword ................................................................................................................................................v
Abstract ............................................................................................................................................... vii
Acknowledgments ............................................................................................................................... ix
1. Introduction.......................................................................................................................................1
2. Adjusting Company Accounts for Inflation .....................................................................................2
3. Adjusting the Accounts of Turkish Companies for Inflation .......................................................13
4. The Effects of Inflation Adjustment on the Variables in the Two Studies....................................15
5. Analysis of the Measurement Bias in the Equity Financing Variable...........................................20
6. Conclusion ......................................................................................................................................21
Appendix..............................................................................................................................................22
Tables ...................................................................................................................................................27
References............................................................................................................................................37

v
FOREWORD
This is the third IFC Technical Paper. The series is designed to publish the results of an ongoingprogram of research in IFC’s Economics Department, examining issues of importance to the privatesector in developing countries.
Inflation has plagued many of the developing countries in which IFC operates. In addition to the manyreal effects that inflation can have on an economy, it is also possible that accounting for the operations offirms is distorted by inflation. To date, however, little is known about the impact of inflation on thefinancial statements of firms in developing countries. This study examines the implications of inflation-induced effects on the financial statements of Turkish firms. The paper documents a bias in financialstatements that is introduced by inflation and suggests a methodology for reducing that bias.
As the largest multilateral institution lending to and investing in private enterprises in developingcountries, IFC is uniquely well placed to examine this issue. The Corporation is also particularlyinterested in the results of the work, precisely because of the nature of its operations. Of course, theseissues are of great relevance to the development and investment communities as a whole.
Guy Pfeffermann,Director, Economics Department
& Economic Adviser of the Corporation

vii
ABSTRACT
Hyper-inflation can have a severe distortionary effect on the pattern of corporate finance which isapparent from company accounts. A simple algorithm, based upon the method of inflationaccounting applied in Brazil, is developed and applied to the accounts of Turkish listed companiesfor the period 1982-90. The adjusted figures give a more plausible picture of corporate profitabilityand growth, and this suggests that the adjustment method is substantially successful. The financingpatterns emerging from the adjusted data support the proposition of Singh and Hamid (1992) andSingh (1995) that (a) the corporate sector in developing countries tends to rely more on externalfinance than on internal finance for growth and (b), among the external sources of funds, it usesnew share issues to a surprisingly high degree. Further adjustments to the measurement of theexternal finance variable for Turkey and other countries also support this proposition. Thiscontradicts the "pecking order" hypothesis, which suggests that retained profits are the preferredsource of finance, and also runs contrary to the belief that the capital markets of developingcountries are inadequate to support substantial corporate growth by external financing, includingequity financing.

ix
ACKNOWLEDGMENTS
Funding for the research project on corporate finance in industrialising economies, from which thisstudy emanates, has come from the IFC and the Research Committee of the World Bank inWashington DC; the Nuffield Foundation; and Price Waterhouse. The financial help of thesebodies is gratefully acknowledged. We also wish to thank Mr Selim Soudemir of the CapitalMarkets Research Board, Ankara, for his generous help in making available to us detailed data onTurkish corporate accounts. We are also grateful to Mr Rudy Mathias for his expert researchassistance. None of these institutions or individuals is responsible for the contents of this paper,which are entirely the responsibility of the authors.

1. INTRODUCTION
In the first large-scale comparative studies of corporate financing patterns of large firms in leadingdeveloping countries (DCs), Singh and Hamid (1992) and Singh (1995) arrived at some rathersurprising conclusions. This research showed that although there are variations in corporatefinancing patterns among developing countries, in general, corporations in the sample countries relyvery heavily on (a) external funds, and (b) new share issues on the stockmarket to finance thegrowth of their net assets. These findings are opposite to what most economists would predict. Inview of the low level of development of DC capital markets and their many imperfections, onewould expect these corporations to rely much more on internal, rather than external finance. Moreover, for the same reasons, one would also expect them to resort to the stockmarket to a verysmall degree, if at all, to raise finance. The Singh and Hamid conclusions also run contrary to the"pecking order" pattern of finance which is thought to characterize advanced country corporations,whereby the latter mostly use retained profits to finance their investment needs; if more finance isrequired, they have recourse to banks or long-term debt, and go to the stockmarket only as a lastresort.
A potentially serious objection to Singh and Hamid's results, noted by the authors themselves, isthat they might be distorted by measurement biases. Two of these are particularly significant: (a)the use of the historical cost method of accounting in periods of high inflation; and (b) in theabsence of the necessary data, the bias in the indirect method used to assess the contribution of theequity financing variable. It is well known that high inflation rates cause historical cost accounts toproduce a misleading picture of corporate performance by, for example, under-stating depreciationcharges (which are based on lower historical asset costs rather than higher current costs) and over-stating interest charges (by ignoring the "gain on borrowing" which arises when the real value ofdebt is eroded by inflation). Since these two effects work in opposite directions, it can readily beappreciated that, as a result of inflation, historical cost accounting may either over-state or under-state real profits and, consequently, the amount of retained profits. Thus, the Singh and Hamidresults, which are dependent upon the amount of retained profits, are open to challenge, in thosecases in which no adjustment has been made.1
With respect to (b), the basic problem is that in Singh and Hamid's studies, the variable "equityfinancing of corporate growth" is measured as a residual. The growth of net assets is equal byidentity to the growth of internal finance plus the growth of external finance; the latter is equal tothe growth of long-term liabilities and the growth of equity. In this research, the growth of internalfinance was measured by retained profits from the profit and loss account. The growth of long-termliabilities was proxied by the growth of long-term debt. Equity finance was then measured as theresidual from the accounting identity. What this means is that in the Singh and Hamid analysis, thegrowth of equity will be overstated to the extent that some of the long-term liabilities andprovisions (eg. for future tax and pensions) are not included in the debt financing variable. Similarly, revaluations which should be regarded as a part of internal finance would, on thismethod, get included in equity finance, because they do not pass through the profit and lossaccount, which is the source of the retained profits measure.
1Such adjustments were made, as part of standard accounting practice, in Brazil and in Mexico, two of the ten countries in Singh's (1995)
sample. The other eight were: Turkey, Korea, Malaysia, Thailand, Jordan, Pakistan, India and Zimbabwe. The sample frame in this study normallyconsisted of the top hundred listed manufacturing companies in each country. The earlier study, Singh and Hamid (1992), did not include Brazil andwas confined to the fifty largest quoted manufacturing companies in each country.

2
This paper explores the nature and extent of both these potential measurement biases to see whetherthey are serious enough to overturn Singh and Hamid's anomalous findings. Although the presentstudy has been motivated by this consideration, it inter alia, also makes a more general contribution. The latter lies in evaluating the impact of inflation on corporate accounts in developing countries,which is of interest in its own right as there are hardly any studies on the subject. Equallyimportantly, the study develops and implements a simple and parsimonious method of inflationadjustment which can be applied to other countries.
The paper proceeds as follows. In Section 2, we explain the methodology adopted for makinginflation adjustments to the accounts. Section 3 applies the chosen technique to the company sectorof Turkey, the country with one of the highest rates of inflation in the Singh and Hamid samples.Section 4 and the Appendix explore the theoretical and empirical consequences of thismethodology for the main Singh and Hamid ratios. The question of the possible measurement biasin the indirect estimation of the equity financing variable is examined in Section 5. Section 6concludes.
2. ADJUSTING COMPANY ACCOUNTS FOR INFLATION
(i) Problems caused by inflation
Accountants have traditionally recorded items in the accounts by reference to the monetaryconsideration in the transaction which originated them. Thus, assets are recorded at whatwas paid for them and liabilities are recorded at what was received in exchange for creatingthem. This is the historical cost method of accounting, and it is still the basis of mostfinancial accounting systems, despite an increasing tendency to modify historical costs toreflect current values.
In a period of general inflation, the relevance of historical costs is brought into questionbecause they do not reflect consistently the current financial position or recent performanceof the firm. In so far as historical costs are established at different dates, when the currencyunit represented different real purchasing power, it can be argued that accounts drawn up onthis basis create the fundamental measurement error of aggregating heterogenousmeasurement units.
With regard to monetary items, ie those items which are denominated in nominal moneyterms which do not vary with inflation, the consequence of inflation is that historical costaccounts fail to recognise the so-called "gain on borrowing" and "loss on holding money". The gain on borrowing arises from the need to re-pay a lender only in nominal units. Thus,if a loan L is taken out at time t and is repaid at time t+1 when the general price index hasincreased by a factor (1+i), then the gain on borrowing is Li.2 The loss on holding money issymmetrical with the gain on borrowing: this arises because money and other items
2The real value at t+l of the amount borrowed is L(l+i), but the repayment required is only L, since it is fixed in nominal terms.

3
denominated in money terms, are not adjusted to compensate for their loss of realpurchasing power in a period of inflation. Thus the loss on holding money can be measuredas -Mi.3
Thus, if a company's monetary assets exceed its liabilities (M>L) in a period of inflation itwill have a net loss on these items which will not be recorded in its historical cost accounts. If it is a net borrower (M<L), it will have an unrecorded net gain. Of course, it will alsohave interest payments and receipts, which will be recorded in the historical cost accounts. If interest rates correctly anticipate inflation (due to the so-called "Fisher effect"4), then the"loss on holding money" is best regarded as a deduction from interest received (as theelement of interest which compensates for the loss of purchasing power of the principal)and the "gain on borrowing" should similarly be regarded as a deduction from interest paid.
Real assets (those not denominated in money terms) pose a different problem. In this case,it is not possible to assume that their monetary amount is fixed, because their prices inmoney terms will fluctuate as a response to changing market conditions. There are twoalternative approaches to the measurement of real assets in response to changing prices: re-statement by reference to a general price index and re-statement by reference to the marketprice of the specific asset, which may be approximated by an appropriate specific priceindex. Under the former approach, general price index adjustment, the historical cost is re-stated by reference to general inflation, so that no real gain or loss can be reported as a resultof inflation. Thus, the effects of relative price changes are ignored, but pure inflation isadjusted for. If a specific real (or "non-monetary") asset was bought for Nt at Time t, andthe general price level rises by 1+i at t+1, we re-state the original cost as Nt+1 = Nt(1+i), iewe assume that its value has just kept pace with inflation with no real gain or loss in value,preserving the real value of the historical cost of acquisition. Under the alternative methodwe assume that Nt has changed as a result of specific market price changes which can bemeasured by reference to a specific index or price, s, so that Nt+1 = Nt(1+s). In this case,there is a gain or loss in real terms if s ≠ i, and this will be equal to Nt(1+s)-Nt (1+i), ie therewill be a real gain if s>i and a loss if s<i.5 This method reflects relative price changes and istherefore a clear departure from historical cost accounting.
An important aspect of many real assets is that they have a limited life, so that their partialconsumption during a period must be reflected in a depreciation charge. This was ignoredin the previous paragraph, which assumed a non-depreciating asset (such as an investmentin land). Once we allow for inflation, both the general index approach and the specificindex approach will yield a higher depreciation charge, and hence a lower profit, thanhistorical cost, when prices are rising, since the depreciation charge will be based on theincrease in the relevant index (i or s) since the asset was acquired.
3Closing amount M, less indexed opening amount M(l+i).
4This relates the real interest rate, r, to the nominal interest rate, n as n=(l+r)(l+i)-1 where i is the anticipated inflation rate.
5It should be noted that the choice of index is not without difficulty. In the case of the general index, i, we have, for example, a choicebetween a consumer price index or an "all output" index such as the GDP deflator. In the case of a specific index, we have a choice of buying priceand selling price, the problem of allowing for technical progress, and the choice of level of aggregation at which the index is measured.

4
A similar adjustment will be made for the cost of stocks consumed during a period. Inflation, or specific rises in the prices of the items in stock, will cause stocks to rise invalue between purchase and use. This stock appreciation should be deducted from profit inorder to remove price change effects and produce a real measure. As with depreciation, theadjustment can be made by using either a general index (to remove the effects of pureinflation) or a specific index (to remove the effects of the specific price changes on theitems held in stock). In either case, the profit figure will be lower, after adjusting for theeffects of rising prices, than would be the case under historical cost accounting.
Thus, in summary, general price level changes cause two offsetting effects on monetaryassets and liabilities: the gain on borrowing and loss on holding money which result frominflation. The depreciation charge on real (non-monetary) fixed assets will be under-statedin historical cost accounts as a result of inflation, as will the cost of stocks sold. These maybe corrected by using either a general or a specific index. If a specific index is applied toreal assets, this will capture the change in price of the specific asset and this may exceed thechange in the general price level (giving rise to a real gain) or fall short of it (giving rise to areal loss).
(ii) Possible inflation accounting systems6
It will be apparent from the above discussion that there are several alternative methods ofaccounting which will deal with the distortions caused to historical cost accounting byinflation. Three basic alternatives are outlined below. These are Constant PurchasingPower (CPP), Current Cost Accounting (CCA) and Real Terms Accounting (RTA).
Constant Purchasing Power accounting (CPP) retains the historical cost basis of accountingby adjusting only for the effects of general inflation (measured by a general purchasingpower index, i). The inflation adjustment can be applied only to the non-monetary items inthe accounts, ie those whose amount is not fixed in nominal monetary units. Such itemsinclude real assets and shareholders' equity interests. Thus, a gain on borrowing and loss onholding money will be reported as a result of inflation, and the depreciation charge and costof stocks sold, will be re-stated by using a general index.
Current Cost Accounting (CCA) makes no adjustment for general inflation but, instead,adjusts the non-monetary items to reflect changes in specific prices relevant to the business. Thus, real assets will be measured at current specific prices, and so will the related chargesfor depreciation and cost of stocks sold. Specific asset revaluations will not, however,appear as profits, because the proprietors' opening capital will be re-stated by reference to aspecific index, on the ground that the maintenance of the specific assets of the business is anessential condition before recognising a profit. This system has much in common with theeconomist's method of calculating real GDP after deducting replacement cost depreciation.7
6A full exposition of the alternatives is in Whittington (1983). Strictly, accounting systems which apply only specific price indices are
concerned with price changes rather than pure inflation.
7There are variants of CCA which adjust for gains and losses on monetary items, using the "gearing adjustment"; see Whittington (1983).
5
Real Terms Accounting (RTA) attempts to combine aspects of CPP and CCA. Like CCA itre-states non-monetary assets by reference to a specific price or index, but the opening valueof proprietors' capital, which provides the benchmark for the measurement of gain or loss, isre-stated by reference to a general price index. Thus, the gain on borrowing and loss onholding money appear as in a CPP system, and gains or losses in value of non-monetaryassets appear as profit in so far as they are real gains or losses, ie to the extent that they gainor lose relative to the general index. The real gain or loss on a non-monetary asset is N(s-i). The balance sheet contains current valuations of assets (by reference to s), as it does inCCA, but in contrast with CPP which uses general indexation of historical cost.
Where full information is available, the RTA method has much to recommend it, because itselects those indices which seem most relevant to the specific items: it is reasonable toassume that proprietors will use a general price index as a benchmark in assessing whethertheir stake has gained in value, but it also seems reasonable to assess specific non-monetaryassets by reference to their current market values rather than historical cost adjusted by ageneral index.
However, in the present case, we do not have current market values or specific indicesavailable, so that both the CCA and RTA approaches are ruled out by lack of data. Wetherefore choose the CPP method on grounds of practicality. There are, however, threeother arguments in favour of the CPP approach.
(1) CPP adjustments are recommended by the International Accounting StandardsCommittee (IASC) for use in hyper inflationary economies (IASC standard IAS29,1989, see Price Waterhouse (1996) for an exposition of this approach). Moreover,variants of CPP were practised in certain countries which have had sustainedperiods of high inflation, such as Brazil and Mexico which were included in theSingh and Hamid study.
(2) At higher inflation rates, it might be expected that inflation would have a largerdistortionary effect on company accounts compared with that of relative pricechanges (which are captured by a specific index rather than the general index usedin CPP). Thus CPP becomes more useful, the higher the rate of general inflation.
(3) Specific price changes are more important for individual companies than across thecompany sector in general, across which relative price changes might be expected toaverage out. In the present study, we are not adjusting the aggregate accounts of thecompany sector, so that this argument is not totally convincing. However, in so faras we are looking at average effects across individual companies, we might expectthe errors due to using a general, rather than a specific index, to cancel out onaverage, if their distribution is random across companies.
(iii) The CPP method
The essence of full CPP adjustment, as outlined above, is as follows:

6
(1) Re-state "non-monetary" items in the balance sheet (ie those items not fixed innominal terms) by indexing historical cost from the date of acquisition or (ifrelevant) subsequent revaluation, up to balance sheet date.
(2) Re-state the profit and loss account by making four adjustments:
(i) Depreciation adjustment: This will be proportionate to the re-statement of fixed assets. It reflects depreciation in current pricesrather than historical prices at date of acquisition or revaluation.
(ii) Cost of sales adjustment: This eliminates stock appreciation due tothe fact that stocks are charged to profit at historical cost rather thantheir current cost at time of use. It can be based on simpleindexation of opening stocks. A more subtle adjustment wouldallow for changes in stocks during the year (ie some form of averagestocks), and an even more subtle method would involve re-statementof both opening and closing stocks to allow for the gap betweenacquisition date and balance sheet date (which is usually short).
(iii) Gain on borrowing: This is the nominal amount of loans multipliedby the change in the price index over the period. It can be offsetagainst interest paid to give a real interest figure. A subtle versionwould allow for changes in borrowing during the period, byaveraging, whereas a simpler but cruder version would be based onthe opening balance sheet figure. Conceptually, a similar adjustmentshould be made for interest-bearing deposits, or they may be nettedout (together with their interest receipts) against borrowing (andinterest payments).
(iv) Loss (or gain) on net monetary assets: In its simplest form this is theamount of monetary assets held multiplied by the change in theindex for the period. Monetary assets are assets of fixed monetaryvalue, trade debtors being typically the most important element. It isusual to offset these against non-interest-bearing current liabilities(typically, trade creditors) for calculation purposes, althoughliabilities could be included in the gain on borrowing calculation (3above), and alternatively there could be an omnibus "net monetaryitems" adjustment which would combine 3 and 4. There is, ofcourse, the usual option of using the opening balance sheet situationor a mid-period average.
An alternative to the full CPP adjustments is to adjust the profit and loss account by theBrazilian Method (as described by Martins, 1986). This produces a single omnibusadjustment for inflation, encapsulating (i) to (iv) inclusive, by using the basic accountingidentity:

7
Nt+Mt ≡ Lt+Et ..... (1)
Where N is non-monetary assetsM is monetary assetsL is liabilitiesE is equity interest (share capital and reserves), which constitutes thebalancing item (being increased by profits and reduced by losses)
The identity can be rearranged as Et ≡ Nt+Mt-Lt so that an indexation of equity for theperiod can be used to remove the inflationary element from profit, as follows:
If the non-monetary assets Nt are held throughout the period, and are measured at pricelevels pertaining at the beginning of the period, then we can re-state this item at the end ofthe period by (1+i), which is the change in the price index over the period t to t+1. It is notlegitimate to re-state Mt and Lt because they are fixed in money terms. Thus, the re-measured closing balance sheet at t+1 is:
E t+1 =Nt(1+i)+Mt-Lt ..... (2)
In order to measure profit for the period on a price-level adjusted basis, we restate all initialcapital E by the general price index:
Et(1+i)=Nt(1+i)+Mt(1+i)-Lt(1+i) ..... (3)
Profit is measured by deducting the capital maintenance measure (3) from the closingbalance sheet (2):
E t+1 -Et(1+i)=(Lt-Mt)(1+i) ..... (4)
This shows clearly the gain on borrowing (Lt(1+i)) and the loss on holding money(-Mt(1+i)) in the simple, no transaction, case. The Brazilian method recognises that, byvirtue of the basic identity (1):
(Lt-Mt)=(Nt-Et)..... (5)
Thus, the Brazilian method is:
Inflation adjustment = N t+1 i-E t+1 iwhere i is the proportionate change in the inflation index over the periodt-l, t and N consists of fixed non-monetary assets which were heldthroughout the period and therefore have to be adjusted from openingpurchasing power to closing purchasing power units. It is assumed that Nt ismeasured at historical cost indexed up to price levels at t and that Ettherefore reflects this re-measurement

8
With the Brazilian method, as with the more sophisticated approach described earlier, wecan be more accurate by allowing for non-monetary assets (N) and equity finance (E) addedor subtracted during the period.
The advantage of the Brazilian method is simplicity: a one line adjustment to profit. Thedisadvantage is lack of sophistication in attributing the adjustment to different sources(stocks, monetary assets etc.). This can affect the calculation of certain financial ratios(such as the ratio of operating profit to sales).
Ideally, to implement the full CPP method, we need the following data:
(1) Both an opening balance sheet and a closing balance sheet for each period, togetherwith a profit and loss account.
(2) Enough detail in each statement to implement the above adjustments, eg we need tobe able to separate monetary from non-monetary assets, possibly interest-bearingfrom non-interest-bearing loans, and, in the profit and loss account, we need toknow cost of sales, interest payments, etc.
(3) We also need to know date of acquisition or subsequent revaluation of non-monetary assets, so that we can index them to the relevant balance sheet date. If wewish to adopt the sophisticated method of allowing for transactions within the year,we ideally need to know the dates (and index levels at the time) of thosetransactions.
If we had this information, we could build up a consistent time series of CPP accounts foreach company, each year's balance sheet being a consistent re-statement of the previousyear's and each profit and loss account being the connecting link between opening andclosing balance sheets. However, we are unlikely to have complete information in at leastthree respects:
(1) Opening balance sheets may not be available for the first year of a series, becausethe accounts usually have profit and loss account and associated closing balancesheet (although prior year comparative figures are usually produced).
(2) Dis-aggregated detail may not be available, eg on the break-down of monetary andnon-monetary items (eg stocks and trade debtors may be aggregated together).
(3) Date of acquisition or revaluation will almost certainly not be available. This willbe particularly important for fixed assets, which are carried over long periods.
We therefore need a simplified approach. The use of the Brazilian method will avoidproblem 2 above, but problems 1 and 3 remain. To deal with them, we propose below whatwe call the modified Brazilian method.

9
(iv) The modified Brazilian method
This is the simplest and crudest approach possible. It involves using the Brazilian method,and applying it to the published accounts (profit and loss account and closing balance sheetonly) using a crude method of estimating fixed asset age (based on depreciation).
The basic framework of the system is as follows:
(1) Re-state the closing balance sheet: This involves re-stating non-monetary fixedassets by the change in price level index since the date of acquisition. The net (ofdepreciation) increase due to inflation is added to fixed assets and to a revaluationreserve which is part of equity (share capital plus reserves).
(2) Calculate a one-line inflation adjustment to profit and loss account: This shouldideally be based on the average balance sheet structure, but closing balance sheet ismost available, and most relevant if there has been a re-structuring (eg a majoracquisition). If we can accept the closing balance sheet as our base, we can inferbackwards the inflation adjustment. For an asset which is simply held during theperiod, we would adjust opening value: Nt(l+i)=N t+1. If we observe only N t+1(closing balance sheet), we can work back to the opening value:
and the difference,
This type of adjustment is applied to two items:
(1) Non monetary fixed assets: This should be based on the closing (re-stated in closingprices) amount, net of any depreciation to date (we have effectively disposed of thedepreciation component, so that it no longer exists by the end of the period).
(2) Equity: This should be based on the closing amount (including the revaluationreserve) of share capital and reserves.
Clearly (1) is an addition to profit, when prices are rising (i>0), and (2) is a deduction. Thenet amount is an approximation to the Brazilian Inflation Adjustment and should be addedto historical cost profit when (1) > (2) or deducted when (2) > (1)
N = N(1+ i)t
t+1
t+1 t t+1N - N is N 1- 1(1+ i)� �

10
This process relies on the date of acquisition of fixed assets being known, and this is notstated in the accounts. However, we can estimate it from evidence which does appear in theaccounts.
There are three types of evidence available for dating:
(1) General revaluations: When it is known that there has been a general revaluation (aswas the case in Turkey in 1982), it is reasonable to assume that all assets inexistence at this date are expressed in prices as of that date. This approach involvesa deviation from the strict indexation of historical cost as used in IAS29, and there isthe possibility that the general revaluation was less than complete when (as was thecase of Turkey) it was voluntary (although it was accompanied by tax incentives andthese did not apply to all assets). If anything, relying on the revaluation is likely tolead to a degree of under-statement of opening asset values.
(2) Transactions of previous years: This is the usual way to build up an age profile, butit requires data for several earlier years to build up the opening position in the firstyear of the series. Moreover, there may be breaks in the series, eg due to majoracquisitions or disposals, which make a "continuous inventory" of assets difficult tomeasure without further details. However, this method has some possibleapplications, eg in the Turkish case, if we can assume that 1982 assets are all in1982 prices, we can date subsequent changes approximately by changes in balancesheet figures (but not precisely, because there are problems to do with writing backdepreciation of assets disposed of). Equally, we have to deal with non-depreciatingfixed assets, such as investments in other companies (this is important in countrieslike Turkey where systematic consolidation of subsidiaries is not general practice),and these might best be dealt with by this method: we have no depreciation chargeand the assets are often acquired in a lumpy way (a big investment to acquire a newcompany) rather than at a steady state.
(3) Inference from depreciation rates: This is crude but possible if we can make a fewassumptions. These are, that we know the pattern of depreciation, that we canignore scrap values (or non depreciating components, such as the land element ofpremises), and that we can assume a steady acquisition pattern of the assets. This iselaborated below.
The simplest depreciation pattern, and probably the most common, is the straightline method:
where D is annual charge, C is cost of asset, S is expected scrap value, and n islength of life of asset. If we can ignore S, this reduces to D = C/n. Accounts showus gross (undepreciated) cost, C and annual charge for depreciation, D. We can thus
D = C-Sn

11
infer that n = C/D. This will tend to be an over-estimate because S will be positive,and sometimes large.
Having estimated n, the average length of life of the assets, we can also estimate theaverage age of the assets, by looking at the accumulated depreciation figure D, inthe balance sheet. The ratio D/C shows us the proportion of the assets which hasbeen written off, at balance sheet date. If we can, once again, ignore scrap values,this shows us the proportion of the assets' life which has expired. (Scrap values willtend to cause us to under-estimate the proportion expired). Thus, the proportionunexpired is
1 - DC
� � 1and the amount of life unexpired is n 1 - DC
� � 2 which we estimate
as C 1 - D
CC - D
D =
D� �
� 3
(Note that we assume S to be zero. Positive S results in an upward bias in theestimate of unexpired life).
The proportion of life expired is D/C, the total life is C/D and the amount of life
expired is n( D/C) which we can calculate as CD
D D� �
�
C =
D4
Note that S does not appear (implicitly or explicitly) in this calculation, so that nobias is present. There is, however, a possible error if some assets do not have adepreciation charge: they will, if aggregated with depreciating assets, be assignedthe same age as the depreciating assets, but there is no evidence to support this(although it may seem to be plausible). There is also a potential bias if firms usedthe reducing balance rather than the straight line method of depreciation (both beingpermissable in Turkey, to which we apply our method). If reducing balance is used,we will over-estimate the average age of assets.
Thus, if our assumptions are valid, we can estimate average life and average age ofthe assets. We then need to consider the age profile of the assets. It would be mostsimple to assume that they were all acquired at the same time, ie all were of theaverage age. This does not allow for the fact that similar average ages may beassociated with different profiles of individual ages which should ideally requiredifferent price adjustments when prices have changed at different rates overdifferent periods. However, since we are intent on simplicity and feasibility, ourcalculation is based on average life, with no sophisticated adjustments, ie we takethe ratio of accumulated depreciation in the balance sheet ( D) to the currentdepreciation charge in the profit and loss account (D) as indicating average age ofassets in years, and apply the change in the general price level index over that periodto adjust C, D and D to current prices.

12
The algorithm used to implement this approach is summarised below.
(v) Basic algorithm for CPP re-statement in year-end monetary units using the Brazilian method
(1) Date fixed assets
(a) If there has been a major revaluation in the year, assume assets are already inyear-end monetary units. Therefore, proceed direct to (3) below.Otherwise do re-statement on estimated age.
(b) Estimated age is Dt+1
t+1D5
where D t+1 is accumulated depreciation from closing Balance Sheet.D t+1 is depreciation charge in Profit and Loss Account, for theperiod ending at t+1
(2) Up-date fixed asset values
Assume all fixed assets are of average age.Thus, the re-stated amount is N(l+I) t+1, where N is the current net (post-depreciation) carrying amount of fixed non-monetary assets and I t+1 is theproportionate increase in the chosen general price index during the period sinceacquisition.
The revised fixed asset values will be substituted for the original values, increasingtotal assets by N.I t+1 This will be compensated by a similar increase in shareholders'net worth. If a revaluation reserve is recorded, N.I t+1 should be reduced by thisamount, subject to N.I t+1 never being negative. The Balance Sheet is now re-statedin constant (end of year) monetary units. Note that current non-monetary assetssuch as stocks, which are not held throughout the accounting year, are not re-stated,on the ground that their carrying values are not very old: strictly, they should be re-valued but the relevant dates are unknown and the errors are less material than in thecase of fixed assets which are held over several periods.
(3) Calculate profit and loss adjustment
Using the re-stated closing balance sheet figures from (2) above, calculate:
where N is non-monetary fixed assets and E is shareholders' net worth, bothmeasured from the closing balance sheet and i is the rate of inflation for the year. This adjustment should be added to (if positive) or subtracted from (if negative) theprofit for the year attributable to ordinary shareholders, ie post-interest deduction
( ) N - E 1 - 1(1+ i )t+1 t+1
t+1
� �
13
profit. It can be regarded as an adjustment of the net interest figure, ie if positive itis a reduction of net interest paid attributable to the gain on net borrowing.
3. ADJUSTING THE ACCOUNTS OF TURKISH COMPANIES FOR INFLATION
We now turn to the specific case of Turkey. The Turkish economy had an average annual rate ofinflation of 38 per cent per annum over the period 1982-87, which was covered by the originalstudy by Singh and Hamid(1992). This was the highest rate of inflation of the nine countriesexamined, with the exception of Mexico (Singh and Hamid, Table III.9) which did have a form ofinflation adjustment in its company accounts. The analysis of Turkey in Singh (1995) covered alonger period (1982-90) and it also included more corporations - a total of 45. The latter numberrepresented all the companies which were quoted throughout the reference period. For this longerperiod also, Turkey had the highest average rate of inflation (49% p.a.) of all the ten countries - inthe larger Singh (1995) sample - except Mexico and Brazil. Both of the latter two countries hadinflation adjusted accounts, although the method of adjustment is rather different in each case.8
It is notable that both in Singh and Hamid (1992) and Singh(1995) the Turkish companies had byfar the highest average accounting rates of return (in excess of 30 per cent per annum). It seemslikely that this reflects the impact of inflation on historical cost accounts. Thus, Turkey is theobvious test case to use in order to investigate whether the Singh and Hamid results were affectedby measurement bias due to inflation.
(i) Data
The data used in this paper are essentially those analysed in Singh(1995), enhanced asfollows. The detail available in the original data was improved by the addition ofinformation obtained from the published balance sheets of Turkish companies.9 Inparticular, this was helpful in providing figures for accumulated depreciation, which wasrequired for the estimation of asset age (discussed further below). However, this furtherinformation was available only for 37 of the 45 companies in the Singh (1995) sample.
(ii) Application of the Brazilian method of adjustment
The"Brazilian method" algorithm described in (2)(iv) above was used as the framework foradjusting the Turkish accounts, but even that highly simplified method could not be appliedwithout difficulty. The reason for this was that the annual depreciation charge was notreported before 1988, when the level of disclosure in Turkish accounts was improved. Another complication, but one which helped rather than hindered the adjustment process,was the occurrence of revaluations in company accounts: there was a general revaluation in1982, applying to all companies, and occasional revaluations in individual companies in
8Essentially, Mexico used a variant of Current Cost Accounting and Brazil the CPP method of inflation adjustment.
9We are grateful to Selim Soudemir of the Capital Markets Research Board, Ankara for providing copies of these.

14
subsequent years. Revaluations lead to asset values being re-stated in current purchasingpower units, so that stages (1) and (2) of the adjustment algorithm are unnecessary.
A series of rules was devised in order to estimate re-stated fixed assets from the informationavailable. These were based on three principles:
(1) In a year in which fixed assets were revalued (ie 1982 for all companies, andsubsequent years for a sub-set of companies) no re-statement is required.
(2) For 1988-90, in which full depreciation information is available, in the absence ofrevaluation, re-statement of fixed assets is required and should be done using stages(1) and (2) of the algorithm.
(3) For the years 1982-87, in which depreciation charges are unknown, stage (1) of thealgorithm (dating of fixed assets) cannot be implemented. Thus, when re-statementis required (because there has not been a revaluation) estimate the age by linearinterpolation between 1982 (when the age can be regarded as zero, for valuationpurposes, because of the universal revaluation) and 1988 (when the age can beestimated using stage (1) of the algorithm). For years in this period which arebounded by revaluations (such as 1983 if there was a specific revaluation in 1984, inaddition to the general revaluation in 1982), age of assets could not be inferred usingthe above method, and an alternative approach (the "Net Asset Rule") was used. This indexed the earlier revaluation forward, and proved to be robust when subjectto a sensitivity test.10
4. THE EFFECTS OF INFLATION ADJUSTMENT ON THE VARIABLES IN THETWO STUDIES
(i) Inflation adjustment of the ratios
The Brazilian method of adjustment, as described above, gives us an estimate of theinflation-adjusted value of these assets at the end of a year (step (2) of the algorithm in 2(iv)) and the profit for the year. These measures are expressed in current purchasing powerunits as at the end of the particular year. Thus for the purpose of summing or comparingaccounting numbers over a period, we need to inflate all numbers to end-of-periodmeasurement units by applying the index (l+i)t , which is the change in price between theyear t (to which the particular accounting numbers relate) and the end of the period (atwhich the current purchasing power unit is measured).
10This rule is described in a working paper by Victoria Saporta (1995), who carried out all of the computational work described in the
present paper.
15
The detailed implications for each of the variables in the two studies (see Appendix E inSingh (1995) and Appendix D in Singh and Hamid(1992)) are explained in the Appendix tothis paper.
(ii) Testing the plausibility of the results
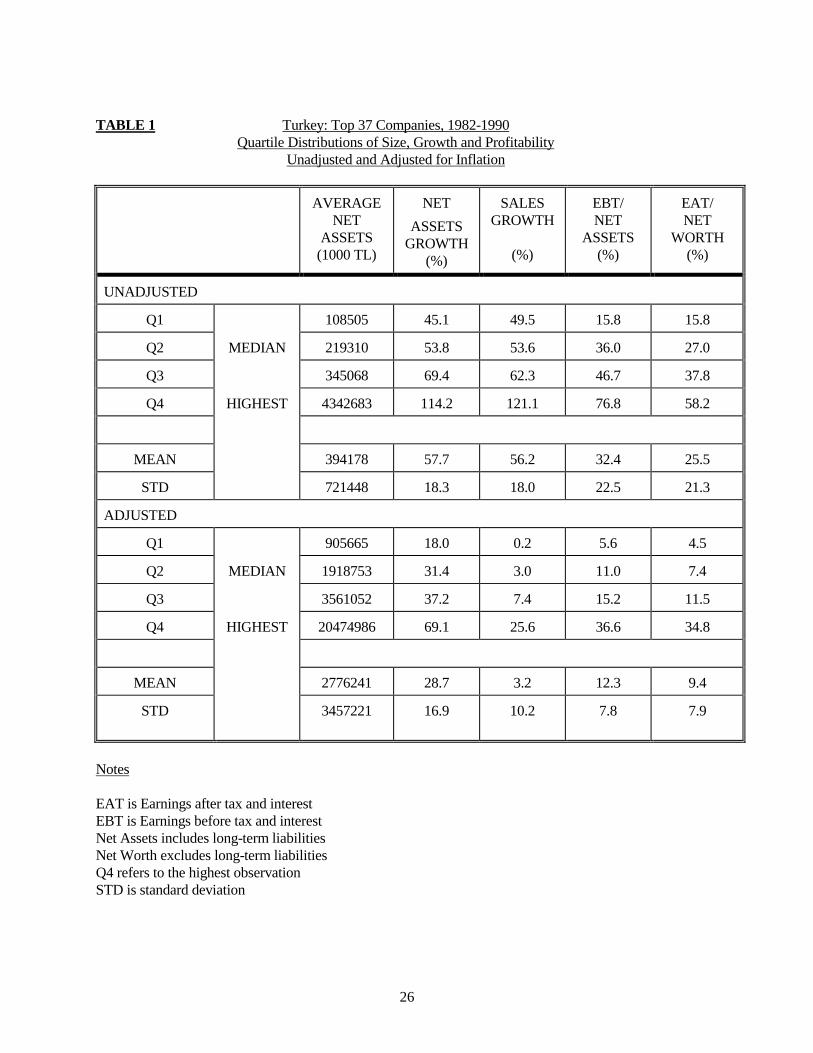
Table 1 reports results for size, rates of return and growth rates for Turkish companies onboth the unadjusted and the adjusted basis. These are used to test the plausibility of theresults of applying the Brazilian method of inflation adjustment. In Table 2 these results arecompared with the corresponding unadjusted figures for all the ten countries in Singh(1995). As already noted, and as is evident in Table 2, Turkey had the highest (in nominalaccounting terms, unadjusted for inflation) corporate rates of return - either in pre- or post-tax terms. One would normally expect the real rates of return for Turkish firms, adjusted forinflation, to be lower than the corresponding unadjusted rates reported in Tables 1 and 2. [There is a slight difference in the "unadjusted" figures reported in the two Tables - thisarises from the fact that the sample size in Table 1 is 37 and in Table 2 is 45].
This expectation is confirmed by the figures for real rates of return in Table 1. The averagepre-tax rate of return on net assets was 32.4 per cent per annum before adjustment forinflation and 12.3 per cent after adjustment. The post-tax (and interest) return on net worth(ie shareholders' funds) fell from 25.5 per cent unadjusted to 9.4 per cent when adjusted forinflation. These are not only changes in the right direction (the rate of return being lowerpost-adjustment), but they are of a plausible order of magnitude. In terms of the pre-taxreturn on net assets, the adjustment for inflation places Turkey (12.3%) slightly below theaverage (13.8%) of the 10 countries in the Singh (1995) sample (see Table 2). Similarly,with respect to the post-tax return on net worth, inflation adjustment reduces Turkey frombeing at the top of the list to below average of the sample countries. Bearing in mind thefact that all of these countries experienced some degree of inflation, and only two hadinflation-adjusted accounts, this result is consistent with our inflation adjustment for thesevariables being of the right order of magnitude, although a further test, reported below,suggests that our inflation adjustment of net assets may be unreliable. In comparative termsthis may not be particularly important, since inflation adjustments in other countries will besimilarly inadequate: Brazil uses a similar method to ours, and countries with low inflationmake no adjustment at all and thus experience understatement of fixed assets when there isinflation.
A further test of our adjustment method is provided by the growth measures. The Growthof Net Assets has a mean of 57.7% p.a. and a median of 53.8% p.a. in its unadjusted form,and this high level is presumably due in part to inflation: sustained real growth of thismagnitude is implausible. The inflation-adjusted measure is lower, with a mean of 28.7%p.a. and a median of 31.4% p.a.: these are still high for real growth rates and although theadjustment is in the right direction, this suggests that it may not have removed the effects ofinflation accurately, for the purposes of comparing opening net assets with closing netassets. A rough test of this view is provided by looking at Sales Growth. We would expectsales to grow roughly in line with assets and sales is a much simpler variable to adjust forinflation, because it is measured in currency units of the year in which it occurred. Table 1

16
shows that Sales Growth in its unadjusted form (including inflation) was in fact very closeto (unadjusted) Net Asset Growth, with a mean of 56.2% p.a. and a median of 53.6% p.a. Inflation adjustment lowers Sales Growth below Net Asset Growth, with a mean of 3.2%p.a. and a median of 3.0% p.a. These are more plausible real growth rates and suggest thatour adjustment method failed to eliminate all of the inflation included in Net Asset Growth. This may be due to two factors. First, we relied on the 1982 revaluation: if (as seemslikely) this did not apply to all assets, then our adjusted opening net asset estimate may beunder-stated relative to closing net assets, thus over-stating growth. Second, our closing netasset values relied on estimates of asset age which assumed straight-line depreciation. Thiswould over-estimate asset age, and therefore the re-statement for inflation, in thosecompanies which used reducing balance depreciation. The resulting over-statement ofclosing net assets together with the under-statement of opening net assets would biasupwards our estimate of net asset growth. The two errors would tend to cancel out in ourestimate of average net assets, which is the denominator of the rate of return. This mayexplain why our re-stated rate of return is more plausible than the re-stated growth of netassets.
Thus, our inflation adjustment clearly operates in the right direction although, as might beexpected from the strong assumptions on which it is based, it is less than perfect,particularly when comparing individual years. The extent of the adjustment is very large. This is indicated by the Average Net Assets figure, which has a mean of 394,178,000 TLunadjusted and 2,776,241,000 TL adjusted: a more than seven-fold increase.
(iii) Testing for bias in the main results of Singh (1995)
Having tested our adjustment and found it to be reasonably robust, we now turn to thecentral purpose of the exercise: to assess whether the surprising results of Singh and Hamid(1992) and Singh (1995) with respect to the financing of corporate growth still hold whenwe attempt to remove the measurement errors caused by inflation. We will confine ourattention to Singh (1995) as it is much the more comprehensive of the two studies. It coversa later and longer time period, normally from the early 1980s to 1990; it is also based onmuch larger samples - normally the 100 largest quoted manufacturing companies in each ofthe countries.11
The Singh (1995) results in Table 3 indicate that in five out of the ten sample countries(Mexico, South Korea, Thailand, Turkey and Malaysia), more than 70% of the growth ofcorporate net assets during the past decade was financed from external funds. In anotherthree (India, Brazil and Zimbabwe), the external financing proportion was more than 40%. Similarly, the importance of equity financing for the developing country corporations inSingh's study is indicated by the fact that in six of the nine sample countries for whichrelevant data was available (Korea, Mexico, Turkey, Malaysia, Zimbabwe and Brazil), morethan 35% of the growth of net assets in the 1980s was financed by new share issues. Theseresults may be contrasted with the widely accepted stylised facts about the financing of
11For some countries there are less than 100 companies in the sample, as for example in the case of Turkey. The total number of Turkish
companies quoted on the stockmarket throughout the period 1982-1990 was only 45. All of these are included in the Turkish sample.

17
corporate investment in advanced countries. Corbett and Jenkinson's (1994) research forGermany, Japan, UK and the USA, showed that in line with the "pecking order" model,corporations in these countries financed their investment needs overwhelmingly frominternal sources, followed by bank finance and relied on the stockmarket for new equity andbonds only to a very small extent.12
Hence the significance of the question as to whether the theoretically anomalous results fordeveloping country corporations reported above, could have arisen from measurementbiases caused by the use of historic cost accounting data. Table 4 provides an answer to thisquestion with respect to Turkey. Adjustment for inflation reinforces the Singh and Hamidconclusions and in no way undermines them. Adjusted figures show internal finance to beeven less important and external equity finance correspondingly more important as a sourceof funds for corporate growth, than suggested by the unadjusted data. The adjusted dataconfirm that most companies distributed the greater proportion of their post-tax profits, andthat external finance was the main source of growth.
Table 4 indicates that with inflation adjustment, 86.4% of Turkish corporate growthbetween 1982 and 1990 was accounted for by new share issues. This adjusted figure placesTurkey at the top of the list for equity financing in Singh(1995) sample of ten countries - afull 20 percentage points higher than Mexico, the next highest country on the list. Thisraises the question whether such a high degree of equity financing for the large Turkishcorporations is plausible? There are two main reasons for thinking that there is anaffirmative answer to this question. First the Turkish stockmarket has behaved erratically inthe reference period. The primary market boomed in the early 1980s following financialliberalization and the consequent steep rise in interest rates. Subsequently, in the wake ofthe financial crisis arising from the bankruptcy of leading finance houses in 1982/83, boththe primary and secondary markets remained flat during the mid-1980s.13 The market againboomed towards the end of the decade. The share price index rose from 171 in 1986 to 314in 1988, to 2218 in 1989 and to 3256 in 1990.14 The price-earnings ratio went up from 2 in1988 to 16.5 in 1989 and to 13.2 in 1990 (IFC (1996)). New share floatations on thestockmarket in 1990 amounted to 1% of GDP, a far higher level than in the mid-1980s. Although this aggregate figure is small by standards of other leading emerging markets,15 itis more than likely that much of this new equity investment was carried out by the smallnumber of very large quoted firms in the Turkish sample.
Secondly, it is important to appreciate that the Turkish real rate of corporate growth duringthe 1980s was most likely quite low. The inflation-adjusted average rate of growth of sales
12The Corbett and Jenkinson results are not based on corporate accounts but on the flow-of-funds data. Therefore, their conclusions are
not strictly comparable with those of the Singh and Hamid studies. For a fuller discussion of this issue, see Singh (1995).
13For a fuller analysis of the financial events of the period and its impact on the Turkish financial system, see Akuyz (1989).
14Turkey experienced very high rates of inflation during this period. Consumer prices rose by 34.6% in 1986, 38.8% in 1987, 73.7% in1988, 63.3% in 1989 and 60.3% in 1990. The rise in share prices clearly greatly exceeded the rise in general level of prices between 1986-1990.
15See further Mullins (1993) and UNCTAD (1993).

18
- which, for reasons mentioned earlier, is a better proxy for real corporate growth than theadjusted figures for net asset growth - of the Turkish companies in the reference period wasonly 3.2% p.a. It is also likely that much of this growth occurred in 1990, the year whenreal GDP increased by nearly 10%. It is therefore possible that the giant Turkish companiesfinanced much of the greater part of this small overall growth during the reference period byequity issues, most of which are likely to have been carried out either at the beginning ortowards the end of the period.
Nevertheless, despite being exonerated from the inflation accounting bias, as well as beingplausible in principle for the specific time period and the sample of corporations studied, itis still possible that the very high Turkish figures for external and equity financing areoverstated due to the second measurement bias. This was referred to in the Introduction - itarises from the use of the indirect method of estimating the contribution of equity in Singhand Hamid (1992) and Singh (1995). This issue will be taken up in Section 5 below.
Table 5 provides unadjusted as well as adjusted figures for Turkish corporations withrespect to the stock and flow indicators of "gearing". Both the stock indicators (the longterm debt to net assets ratio, and the long term debt to equity ratio) fall substantially as aresult of the adjustment for inflation. This adjustment is again in the right direction,showing lower gearing because net assets are higher after inflation adjustment, and acomparison with Table C6 in Singh (1995) shows that the adjusted Turkish figures are verymuch within the plausible range. The Turkish corporations' adjusted debt to net assets ratioaveraged 9.7, this may be compared with the Singh (1995) figures of 10 for Brazil, 12.9 forMexico, 15.0 for Malaysia, 12.3 for Zimbabwe and 13.9 for Jordan.
The figures for the adjusted Turkish debt equity ratios tell a similar story when these arecompared with the comparative data for other countries in Singh (1995). The same holdsfor the flow measures of gearing, although the adjustment for these indicators is not as largeas that for the stock measures.
Table 6 reports in an abbreviated form, adjusted figures for the PE ratio and dividend return. The unadjusted mean value of the PE ratio is 3.67 and the adjusted mean is a little lower at2.68. However, a simple inspection of the data indicates that the distribution of PE ratios ishighly positively skewed and the mean value is greatly affected by a few extremeobservations. The median unadjusted and adjusted figures are both much lower - of theorder of 1.58 and 2.22 respectively.
It is interesting to observe that the inflation adjustment for the median PE ratio goes in theopposite direction to that of the mean ratio. As noted earlier, this is a priori perfectlypossible. Normally speaking, inflation adjustment should lower profits but in the case ofhighly geared companies it may raise profits due to the reduction in the real value of theinterest payments in inflationary conditions. In the present case, inflation adjustmentappears to have raised the profits of a few companies with exceptionally high PE ratios,resulting in the adjusted mean PE ratio being lower than the unadjusted ratio. Even afteradjustment, the PE ratios of these companies are relatively high, indicating that the markettakes a favourable view of their prospective earnings growth. This could be interpreted as

19
indicating market rationality: the companies concerned had high gearing and were thereforein a position to gain from continued inflation, which would erode the real burden of debt,and thus enhance real earnings. Inflation adjustment leads to a sharp fall in the averagevalue of the dividend return and brings the figure much more in line with those of othercountries reported in Singh (1995).
5. ANALYSIS OF THE MEASUREMENT BIAS IN THE EQUITY FINANCINGVARIABLE
As indicated in the Introduction, the striking results of the research by Singh and Hamid withrespect to the heavy reliance on equity funds by developing country corporations to finance growth,are subject to another potentially serious bias. The latter could arise from the fact that, the twostudies have used an indirect method of estimating the contribution of equity finance. Equityfinance has been measured as a residual from the accounting identity which makes the growth ofcorporate net assets equal to the growth of internal finance plus the growth of external finance; thelatter is decomposed into long-term liabilities and equity. The growth of internal finance wasmeasured by retained profits from the profits and loss accounts and the growth of long-termliabilities was proxied by the growth of long-term debt. The consequence of this residualestimation of the equity financing variable is that it is likely to have an upward bias due to the factthat (a) revaluations, and (b) some of the provisions for long-term liabilities other than long-termdebt, will get included in it.
To check the quantitative significance of this bias, we experimented with a more direct method ofmeasuring the equity finance variable for a subset of firms for three countries - Malaysia, Korea andTurkey. In this alternative method we have tried to measure equity finance independently, addedother long-term liabilities to long-term debt finance and made internal finance the residual. It willbe appreciated that direct information on the value of the new equity funds that a firm has raisedduring the course of the accounting year is not always available in company accounts. We thereforeestimated this variable by calculating the number of new shares issued during the year (other thanthose due to bonus issues). In the absence of the information on the exact dates and prices at whichthe shares were issued, the average of the highest and the lowest share price during the year wasused. The results of the exercises for the three countries are shown in tables 7 to 9.
Table 7 for Malaysia indicates that there was indeed some overstatement of the equity financingvariable but it was relatively small, 38.8% with the new method versus 46.6% in Singh(1995). Similarly, there was a relatively small understatement of the debt and the internal financingvariable. In view of the high standard deviation none of the differences are statistically significant. Even at 38.8% the contribution of equity to corporate growth for Malaysian companies is quite highas compared with what one might have expected a priori for a developing stock market.
Table 8 tells a broadly similar story with respect to Korea. However, Table 9 does show that in thecase of Turkey, the residual method of estimating the contribution of the equity financing variabledid have a large and statistically significant bias - the contribution of equity was only 37.4% on thealternative method versus 65.1% in Singh(1995). Nevertheless, as pointed out above, the figure of37.4% is still in economic terms a high figure for this variable for a country where the stockmarket

20
is not yet fully developed. So, if we crudely combine the results of the two exercises for Turkeycarried out in this and the previous sections we arrive at the following conclusion. The residualmethod of estimating the contribution of equity finance overstated the mean value of that variableby 26.3 (65.1%-37.4%) percentage points; non-adjustment of the historic cost accounting data forinflation on the other hand understated the average value of the variable by 21.5 (86.6%-65.1%)percentage points because growth due to retained profits was over-stated and the failure of ourmethod to eliminate entirely the inflationary effect of net asset growth probably means that the trueunder-statement was higher. All this suggests that even in the case of Turkey, which had one of thehighest rates of inflation among the sample countries and where government-sanctioned generalrevaluations were carried out by the corporate sector during the reference period, the two biasesbroadly speaking cancel each other out. This result is not surprising: the miss-classification ofincreases in revaluation reserves as external finance was probably a major component of the error inthe residual method of estimating the contribution of equity financing in Turkey, and a major effectof inflation adjustment is to eliminate from the estimate of growth that element of revaluationwhich is due merely to inflation. It lends confidence to the Singh and Hamid results as being moreor less accurate representations of the contributions of different sources of finance to corporategrowth.16
6. CONCLUSION
This study has examined two important possible sources of measurement bias in the Singh andHamid studies. The main conclusion is that these biases do not vitiate the surprising empiricalfindings of their research with respect to financing of corporate growth in developing countries. However, the present study has also put forward inter alia a parsimonious method of inflationaccounting and demonstrated how it can be used in the developing country context. The lattercontribution is therefore of interest in its own right.
16For an economic analysis of these anomalous findings for developing country corporations, see Singh (1994; 1997).

21
APPENDIX
The effects of inflation adjustment on the Singh and Hamid ratios
The ratios are defined in Singh and Hamid (1992), Appendix D. Below we give summarydefinitions (in brackets), explain the inflation adjustment, and, where appropriate, indicate thedirection of the adjustment.
1 Net Assets(Assets less current liabilities)For any particular year, re-statement in constant prices of that year involves adding theinflation adjustment applied to non-monetary fixed assets. Historical cost under-states NetAssets by this amount.
2 Aggregate Net Assets(over the period)This involves summing over years. Thus, for correct weighting, we not only have to applythe adjustment in 1 above, but we also need to adjust the individual year figures by (l+i) t,where the change in the price level between that year (t) and the end of the period. Otherwise, in a period of inflation, the early years will have insufficient weight.The new formula is:
½(Net Assets)p (l+i) p + ½ (Net Assets)m + m-1
t = p+1� 6 (Net Assets)t (l+i) t
where Net Assets include the fixed asset re-statement necessary to state them in consistentprices of year t, m is the final date and p is the opening date of the period. This adjustedmeasure of aggregate net assets divided by n-l will give us adjusted average net assets.
3 Opening Net AssetsAs in 1 above, the fixed asset adjustment must be made. Then, as in 2, a further generalinflation adjustment must be made for comparison with other years. Otherwise, openingassets would be under-stated relative to closing assets because of inflation.The new formula is (Net Assets) p (l+i) p.
4 Closing Net AssetsIf these are measured in the re-stated form, ie including fixed non-monetary asset re-statement, no further adjustment is necessary, as they are expressed at closing price levels ofthe period.
5 Net Assets GrowthThis should be based on Closing Net Assets as in 4 above and Opening Net Assets as in 3above. The effect of fixed asset re-statement is unclear, as it affects both the numerator andthe denominator in indeterminate ways. The effect of the general price level adjustment of

22
the opening figure (3 above) is to reduce growth rates in periods of inflation, relative tounadjusted measures.
6 Return on Net Assets(Pre-tax rate of return on net assets, averaged over the period)The denominator is 2 above. This is increased by inflation adjustment (assuming positiveinflation), relative to historical cost measures.
The numerator, Earnings Before Tax (EBT), requires two adjustments. First, the inflationadjustment for the year (based on indexing net assets, in the Brazilian method) is deductedfrom (or added to if N>E) each year's profit. Note that there is an inconsistency herebecause interest paid on long-term loans is not deducted from EBT. The monetaryadjustment applies strictly only to the post-tax rate of return on net worth (see below). Secondly, inter-year inflation must be allowed for by re-stating earlier years' profits in endof period prices:
m
t = p+1� 7 EBT t (1+i) t
This will compensate for the inflation weighting of the denominator, increasing the rate ofreturn. The post-tax Return on Net Worth is adjusted using the same principles as forReturn on Net Assets. As noted above, this measure avoids the inconsistency which arisesin the treatment of the gain on borrowing when we apply the Brazilian method to the Rateof Return on Net Assets.
7 Change in Rates of ReturnIf the two rates of return are for individual years, there is no need to translate both into endof period prices, provided we use the Brazilian method to produce inflation adjusted profitsand assets of the individual year: there is no point in multiplying both the numerator and thedenominator of the beginning return by the same factor (1+i) t In the present definition(Singh & Hamid) two years are averaged, but the weighting problem is unlikely to be soserious as to require further adjustment.
8 Retention Ratio(Retained profits after tax and dividends, EAT, divided by pre-tax profits, EBT)There are two adjustments here. Firstly, the "Brazilian" profit adjustment is applied to boththe numerator and the denominator. As with 6 above, there may be a problem because EBTis calculated before charging interest: the gain on borrowing is strictly a deduction from theinterest charge and should not be included in profits before interest deduction.
The second adjustment is to adjust the weighting for price changes between years:

23
m
t = p+1 8 (EAT-DIV) t (1+i) t
m
t = p+1� 9 (EBT) t (1+i) t
Similar adjustments are made to the post-tax measure used in Singh (1995) and reported inTable 3: this substitutes EAT for EBT in the denominator.
9 Internal Finance of Growth(Proportion of Growth of Net Assets funded by retained profits)The numerator is adjusted as in the numerator of 8 above, to give a constant price measureof retentions.
The denominator is calculated by differencing closing and opening net assets, as measuredin 3 and 4 above. This should reduce (but not necessarily eliminate) the "revaluation bias",which under-states the internal financing proportion (by over-stating growth). Theelimination of the revaluation bias will be imperfect because of the approximate nature ofour adjustments, notably the use of a general price index (rather than specific prices of theassets held) and the very rough approximation used to estimate the age of the assets.
10 External Finance of Growth (long-term debt)(Proportion of Growth of Net Assets funded by long-term debt finance)The numerator can be found by differencing indexed opening liabilities (L p (1+i) p) andclosing liabilities L m.The denominator is as in 9 above.Clearly, the numerator will be lower under inflation adjustment, but so will be thedenominator. Hence, the direction is not determinate.External Finance of Growth (Equity) is derived from the previous two measures and reflectsthe adjustments to them.
11 Capital Gearing(Proportion of Net Assets or Net Worth financed by long-term debt)The denominator should be re-stated in constant prices of the year as in 1 above. Thenumerator and denominator are indexed by inflation to correct the weighting. If this werecalculated by averaging annual figures, indexation would cancel out and be unnecessary, butit is calculated by summation over the years, before division.
12 Income Gearing(Ratio of interest payments to earnings before tax, EBT)

24
The denominator is the EBT measure, after inflation adjustment, used in the Rate of Returnon Net Assets, measure 6. In the case of the second income gearing measure, thedepreciation charge is added back, and this has been increased in the same proportion as theasset values are increased when they are re-stated in constant currency units of the year.Finally both numerator and denominator are converted to end of period currency units bymultiplying each year's observation by (1+i) t.
13 Price-Earnings Ratio(Ratio of market value of shares to after-tax earnings)The denominator is earnings after charging interest. Hence the full Brazilian incomeadjustment for monetary gains or losses must be added to or subtracted from the earnings ofeach year.Finally, both the numerator and the denominator are translated into end-of-period currencyunits by multiplying each year's observation by (1+i) t. This corrects the weighting problemcaused by summing across years before calculating the ratio.
14 Valuation Ratio(Ratio of market value of shares to book value of net worth)Net Worth must be re-stated in end of year currency units, as for the Capital Gearingmeasure.Both numerator and denominator are then re-stated in end-of-period currency units by theusual (1+i) t adjustment.
15 Dividend Return(Ratio of dividends to Net Worth)The denominator is adjusted to end-of-period prices for the denominator of Net Worth. Thenumerator is adjusted by the usual (1+i) t multiplier to be
m
t = p+1� 10(Dividends) t (1+i) t
26
TABLE 1 Turkey: Top 37 Companies, 1982-1990Quartile Distributions of Size, Growth and Profitability
Unadjusted and Adjusted for Inflation
AVERAGENET
ASSETS(1000 TL)
NETASSETS
GROWTH(%)
SALESGROWTH
(%)
EBT/NET
ASSETS(%)
EAT/NET
WORTH(%)
UNADJUSTED
Q1 108505 45.1 49.5 15.8 15.8
Q2 MEDIAN 219310 53.8 53.6 36.0 27.0
Q3 345068 69.4 62.3 46.7 37.8
Q4 HIGHEST 4342683 114.2 121.1 76.8 58.2
MEAN 394178 57.7 56.2 32.4 25.5
STD 721448 18.3 18.0 22.5 21.3
ADJUSTED
Q1 905665 18.0 0.2 5.6 4.5
Q2 MEDIAN 1918753 31.4 3.0 11.0 7.4
Q3 3561052 37.2 7.4 15.2 11.5
Q4 HIGHEST 20474986 69.1 25.6 36.6 34.8
MEAN 2776241 28.7 3.2 12.3 9.4
STD 3457221 16.9 10.2 7.8 7.9
Notes
EAT is Earnings after tax and interestEBT is Earnings before tax and interestNet Assets includes long-term liabilitiesNet Worth excludes long-term liabilitiesQ4 refers to the highest observationSTD is standard deviation

TABLE 2 All Ten Countries: Top Listed Companies In ManufacturingSize Growth1 And Profitability: Mean Values2
COUNTRY No.of Co's.(Period)
Rate ofInflation
(% p.a)
Real GDPGrowth
(% p.a)
Net AssetGrowth
(%)
SalesGrowth
(%)
RealSalesGrowth(%)
EBT/NETAssetsLT(%)
EAT/NETWorth(%)
KOREA
PAKISTAN
JORDAN
THAILAND
MEXICO
INDIA
TURKEY
MALAYSIA
ZIMBABWE
BRAZIL
ALL
F
Memorandum
TURKEY(Unadjusted)
TURKEY(Adjusted)
100(80-90)100(80-88)38(80-90)67(83-90)100(84-90)100(80-90)45(82-90)100(83-90)48(80-88)100(85-91)
37(82-90)
37(82-90)
6.1
6.6
7.3
3.2
67.6
8.1
49.0
1.9
13.6
na
na
na
49.0
49.0
9.1
6.5
1.4
8.7
1.5
5.4
5.2
6.4
3.2
na
na
na
5.2
5.2
17.6
15.0
8.3
23.4
63.8
20.9
56.3
13.5
11.9
3.9
23.1
144.72*
57.7
28.7
13.8
15.6
15.1
25.1
70.9
17.4
53.2
12.4
19.1
na
22.0
153.82*
56.2
7.7
9.0
7.8
21.9
3.3
9.3
4.2
10.5
5.5
-10.2
6.5
18.29
3.2
7.3
20.9
14.2
9.3
11.9
16.3
31.3
10.0
22.7
7.6
13.8
16.30*
32.4
12.3
8.9
20.4
11.5
20.8
8.8
15.8
24.5
5.3
17.2
5.5
12.8
16.95*
25.5
9.4
F -test for comparison of means across countries. '*' implies rejection of the null hypothesis of equality of means at the 5% level.
1 Annual rates of growth of net assets or sales from the beginning to the end of the period.2 Average over the whole period indicated in the second column.
Source: Singh (1995)

28
TABLE 3All Ten Countries: Top Listed Companies in Manufacturing
Financing of Corporate Growth: After Tax Retention Ratio,and Internal and External Finance of Growth: Mean Values
Country Retention Ratio(A.T.)(%)
Internal Finance
(%)
ExternalFinance Equity
(%)
ExternalFinance LTD
(%)
Korea
Pakistan
Jordan
Thailand
Mexico
India
Turkey
Malaysia
Zimbabwe
Brazil
All
F1
Memorandum
Turkey1
(unadjusted)
Turkey1
(adjusted)
60.7
64.5
48.8
49.4
na
65.7
36.3
50.9
64.0
94.0
62.2
58.06*
10.6
32.7
19.5
74.0
66.3
27.7
24.4
40.5
15.3
35.6
58.0
56.4
38.8
20.04*
17.3
12.4
49.6
1.7
22.1
na
66.6
19.6
65.1
46.6
38.8
36.0
39.3
31.43*
61.9
86.4
30.9
24.3
11.6
na
9.0
39.9
19.6
17.8
3.2
7.7
20.8
21.21*
21.2
0.6
F1 statistic for comparison of means across countries.* implies rejection of the null hypothesis of equality of means.1 See text.
Source: Singh (1995)

29
TABLE 4Turkey: Top 37 Companies, 1982-1990
Quartile Distributions of Indicators of Financing Corporate Growth:After Tax Retention Ratios, Internal and External Financing of Growth
Unadjusted and Adjusted Values
POST-TAXRETENTION
RATIO
(%)
INTERNAL FINANCE
(%)
EXTERNALFINANCEEQUITY
(%)
EXTERNALFINANCE
LONG-TERMDEBT
(%)
UNADJUSTED
Q1 21.5 11.0 50.5 10.2
Q2 MEDIAN 35.9 14.3 62.1 17.1
Q3 43.0 25.7 71.7 27.0
Q4 HIGHEST 73.5 40.6 90.5 53.5
MEAN 10.6 17.3 61.9 21.2
STD 107.3 10.3 14.4 14.0
ADJUSTED
Q1 15.7 2.3 82.6 1.4
Q2 MEDIAN 30.3 4.6 93.8 0.9
Q3 46.6 11.6 96.7 2.2
Q4 HIGHEST 120.4 125.6 104.9 9.0
MEAN 32.7 12.4 86.4 0.6
STD 35.8 23.8 23.1 4.0
Memorandum
SINGH (1995)*
MEAN 36.3 15.3 65.1 19.6STD 14.6 14.6 16.5 15.4
* The Singh (1995) results for Turkish corporations are based on the top 45 quoted companies for theperiod 1982-1990.

30
TABLE 5Turkey: Top 37 Companies, 1982-1990
Quartile Distributions of Indicators of Corporate Capital Structure:Stock and Flow Measures of Gearing
Unadjusted and Adjusted Values
LONG-TERMDEBT/
NET ASST(%)
LONG-TERMDEBT/
EQUITY(%)
INT/EBIT
(%)
UNADJUSTED
Q1 12.6 14.5 13.2
Q2 MEDIAN 20.3 26.1 32.9
Q3 29.0 40.8 65.1
Q4 HIGHEST 55.2 125.6 216.5
MEAN 22.8 34.7 44.6
STD 13.7 29.0 42.9
ADJUSTED
Q1 4.1 4.3 22.3
Q2 MEDIAN 7.6 8.2 28.9
Q3 12.1 14.1 60.4
Q4 HIGHEST 33.1 50.3 79.4
MEAN 9.7 11.8 37.7
STD 7.7 11.1 23.9
Memorandum
SINGH (1995)*
MEAN 23.1 34.6 47.8STD 13.5 28.8 55.5
* The Singh (1995) results for Turkish corporations are based on the top 45 quoted companiesfor the period 1982-1990.

31
TABLE 6
Turkey: Top 37 Companies 1982-1990P.E.Ratio And Dividend Return; Mean And Standard Deviation
*PE Ratio(%)
Dividend Return(%)
UNADJUSTED
MedianMean STD
ADJUSTED
MedianMean STD
Memorandum
Singh (1995)MedianMeanSTD
1.58 3.67 8.19
2.222.681.74
1.633.777.63
18.018.110.6
4.76.45.2
15.816.810.3
* The PE Ratios are based on only 31 observations. Six companies were omitted due to lack of share price data.

32
TABLE 7
Korea: Financing Of Corporate GrowthAlternative Methods: Mean Values*
No. of Co's. (Period)
Equity (%)
Debt (%)
Internal (%)
New method
Singh (1995)
30(1987-1990)
100(1980-1990)
41.0(32.1)
49.6 (18.7)
39.9 (69.9)
30.9 (22.0)
19.1 (76.1)
19.5 (20.4)
*Figures in brackets in the last three columns are standard deviations.

33
TABLE 8
Malaysia: Financing Of Corporate GrowthAlternative Methods: Mean Values*
No. of Co's. (Period)
Equity (%)
Debt (%)
Internal (%)
New method
Singh (1995)
42(1986-1990)
100(1983-1990)
38.8(53.0)
46.6 (42.0)
19.1 (40.6)
17.8 (25.9)
44.2 (64.5)
35.6 (41.8)
*Figures in brackets in the last three columns are standard deviations.

34
TABLE 9
Turkey: Financing Of Corporate GrowthAlternative Methods: Mean Values*
No. of Co's. (Period)
Equity (%)
Debt (%)
Internal (%)
New method+
Singh (1995)
35(1986-1990)
45(1982-1990)
37.4(28.9)
65.1 (16.5)
19.8 (14.8)
19.6 (15.4)
42.9 (36.7)
15.3 (14.6)
* Figures in brackets in the last three columns are standard deviations.
+ For comparability with the earlier study, the new method has been applied to growth of net assetsbefore adjusting for inflation.

36
REFERENCES
Akyuz, Y. (1989), Financial system and policies in Turkey in the 1980s, UNCTAD DiscussionPaper, No 25, February 1989.
Corbett, J. and Jenkinson, T. (1994), "The financing of industry, 1970-89: an internationalcomparison", Centre for Economic Policy Research Discussion Paper, No 948, May.
International Accounting Standards Committee (1989), IAS29 Accounting in Hyper-InflationaryEconomies, IASC, London.
International Financial Corporation (1996), Emerging Markets Factbook 1996, World Bank,Washington DC.
Martins, E. (1968), "Accounting and Changing Prices: Accounting for Inflation in a Hyper-Inflationary Economy", in Standard Setting for Financial Reporting, KPMG Peat Marwick, NewYork.
Mullins, J. (1993), "Emerging equity markets in the global economy", FRBNY Quarterly Review,Summer, (pp. 54-83).
Price Waterhouse (1996), IAS29 - Financial Reporting in Hyperinflationary Economies:Implementation Guide, Price Waterhouse, London.
Saporta, V. (1995), “Corporate Finance Structures in High Inflation Economies: The Case ofTurkey”, unpublished working paper.
Singh, A. (1994), "How do Large Corporations in Developing Countries Finance their Growth?”, inRichard O'Brien (ed.) The AMEX Bank Prize Essays: Finance and the International Economy 8,Oxford University Press, New York.
Singh, A. (1995), Corporate Financial Patterns in Industrialising Countries, IFC Technical Paper 2,Washington DC.
Singh, A. (1997) "Financial liberalisation, the stockmarket and economic development”, EconomicJournal, May.
Singh, A. and Hamid, J. (1992), Corporate Financial Structures in Developing Countries, IFCTechnical Paper 1, Washington DC.
UNCTAD (1993), Portfolio equity investment and new financing mechanisms: foreign portfolioequity investment in developing countries, current issues and prospects, Geneva.
Whittington, G. (1983), Inflation accounting, and introduction to the debate, Cambridge UniversityPress, Cambridge.