THE EFFECTS OF ENERGY PRICE SHOCKS ON GROWTH AND MACROECONOMIC
21
THE EFFECTS OF ENERGY PRICE SHOCKS ON GROWTH AND MACROECONOMIC STABILITY IN SELECTED ENERGY-IMPORTING CIS COUNTRIES 1 by Tatiana Lysenko (EBRD) and Lucio Vinhas de Souza (EC) Abstract After several years of low and stable prices for its gas exports to CIS countries, Russia has decided to review these arrangements and to significantly increase prices, bringing them closer to the levels applied to the EU. The steep increase in energy prices has significant economic implications for the importing countries. So far, the economic analysis has tended to adopt a country-specific focus. We adopt a cross- country perspective instead, comparing the macroeconomic effects of the energy-price shock on growth, macroeconomic stability, budget and balance of payments. The analysis shows that the expected negative effects associated with the gas price shock have not led to a GDP loss in any of the countries studied, mainly due to a combination of counterbalancing factors. However, some of these developments may raise concerns for the future. In particular the steep increase in private and quasi-private external debt observed over 2006 in most countries increases their vulnerability to future exogenous shocks, including further raises in energy prices. 1. Introduction Until recently, the economic performance of the energy-importing countries in the Western CIS (Belarus, Moldova and Ukraine) and Caucasus (Armenia and Georgia) has not been affected by the surge in the world energy prices observed since the start of the current energy price cycle in 1999 (chart 1). While there are many factors that explain this growth pattern (see Falcetti, Lysenko and Sanfey, 2006), one factor that has been less explored to date relates to the prevailing terms of trade in energy in the region. Indeed, resource-poor CIS countries have imported significant amounts of energy from their resource- rich CIS-neighbours, in particular from Russia, often at prices that have been fixed at below the world market levels. In particular, gas prices charged by Russia to the net energy importers in the Western CIS and Caucasus were far below those charged to Western Europe. 2 Recently, however, these energy trade arrangements began to be revised and all energy-importing countries of this region have been facing substantial increases in the prices for imported energy. 1 We thank the comments from Nico Beinema, Frank Øland. Hansen, José Leandro, Andreas Papadopoulos, Sirpa Tulla (all EC), and Alex Chirmiciu, Elisabetta Falcetti, Samuel Fankhauser, Franklin Steves and Anita Taci (all EBRD). 2 Unlike crude oil, where the availability of liquid markets means that there is a true world market price, albeit for the different types of crude, in the case of natural gas there is no such comparable world price. Prices are effectively regional, linked to the availability of a (often monopolistic) transport network, and defined as a (variable) mark-up on the production and transportation prices. Therefore, this paper avoids using the term “world prices” for natural gas. The increased amount of natural gas traded as LNG is supposed, at a certain point in the future, to enable the creation of a liquid market with a corresponding true “world price”.
Transcript of THE EFFECTS OF ENERGY PRICE SHOCKS ON GROWTH AND MACROECONOMIC

THE EFFECTS OF ENERGY PRICE SHOCKS ON GROWTH AND MACROECONOMIC STABILITY IN SELECTED ENERGY-IMPORTING CIS COUNTRIES1
by Tatiana Lysenko (EBRD) and Lucio Vinhas de Souza (EC)
Abstract After several years of low and stable prices for its gas exports to CIS countries, Russia has decided to review these arrangements and to significantly increase prices, bringing them closer to the levels applied to the EU. The steep increase in energy prices has significant economic implications for the importing countries. So far, the economic analysis has tended to adopt a country-specific focus. We adopt a cross-country perspective instead, comparing the macroeconomic effects of the energy-price shock on growth, macroeconomic stability, budget and balance of payments. The analysis shows that the expected negative effects associated with the gas price shock have not led to a GDP loss in any of the countries studied, mainly due to a combination of counterbalancing factors. However, some of these developments may raise concerns for the future. In particular the steep increase in private and quasi-private external debt observed over 2006 in most countries increases their vulnerability to future exogenous shocks, including further raises in energy prices.
1. Introduction
Until recently, the economic performance of the energy-importing countries in the Western CIS (Belarus, Moldova and Ukraine) and Caucasus (Armenia and Georgia) has not been affected by the surge in the world energy prices observed since the start of the current energy price cycle in 1999 (chart 1). While there are many factors that explain this growth pattern (see Falcetti, Lysenko and Sanfey, 2006), one factor that has been less explored to date relates to the prevailing terms of trade in energy in the region. Indeed, resource-poor CIS countries have imported significant amounts of energy from their resource-rich CIS-neighbours, in particular from Russia, often at prices that have been fixed at below the world market levels. In particular, gas prices charged by Russia to the net energy importers in the Western CIS and Caucasus were far below those charged to Western Europe.2 Recently, however, these energy trade arrangements began to be revised and all energy-importing countries of this region have been facing substantial increases in the prices for imported energy.
1 We thank the comments from Nico Beinema, Frank Øland. Hansen, José Leandro, Andreas Papadopoulos, Sirpa Tulla (all EC), and Alex Chirmiciu, Elisabetta Falcetti, Samuel Fankhauser, Franklin Steves and Anita Taci (all EBRD). 2 Unlike crude oil, where the availability of liquid markets means that there is a true world market price, albeit for the different types of crude, in the case of natural gas there is no such comparable world price. Prices are effectively regional, linked to the availability of a (often monopolistic) transport network, and defined as a (variable) mark-up on the production and transportation prices. Therefore, this paper avoids using the term “world prices” for natural gas. The increased amount of natural gas traded as LNG is supposed, at a certain point in the future, to enable the creation of a liquid market with a corresponding true “world price”.

Chart 1 - GDP growth and oil and gas prices
0
100
200
300
400
500
'89 '90 '91 '92 '93 '94 '95 '96 '97 '98 '99 '00 '01 '02 '03 '04 '05 '06
1989=100
0
20
40
60
80
100
120USD
Oil price (Brent, US$/barrel)
Gas price (Russian gas, German border, USD per tcm)
Average cumulative growth in Western CIS and Caucasus (right axes)Source: EBRD, IMF.
The convergence of domestic energy prices to international levels is expected to be beneficial for these countries in the long run, encouraging economic restructuring and a more efficient use of energy. However, in the short/medium run the adjustment costs of the increases in prices for imported energy (“energy price shocks”) can be quite significant, adversely affecting the economic performance of the net energy importers. The objective of the chapter is to assess the short/medium term impact of the energy price shocks on the macroeconomic performance of the energy-importing countries of the Western CIS and Caucasus.In 2006-2007, these countries were hit by the drastic increases in prices for gas imported from Russia. In April 2006, Armenia faced a doubling in the price for imported Russian gas, to USD 110 per thousand cubic metres (tcm). Georgia was hit with a 75% increase to USD 110/tcm in January 2006 and a further 114% increase to USD 235/tcm in 2007. The prices for imported gas for Moldova were raised three times during 2006-2007, and are currently more than double their end-2005 level. Ukraine experienced two major price increases - a 46% increase to USD 95/tcm on 1 January 2006, and a further 36% increase to USD 130 on 1 January 2007. In Belarus, which enjoyed a price of around USD 47/tcm - the lowest in the CIS until end-2006 - prices more than doubled in January 2007. Further increases are likely in some of the countries, given that prices for imported gas are still below those paid by EU countries.3 While there are a few studies on individual countries of the region that have addressed this issue, no study - to the best of our knowledge – has looked at the problem from a regional perspective. Such a regional approach makes sense, as this makes it possible, first, to review in a consistent fashion the different arrangements for energy imports that various CIS countries have had over the last decade; second, to develop a common comprehensive methodology for assessing the impact of energy price shocks in the countries of the region; and finally, to compare the policy responses and adjustment paths in the different countries. 3 The EU member states in the Baltics (Estonia, Latvia and Lithuania) also faced similar gas price increases: in Estonia, it increased from USD 80/tcm in 2005 to USD 110/tcm in 2006, and to USD 200 in 2007, while in Lithuania, from 1 January 2007 Gazprom raised the price to USD 210/tcm, from USD 156 in 2006. In Latvia, gas prices are still somewhat lower, but will increase further as of 2008.

This chapter is laid out as follows. Section 2 reviews the relations in the energy field between Russia and the CIS countries covered in the study. Section 3 estimates the potential vulnerability of the five net energy importers of the region to an energy price shock. It looks at two sources of vulnerability: dependence on imports to cover domestic energy needs and energy intensity. Section 4 describes the impact of energy price shocks on macroeconomic performance. It starts with a theoretical perspective, showing how the shock can propagate through the economy, and continues with an empirical assessment of its macroeconomic effects. First, it estimates the potential GDP losses based on the net imports model. It also investigates the impact on macroeconomic stability, and looks at the other developments in the external sector that mitigated or amplified the shock. Finally, it discusses the impact of energy price shocks on the fiscal position of the government (either through direct fiscal mechanisms or other quasi-fiscal means) and on inflation. This section is followed by a conclusion.
2. Energy relations between Russia and the CIS
Russia is the main exporter of gas and oil to the countries of the Western CIS and Caucasus. As a hold-out from the non-market arrangements that prevailed during the planned economy era, the gas prices charged by Russia to those countries in particular were far below the prices charged to Western Europe.4 Not only were those prices significantly below the ones charged to the EU countries (implying a significant economic loss to Russia, given the opportunity cost5), but in some cases the Russian gas may have been sold below cost-recovery (including transportation) costs, i.e. at a financial loss to the supplier. However, recently this has started to change, with some countries experiencing overnight increases of over 100% in prices for imported gas (chart 2).
Chart 2 - Gas prices in selected CIS studies
-45
5
55
105
155
205
255
305
'01 '02 '03 '04 '05 '06 '07
USD per tcm
German border price Armenia Georgia Moldova Ukraine Belarus
Source: National statistics, authors’ calculations.
4 This paper uses the price for Russian gas at the German border as a benchmark, recognising that it should be adjusted downwards to reflect the difference in transportation cost and market power of the transit countries. 5 A very rough calculation for 2005, using as a benchmark estimated “netbacks” from the German border price for the CIS countries covered in our study indicates that Russia had foregone almost USD 3.9 billion in export revenues in that year alone. This was a 140% increase over the roughly USD 1.6 billion foregone in 2004 (calculated using the same methodology). Such a significant increase in foregone revenue could partially explain the “robust” price negotiations of Gazprom in 2005-2006.

The under-pricing of energy imports, as well as involving actual financial and budgetary losses for the supplier country, also means efficiency losses for the receiving countries. Such artificially low prices have allowed the survival of loss-making, non-optimal economic activities that did not reflect the countries comparative advantage. The raising of energy prices towards international levels is therefore likely to be associated with significant efficiency gains for these countries in the long run. Nevertheless, this in no way excludes the possibility of short-term adjustments which can sometimes be significant and painful. 2.1 Country studies: gas price increases in Armenia, Belarus, Georgia, Moldova and the Ukraine The countries covered in our sample are essentially dependent on Russia in terms of gas imports. In practical terms, this means that they are dependent on a quasi-monopolistic and state-controlled company, Gazprom (see Vinhas de Souza, 2006b). The recent developments in Russia's energy trade arrangements with Armenia, Belarus, Georgia, Moldova and Ukraine are described below. Armenia The price of natural gas received by Armenia from Russia doubled to USD 110 per tcm from 1 April 2006. Armenia concluded an agreement with Gazprom to temporarily maintain this still relatively low price for natural gas in exchange for the transfer of ownership of parts of the country's energy infrastructure. Under this deal the delivery price and terms will remain unchanged until 1 January 2009. The assets transferred from Armenian to Russian control include a thermal power plant and, reportedly, part of the new gas pipeline to Iran (Gazprom, through a joint venture, was granted the concession to build a larger, second pipeline along this route as part of the agreement). Other thermal power plants were transferred to Russia’s United Energy System (RAO-UES) in 2002-2003, as part of the debt-for-assets deal that settled Armenia’s USD 96 million debt to Russia. Gazprom is also expected to increase its share in the Armenian gas transport company ArmRosGazprom from the current 45% to 58% (a further 10% is already owned by Itera, a Russian energy trading company which is active throughout the former Soviet Union and has ties to Gazprom). Therefore, nearly Armenia’s entire energy infrastructure is now controlled by Russian companies. Belarus: In December 2006, Gazprom indicated that it would stop gas supplies via Belarus (the second most important transit country to EU markets, responsible for around 15% of Russian deliveries to the EU), unless a substantial increase in the price paid (the very low USD 46.7 per tcm) and a joint venture with BelTransGaz, the Belarusian state-owned gas transmission company, was agreed. An agreement was reached just before the deadline of 31 December 2006, avoiding the suspension of gas supplies. The new agreement covers the period 2007-2011. The gas price for 2007 is USD 100 per tcm. From 2008, this price will be linked to the prices charged to the EU, minus transportation costs. It will be 67% of this price in 2008, 80% in 2009, 90% in 2010 and 100% in 2011.

Transit fees for 2007 were set at USD 1.45, up from USD 0.75 per tcm per 100 km in 2006. Gazprom also agreed on a price of USD 2.5 billion for a 50% stake in a joint venture with BelTransGaz, to be paid in instalments over the next four years.6 Georgia Russia was Georgia’s main gas supplier until 2006. In December 2006, the prices for Russian gas imports more than doubled from USD 110 to USD 235 per tcm. However, the new South Caucasus (Baku-Tbilisi-Erzerum) gas pipeline will enable Georgia to diversify its gas supply: Georgia is expected to receive 250 million cubic metres (m.c.m.) from Azerbaijan through this pipeline in 2007. There is an agreement to increase this amount by 100 m.c.m. per year thereafter. This is likely to lower the average price for Georgian gas imports. Although there is little official information on Georgia's arrangements with its alternative suppliers, Azerbaijan and Turkey for 2007, it is known that since the beginning of 2007 Georgia has been receiving Azeri gas through an older pipeline, reportedly for about USD 120 (as of March 2007, Azeri gas accounted for about 50% of total imports, according to the Georgian Minister of Energy), and Turkey's gas may also play a role, if an agreement to sell part of one of its pipeline quotas is reached. Moldova: The gas sector in Moldova is controlled by Moldovagaz, 51% of which was transferred to Gazprom in return for the cancellation of arrears due by the company (i.e. ultimately, the Moldovan Government) to Gazprom. Gazprom requested a two-fold price increase as of 1 January 2006, and after extensive negotiations with the Moldovan government, the import price for gas was settled at USD 110/tcm for the first half of 2006. During the second half of that year, prices were again raised to USD 160/tcm (average prices for 2006 were around USD 135). A transit fee of USD 2.5/tcm was charged for transit services provided to Gazprom by Moldovagaz. In December 2006, Gazprom and Moldovagaz signed a five-year agreement on gas deliveries to Moldova, valid until 2011. Under this agreement, Gazprom raised the price to USD 170 per tcm. For 2007 the contracted volume remains roughly constant at the 2006 level of 2.5 bcm (total imports in 2006 were 2.3 bcm, of which around 0.9 bcm were used by the break-away region of Transnistria, with the result that only around 1.4 bcm is used by Moldova proper). The transit tariff for Russian gas exports via Moldova remains unchanged. Moldova transits on average 20 to 22 bcm of Russian gas annually to Balkan countries (mainly to Romania, an EU member state). Mirroring the situation in Belarus, this five-year agreement with Gazprom also stipulates a gradual raising of the price to a “European average price” minus transportation costs. Under this agreement, Gazprom will charge Moldova 75% of that price in 2008, 85% in 2009, 90% in 2010, and 100% in 2011. As part of the agreement, Moldova also
6 Not only did Belarus receive natural gas from Russia at well below the Western European rates; it also benefited from very specific arrangements in the oil trade. Belarus imported crude oil from Russia free of export duties, and exported refined oil products primarily to Western Europe at a large mark-up. According to the terms of a 1995 Treaty, Belarus and Russia were supposed to unify export duties on oil and refined oil products and to share Belarus’ export duty revenues: 15% to Belarus and 85% to Russia. However, Belarus charged lower export duties on exports of oil and refined oil products, violating the agreement. Moreover, Belarus did not transfer the corresponding revenue to the Russian budget, in spite of several complaints by the Russian government through the years: in 2005-2006, revenue foregone for Russia is estimated at over USD 1 billion per year. This situation generated substantial profits for some Russian companies who transferred their refining operations to Belarus, and boosted Belarusian exports and fiscal revenues. In December 2006, shortly before gas prices were increased, this “off-shore” tax avoidance scheme with oil duties was ended by Russia. Tensions between the countries escalated in January 2007, and the standoff was only resolved on 12 January 2007.

transferred the ownership of its domestic gas distribution networks to Gazprom, as a way to further reduce the remaining accumulated arrears. Ukraine In December 2005/January 2006, a very heated dispute arose between Russia and Ukraine concerning a request by Gazprom to increase the gas price charged to Ukraine, from USD 50 per tcm to USD 230 in January 2006. Ukraine is the major transit country for Russian gas to its EU markets, and is responsible for about 80% of total deliveries (Ukraine transited about 115 bcm of gas until 2005, and received about 25 bcm worth of gas as a barter payment for that transit. The transit fee paid to Ukraine was USD 1.09 per tcm/100 km; by comparison, the EU transit fee was USD 2.6 per tcm/100 km in 2005). Ukraine rejected Gazprom’s offer, leading to the suspension of Russian gas deliveries to Ukraine on 1 January 2006. This briefly affected some EU markets, as Ukraine sought to compensate for the reduction in Russian deliveries by siphoning-off gas destined for the EU. An agreement was reached on 4 January 2006. It is valid for five years, setting prices at an average of USD 95 (for a combined aggregate of Russian and Turkmen gas) for 2006. Ukrainian transit fees were also increased by 47%, to USD 1.6 per tcm/100 km. All gas is now traded on a cash basis and all gas imports into Ukraine are now done via a monopoly, RosUkrEnergo (a non-transparent company with headquarters in Switzerland). In late 2006, prices were increased again, to USD 130 per tcm. So far, Ukraine has resisted Gasprom's proposals for the transfer of ownership of its pipeline network.
3. Estimating energy dependency and vulnerability
The impact of the increases in prices for imported energy on a country’s economic performance depends both on the magnitude of the price shock and on a country’s “energy-import vulnerability”7, which can be estimated by the share of net energy imports in GDP. This is measured in real terms, as net energy imports in tonnes of oil equivalent per unit of GDP, rather than in the monetary value of imports divided by GDP. This ratio can be broken down into two terms:
(1) net energy imports/GDP = (net energy imports/total energy use)*(total energy use/GDP)
The first term indicates the extent to which a country relies on imports to meet its energy needs. The second term shows the energy intensity, or the amount of energy used to produce one unit of output. This breakdown provides useful insights into the sources of a country’s vulnerability to energy price shocks. The dependence on imported energy for the CIS countries is shown in Table 1.
Table 1 - Dependence on imported energy
2004, in thousand t.o.e. Armenia Belarus Georgia Moldova Ukraine
Production 746 3624 1287 84 76287
Imports 1480 36248 1647 3329 82172
Exports -98 -12880 -106 -38 -17873
Stock changes 0 -215 0 8 -254
Total Primary Energy Supply 2129 26776 2828 3384 140333
Share of net imports in TPES 65% 87% 54% 98% 46%
Source: IEA.. Note: Moldova includes Transnistria. 7 There is no generally accepted term for this indicator. The World Bank uses “vulnerability” (WB, 2005) while the IEA prefers “intensity” (IEA, 2006). In this paper, the term “vulnerability” is used.

Most countries are highly dependent on imports to cover domestic energy needs. This dependency ranges from 46% in Ukraine (which has domestic production of coal, oil and gas, plus hydroelectric and nuclear power stations) to almost 100% in Moldova (which is fully dependent on imports to meet its energy needs). Energy intensity indicates how much energy is required to produce one unit of output. Making cross-country comparisons in terms of energy intensity is not straightforward, as ideally a comparable measure of output should be found. One widely used measure of energy intensity is a ratio of total energy use in tonnes of oil equivalent (t.o.e.) to GDP at market exchange rates. However, as the domestic prices in the CIS countries have not yet fully converged to world levels, and the gap varies across countries, output measured in market exchange rates may be underestimated, and this complicates cross-country comparisons. One can use purchasing-power parity (PPP) estimates of GDP to arrive at an alternative measure of energy intensity (Table 2).
Table 2 - Energy intensity, 2004 constant 2000 USD, thousands Armenia Belarus Georgia Moldova Ukraine EU-25 Energy intensity, t.o.e. per thousand 2000 USD 0.74 1.61 0.71 1.56 3.19
0.20
Energy intensity, t.o.e. per thousand 2000 USD PPP 0.19 0.43 0.24 0.39 0.50
0.19
Source: IEA,; Moldova - Author's calculations based on national statistics (excludes Transnistria).
According to the measure based on GDP at market exchange rates, all countries in this group are very energy intensive, when compared to a benchmark of developed economies (here represented by the EU-25 figures). Based on these estimates, Ukraine is the most energy-intensive country in the sample, using almost 16 times more energy per unit of output than EU-25, followed by Belarus and Moldova. Armenia and Georgia are less energy intensive, but the gap with the EU-25 is still large. On the other hand, if energy intensity is calculated using a GDP PPP benchmark, the energy intensity is reduced by an order of magnitude: Armenia and Georgia are at or close to the EU-25 energy intensity level, while Ukraine, the most energy intensive country, is now only 2.5 times more energy intensive than the EU-25. There are potentially long-term differences between countries in energy intensity that can be explained by a number of factors, either endogenous or exogenous, including the use of more energy-efficient technologies, the share of energy-intensive industries and differences in climate. Therefore, countries are not necessarily expected to converge to the same level of energy intensity in the long run. From a policy perspective, it is important to understand the way energy intensity is changing over time, and what is the potential for reducing the use of energy per unit of output, via improving energy efficiency and/or by a shift from the energy-intensive industries to more efficient industries and services. The energy intensity in this group of countries has declined steadily in recent years (chart 3). Between 1999 and 2004, energy intensity declined on average by 25%, championed by Armenia, which reduced energy intensity by 30%. To overcome the problem of GDP measures, these figures are calculated based on changes, rather than on absolute values for both energy consumption and GDP. Taking energy consumption and GDP in 1999 as a reference for each country changes are calculated for the level of real GDP and changes in energy consumption over the period 1999-2004. If GDP growth has outstripped the increase in energy consumption over this period, this indicates a reduction in energy intensity.

Chart 3 - Trends in energy intensity
65
80
95
110
'99 '00 '01 '02 '03 '04
1999=100
Armenia Belarus Georgia Moldova Ukraine
Source: IEA, National statistics, authors’ calculations..
Using the estimates of dependence on energy imports and energy intensity, it is possible to calculate a measure of energy-import vulnerability, based on formula (1). This can be understood as a (non-dimensional) index that denotes a country’s vulnerability to increases in prices for imported energy. As Table 3 demonstrates, energy-importing Western CIS countries are much more exposed to an external energy price shock than South Caucasus countries. Moldova appears to be the most vulnerable, which stems from its high energy intensity, combined with its heavy reliance on energy imports. Ukraine shows similar vulnerability, being the least dependent on energy imports, but at the same time the most energy intensive economy in this region. Belarus is also highly exposed to an energy price shock due to its reliance on imports and a relatively high energy intensity. In contrast, the two South Caucasus countries show a rather limited vulnerability, mostly due to their low energy intensity.
Table 3 - Vulnerability indicators 2004
Armenia Belarus Georgia Moldova Ukraine
Share of net imports in TPES 0.65 0.87 0.54 0.98 0.46 Energy intensity (TPES to GDP, t.o.e. per thousand 2000 USD) 0.74 1.61 0.71 1.56 3.19
Net energy imports to GDP (energy-import vulnerability) 0.48 1.41 0.39 1.54 1.46
Source: IEA, national statistics, authors’ calculations It is also possible to define the vulnerability of an economy to increases in import prices for a particular energy product. For example, the vulnerability of the economy to an external gas price shock can be estimated by the share of net gas imports in GDP. This can be broken down in the way described in (2) below:8 (2) net gas imports/GDP = (net gas imports/total gas use)*(total gas use/total energy use)*(total energy use/GDP) Here, the first term shows the reliance on imports to cover domestic gas needs, while the second term shows the importance of gas as a source of energy, and the third term represents energy intensity.
8 This is the methodology used by the World Bank, 2005 and 2006.

Similarly, the vulnerability to increases in the prices for imported oil can be measured as the share of net oil imports in GDP, as given by (3) below: (3) net oil imports/GDP = (net oil imports/total oil use)*(total oil use/total energy use)*(total energy use/GDP) This chapter concentrates on the vulnerability to a gas price shock. There are a number of reasons for this. First, natural gas is the main energy source for all countries in the sample.9 At the same time, most of these countries rely wholly on imports to cover their gas consumption needs (except Ukraine, which has its own gas production, but also depends heavily on gas imports). Second, the countries in the study are likely to be more severely affected by the gas price shock than by the oil price shock. The oil price shock is mostly associated with increasing world market prices, a trend that can be reversed; by contrast, a gas price shock is related to the correction of below-market prices that were prevalent in these countries. The magnitude of the gas price shock is therefore much higher, with some countries, as mentioned before, experiencing a 100% price increase overnight. Moreover, the shock is permanent, and the countries that have already been hit by price increases for imported gas are likely to be exposed to further price increases in the coming years. Table 4 shows the estimates of vulnerability to a gas price shock, based on formula (2), as well as sources of vulnerability.
Table 4 - Gas-import vulnerability 2004 Armenia Belarus Georgia Moldova Ukraine
Net gas imports/total gas use 1.00 0.98 0.99 1.00 0.79 Total gas use/TPES 0.51 0.62 0.32 0.58 0.47 Energy intensity (TPES to GDP, t.o.e. per thousand 2000 USD) 0.74 1.61 0.71 1.56 3.19
Net gas imports to GDP (Gas-import vulnerability) 0.38 0.98 0.22 0.91 1.18
Source: IEA, national statistics, authors’ calculations. Among the countries in the study, Ukraine shows the highest vulnerability to an external gas price shock, which is mostly due to its very high energy intensity. Moldova and Belarus share a similar position with regard to the importance of gas as an energy source, a total dependence on imports and energy intensity, and therefore a similar vulnerability. Georgia is the least vulnerable to increases in gas prices, due to low energy intensity and a relatively low share of gas in its total energy use (about one third). 4. Macro-economic effects of an energy price shock Rising prices for imported energy represent a terms-of-trade shock, which in the absence of a policy response or counterbalancing developments would lead to a fall in real income and reduction in demand. The key policy question is whether the shock is temporary or permanent. If there is a reason to believe that the shock is short-lived, then the country can try to smooth the fluctuations in demand by external borrowing and/or reduction in savings. However, should the shock be permanent, the downward adjustment in real income and domestic demand is difficult to avoid. There are several channels through which the adjustment can take place. A rising energy import bill leads to a deterioration in the country’s trade account, putting downward pressure on the exchange 9 Full energy balances for the countries in the sample are presented in IEA (2006a).

rate. The domestic currency is likely to depreciate, which will reduce demand for non-energy imports. Further adjustment depends on the extent to which the increases in import prices are passed on to domestic consumers and producers. If domestic energy prices rise in line with higher import prices, private consumption and investment will be adversely affected. Consumers will face a higher energy bill and will have less money to spend on non-energy goods and services, which will also become more expensive due to firms´ rising input costs. At the same time, enterprises are unlikely to immediately fully pass-through the rising input costs to final prices for goods and services, as this would reduce their profits, thus adversely affecting investment. If instead the government decides to prevent a full pass-through of the increase in imported energy prices, private consumption and investment will be less affected. However, the increased subsidies will put pressure on government finances, either reducing other expenditures with negative repercussions for domestic demand or, more likely, causing a deterioration in the fiscal position. Impact on growth: net imports model Due to the complexity of the channels through which the energy price shock is propagated through the economy, it is difficult to model the economy’s response to the shock. However, it is possible to assess the magnitude of the necessary adjustment using a simple univariate equation, based on the ratio of net imports to GDP. Here this ratio is understood in monetary terms, i.e. the net import bill divided by nominal GDP, rather than in real terms as in the previous section (although the two are obviously linked). In the absence of external borrowing and changes in official reserves, the necessary adjustment in domestic absorption (or a potential GDP loss) will be equal to the change in net energy imports (NI), as given by:10
(4) ∆ GDP =-∆NI After rearranging, the result is (based on the World Bank, 2005):
(5) ∆ GDP/GDP = ∆P/P*(-NI/GDP) Where ∆ GDP/GDP is the percentage change in GDP, ∆P/P the percentage change in price for imported energy and NI the net energy imports to GDP (in monetary terms) Table 5 presents the results of these estimates, as well as the underlying data. The analysis concentrates on the effects of a gas price shock. For those countries in the sample that experienced a substantial increase in gas prices in 2006 (i.e., all except Belarus), the estimates of potential GDP losses in 2006 according to the net imports model are presented, as well as actual growth figures. The estimates of potential GDP losses in 2007 for the countries that faced another price shock in early 2007 (all except Armenia) are also presented.11
10 This is based on the assumption of a zero price elasticity of energy demand. 11 In 2007, Armenia has not so far experienced another gas price shock; the second wave of gas price increases in 2007 has been moderate for Moldova and Ukraine, while Georgia and Belarus have been hit with significant price increases.

Finally, some estimates are provided of potential output losses that the countries would encounter if they were charged the full market price. As mentioned before, there is no single market price for natural gas, as transportation cost and the monopoly power of gas transit countries should be taken into account. Here, we have used the price for Russian gas at the German border adjusted downwards (an amount of USD 40 is deducted from it, in line with estimates of “netback” for Belarus and Ukraine) as a benchmark for illustration purposes only.
According to the imports model the potential output losses from gas price increases in 2006 range from 1% in Georgia to 3.2% in Moldova. This broadly reflects the countries energy imports intensity. The potential GDP loss in Ukraine is estimated at 2.1%, but the magnitude of the increase was much less in Ukraine than in the Caucasus countries and Moldova (45% compared with 75-114%). However, actual growth rates in these countries were positive and decelerated only slightly, while in Ukraine, growth actually accelerated from 2.6% in 2005 to 7.1% in 2006. The next section of this chapter presents comments on these developments.12
Similar estimates for 2007 show that, following the price increases for imported gas in 2007, the magnitude of a potential contraction ranges from 1.1% in Moldova to 3% in Belarus, reflecting the larger percentage increases for Belarus (110%), compared with a moderate second wave of price increases for Moldova in 2007. More revealing are the estimates of the magnitude of output losses if prices were raised to the regional “parity price” proxied by the German border benchmark adjusted downwards (again, this is an imperfect proxy, and is used here for illustration purposes only). The results show that, in that case, Belarus and Ukraine would have experienced a dramatic loss in output of 11.4% and 7.6%, respectively. Georgia, which already pays almost full parity price, would face only a 2.5% loss, and Moldova and Armenia losses of a 3.5% and 3.7%, respectively.
12 This difference between estimated losses and outcomes also appears when one uses more complex structural models (see Vinhas de Souza, 2006a).

Table 5 - GDP effects of a gas price shock
Average price
(USD/tcm)
Gas imports
(mln USD)
Gas imports
(% GDP)
Increase in gas price
over previous year
GDP loss in net
imports model
Actual growth
(%)
Armenia 05 57 97 2.0 13.9
06e 110 187 2.9 93% -1.8 13.4 07p 110 187 2.9 0% 0.0
Full price 250 425 6.6 127% -3.7 Belarus
05 47 950 3.2 9.2 06e 48 990 2.7 0% 0.0 9.9 07p 100 2080 5.6 110% -3.0
Full price 250 5283 14.3 425% -11.4 Georgia
05 63 91 1.4 9.6 06e 110 159 2.0 75% -1.0 9.0 07p 235* 341 4.4 114% -2.3
Full price 250 361 4.8 127% -2.5 Moldova
05 68 97 3.3 7.5 06e 135 192 4.1 97% -3.2 4.0 07p 170 241 5.2 26% -1.1
Full price 250 355 10.9 85% -3.5 Ukraine
05 66 3946 4.6 2.6 06e 95 4769 4.7 45% -2.1 7.1 07p 130 6527 6.4 37% -1.7
Full price 250 12551 12.3 163% -7.6 Source: National statistics, UN’s COMTRADE and authors’ calculations. e – estimates p - projections * - price for Russian gas; average price should be lower if Azeri gas is taken into account.
Impact on macroeconomic stability In the framework of the net imports model, the rise in the net imports bill is compensated by the contraction in domestic absorption, so that external balance is restored. One of the adjustment mechanisms would be depreciation of the domestic currency. In the event of a moderate increase in the energy bill, the necessary adjustment may be limited. However, the estimates show that the countries in the sample have already experienced a rise in their energy imports bills of around 1.8-4.3% of GDP, and may face further increases, which suggests that a sizeable depreciation may be required in order to restore equilibrium in the external accounts. Nevertheless, in recent years the economies of the region have benefited from macroeconomic stability, supported by stable (and often appreciating) exchange rates. Greater confidence of the population in the domestic currency has fostered de-dollarisation and a higher demand for money, resulting in increased monetisation. These positive trends may be reversed, if expectations regarding future exchange rate developments were adjusted downwards.

An exchange rate adjustment, which may be needed to restore the external equilibrium following the terms-of-trade shock, could trigger a loss of confidence in domestic currency, which would result in higher demand for foreign currency from households, and thus further devaluation. The high level of foreign currency borrowing in the region further aggravates the risks. Therefore, developments in the exchange rate market can jeopardise financial stability, leading to uncertainty, falling investment and an overall decline in economic activity. Taking into account these second-round effects, it is understandable that the authorities are reluctant to allow an exchange rate adjustment following the terms-of-trade shock. This is especially true in countries such as Belarus and Ukraine, where the exchange rate has been de-facto fixed over the past years, thereby anchoring expectations. Given the importance of the exchange rate targets in theses economies, the authorities would most likely try to avoid the necessary adjustment, for instance, by accessing international capital markets and using official reserves. This strategy is however questionable. As the shock is likely to be permanent, external borrowing may be used to temporarily cushion the shock, but adjustment at some point is inevitable. Moreover, a delayed adjustment may be more painful due to rising debt service payments. The external position of the country prior to the energy price shock also matters. A country that runs current account surpluses and has substantial foreign exchange reserves and/or low levels of external debt may be less exposed to the shock than a country with current account deficits, low level of reserves and high indebtedness. Charts 4a shows the current account and trade balances, broken down into the energy and non-energy trade balances for the countries in the study, prior to a gas price shock. In 2005, only Ukraine ran a current account surplus in 2005, of around 3% of GDP, before the first wave of increases in the imported gas price. All other countries in the sample recorded comparable current account deficits of around 4-5% of GDP. Trade balances were negative for all countries in the study, varying from a moderate deficit of below 2% of GDP in Ukraine to a dramatic deficit close to 40% of GDP in Moldova. The decomposition to trade into energy and non-energy reveals several interesting trends. First, strikingly, Belarus emerges as a net exporter of energy products in 2006. This reflects the price differentials between Belarus’ energy imports (cheap Russian gas and crude oil delivered from Russia free of export duties) and energy exports (refined oil products, sold to Western Europe at market prices, which soared in 2005-2006). Second, Moldova had the largest deficit in energy trade – in excess of 16% of GDP - indicating once again its very high dependence on energy imports, and also in non-energy-trade, at around 24% of GDP. Ukraine is the only country in the group that had a surplus in non-energy-trade; however, its overall trade deficit is determined by its high deficit in energy trade.
-50
-40
-30
-20
-10
0
10Armenia Belarus Georgia Moldova Ukraine
% of GDP
Current account to GDP Trade balance to GDPNet energy trade balance to GDP Non-energy trade balance to GDP
Source: Authors’ calculations based on national statistics.Note: Data for 2005, except for Belarus, where the data refer to 2006.
Chart 4a - Current account and trade balance prior to gas price shock
-50
-40
-30
-20
-10
0
10Armenia Georgia Moldova Ukraine% of GDP
Current account to GDP Trade balance to GDPNet energy trade balance to GDP Non-energy trade balance to GDP
Source: Authors’ calculations based on national statistics.Note: Data for 2006.
Chart 4b - Current account and trade balance after the gas price shock
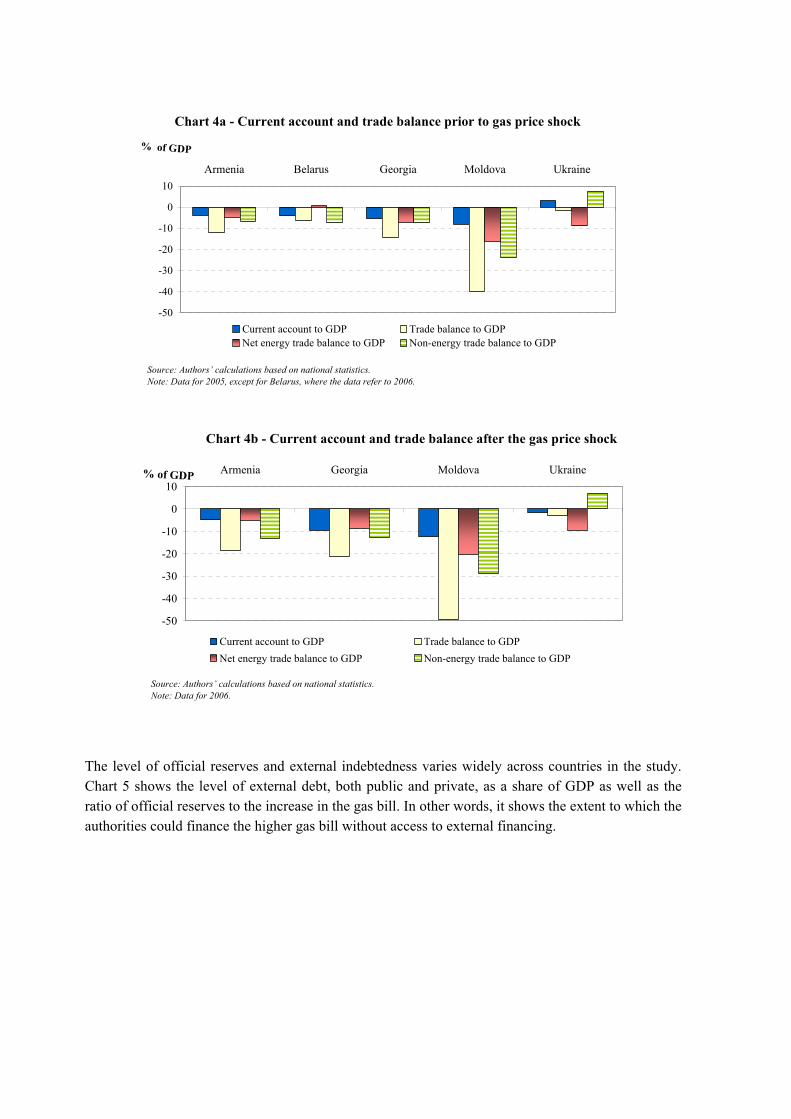
The level of official reserves and external indebtedness varies widely across countries in the study. Chart 5 shows the level of external debt, both public and private, as a share of GDP as well as the ratio of official reserves to the increase in the gas bill. In other words, it shows the extent to which the authorities could finance the higher gas bill without access to external financing.

Chart 5 - External vulnerability
43.3
10.5
64.2
43.0
31.8
0
20
40
60
80
Armenia Belarus Georgia Moldova Ukraine
% GDP
0
20
40
60
80
Months of coverage
Private external debt (left hand side)Public external debt (left hand side)Reserves coverage of gas bill increase (right hand side)
Source: National statistics, authors’ calculations.Note: Data for 2005, except for Belarus, where the data refer to 2006.
In terms of risks to macroeconomic stability, Moldova and Belarus appear to be the most vulnerable to a gas price shock, albeit for different reasons. Moldova’s external debt level, the highest among the countries in the group, exceeds 70% of GDP, which makes further accumulation of debt problematic. Belarus, in contrast, has a very low foreign debt, suggesting scope fur further borrowing. However, the level of foreign exchange reserves in Belarus is low: in the absence of external financing, the authorities will only be able to finance the increase in the gas bill for less than one year.13 As the country already ran a current account deficit prior to the gas price shock, financed by external borrowing, the short-term risks to macroeconomic stability seem to be highest in Belarus. Current account and trade balances after the gas price shock In 2006 the trade deficits widened significantly in Armenia, Georgia and Moldova, by about 7-9 % of GDP (charts 4a and 4b). In Ukraine, the trade deficit widened by 1.5% of GDP in 2006, while the current account swung into deficit. The decomposition into energy and non-energy parts reveals that the widening trade deficits were determined as much by increasing non-energy trade shortfalls as by rising energy trade deficits (or, in the case of Ukraine, by a falling non-energy trade surplus). In fact, non-energy imports rose significantly in all countries in the sample. This happened on the back of appreciating currencies, not only in real terms but also in nominal terms (in all countries apart from Moldova), which is not consistent with the theoretical adjustment mechanism described above. Other developments in the external sector after the gas price shock There are other developments in the external sector that have to be taken into account when assessing the impact of the energy price shock on the country’s macroeconomic performance, as these may aggravate or mitigate the price shock. Such factors include exports, remittances, FDI and external borrowing. Analysing these developments helps in understanding how the shock has so far actually been absorbed and to explain the difference between estimated and observed outcomes of the simple modelling framework presented above.
13 This would be even less if an increased oil bill is taken into account (see footnote 6).

Exports Russia is not only the main energy supplier, but also a very important export market for many countries in the group. As one can see from chart 6, between 2000 and 2005 exports to Russia ranged from a high of almost 50% of total exports (representing close to 30% of GDP) in Belarus to a low of 14% (or 2.5% of GDP) in Armenia.14 This means that the disputes with Russia over gas supplies may also affect trade in other goods, amplifying the gas price shock. Restrictions imposed by Russia on imports of agricultural products from Georgia and Moldova in 2006 serve as an example. The effects of these restrictions on the economies differ, although Moldova, due to its very high share of exports to Russia (the second highest in our sample, after Belarus) appears to have been affected much more severely than the other countries.15
Chart 6 - Trade with Russia, 2000-2005
0
10
20
30
40
50
Armenia Belarus Georgia Moldova Ukraine
%
Percentage of total exports Percentage of GDP
Source: IMF/DOTS, authors’ calculations.
On the other hand, unforeseen positive terms of trade shocks can also play a counterbalancing role for some countries. A case in point is Ukraine, where iron and steel are major export goods. Alghouth prices fell in 2005, they surged in 2006, suggesting that the negative gas price shock in 2006 was more than offset by these developments. Also in Ukraine, exports of natural gas collapsed between 2005 and 2006, from 2.06 bcm to a mere 153 m.c.m. (a 93% fall).
14 Concerning the data for Georgia presented in Chart 6, EBRD estimates of total exports are more than twice the totals presented in the DOTS database. This is because the EBRD data includes estimates for “grey” exports from Georgia’s separatist regions. If one assumes that this estimation of “grey” exports is correct and that they all go to Russia, then Russia’s total in Georgian exports (and its share in GDP) increases very substantially. 15 For Moldova, the IMF estimates that the combined effects of the Russian wine import ban and the gas price shock will have a combined negative effect on growth of 2-3% in 2006-07, and open a gap in the balance of payments of about 6.5-9.5% of GDP in 2006-2007. Roughly two thirds of the shock are attributable to the ban on Moldovan wine exports, and a third to the gas price shock (see IMF, 2007).

Remittances and FDI Remittances can be a useful short-run adjustment tool for some countries. It is possible that if energy price increases are passed on to households, relatives abroad may increase the financial help to their families in the country. Remittances flows are notoriously difficult to estimate precisely, but it can be assumed that these may have had a particularly significant cushioning effect in Moldova: some surveys put remittances as high as 35% of GDP in 2006 (a jump of 5 percentage points over 2005). Remittances flows are also very significant in Georgia and also in Armenia. Some studies (see IMF, 2006) quote a share of remittances to GDP in Armenia of 20% in 2005, based on surveys. FDI can become an important mechanism for adjusting to an energy price shock. In the short run, it would provide necessary financing in the short run; in the long run, FDI is likely to increase the export potential of a country, and may also be associated with the introduction of energy-efficient technologies (although any FDI attracted by the low energy costs would be adversely affected). In some cases, an increase in FDI can be directly linked to the energy price shock if a country tries to create a more conducive environment for foreign investors in order to attract much needed financing. On the other hand, an upsurge in FDI inflows may be completely unrelated to higher prices for energy imports. In any event, an increase in FDI will counterbalance the negative effect of the higher energy bill on the balance of payments. As indicated in Table 6, only Georgia experienced a substantial increase in FDI inflows between 2005 and 2006.16 Additionally, the above-mentioned IMF study points out that, in some cases, it might in fact be more correct to classify remittances as foreign direct investment, something which may be relevant for Armenia and Moldova.
Table 6 - Net FDI inflows 2004 2005 2006
million USD % GDP million USD % GDP million USD % GDP Armenia 217 6.1 255 5.2 220 3.4 Belarus 163 0.7 303 1.0 351 1.0 Georgia 420 8.2 529 8.3 861 11.0 Moldova 146 5.6 199 6.7 223 6.6 Ukraine 1711 2.6 7533 9.1 5336 5.4
Source: National Statistics, EBRD database. External borrowing External borrowing can be used as another potential short-run adjustment tool. It may be a direct policy response of the government in an attempt to cushion the shock. Given its relationship to the fiscal framework, this point will be developed below. At the same time, the accumulation of external liabilities by the private sector can be due to reasons unrelated to the energy price shock, such as borrowing by banks to extend domestic credit). The most significant increases over 2006 in external liabilities, mainly in the private sector (around 5 percentage points of GDP) were in Ukraine and Moldova (Table 7). 16 At the same time, a very significant jump in FDI inflows happened in Ukraine in late 2005, when the largest Ukrainian steel company, Kryvorizhstal, was re-privatised via its sale to Mittal Steel, the world’s largest steel producer, for a record amount of USD 4.8 billion. That was the single biggest FDI in Ukraine’s history, and part of the inflow was actually saved by the government in 2005 and used in 2006.

Table 7 - Total external debt (% GDP)
Armenia Belarus Georgia Moldova Ukraine
2005 2006 2005 2006 2005 2006 2005 2006 2005 2006 Public and private 37.9 32.0 17.5 18.6 33.3 25.6 71.3 76.3 46.0 51.0 Public 22.4 18.8 2.1 1.6 27.1 21.8 25.8 26.4 15.6 12.9 Private 15.5 13.2 15.4 17.0 6.2 3.8 45.5 49.9 30.4 38.1
Source: National Statistics. Chart 7 summarises the developments in the external sector after the 2006 energy price shock. It shows, without prejudging a direct causal link with the price shock, how the increase in the gas price bill in per-capita terms was counterbalanced by other developments in the external sector (exports, net transfers, FDI), and by the rise in external borrowing.
Chart 7 - Gas price shock and other external developments
27.714.8
27.917.5
111.8
-50
0
50
100
150
200
250
300
Armenia Georgia Moldova Ukraine Belarus
USD per-capita
Gas bill Exports revenue FDI Net transfers External debt
Source: EBRD, national central banks, authors’ calculations.
Clearly, external borrowing was the main counterbalancing factor, via a significant increase in private and quasi-private external debt. This debt accumulation was particularly strong in Ukraine and Moldova, but this was a common feature of the adjustment for all countries except Georgia (data for Belarus are not yet available). This is an important factor as it may increase vulnerability to future energy price shocks. In Armenia, the shock in 2006 was mitigated by increased remittances (part of which may be FDI, as discussed). Strong FDI in Georgia counterbalanced the shock to the external accounts. In Ukraine, the increase in the gas bill was lower than expected due to a substantial reduction in volumes of gas imports (among other factors caused by a significant reduction in Ukrainian gas exports and some improvements in energy efficiency: the precise magnitude of individual effects needs to be assessed) and was more than offset by additional export revenues related to the increases in prices for steel. In Moldova, neither exports nor FDI were sufficient to offset the shock, so the country had to rely on additional remittances and help from the international financial institutions.

Impact on fiscal accounts and prices Another cushioning mechanism is the fiscal one, which has both domestic and external dimensions. It should be recognised that there may well be legitimate reasons why a government would wish to use fiscal tools to temporarily cushion the shock: these range from social spending (for instance, income support to protect less well-off households) to industrial policy (for example, to provide important economic sectors with a period of adjustment). In the post-shock period, there is a potential conflict between the price level necessary for a sustainable operation of the companies and social considerations with respect to the customer’s ability to pay (the “affordability” issue). This is especially valid in an environment where social safety nets are still deficient. As even in the absence of price shocks the implementation of cost-recovery pricing in the utilities sector has been gradual and has been accompanied by the introduction of means-tested benefits for lower income households, the same should hold true for a period of energy price shocks. On the other hand, the use of fiscal means for industrial policy purposes is much more debatable. That said, the average headline fiscal deficit of the countries in our sample showed only a relatively minor increase in 2005, when compared to 2004, from -1.1 % to -1.3%, but falling to -1.2% in 2006 (Table 8 below). No country has so far experienced any significant worsening of the headline fiscal position.17 Belarus actually increased its headline surplus very significantly, deliberately hoarding fiscal revenue in anticipation of the price shock. Table 8 - Headline fiscal balances (% GDP)
One must note the use of the expression “headline” fiscal deficit. That is because there are also other, far less transparent ways in which a national government can accumulate fiscal liabilities outside the government budget. The most relevant ones for this work are contingent liabilities. Those are potential claims that may or may not
become explicit at some future point (for instance, explicit or implicit state guarantees on borrowing by state-owned or state-controlled enterprises, see Catrinescu and Vinhas de Souza, (2006)). The accumulation of contingent liabilities seems to have become one of the adjustment mechanisms in Ukraine. A considerable amount of contingent fiscal liabilities seems to have been accumulated in the domestic energy company Naftogaz Ukrainy, as gas price increases have been only partially passed through to domestic consumers. The external debt of Naftofaz reportedly surged by over USD 2 billion over 2005-2006. This is partially reflected in Table 7, which shows that the share of private external debt in Ukraine increased by about 8 percentage points of GDP between 2005 and 2006. Belarus may follow a similar process to that of Ukraine, after the accumulation of delayed payments to Gazprom during the first quarter of 2007. Those delayed payments are expected to be paid via proceeds from the sale of a 12.5% stake in Beltransgaz to Gazprom. The projected current account
17 Privatisation in Armenia and Georgia may also have been a source of inflows that partially enabled the cushioning of the social costs of the energy shock in the short run without more significant fiscal pressures.
2003 2004 2005 2006 Armenia -1.1 -1.7 -2.6 -2.3 Belarus -1.4 0 -0.6 1.4 Georgia -1.6 -0.2 -2.4 -2.3 Moldova 0.7 0.8 1.5 -0.3 Ukraine -0.9 -4.4 -2.4 -2.4 Average -0.9 -1.1 -1.3 -1.2 Source: IFS from the IMF, National Statistics.

shortfall is likely to be financed by sizeable external borrowing in 2007 (tapping both international capital markets and official financing from Russia) and perhaps also by a speeding-up of privatisation.18 Table 9 - End-year CPI inflation (%)
Another domestic effect of the energy price shock is inflation. As the pass-through has so far been less than complete in some of the countries in the sample19, for reasons described above, the inflationary effects have until now been somewhat limited. Nevertheless, consumer prices increased in all countries in the study following the energy price shock (Table 9). The most pronounced rise was in
Moldova, where inflation increased from 10.2% to 14% between 2005 and 2006, and in Armenia, where inflation increased from -0.2% to 5.2% (not by accident, as in these countries the price shock was almost completely passed-through to domestic consumers), followed by Georgia, where inflation rose by 2.4%. On the other hand, consumer prices in Ukraine increased by 1.3% only; at the same time, producer prices rose by 4.6%. 5. Conclusions This chapter has presented an initial estimation of the effects of the gas price shocks in the energy-importing countries of the Western CIS and Caucasus. The results show that the Western CIS countries are more vulnerable to the shock, while the Caucasus countries show limited vulnerability, mostly because of their lower energy intensity. There is a substantial difference between the estimated and actual economic performance. This has happened because, in spite of very significant increases in prices for imported energy, other developments have acted as counterbalancing factors, dampening the expected negative impact on domestic absorption. Although it is difficult to establish a direct causal link with the increase in energy prices, the main common counterbalancing factor has been the significant increase in private and quasi-private external debt: this was the case in all countries except Georgia. Other country specific factors played also an important role. In Ukraine, the shock to the external accounts was also counterbalanced by a positive terms-of-trade shock. In addition, the volume of gas imports declined substantially in 2006, for the reasons described in section 4. Greater FDI inflows helped to finance the widening current account deficit in Georgia. Moldova was the country most affected, and the shock was only partially
18 One must also note that what is classified as “private external debt” in Belarus, and similarly in the case of Ukraine, also reflects the accumulation of debt by entities with state-participation in their capital, particularly banks. 19 The pricing policies vary from country to country and can be quite complex, which makes the evaluation of the inflationary effects of the energy price shock difficult. They vary from an almost complete pass-through of the energy price shock in Moldova (although with a lag), a temporary “natural gas subsidy” to consumers introduced in Armenia (it is expected to expire in 2008), to the partial and differentiated pass-through in Belarus and Ukraine (which include differentiated pricing between different industries and households).
2004 2005 2006 Armenia 1.9 -0.2 5.2 Belarus 14.4 8.0 6.6 Georgia 7.5 6.4 8.8 Moldova 12.5 10.2 14.0 Ukraine 12.3 10.3 11.6 Source: IMF/IFS.

mitigated by increased remittances.20 In Belarus, the shock took place only recently and the adjustment pattern is still unclear, but is likely to involve a significant increase in external indebtedness. The inflationary effects have so far been limited in the countries where the price pass-through of the shock was incomplete; however, accumulated fiscal liabilities (including contingent liabilities) in these countries pose a risk to fiscal sustainability. In terms of policy recommendations, given the permanent nature of the shock, the optimal strategy is to pass it through in full to domestic users. This will provide incentives for a more efficient use of energy and promote economic restructuring. In order to cushion the negative impact on the most vulnerable sections of the population, the increase in energy prices should be accompanied by the development of more efficient and better targeted income support mechanisms. Additionally, the speeding-up of privatisation, to attract FDI and accelerate economic restructuring may be advisable for some countries. From a longer term perspective, continued efforts towards greater energy efficiency should be undertaken, especially by the Western CIS countries. References Catrinescu, N. and L. Vinhas de Souza, (2006), Quasi Fiscal Activities in Moldova, mimeo, European Commission, Brussels. Falcetti, E., Lysenko, T. and Sanfey, P. (2006). Reforms and Growth in Transition: Re-examining the Evidence, Journal of Comparative Economics, Elsevier, Vol.34 (3), pp 421-445. International Energy Agency (2006a), Energy Balances of Non-OECD Countries 2003-2004, OECD, Paris, France. International Energy Agency (2006b), World Energy Outlook 2006, Paris, France. International Monetary Fund (2007), Republic of Moldova: First Review under the Three-Year Arrangement Under the PRGF, IMF Country Report 07/45. International Monetary Fund (2006), Republic of Armenia: Selected Issues, Country Report 06/434. Vinhas de Souza, L. (2006a), Effects of Gas Price Increases in CIS Countries: The Case of Ukraine, Mimeo. European Commission, Brussels. Vinhas de Souza, L. (2006b). Economic Aspects of the Energy Sector in Russia, Mimeo. European Commission, Brussels. World Bank (2005), The Impact of Higher Oil Prices on Low Income Countries and on the Poor, Washingon, DC. World Bank (2006), Ukraine: The Impact of Higher Natural Gas and Oil Prices, Kyiv.
20 And also by larger external support from the IFIs and official creditors: in 2006, Moldova re-scheduled its Paris Club debt and signed a new financing agreement with the IMF. In 2007, it will also benefit from concessional loan and grant financing from the World Bank, the EU (a new Macro Financial Assistance package) and other bilateral donors.