The effects of economy, values and health on happiness
29
Munich Personal RePEc Archive The effects of Economy, Values and Health on Happiness In Iran: the case of the Kish Island Torshizian, Eilya and Mehrara, Mohsen University of Tehran 15 March 2011 Online at https://mpra.ub.uni-muenchen.de/30085/ MPRA Paper No. 30085, posted 20 Apr 2011 20:33 UTC
Transcript of The effects of economy, values and health on happiness

Munich Personal RePEc Archive
The effects of Economy, Values and
Health on Happiness In Iran: the case of
the Kish Island
Torshizian, Eilya and Mehrara, Mohsen
University of Tehran
15 March 2011
Online at https://mpra.ub.uni-muenchen.de/30085/
MPRA Paper No. 30085, posted 20 Apr 2011 20:33 UTC

The Effects of Economy, Values and Health on Happiness
In Iran: The Case of The Kish Island
Abstract
Increasing happiness of population as the ultimate goal has engaged economist’s interest
in identifying, measuring and theorizing based on the amount of influence of effective
components on happiness. What makes this paper remarkable in contrast to similar
studies is its Islamic ideological structure of society and being a free economic zone.
Method used to estimating happiness is Structural Equation Modeling (SEM) with latent
variables. Results do not confirm presence of the Easterlin paradox in this society and
moreover the religious variables are not significant.
Keywords: Behavioral Economics, Economics of Happiness; Structural Equation Modeling
(SEM) with latent variables; Subjective Well-Being;
JEL classification: D03;D60;C30
PsycINFO Classication Code: 2900
1. Introduction:
Most human activities and creations are seeking happiness which is arisen from life with
ethics and life accompanied by material needs. As a consequence, the effects of
happiness determinants play the cardinal role in live of our generation.
Indeed, these determinants are nearly same in different nations, and differences lie at
roots of tradition, culture and the economic situation. This paper explores the relationship
between happiness and 3 major variables namely: economic situation, health condition
and values which all of them are qualitative variables, hence the method of modeling is
crucial.
Cultural and regional characteristics are so effective on individual’s evaluation of
happiness (Fuentes, 2001). Conventional wisdom tells us that Iranian nation is
characterized as nationality of strong traditional values unified by Islamic advises, with
normal attention to health and nowadays by a traditional economy system. But the Kish
Island, which is the society of the paper, is a free zone, that means the details of a free
zone affects results of this study. For instance, most residents of Kish Island are seeking
work.
As Durlauf (2008) states it does not seem that economics of happiness to be a substitute
for economic determinants rather than a complementary role it plays for them by wider
range of welfare determinants.
As Rojas (2006) mentioned: “There are three ways of doing research in happiness: First,
researchers face the complexity of human beings and study human happiness as such.
Second, researchers focusing on the relationship between happiness and relevant
variables within their discipline. Third, researcher uses happiness to explain other
phenomena”. In this study focused on first and second aspects.
The organization of this paper is as follows: Section 2 includes relevant literature
regarding the study of happiness, in section 3 the data will describe more and section 4
presents the model in some detail. The main results and findings are presented in section
5 and finally section 6 includes conclusions.

2- Relevant literature:
Happiness
Although it is clear that happiness as a subjective concept cannot be defined by single
meaning (Layard R. , 2003), Veenhoven (1994) stated happiness as follows:
Firstly, happiness is not a constant state as people in their longevity change their view of
life. Secondly, in same situations, people would not be happy to the same extent and their
level of happiness depends on their evaluation of their situation specially relative to others.
And last point that happiness is not completely an internal factor and it depends on
environment outputs. Happiness makes people successful which it leads economic to
rapid growth (Lyubomirsky, King, & Diener, 2005; Kenny, 1999; Veenhoven, 1988).
Policy making, happiness and its determinants
[Insert Figure 1]
Figure 1. Relation between Policy makings, Happiness and its determinants [inspired of (Dowling, 2007) pp.182].
Income and happiness
There are different conclusions over relation between income and happiness. Inglehart
(2000) stated that rising in income results eye-catching and significant growth of
happiness, but this effect is weak over high levels of income. Hagerty (2003) concluded
happiness in countries by lower level of GDP is lower than those have higher GDP levels
(Hagerty, 2003; Diener, Lucas, & Oishi, 1999; Easterlin, 1995).

Easterlin paradox
The “Easterlin paradox” suggests that there is no link between a society’s economic
development and its average level of happiness (Easrerlin, 1974). Dowling (2007) in his
book considers Easterlin’s statement that people are always seeking happiness and
planning for this purpose. But there are three truth, first, people with more income are
overally happier compared with people with lower income. Second, people expect more
happiness in future. And third, happiness is constant over the time. In conclusion material
expectations are changing in the same portion that income changes and people even they
think they are happier, won’t achieve more happiness.
Following studies, happiness as a result of higher levels of consumption removes over the
time (Frey, 2002). Satisfaction produces by changes, and constant consumption results in
diminishing increase of satisfaction. People pay attention to their income compared to
others not as an absolute number. (Duesenberry, 1949; Friedman, 1957)
Layard (2005) emphasized job security due to creating happiness. Di Tella (2001) stated
the negative effect of rising unemployment is about two times more than negative effect of
increasing in inflation rate. And Stutzer (2001) concluded that level of negative effect of
unemployment depends on values of society about living by personal income and being
effective person for society.
Measuring tools
Discussion over happiness measuring tools is so wide (Hoorn, 2007). Measuring it well is
equivalent to understanding well (Diener E. , 2009). As Easterlin (2007) mentioned,
happiness is the net outcome of satisfaction with all the major domains of life, and no
single domain is sufficient to explain overall happiness. In this paper, two common scales
used for estimating happiness which are Subjective Happiness Scale (SHS)i (Lyubomirsky

& Lepper, 1999) and the Satisfaction With Life Scale (SWLS)ii (Diener, Emmons, Larsem,
& Griffin, 1985; Pavot & Diener, 1993; Veenhoven R. , 2005).
3. Data:
The empirical analysis was performed using the results of a survey conducted in the Kish
Island, Iran. Data collection took place during April and June of 2010 following a one stage
cluster sampling design. A questionnaire was designed to collect information concerning
the following groups of variables: subjective well-being; life satisfaction; values; positive
and negative affect; health; religion; economic; and social and demographical variables
(Garcia, Fuentes, Borrego, Gutierrez, & Tapia, 2007). See appendix 3 for a summary of
descriptive statistics of the variables.
The population of Kish Island is 20,667 persons that by using Morgan’s table (Krejcie,
1970) the appropriate sample size is 378.
In this study 55 variables fueled by 55 questions which includes 2 indices and 6 major
variables which identified by factorial analysis method. The variables are as follows:
1- Demographics:
Age
Education level
Marriage status
Marriage satisfaction
Economic level
Sex
2- Happiness:
Happiness rate
Satisfaction of stated happiness rate
Happiness rate of yesterday
Happiness compared to others
3- Economic:
Material possessions
Income compared to others
Economic situation changes
Family income level
Satisfaction of income
4- Health condition:
Personal health
Visits to doctor in last 3 months
Satisfaction with personal health
Importance of taking care to personal health
Exercise
5- Religious status:
Attendance at religious ceremonies
Doing religious tasks
Belief in God
6- Values:
Being honest
Being benevolence
Being active
Being generously
Being wealthy
Being playful

Being scheduled
Being involved in politics
Service to country
Caring about free speech
Not having illicit sexual relations
Wearing Hijab
Not drinking alcoholic beverages
Saving
Not saying convenience lies
4. Model details:
Owing to have major variables which each of them includes observable variables, the
Structural Equation Modeling (SEM) with latent variables method preferred (Bollen, 1989;
Lomax, 2004; Heady, Veenhoven, & Weari, 1990), that briefly explains below.
By using factorial analysis, the quantitative variables become subset of the major
variables and afterwards Maximum Likelihood Estimation (MLE) results in model
estimation. The LISREL program which used in this study, for assessing the primary
values of parameters uses the instrumental variable method. After that, in order to
estimate the relationships of variables, it uses the Covariance matrices.
The model considers a happiness variable as the endogenous latent variable and three
latent variables which arise from observable variables.
One of three main elements of structural equations is path diagram. Figure 2 shows the
path diagram of happiness elements.

[Insert Figure 2]
Figure 2. Path diagram of happiness elements
As shown in figure 2, observable variables are in the left side, the latent variables are
showing beside them, this group of variables are defined by concepts and of course by
using the factorial analysis method, next to them another group in the right side named
group three, includes another latent variable (Happiness) which is more general than the
latent variables of group two. Group four shows explanatory variables of group 3’s variable
(Happiness).
The figures below show more details of relationships between explanatory variables and
latent variables and also clear the groupings of observable variables.
[Insert Figure 3]
Figure 3. Economy and observable variables
As shown in figure 3, the Economy as a latent variable includes many cause variables
which are connected to Economic variable with lines.
[Insert Figure 4]
Figure 4. Health and observable variables
In figure 4 and 5 the more details of two important variables are visible. For instance in
figure 4, the Health factor includes observable variables such as health condition, Visits to
doctor in last 3 months etc.

[Insert Figure 5]
Figure 5. Values and observable variables
[Insert Figure 6]
Figure 6. Relation between latent variables and endogenous latent variable
Figure 6 shows the relationship between latent variables and endogenous latent variable.
As it shown, Happiness as a high-level variable includes 3 low-level variables Economy,
Health and Values, namely.
[Insert Figure 7]
Figure 7. Happiness and its determinants
As shown in figure 7, the Satisfaction With Life Scale (SWLS) and Happiness Index (HI)
are two indices which are estimating Happiness latent variable.
5. Results:
Modeling
Considering last section and by using Lisrel program, the final model estimation is as
follows:

HAPPINESS = 0.50*ECONOMY + 0.35*HEALTHFA + 0.33*VALUES
(0.068) (0.064) (0.065) (0.13)
7.35 5.53 5.13 3.66
, Errorvar.= 0.46 , R² = 0.54
Where HAPPINESS stands for Happiness endogenous latent variable; ECONOMY for
Economic latent variable; HEALTHFAC for Health latent variable; and VALUES represents
the Values latent variable.
As seems above, the effect of economic variable on happiness is more than health and
values variables1 (Heady, Muffels, & Wooden, 2007).
Owing to weakness of happiness estimation by demographics, they abnegated. Another
important variable which was not significant in this study is religious variable, in this
writer’s opinion, maybe it is because of population specific ideological structure.
Global Goodness of Fit Statistics, Missing Data Case
-2ln(L) for the saturated model = 36497.796
-2ln(L) for the fitted model = 37091.299
Degrees of Freedom = 371
Full Information ML Chi-Square = 593.50 (P = 0.00)
Root Mean Square Error of Approximation (RMSEA) = 0.040
90 Percent Confidence Interval for RMSEA = (0.034 ; 0.046)
P-Value for Test of Close Fit (RMSEA < 0.05) = 1.00
1 It is considerable that development of nations affects the amount of extra happiness that could
be bought by economic progress (Oswald, 1997).
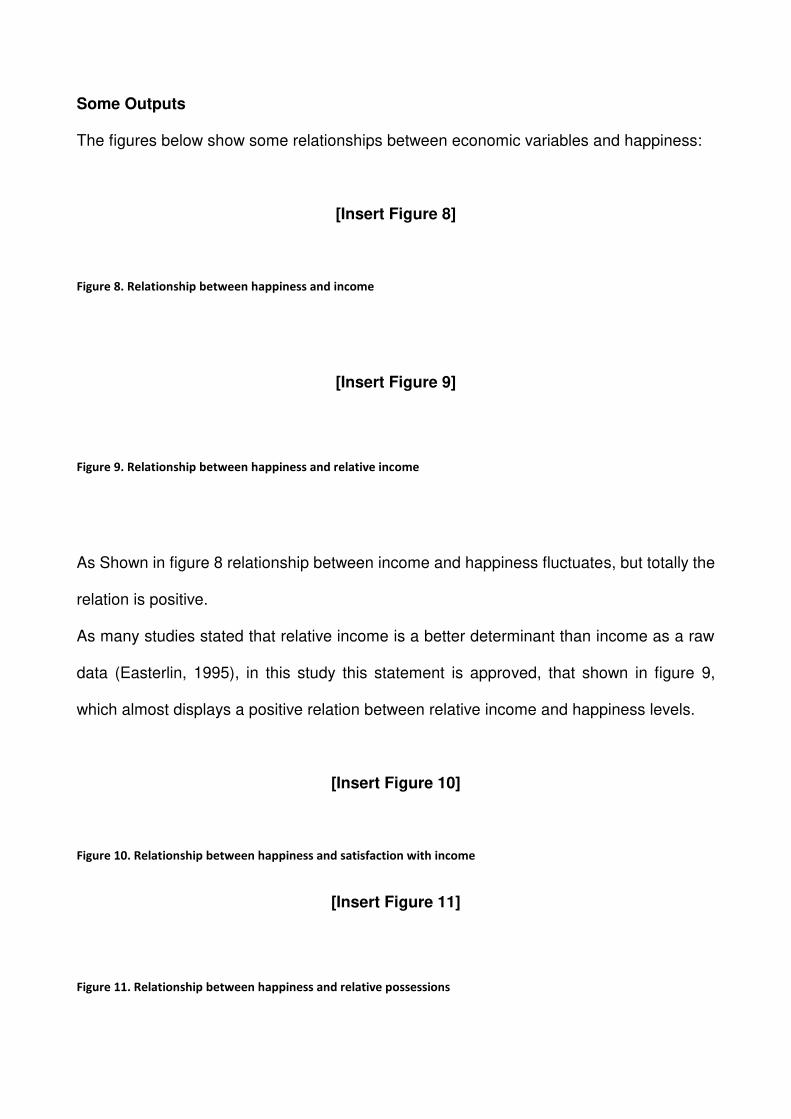
Some Outputs
The figures below show some relationships between economic variables and happiness:
[Insert Figure 8]
Figure 8. Relationship between happiness and income
[Insert Figure 9]
Figure 9. Relationship between happiness and relative income
As Shown in figure 8 relationship between income and happiness fluctuates, but totally the
relation is positive.
As many studies stated that relative income is a better determinant than income as a raw
data (Easterlin, 1995), in this study this statement is approved, that shown in figure 9,
which almost displays a positive relation between relative income and happiness levels.
[Insert Figure 10]
Figure 10. Relationship between happiness and satisfaction with income
[Insert Figure 11]
Figure 11. Relationship between happiness and relative possessions

As shown in figure 11, relationship between relative possessions and happiness is slightly
direct.
6. Conclusion
The present paper reveals happiness is significantly affected by economic situation.
Relationships between happiness and income, happiness and relevant income, and also
happiness and relevant possessions, all of them are direct; As a result, compared to
similar studies, the Easterlin paradox did not visible in this society. As mentioned by
Inglehart’s about income levels, the positive relations can be the result of society’s income
and welfare level.
Comparable the results of similar studies, also in this paper relative income is a better
determinant for happiness compared to absolute income.
In most studies (ex. Garcia, Fuentes, Borrego, Gutierrez, & Tapia, 2007) one of the most
effective factors on happiness, is religious parameters. Although the society of this paper
has an Islamic ideological structure, the religious parameters were not significant.
On the whole, people who pay attention to values, experience higher levels of happiness.
Moreover, health and values parameters jointly have so important effect on happiness
even by absence of higher economic situation.
Method which used to modeling happiness was the Structural Equation Modeling (SEM)
with latent variables, which obtained acceptable results; so it is recommended for similar
studies.
References
Bollen, K. A. (1989). Structural Equations With Latent Variables. Wiley.
Di Tella, R. J. (2001). The Macroeconomics Of Happiness. In R. D. Tella. The Warwick Economics Research
Paper Series (TWERPS).
Diener, E. (2009). Conclusion: Future Directions In Measuring Well-Being. Social Indicators Research Series ,
39 .
Diener, E., Emmons, R. A., Larsem, R. J., & Griffin, S. (1985). The Satisfaction With Life Scale. Journal of
Personality Assessment , 49,1.
Diener, E., Lucas, R. E., & Oishi, S. (1999). Subjective Well Being.
Dowling, J. (2007). Modern Developments In Behavioral Economics: Social Science Perspectives On Choice
And Decision Making. World Scientific Publishing.
Duesenberry, J. (1949). Income, Saving and the Theory of Consumer Behavior. Cambridge, Mass: Harvard
University Press.
Durlauf, S. N., & Blume, L. E. (2008). Happiness Economics. In The New Palgrave Dictionary Of Economics
(2nd ed., Vol. 3, pp. 824-829). Palgrave Macmilian.
Easrerlin, R. A. (1974). Does Economic Growth Improve The Human Lot? Some Empirical Evidence.
Easterlin, R. A. (1995). Will Raising The Income Of All Increase The Happiness Of All? Journal of Economic
Behavior and Organization , 27, 35-47.
Easterlin, R. A., & Sawangfa, O. (2007). Happiness and Domain Satisfaction Theory and Evidence. IZA DP ,
2584.
Frey, B. S. (2002). What Can Economists Learn from Happiness Research? Journal of Economic Literature ,
40, 402-435.

Friedman, M. (1957). A Theory of the Consumption Function. Princeton, NJ: Princeton University Press.
Fuentes, N. A. (2001). Economic Theory And Subjective Well-Being: Mexico. Kluwer Academic Press.
Garcia, J. d., Fuentes, N. C., Borrego, S. A., Gutierrez, M. D., & Tapia, A. (2007). Values and Happiness In
Mexico: The Case Of The Motropolitan City of Monterrey. In L. Bruni, & P. L. Porta, Handbook On The
Economics Of Happiness (pp. 407-428). Edward Elgar Publishing Limited.
Hagerty, M. V. (2003). WEALTH AND HAPPINESS REVISITED, GROWING WEALTH OF NATIONS DOES GO
WITH GREATER HAPPINESS. Social Indicators Research.
Heady, B., Muffels, R., & Wooden, M. (2007). MONEY DOES NOT BUY HAPPINESS: OR DOES IT? A
REASSESSMENT BASED ON THE COMBINED EFFECTS OF WEALTH, INCOME AND CONSUMPTION (Vol. 87).
Soc Indic Research.
Heady, B., Veenhoven, R., & Weari, A. (1990). Top-Down Versus Bottom-Up Theories Of Subjective Well-
Being. Social Indicator Research , 401-420.
Hoorn, A. V. (2007). A Short Introduction To Subjective Well-Being: Its Measurement, Correlates and Policy
Uses. Nijmegen Center for Economics. Rome.
Inglehart, R. a. (2000). Genes, Culture, Democracy, And Happiness. Cambridge: MIT press.
Kenny, C. (1999). Does Growth Cause Happiness, Or Does Happiness Cause Growth? Kyklos.
Krejcie, R. V. (1970). Determining Sample Size For Research Activities. Educational and Psychological
Measurement , 607-610.
Layard, R. (2003). Lionel Robbins Memorial Lecturers 2002/3. London School of Economics.
Layard, R. (2005). Rethinking Public Economics: The Implications Of Rivalry And Habit. In L. Bruni And P.L.
Porta (Eds.) Economics And Happiness: Framing The Analysis. Oxford University Press.

Lomax, R. E. (2004). A Beginner's Guide To Structural Equation. Mahwah, New Jersey: Lawrence Erlbaum
Associates, Publishers.
Lyubomirsky, S., & Lepper, H. S. (1999). A Measure Of Subjective Happiness: Preliminary Reliability And
Construct Validation. Social indicators Research , 46, 137-155.
Lyubomirsky, S., King, L., & Diener, E. (2005). The Benefits of Frequent Positive Affect: Does Happiness Lead
to Success? Psychological Bulletin , 131, 803-855.
Oswald, J. A. (1997). Happiness and Economic Performance. Economic Journal .
Pavot, W., & Diener, E. (1993). Review Of Satisfaction With Life Scale. Psychological Assessment , 5, No. 2,
164-172.
Rojas, M. (2006). The Utility Of Happiness Research In Economics. Journal of Happiness Studies , 523-529.
Stutzer, A., & Lalive, R. (2001). The Role Of Social Work Norm In Job Searching And Subjective Well-Being.
IZA Discussion Papers , 300.
Veenhoven, R. (2005). Retrieved February 2010, from World Database of Happiness:
http://worlddatabaseofhappiness.eur.nl
Veenhoven, R. (1994). Correlates Of Happiness: 7837 Findings From 603 Studies In 69 Countries 1911-1994.
Erasmus University Press.
Veenhoven, R. (1988). The Utility Of Happiness. Social Indicators Research , 20, 333-354.

Figure 2. Relation between Policy makings, Happiness and its determinants [inspired of (Dowling, 2007) pp.182].

Figure 3. Path diagram of happiness elements
Figure 4. Economy and observable variables

Figure 5. Health and observable variables
Figure 6. Values and observable variables

Figure 7. Relation between latent variables and endogenous latent variable
Figure 8. Happiness and its determinants

Figure 9. Relationship between happiness and income
Figure 10. Relationship between happiness and relative income

Figure 11. Relationship between happiness and satisfaction with income
Figure 12 . Relationship between happiness and relative possessions

APPENDIX 1
Subjective Happiness Scale Instructions to participants: For each of the following statements and/or questions,
please circle the point on the scale that you feel is most appropriate in describing you.
1. In general, I consider myself:
1 2 3 4 5 6 7
not a very
a very happy
happy person
person
2. Compared to most of my peers, I consider myself:
1 2 3 4 5 6 7
less more
happy happy
3. Some people are generally very happy. They enjoy life regardless of what
is going on, getting the most out of everything. To what extent does this characterization describe
you?
1 2 3 4 5 6 7
not at a great
all deal
4. Some people are generally not very happy. Although they are not depressed,
they never seem as happy as they might be. To what extend does this characterization describe
you?
1 2 3 4 5 6 7
not at a great
all deal
NOTES 1 The perception of whether one has had a “happy life” arguably is powerfully
driven by cultural expectations. For example, in the United States, a happy life is
152 SONJA LYUBOMIRSKY AND HEIDI S. LEPPER
said to consist of good health, a good marriage, raising children, having a satisfying
career, and owning a home, preferably with a dog and a “white picket fence.”
Although a life characterized by these things might be “happy,” its protagonist might not.
2 A Russian translation of the scale is available from the first author.
3 It is worth noting that the stability coefficients for the one-item measures of
positive and negative mood (1 = not at all; 7 = extremely), collected in four of the
five studies, ranged from 0.00 to 0.43 (M = 0.22) – much lower than the stability
coefficients observed for the happiness scale. This finding suggests that responses
to the happiness measure cannot be attributed to respondents’ current mood

APPENDIX 2
The Satisfaction with Life Scale By Ed Diener, Ph.D.
DIRECTIONS: Below are five statements with which you may agree or disagree. Using
the 1-7 scale below, indicate your agreement with each item by placing the appropriate
number in the line preceding that item. Please be open and honest in your responding.
1 = Strongly Disagree
2 = Disagree
3 = Slightly Disagree
4 = Neither Agree or Disagree
5 = Slightly Agree
6 = Agree
7 = Strongly Agree
______1. In most ways my life is close to my ideal.
______2. The conditions of my life are excellent.
______3. I am satisfied with life.
______4. So far I have gotten the important things I want in life
______5. If I could live my life over, I would change almost nothing.

APPENDIX 3
Table 1: Descriptive Statistics
Variables Minimum Maximum Mean Std. Deviation
Age 20 70 28.37 9.522
Sex 2 3 2.42 .493
Education Level 1 7 4.63 1.535
Education Care 2 6 4.87 1.033
Marriage 3 5 4.43 .537
Marriage Care 2 4 3.34 .689
Eco. Level 20 100 64.24 15.390
Family Num. 1 6 2.76 .987
Happiness 20 100 71.78 19.496
Happ. Satisfaction 20 100 67.57 22.111
Happ. Yesterday 20 100 76.51 20.627
Happiness Compare 20 100 68.10 19.341
Family Satisfaction 40 100 84.52 15.242
Job Satisfaction 40 100 77.26 16.613
Property Compared 2 10 6.02 1.314
Income Compared 2 10 6.53 1.635
Eco. Change 2 10 6.25 3.072
Income 200 8000 1461.33 1754.025
Income Satisfaction 2 10 6.59 2.046
Health (subjective) 4 10 7.80 1.649
Doctor visits 2 8 3.41 1.619
Health Satisfaction 2 10 7.61 1.955
Health Care 2 10 8.45 1.786
Exercise 2 10 6.14 2.401
Religious attendance 2 10 4.53 2.134
Religious Doing 2 10 7.49 3.140
God Belief 4 10 9.85 .615
Government role 2 10 6.34 2.474
Goals Satisfaction 2 10 7.01 1.861
SWLS (SCALE) 0 35 20.20 7.296
Honesty 1 4 3.82 .458
Benevolence 1 4 3.57 .607
Being active 2 4 3.75 .458
Generously 1 4 3.39 .623
Wealthy 1 4 3.08 .806
Playful 1 4 3.34 .663
Contentment 1 4 3.24 .748
Family 1 4 3.83 .427
Scheduled 1 4 3.50 .677

Politics Involved 1 4 2.30 .998
Country Services 1 4 3.04 .951
Free speech 1 4 3.51 .724
Convenience lies 1 4 2.95 .873
Illicit sexual 1 4 2.98 1.019
Hijab wearing 1 4 2.77 1.094
Alcoholic beverages 1 4 2.83 1.136
Saving 1 4 3.37 .730
Happiness (SCALE) 1.00 7.00 4.6373 1.41332
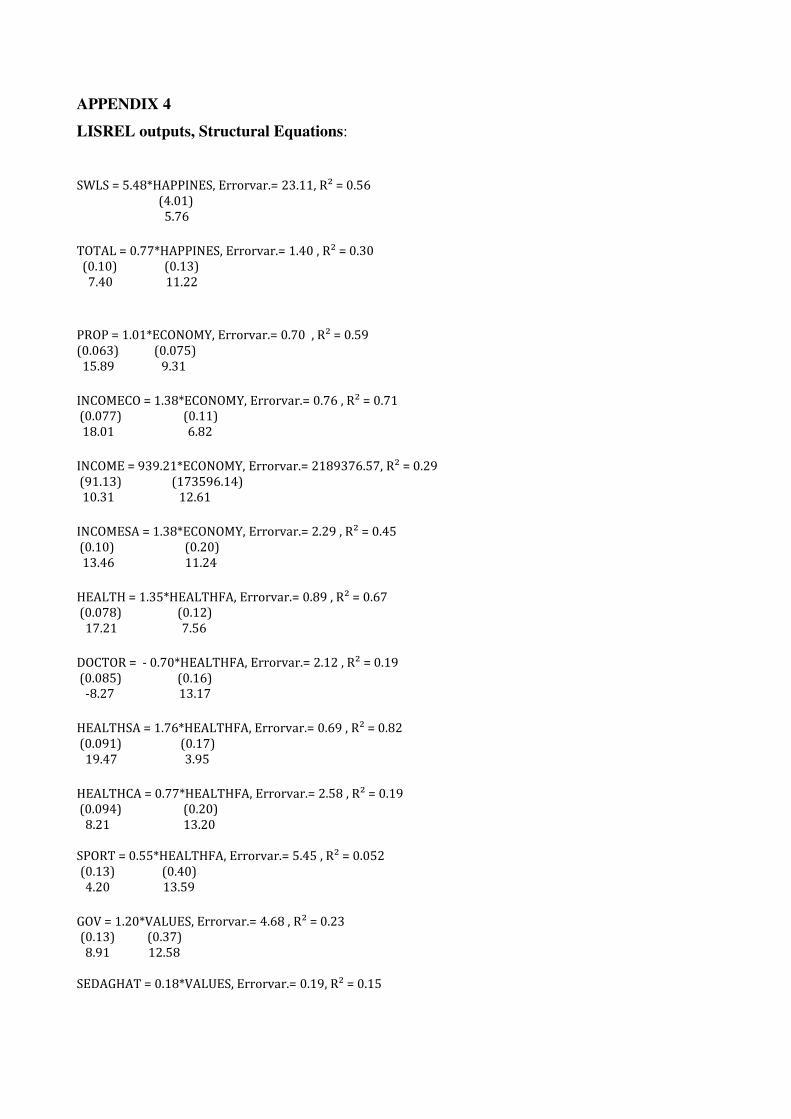
APPENDIX 4
LISREL outputs, Structural Equations:
SWLS = 5.48*HAPPINES, Errorvar.= 23.11, R² = 0.56 (4.01) 5.76 TOTAL = 0.77*HAPPINES, Errorvar.= 1.40 , R² = 0.30 (0.10) (0.13) 7.40 11.22 PROP = 1.01*ECONOMY, Errorvar.= 0.70 , R² = 0.59 (0.063) (0.075) 15.89 9.31 INCOMECO = 1.38*ECONOMY, Errorvar.= 0.76 , R² = 0.71 (0.077) (0.11) 18.01 6.82 INCOME = 939.21*ECONOMY, Errorvar.= 2189376.57, R² = 0.29 (91.13) (173596.14) 10.31 12.61 INCOMESA = 1.38*ECONOMY, Errorvar.= 2.29 , R² = 0.45 (0.10) (0.20) 13.46 11.24 HEALTH = 1.35*HEALTHFA, Errorvar.= 0.89 , R² = 0.67 (0.078) (0.12) 17.21 7.56 DOCTOR = - 0.70*HEALTHFA, Errorvar.= 2.12 , R² = 0.19 (0.085) (0.16) -8.27 13.17 HEALTHSA = 1.76*HEALTHFA, Errorvar.= 0.69 , R² = 0.82 (0.091) (0.17) 19.47 3.95 HEALTHCA = 0.77*HEALTHFA, Errorvar.= 2.58 , R² = 0.19 (0.094) (0.20) 8.21 13.20 SPORT = 0.55*HEALTHFA, Errorvar.= 5.45 , R² = 0.052 (0.13) (0.40) 4.20 13.59 GOV = 1.20*VALUES, Errorvar.= 4.68 , R² = 0.23 (0.13) (0.37) 8.91 12.58 SEDAGHAT = 0.18*VALUES, Errorvar.= 0.19, R² = 0.15

KHEYRKHA = 0.19*VALUES, Errorvar.= 0.33 , R² = 0.10 (0.034) (0.025) 5.74 13.35 AHLEKAR = 0.13*VALUES, Errorvar.= 0.20, R² = 0.075 SEKHAVAT = 0.22*VALUES, Errorvar.= 0.34 , R² = 0.13 (0.035) (0.026) 6.33 13.19 PULDARI = - 0.035*VALUES, Errorvar.= 0.65 , R² = 0.0019 (0.047) (0.047) -0.75 13.65 TAFRIH = 0.062*VALUES, Errorvar.= 0.43 , R² = 0.0088 (0.038) (0.032) 1.63 13.64 GHENAAT = 0.31*VALUES, Errorvar.= 0.46 , R² = 0.17 (0.041) (0.036) 7.52 12.95 FAMILY = 0.14*VALUES, Errorvar.= 0.17, R² = 0.11 TIME = 0.20*VALUES, Errorvar.= 0.42 , R² = 0.088 (0.038) (0.031) 5.27 13.40 SIYASAT = 0.62*VALUES, Errorvar.= 0.60 , R² = 0.39 (0.052) (0.053) 12.07 11.44 KHEDMAT = 0.68*VALUES, Errorvar.= 0.43 , R² = 0.52 (0.047) (0.043) 14.39 10.00 AZADIBAY = 0.15*VALUES, Errorvar.= 0.50 , R² = 0.045 (0.041) (0.037) 3.71 13.52 DORUGHMA = 0.30*VALUES, Errorvar.= 0.67 , R² = 0.12 (0.049) (0.051) 6.15 13.22 ERTEBATJ = 0.25*VALUES, Errorvar.= 0.98 , R² = 0.059 (0.059) (0.074) 4.18 13.19 HEJAB = 0.59*VALUES, Errorvar.= 0.85 , R² = 0.29 (0.059) (0.070) 10.05 12.25 MASHRUBA = 0.43*VALUES, Errorvar.= 1.10 , R² = 0.14 (0.063) (0.084) 6.78 13.07 SARFEJUE = 0.43*VALUES, Errorvar.= 0.34 , R² = 0.35

(0.038) (0.029) 11.38 11.81