The effects of diet and geographic ancestry on drug ...
283
The effects of diet and geographic ancestry on drug- metabolising enzyme activity in Europeans and South Asians By Shane K. Eagles BMedSc MPharm A thesis submitted to fulfil requirements for the degree of Doctor of Philosophy The University of Sydney Faculty of Pharmacy 2018
Transcript of The effects of diet and geographic ancestry on drug ...
The effects of diet and geographic ancestry on drug-
metabolising enzyme activity in Europeans and South
Asians
By Shane K. Eagles
BMedSc MPharm
A thesis submitted to fulfil requirements for the degree of Doctor of Philosophy
The University of Sydney
Faculty of Pharmacy
2018

ii
Preface
This thesis is the result of original investigations carried out by Shane K. Eagles within the
Faculty of Pharmacy, at the University of Sydney, under the supervision of Professor Andrew
McLachlan and Adjunct Associate Professor Annette Gross. This thesis has not been
submitted for award of a degree at any other university. Human research ethics approval
has been obtained for the studies described in this thesis. Full acknowledgement has been
made where the work of others has been used or cited. A list of conference presentations in
support of this thesis is included.
Shane K. Eagles

iii
Acknowledgements
There is a long and varied list of people to thank through whom this research was made
possible. Firstly, I would like to acknowledge the Peter Coates Postgraduate Scholarship in
Ethnopharmacology. Dr Peter Coates was an international leader in clinical pharmacology,
global drug development and academic collaboration. This joint venture in honour of his
name and work, between GlaxoSmithKline and the University of Sydney, has given me the
opportunity to conduct the research presented in this thesis, for which I am extremely
grateful.
I would like to thank both of my supervisors, Professor Andrew McLachlan and Adjunct
Associate Professor Annette Gross for taking a chance on me, a curious Community
Pharmacist with minimal research experience, and providing the resources and means to
conduct this project. Your advice, time and patience throughout the years has been
appreciated, and will not be forgotten.
I crossed paths with many people while based at Concord Repatriation General Hospital.
Thank you to Dr Lisa Pont, Dr Alessandra Warren and Associate Professor Victoria Cogger for
your advice, support, friendly smiles and company throughout those disorientating initial
years of my candidature. Thank you also to the various students who moved through
Building 4, ANZAC 3 over the years: Michael Dolton, Atheer Nassir, Christina Abdel Shaheed,
Jade Fox and Rayan Nahas; your company and sympathetic ears helped more than you likely
know. Further, I would like to thank my co-worker, Bei Lun-Lin, for her assistance with
sample collection during the first phase of the clinical study, and also for helping with the
initial aspects of the cocktail assay’s development.
iv
I would like to acknowledge and sincerely thank the Andrology team at Concord Hospital led
by Leo Turner, who were instrumental in making the clinical study possible. Thank you very
much to Leo, Sasha Savkovic, Carolyn Fennell and Glenda Fraser for assisting with
participant logistics and performing sample collection on the numerous study days. Thank
you also to Irene Di Pierro, Feyrouz Bacha and Ljubica Vrga for the friendly and extremely
generous way in which you helped with sample processing and storage. I would like to
acknowledge and thank Toni Cavalletto and Professor Fiona Blyth for organising and
facilitating the movement of the clinical study to the Concord Medical Education Centre in
2016. Further, a huge thank you to Associate Professor Vasi Naganathan and his team in
Geriatrics for providing the on-call clinical support and assisting with sample collection
throughout this study. And of course, thank you to all of the healthy volunteers for your
participation in the clinical study. I definitely could not have done this without you!
A huge thank you to Dr Sussan Ghassabian—your guidance and openness to help a
struggling student was invaluable, and your advice helped me overcome many obstacles in
developing my bioanalytical methods. Similarly, a big thank you to Dr Mohi Iqbal
Mohammed Abdul for passing on valuable experience in bioanalytical method development.
Thank you also to Padmaja Dhanvate and Dr Sarah Cui for their efforts in orientating and
training me on LC-MS/MS systems. Also, I would like to acknowledge Professor Alan Boddy
for his advice, mentorship and constant positive demeanour, accompanied by his rigour of
the scientific method and its application to clinical pharmacology. To Dr Xiao Suo Wang—
your guidance, expertise, friendship and professionalism enabled me to learn how to use
UHPLC-MS/MS systems and complete my analyses, for which I am forever grateful. Thank
you also to Dr Mario D’Souza for patiently and kindly teaching me the principles of mixed-

v
effects modelling and advanced statistics, which greatly enhanced the analysis of my clinical
study data.
Thank you to my immediate family and my second family, the Légerets, for believing in me
and what I am capable of. Your love and support gave me the strength to carry on.
Lastly, and most importantly, thank you Colette. From the deepest recesses of my soul,
thank you. You held me when bad unexpectedly became worse. You strengthened me when
nothing else would. You laughed and wept beside me and supported me through it all,
whether I deserved it or not. You pushed me when nothing else would move me, and you
lifted me and us up no matter how heavy this burden became. This is as much your doctoral
candidature as it as mine. Thank you for your steadfast love and support over relentlessly
impossible years. You are my all.

vi
Conference presentations in support of this thesis
• Eagles SK, Gross AS and McLachlan AJ (2013). The effect of broccoli consumption on
the activity of drug-metabolising enzymes in Europeans and South Asians: Study
protocol. Poster presentation at ASCEPT conference, Melbourne (poster no. 559).
• Eagles SK (2013). The effect of broccoli consumption on the activity of drug-
metabolising enzymes in Europeans and South Asians: Study protocol. Oral
presentation at the University of Sydney Postgraduate Research Showcase.
• Eagles SK (2015). Variability in response to medicines: a focus on diet, ethnicity and
drug metabolism. Invited seminar, ANZAC Institute, Concord Repatriation General
Hospital.
• Invited speaker at the University of Sydney Bosch Institute Facilities User Group
Meeting, 2015: Variability in response to medicines: a focus on diet, ethnicity and
drug metabolism.
• Invited speaker at Agilent conference in Sydney, 2017: Eagles SK, Wang, XS, Lin B-L,
Gross AS and McLachlan AJ. An updated and optimised version of the “Inje” and
“Ghassabian” cocktails: a simplified and highly sensitive UHPLC-MS/MS CYP-
phenotyping cocktail assay in human plasma.

vii
List of abbreviations and symbols
Abbreviation Definition
137X 1,3,7-trimethylxanthine (caffeine)
17U 1,7-dimethyluric acid
17X 1,7-dimethylxanthine (paraxanthine)
1U 1-methyluric acid
1X 1-methylxanthine
ADME Absorption, distribution, metabolism and elimination
AFMU 5-acetylamino-6-formylamino-3-methyluracil
AhR Aryl hydrocarbon receptor
ALFRED The Allele Frequency Database
ANZCTR Australian New Zealand Clinical Trials Registry
APAP N-acetyl-p-aminophenol
APAPC Paracetamol cysteine
APAPG Paracetamol glucuronide
APAPM Paracetamol mercapturate
APAPS Paracetamol sulfate
AUC Area under the concentration-time curve
BMI Body mass index
BPA Bisphenol A
CAF Caffeine
CAR Constitutive androstane receptor
CDNB 1-chloro-2,4-dinitrobenzene
CENTRAL Cochrane Central Register of Controlled Trials
CI Confidence interval
CL Clearance
CNV Copy number variation
CONSORT Consolidated Standards of Reporting Trials
CRGH Concord Repatriation General Hospital
CV% Coefficient of variation; (SD/mean)*100
CYP Cytochrome P450
D1 Study Day 1
D2 Study Day 2
D9 Study Day 9
DNA Deoxyribonucleic acid
DXM Dextromethorphan
DXR Dextrorphan
EM Extensive metaboliser
EMM Estimated marginal means
EXP Losartan carboxylic acid
FDA Food and Drug Administration
GEMM Geometric estimated marginal means
GIT Gastrointestinal tract

viii
GSH Glutathione
GST Glutathione S-transferases
HLB Hydrophillic-lipophillic balance
HNF4α Hepatocyte nuclear factor 4α
HPLC High-performance liquid chromatography
HREC Human Research Ethics Committee
ICH International Council for Harmonisation
ICTRP International Clinical Trials Registry Platform
ID Identification
ILIS Isotopically-labelled internal standard
IM Intermediate metaboliser
IS Internal standard
ITC Isothiocyanate
LC Liquid chromatography
LC-MS/MS Liquid chromatography-tandem mass spectrometry
LLOQ Lower limit of quantification
LOS Losartan
LSD Least-significant difference
LSM Least-squares mean
MALDI-TOF Matrix-assisted laser desorption ionisation-time of flight
MCR Metabolic clearance (dose/AUC)
MD Mean difference; the mean of the differences (Y - X)
MR Mean ratio; the mean of the quotient (X/Y)
MRM Multiple reaction monitoring
MRP2 Multi-drug resistance protein 2
MS Mass spectrometry
NAT N-acetyltransferase
NBD-Cl 7-chloro-4-nitrobenz-2-oxa-1,3-diaxole
ncRNA Non-coding RNAs
NSW New South Wales
OATP Organic anion-transporting polypeptide
OCT Organic cation transporter
OH-OME 5-hydroxyomeprazole
OME Omeprazole
PAR Paraxanthine
PCR Polymerase chain reaction
PEITC Phenethyl isothiocyanate
P-gp P-glycoprotein
PIS Participant Information Sheet
PM Poor metaboliser
PXR Pregnane X receptor
QC Quality control
QLD Queensland
RE Relative error; (X/Y)*100
ix
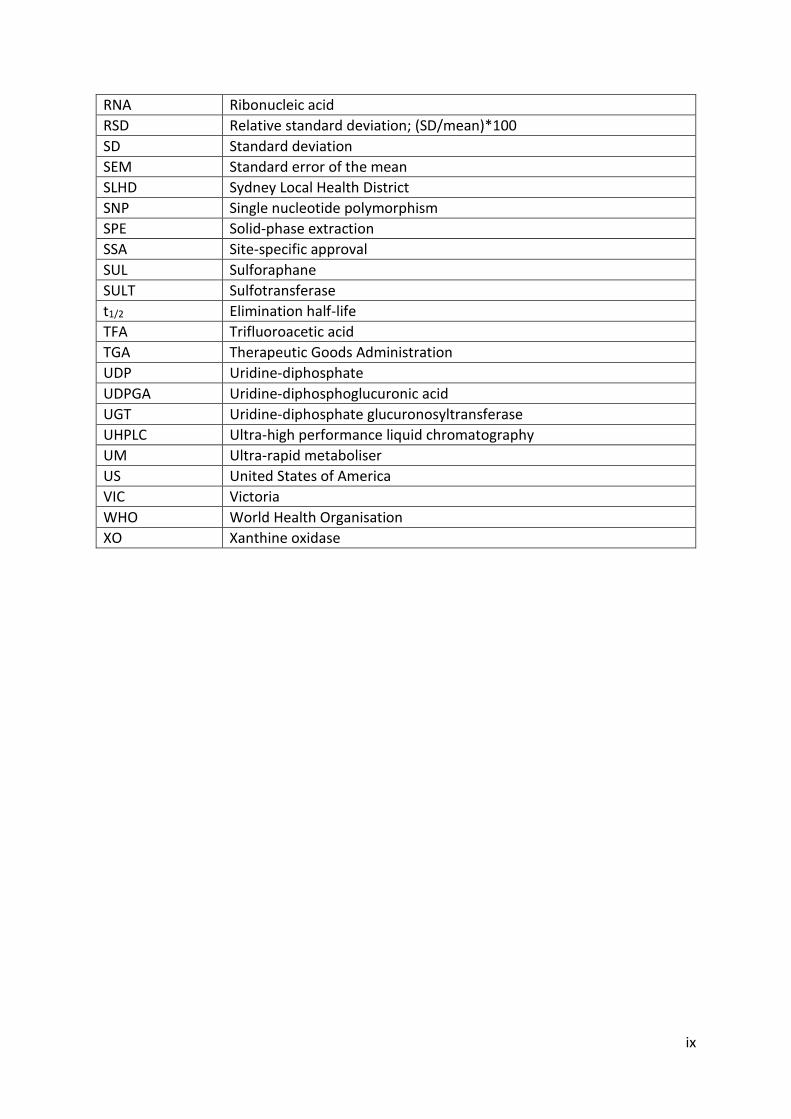
RNA Ribonucleic acid
RSD Relative standard deviation; (SD/mean)*100
SD Standard deviation
SEM Standard error of the mean
SLHD Sydney Local Health District
SNP Single nucleotide polymorphism
SPE Solid-phase extraction
SSA Site-specific approval
SUL Sulforaphane
SULT Sulfotransferase
t1/2 Elimination half-life
TFA Trifluoroacetic acid
TGA Therapeutic Goods Administration
UDP Uridine-diphosphate
UDPGA Uridine-diphosphoglucuronic acid
UGT Uridine-diphosphate glucuronosyltransferase
UHPLC Ultra-high performance liquid chromatography
UM Ultra-rapid metaboliser
US United States of America
VIC Victoria
WHO World Health Organisation
XO Xanthine oxidase
x
Abstract
Drug metabolism is a major determinant of variability in response to medicines. Factors
affecting the activity of drug-metabolising enzymes can be classified as intrinsic, such as
genetics, or extrinsic, such as diet. The effects of genetics and diet on cytochrome P450
(CYP) activity can be different between people of different geographic ancestry, and very
few studies exist that explore these interactions simultaneously. Overall, this thesis
examines how cruciferous vegetable-enriched diets, genetics and CYP activity interact to
explain variability in drug response between Europeans and South Asians.
The aims of this thesis were to:
1. Review the relevant literature and form a theoretical framework supporting the
hypotheses tested in this thesis;
2. Conduct a systematic review with meta-analyses of trials investigating the impact of
cruciferous vegetable dietary intervention trials on drug metabolism;
3. Design, optimise and validate a UHPLC-MS/MS CYP-phenotyping cocktail assay in
human plasma for CYP1A2, CYP2C19, CYP2C9, CYP2D6 and CYP3A4;
4. Design, optimise and validate a UHPLC-MS/MS sulforaphane assay in human plasma;
and
5. On the back of hypotheses generated from the systematic review, design and
conduct a controlled, 3-period crossover trial that aimed to:
a. Investigate the short-term and medium-term effects of a broccoli-enriched
diet on CYP1A2, CYP2C19, CYP2C9, CYP2D6 and CYP3A4 activities;
b. Establish if the above effects vary between those of European and South
Asian ancestry;

xi
c. Confirm that CYP1A2 is induced in Europeans on a broccoli-enriched diet,
with no or a reduced change in South Asians; and
d. Explore the contribution of diet, genetics and geographic ancestry on
variability in CYP1A2, CYP2C19, CYP2C9, CYP2D6 and CYP3A4 activities.
In Chapter 2, n = 23 studies were identified that met the systematic inclusion criteria. Drug-
metabolising enzymes represented in the literature included CYPs, UGTs, GSTs, NAT and
xanthine oxidase. The type of cruciferous vegetable interventions, choice of phenotyping
metrics and choice of probe drugs were highly heterogeneous, except for CYP1A2 and GST-
α. Meta-analysis was possible for CYP1A2 and GST-α due to the number and nature of the
studies that investigated these enzymes. Their activities were significantly increased by 15-
40% after a cruciferous vegetable interaction. Dose-response relationships were established
between cruciferous vegetable consumption and CYP1A2, GST-α and UGT1A1 activities.
Critical analysis revealed that only 48% of the studies included a panel of high-quality
characteristics in their design. Results from this review were used to formulate testable
hypotheses in Chapter 5.
Chapter 3 outlines the design, optimisation and validation of a CYP-phenotyping cocktail
assay that was needed to analyse samples from the crossover trial reported in Chapter 5.
Samples were analysed using an Agilent 1290 infinity LC system in tandem with 6460A triple
quadrupole mass spectrometers. Separation of the analytes was achieved with an Agilent
Zorbax Eclipse XDB-C18 (4.6 x 50 mm, 1.8 μm) column fitted with a Zorbax Eclipse XDB-C18
(4.6 x 5.0 mm, 1.8 μm) guard column. Standard curves for all analytes were linear over wide
plasma concentration ranges (0.78-3000 ng/mL) and the methods met guideline-
recommended requirements for specificity, sensitivity (analyte LLOQs 0.78-23.4 ng/mL),
xii
accuracy (intra-day RE % nominal concentration 90.7-110.2; inter-day RE % 87.0-110.5) and
precision (intra-day analyte RSD % 0.46-11.4%; inter-day RSD % 1.36-11.2). Recovery and
matrix effects were also investigated and concluded to be non-interfering. This improved
CYP cocktail assay has been used successfully used to phenotype n = 21 participants of
European and South Asian ancestry as reported in Chapter 5.
Similarly, a UHPLC-MS/MS assay was designed, optimised and validated to measure
sulforaphane (SUL) in human plasma. Retention times for SUL and the internal standard
were 3.42 min and 4.42 min, respectively. The lower-limit of quantification (LLOQ) for SUL
was 0.78 ng/mL (7.8 pg on-column). All QCs had intra-day accuracy (RE) and precision (RSD)
ranging between 86.4-106.7% and 2.61-10.3% respectively. Inter-day accuracy and precision
ranged between 91.3-97.0% and 3.99-7.11% respectively. Recovery was low and matrix
effects high, but their consistency meant that quantification of SUL was not impeded. The
assay was successfully used to analyse SUL in 21 participants (> 150 plasma samples) in the
above-mentioned clinical trial.
Chapter 5 reports and discusses the results from a controlled, dietary intervention crossover
trial in Europeans and South Asians. A 500 g broccoli meal was consumed immediately
before CYP phenotyping, and 500 g twice daily was consumed for a further six days before
final CYP phenotyping. Diets high in CYP1A2 inducer foods were more prevalent in
Europeans, whereas a predominantly curry diet was more common in the South Asian
cohort. CYP1A2 activity was approximately 20% higher in Europeans after following a
broccoli-enriched diet for six days, but this was not seen in South Asians. CYP2C19 activity
was significantly related to genotype, and there was evidence of inhibition on Study Day 2
(D2) followed by a rebound in activity by the end of the study at Study Day 9 (D9). The

xiii
CYP2C19*2 null allele showed a dose-response relationship with CYP2C19 activity. Within
CYP2C19*1C and CYP2C19*17 genotype groups, enzyme activity was higher in Europeans
than South Asians. CYP2C9 activity increased on D2 immediately after a broccoli meal and
decreased back to baseline by the end of the study on D9. Interestingly, South Asians had
nearly 2-fold higher CYP2C9 activity throughout the study, even within variant genotype
groups. CYP2D6 activity was variable, and SNP genotype alone was not a significant
predictor of activity in the three mixed-effects models used in its analysis. Of note, enzyme
activity was 2- to 3-fold higher in Europeans than South Asians within CYP2D6*4 and
CYP2D6*10 genotypes, as well as for those that had n = 1 copy of the CYP2D6 gene. No
significant interactions or changes were seen in CYP3A4; however, variability was large, and
post hoc sample size and power calculations suggest that more participants are needed
when investigating this enzyme.
Chapter 5 also discusses ancestry group differences in the exposure of the cruciferous
vegetable constituent SUL, which is an inducer of drug-metabolising enzymes. A
predominantly curry diet, GSTM1 and GSTP1 genotypes were significant predictors of SUL
exposure. There was no evidence of a difference in SUL exposure between the two ancestry
groups when statistically controlled for genotype and diet. The 4-h SUL plasma
concentration-time point had a near 1:1 correlation with the AUC0-8 h, with the former being
recommended as an ITC exposure metric in future studies.
Overall, this thesis presents novel findings regarding how cruciferous vegetables, dietary
practices, genetics and geographic ancestry interact to explain variability in drug
metabolism. Future studies in this area are encouraged to simultaneously measure a variety
of both intrinsic and extrinsic factors in ancestry group difference studies.

xiv
Recommendations are made for future research in this area, with specific guidance on study
design and selection of high-quality characteristics.

1
Table of Contents Preface .......................................................................................... ii
Acknowledgements ....................................................................... iii
Conference presentations in support of this thesis ........................ vi
List of abbreviations and symbols ................................................. vii
Abstract ......................................................................................... x
1 Introduction and background .................................................... 6
1.1 Variability in response to medicines ..................................................... 6
1.1.1 Intrinsic and extrinsic factors ............................................................................... 7
1.2 Geographic ancestry ............................................................................. 9
1.3 Variability in pharmacokinetics ........................................................... 11
1.3.1 Drug-metabolising enzymes .............................................................................. 11
1.3.1.1 Cytochromes P450 ................................................................................................ 11
1.3.1.1.1 CYP1A2 ............................................................................................................................ 12
1.3.1.1.2 CYP2C19 and CYP2C9 ...................................................................................................... 13
1.3.1.1.3 CYP2D6 ............................................................................................................................ 16
1.3.1.1.4 CYP3A4 ............................................................................................................................ 19
1.3.1.2 Uridine 5’-diphospho-glucuronosyltransferases ................................................... 21
1.3.1.3 Glutathione S-transferases ................................................................................... 25
1.4 Transporters ....................................................................................... 26
1.5 Epigenetics ......................................................................................... 28
1.6 Measuring variability in drug-metabolising enzyme activity ............... 29
1.6.1 Simultaneous phenotyping of multiple CYP-isoenzymes: the ‘cocktail’ approach
29
1.7 Diet as an extrinsic source of variability in drug metabolism .............. 31
1.7.1 Cruciferous vegetables and their constituents .................................................. 31
1.8 Differences in CYP activity between Europeans and South Asians ...... 35
1.8.1 Differences in CYP SNP frequencies between Europeans and South Asians..... 36
1.8.2 Differences in diet and CYP activity between Europeans and South Asians ..... 40
1.9 Thesis objectives and outline .............................................................. 41

2
2 The effects of cruciferous vegetable-enriched diets on drug
metabolism: a systematic review and meta-analysis of dietary
intervention trials in humans ....................................................... 44
2.1 Introduction ....................................................................................... 44
2.2 Methods ............................................................................................. 46
2.2.1 Databases and searches ..................................................................................... 46
2.2.2 Assessment of study eligibility ........................................................................... 46
2.2.3 Data extraction and study quality assessment .................................................. 47
2.2.4 Statistical analyses ............................................................................................. 48
2.3 Results ................................................................................................ 50
2.3.1 Database search results ..................................................................................... 50
2.3.2 Nature of cruciferous vegetable dietary interventions ..................................... 55
2.3.3 Drug-metabolising enzymes and probe drugs assessed .................................... 55
2.3.4 Changes in drug-metabolising enzyme activity ................................................. 62
2.3.5 Study design, quality and critical analysis.......................................................... 68
2.3.6 Discussion ......................................................................................... 70
2.3.7 Conclusions ...................................................................................... 75
3 An improved and optimised version of the ‘Inje’ and
‘Ghassabian’ cytochrome P450-phenotyping cocktails: a simplified
and highly sensitive UHPLC-MS/MS cocktail assay in human plasma
77
3.1 Introduction ....................................................................................... 77
3.2 Methods ............................................................................................. 78
3.2.1 Chemicals and reagents ..................................................................................... 78
3.2.2 Stock and working solutions .............................................................................. 78
3.2.3 Chromatographic conditions ............................................................................. 79
3.2.4 Mass spectrometer settings .............................................................................. 79
3.2.5 Method validation.............................................................................................. 81
3.2.6 Sample preparation and analyte extraction ...................................................... 82
3.2.7 Clinical application ............................................................................................. 83
3.2.8 CYP-phenotyping and pharmacokinetic analyses .............................................. 84
3.3 Results ................................................................................................ 84

3
3.3.1 Selectivity and sensitivity ................................................................................... 84
3.3.2 Calibration curves and linearity ......................................................................... 85
3.3.3 Accuracy and precision ...................................................................................... 85
3.3.4 Recovery and matrix effects .............................................................................. 85
3.3.5 Clinical application of assay ............................................................................... 86
3.4 Discussion ........................................................................................... 91
3.5 Conclusions ........................................................................................ 94
4 An improved UHPLC-MS/MS assay for measuring sulforaphane
in human plasma following a broccoli-enriched diet ..................... 95
4.1 Introduction ....................................................................................... 95
4.2 Methods ............................................................................................. 97
4.2.1 Chemicals and reagents ..................................................................................... 97
4.2.2 Stock and working solutions .............................................................................. 97
4.2.3 Chromatographic conditions ............................................................................. 97
4.2.4 Mass spectrometer settings .............................................................................. 98
4.2.5 Method validation.............................................................................................. 99
4.2.6 Sample preparation and analyte extraction .................................................... 100
4.2.7 Clinical application ........................................................................................... 100
4.3 Results .............................................................................................. 102
4.3.1 Selectivity and sensitivity ................................................................................. 102
4.3.2 Calibration curves, linearity, accuracy and precision ...................................... 103
4.3.3 Recovery and matrix effects ............................................................................ 104
4.3.4 Clinical application of assay ............................................................................. 105
4.4 Discussion ......................................................................................... 106
4.5 Conclusions ...................................................................................... 108
5 The effects of broccoli consumption, sulforaphane exposure and
genetics on the activity of drug-metabolising enzymes in people of
European and South Asian ancestry ........................................... 109
5.1 Introduction ..................................................................................... 109
5.2 Methods ........................................................................................... 111
5.2.1 Participants ...................................................................................................... 111
5.2.2 Study design ..................................................................................................... 114

4
5.2.3 Broccoli procurement and preparation ........................................................... 116
5.2.4 CYP-phenotyping procedure ............................................................................ 117
5.2.5 Analytical methods .......................................................................................... 118
5.2.6 Genotyping ....................................................................................................... 118
5.2.7 Data and statistical analyses ............................................................................ 119
5.2.7.1 Sample size calculations ...................................................................................... 119
5.2.7.2 Pharmacokinetic analyses ................................................................................... 121
5.2.7.3 Food diary analyses ............................................................................................. 121
5.2.7.4 Statistical analyses .............................................................................................. 121
5.3 Results .............................................................................................. 124
5.3.1 Participant demographics ................................................................................ 124
5.3.2 Dietary data...................................................................................................... 124
5.3.3 Sulforaphane exposure .................................................................................... 128
5.3.4 CYP activity ....................................................................................................... 133
5.3.4.1 CYP1A2 ................................................................................................................ 133
5.3.4.1.1 Caffeine ......................................................................................................................... 133
5.3.4.1.2 Paraxanthine ................................................................................................................. 137
5.3.4.1.3 CYP1A2 activity.............................................................................................................. 137
5.3.4.2 CYP2C19 .............................................................................................................. 141
5.3.4.2.1 Omeprazole ................................................................................................................... 141
5.3.4.2.2 5-hydroxyomeprazole ................................................................................................... 146
5.3.4.2.3 CYP2C19 activity ............................................................................................................ 146
5.3.4.3 CYP2C9 ................................................................................................................ 153
5.3.4.3.1 Losartan ......................................................................................................................... 153
5.3.4.3.2 Losartan carboxylic acid ................................................................................................ 153
5.3.4.3.3 CYP2C9 activity .............................................................................................................. 157
5.3.4.4 CYP2D6 ................................................................................................................ 161
5.3.4.4.1 Dextromethorphan ....................................................................................................... 161
5.3.4.4.2 Dextrorphan .................................................................................................................. 161
5.3.4.4.3 CYP2D6 activity ............................................................................................................. 164
5.3.4.5 CYP3A4 ................................................................................................................ 166
5.3.4.5.1 Midazolam..................................................................................................................... 166
5.3.4.5.2 α-hydroxymidazolam .................................................................................................... 166
5.3.4.5.3 CYP3A4 activity.............................................................................................................. 171
5.3.5 Genetics ........................................................................................................... 173
5.4 Discussion ......................................................................................... 174

5
5.5 Conclusions ...................................................................................... 181
6 Overall conclusions and closing comments ............................ 182
7 References ............................................................................ 189
8 Appendices ........................................................................... 219
8.1 Systematic review search terms and strategy ................................... 219
8.2 Systematic review data extraction sheet .......................................... 221
8.3 National Ethics Application Form (NEAF) approval ........................... 222
8.4 Site-specific Approval (SSA) approval ............................................... 223
8.5 ANZCTR registration details .............................................................. 224
8.6 TGA CTN approval ............................................................................ 225
8.7 Eligibility questionnaire .................................................................... 226
8.8 Participant consent form .................................................................. 230
8.9 Participant Information Sheet (PIS) .................................................. 231
8.10 Approved clinical study advertisement ............................................. 238
8.11 First participant 3-day food diary ..................................................... 239
8.12 Second 3-day food diary (D6-D8) ...................................................... 241
8.13 Study day medical support protocol ................................................. 243
8.14 Participant broccoli hand-out ........................................................... 245
8.15 DNA purification and extraction ....................................................... 246
8.16 List of ADME iPLEX gene variants...................................................... 248
8.17 SPSS mixed-effects model syntaxes .................................................. 249
8.18 Dextromethorphan and dextrorphan AUC data and CYP2D6 activity by
genotype ..................................................................................................... 252
8.19 Allele frequencies by ancestry .......................................................... 260

6
1 Introduction and background
The aim of Chapter 1 is to review and summarise the relevant literature required to
construct a rationale supporting the objectives of this thesis (section 1.9). Many topics are
covered in this chapter, some more relevant to the thesis objectives than others. However,
all aspects of clinical pharmacology reviewed and summarised herein have been chosen
because of their importance to the overall goal of this thesis: to better understand how
geographic ancestry, genetics and diet contribute to variability in drug metabolism.
1.1 Variability in response to medicines
Medicines display significant variability in a given group of people. In fact, one of the
reasons that society needs healthcare professionals and biomedical researchers is because
of this variability: if everyone had the same response to a particular dose of a particular
drug, then pharmacotherapy would be a simpler affair. However, variability is rampant in
pharmacology—as it is in the other biomedical sciences—and understanding the nature and
causes of this variability is important, as this knowledge can be translated into improved
patient outcomes through the safe and efficacious use of medicines (Sorich & McKinnon,
2012).
Patient variability in response to medicines can be thought of as being made up of two over-
arching subtypes of variability, namely: variability in pharmacokinetic processes, i.e. intra-
/inter-subject differences in the absorption, distribution, metabolism and elimination of
drugs; and variability in pharmacodynamic processes, i.e. intra-/inter-subject differences in
drug targets and (patho)physiological processes. These subtypes of variability can be further
subdivided again, for example, variability in drug absorption can be explained in terms of
intra-/inter-person differences in gastric acidity, gastric emptying rate, intestinal transit

7
time, and so on (Figure 1.1). With unlimited time and resources, all of these avenues could
be comprehensively explored and commented on, which is the ultimate prerequisite for
functioning personalised medicine. For the purposes of this thesis, however, the scope will
be limited to better understanding how various intrinsic and extrinsic factors affect
variability in drug metabolism, as a subset of variability in pharmacokinetics.
Figure 1.1: Variability in response to medicines. This schematic lists some of the contributors to variability and their hierarchical sub-categories.
1.1.1 Intrinsic and extrinsic factors
The types of factors that affect drug metabolism in humans can be categorised as either
intrinsic or extrinsic (Huang & Temple, 2008) (Figure 1.2). Intrinsic factors encompass those
that are either hard to or cannot be changed, for example, age, geographic ancestry (see
section 1.2), genetics and sex, whereas extrinsic factors are those that are environmental
and usually modifiable, such as smoking, alcohol consumption, drug-drug/herb-drug/food-
drug interactions and diet.
Variability in response to medicines
Pharmacokinetics
Drug metabolism Transporters
Pharmacodynamics
Drug targets Physiology

8
Thus far, in the context of understanding variability in drug metabolism, the intrinsic factor
genetics has received the most attention (Bjornsson et al., 2003). Specifically, variability
arising from single nucleotide polymorphisms (SNPs) in genes that encode drug-
metabolising enzymes has been the focus (Yang, 2015). This approach follows on from the
central dogma, i.e. genes encode proteins; enzymes are proteins, therefore understanding
the genes that code for drug-metabolising enzymes should explain the observed variability
in their activity. However, inter-individual differences in SNPs do not explain all of the
variability in drug metabolism, and far less is known about the contributions of diet and the
environment.
The effect of genetics on drug-metabolising enzyme activity is discussed below in the
various sub-sections of section 1.3.1. Diet, one of the most important and poorly-
understood extrinsic factors, is discussed below in section 1.2.
Figure 1.2: Intrinsic and extrinsic factors that influence variability in response to medicines. Adapted from Huang and Temple (2008).
Drug-drug interactions
Smoking status & alcohol
consumption
Differences in drug regulation by
relevant bodiesDiet
Other environmental
factorsAge
Geographic ancestry Pregnancy/lactation
Sex Genetics

9
1.2 Geographic ancestry
Intrinsic and extrinsic factors that affect drug metabolism tend to ‘clump’ together in
packages that are often inherited and shared by sociocultural groups with a common
geography. This idea often appears in the pharmacological literature under the guise of
‘race’ or ‘ethnicity’. The use of these words in human biological studies and their underlying
meaning and implications have been recently discussed by Yudell et al. (2016) in the
prestigious journal, Science. Yudell and colleagues describe the use of race and ethnicity as
biological concepts as being “…problematic at best and harmful at worst”. Their reasoning is
sound: these concepts are actually social constructs as opposed to scientifically meaningful
categories used to study population genetics, and cause great confusion when used in
biological research. This “non-scientific misuse” of race and ethnicity makes it difficult, and
sometimes impossible, to compare methodologies and data across population genetics
studies. The list of issues that the use of these terms creates is growing: Yudell et al.
mention difficulties with the interpretation of racial and ethnic effects (Kaufman & Cooper,
2001), problems with making distinctions between self-identified/assigned and assumed
racial categories (Rebbeck & Sankar, 2005), and “the haphazard use and reporting of
racial/ethnic variables in genetic research” (Hunt & Megyesi, 2008). The suggested solution
by Yudell et al. is the term “ancestry”, specifically “geographic ancestry”. Ancestry is a term
with scientific intent and purpose: it defines how we relate to others through genealogical
history as a “process-based” concept, whereas race is a “pattern-based” concept that leads
people awry by encouraging misinterpretation of themes and data in contemporary studies.

10
Therefore, throughout this thesis, when discussing collections of intrinsic and extrinsic
factors between groups of people, who are linked through genealogical history, the term
‘geographic ancestry’ (‘ancestry’ for short) will be used instead of race or ethnicity.
Importantly, genetics and diet vary extensively both within and between those of different
ancestries, and few studies simultaneously investigate their interaction and effects on drug
metabolism. The following sections introduce drug-metabolising enzymes (section 1.3.1),
the various intrinsic and extrinsic factors that affect them (sections 1.3 and 1.7), and how
these factors differ between ancestry groups (section 1.8). In the literature, some ancestry
groups are better represented than others. Section 1.8 describes this in detail, highlighting
that knowledge gaps exists for South Asian individuals relative to other groups, such as
Europeans and East Asians.
11
1.3 Variability in pharmacokinetics
1.3.1 Drug-metabolising enzymes
Drug-metabolising enzymes are important because of their effect on the clearance of
medicines, which in turn is a significant contributor to variability in response to medicines
(Zanger et al., 2014; Zanger & Schwab, 2013). In fact, the first 3 sub-families of the
cytochrome P450 (CYP) superfamily of drug-metabolising enzymes have been estimated to
be involved in approximately 80% of oxidative drug metabolism, and almost 50% of the
overall elimination of commonly used drugs (Wilkinson, 2005). For this reason, this thesis
will focus on the CYPs and how diet, genetics and ancestry affect their activity. Other phase
II conjugating enzymes are discussed too, as relevant to the thesis objectives set out in
section 1.9.
1.3.1.1 Cytochromes P450
It has been estimated that over 90% of drugs are metabolised to some extent by five of the
main CYP drug metabolising enzymes: CYP1A2, CYP2C19, CYP2C9, CYP2D6 and CYP3A4
(Rodrigues, 1999). Ulrich M. Zanger and colleagues have dedicated decades of work to
better understanding how the CYPs function, and what causes variability in their activity
both within and between individuals. Variability in CYP activity is well known to be
exorbitant; enzyme activity can vary 100-fold and more across the various isoenzymes.
The following five sections of this thesis are dedicated to discussing these five CYP enzymes,
their genetic variability and function, with reference to the two recent, comprehensive
reviews published by Zanger et al. (Zanger et al., 2014; Zanger & Schwab, 2013).

12
1.3.1.1.1 CYP1A2
The CYP1A2 gene is located on chromosome 15q24.1 and is mostly abundant in the liver
(Kawakami et al., 2011; Nelson et al., 2004; Ohtsuki et al., 2012). The gene contains multiple
aryl hydrocarbon receptor (AhR) response elements, therefore environmental sources of
AhR ligands are strong inducers of CYP1A2 activity (Jorge-Nebert et al., 2010; Nebert et al.,
2004; Ueda et al., 2006). Clinically used substrates, inducers and inhibitors of CYP1A2 are
listed in Table 1.1.
Table 1.1: Substrates, inducers and inhibitors of CYP1A2. Adapted from the Australian Medicines Handbook (AMH, 2018), Zanger et al. (2014); Zanger and Schwab (2013).
CYP1A2 substrates CYP1A2 inducers CYP1A2 inhibitors
Agomelatine Amitriptyline
Asenapine Axitinib
Bendamustine Clozapine
Duloxetine Erlotinib
Fluvoxamine Imipramine Lidocaine
Olanzapine Ondansetron Paracetamol Pirfenidone
Pomalidomide Propranolol Rasagiline Ropinirole
Ropivacaine Theophylline
Warfarin (R‑isomer) Zolmitriptan
Omeprazole Phenobarbital
Phenytoin (moderate) Rifampicin (moderate) Ritonavir (moderate)
Tobacco smoking
Cimetidine Ciprofloxacin (strong)
Combined oral contraceptives (moderate)
Fluvoxamine (strong) Vemurafenib
Verapamil

13
Two genetic variants have been flagged as being of clinical significance: rs2069514
(CYP1A2*1C) and rs762551 (CYP1A2*1F). CYP1A2*1C is a −3860G>A SNP in the promotor
region of the gene leading to decreased inducibility, and CYP1A2*1F is a −163C>A SNP in the
intron 1 region of the gene leading to increased inducibility (Pharmacogene Variation
Consortium at www.pharmvar.org). However, variations in these genotypes explain a low
amount of the variability seen in CYP1A2 activity within and between individuals (Klein et
al., 2010; Perera et al., 2012a), suggesting that environmental factors such as diet play a
larger role in determining its activity than genetics. In fact, this is supported and confirmed
by the large effect that diet has on CYP1A2 activity (Chapter 2).
1.3.1.1.2 CYP2C19 and CYP2C9
The CYP2C19 and CYP2C9 genes are located on chromosome 10q23.3. CYP2C9 is expressed
in the liver approximately 10-fold higher than CYP2C19, which has been attributed to
difficulties with the CYP2C19 promotor region interacting with hepatocyte nuclear factor 4α
(HNF4α) (Coller et al., 2002; Koukouritaki et al., 2004; Ohtsuki et al., 2012; Rettie & Jones,
2005). Clinically used substrates, inducers and inhibitors of CYP2C19 and CYP2C9 are listed
in Table 1.2 and Table 1.3, respectively.
Three CYP2C19 genetic variants are of particular clinical importance: rs4244285
(CYP2C19*2), rs4986893 (CYP2C19*3) and rs12248560 (CYP2C19*17). CYP2C19*2 is a
19154G>A splicing defect leading to a null allele and significantly reduced activity;
CYP2C19*3 is a 17948G>A SNP also causing a null allele; and CYP2C19*17 is a −806C>T SNP
in the promotor region of the gene causing increased expression and activity
(Pharmacogene Variation Consortium at www.pharmvar.org). Because of these relatively
prevalent null alleles, genotype-phenotype correlations are observed for CYP2C19.

14
Importantly, the interaction between diet, genetics and geographic ancestry and their
combined effects on CYP2C19 activity have not been assessed.
There are two CYP2C9 genetic variants that are of significance to variability in response to
medicines: rs1799853 (CYP2C9*2) and rs1057910 (CYP2C9*3). CYP2C9*2 is a 3608C>T SNP
leading to decreased activity and CYP2C9*3 is a 42614A>C SNP also causing decreased
activity (Pharmacogene Variation Consortium at www.pharmvar.org). CYP2C9 is expressed,
to a lesser extent, in extra-hepatic tissues such as the intestines and cardiovascular system,
and therefore environmental agents that reach these tissues in high concentrations could
affect activity (DeLozier et al., 2007). As with CYP2C19, the effects of diet, genetics and
geographic ancestry have not been simultaneously investigated for CYP2C9.

15
Table 1.2: Substrates, inducers and inhibitors of CYP2C19. Adapted from the Australian Medicines Handbook (AMH, 2018) and Zanger et al. (2014); Zanger and Schwab (2013).
CYP2C19 substrates CYP2C19 inducers CYP2C19 inhibitors
Amitriptyline Axitinib
Bortezomib Brivaracetam
Citalopram Clopidogrel
Cyclophosphamide Diazepam
Escitalopram Esomeprazole
Etravirine Imipramine
Lansoprazole Omeprazole Pantoprazole Phenobarbital
Phenytoin Propranolol
Voriconazole Warfarin (R‑isomer)
Zolmitriptan
Efavirenz (moderate) Enzalutamide (moderate)
Rifampicin (strong) Ritonavir (strong)
St John’s wort
Cimetidine Clarithromycin
Efavirenz Esomeprazole
Etravirine Fluconazole (strong) Fluoxetine (strong)
Fluvoxamine (strong) Ketoconazole Omeprazole
Oxcarbazepine Topiramate
Voriconazole (moderate)

16
Table 1.3: Substrates, inducers and inhibitors of CYP2C9. Adapted from the Australian Medicines Handbook (AMH, 2018) and Zanger et al. (2014); Zanger and Schwab (2013).
CYP2C9 substrates CYP2C9 inducers CYP2C9 inhibitors
Amitriptyline Bosentan Celecoxib
Cyclophosphamide Etravirine Fluoxetine Fluvastatin
Glibenclamide Gliclazide
Glimepiride Glipizide
Ibuprofen Phenytoin
Rosiglitazone Rosuvastatin Ruxolitinib Tamoxifen
Voriconazole Warfarin (S‑isomer)
Aprepitant (moderate) Bosentan
Carbamazepine (moderate) Dabrafenib
Enzalutamide (moderate) Rifampicin (moderate) Ritonavir (moderate)
St John’s wort
Amiodarone (moderate) Benzbromarone (moderate)
Efavirenz Etravirine
Fluconazole (moderate) Fluoxetine
Fluvoxamine Miconazole
Ritonavir Voriconazole
1.3.1.1.3 CYP2D6
The CYP2D6 gene is located on chromosome 22q13.1. As with some of the other CYP
enzymes, CYP2D6 expression is, to some extent, regulated by HNF4α (Corchero et al., 2001;
Hara & Adachi, 2002). Clinically used substrates and inhibitors of CYP2D6 are listed in Table
1.5.
The determinants of CYP2D6 activity are mostly due to SNPs in various splice variants
(Zanger et al., 2001). In fact, CYP2D6 is almost exclusively under genetic control, with little
evidence of environmental induction (Bock et al., 1994; Glaeser et al., 2005), apart from one
isolated study reporting phenotypic increases in activity following rifampicin administration
(Caraco et al., 1997) (this is why Table 1.5 lists substrates and inhibitors of CYP2D6 but no
inducers). However, this long-held view has been challenged in recent years, with new in

17
vivo evidence demonstrating induction of CYP2D6 after administration of inducers of other
CYPs such as corticosteroids (Farooq et al., 2016). CYP2D6 has the largest list of allelic
variants known to affect its activity; the most significant of these are listed in Table 1.4.
Frequencies of null alleles between geographic ancestry groups are discussed in section 1.8,
however it is worth mentioning here that for CYP2D6, a quad-modal frequency distribution
of population activity phenotypes is achieved by genotype. This distribution is made up of:
ultra-rapid metabolisers (UMs), who have multiple copy variants of the CYP2D6 gene;
extensive metabolisers (EMs), who are homozygous for the normal allele; intermediate
metabolisers (IMs), who are either homozygous or heterozygous for reduced-activity alleles;
and poor metabolisers (PMs), who are homozygous for at least one null allele of the CYP2D6
gene (Raimundo et al., 2004; Zanger & Hofmann, 2008).
Table 1.4: Clinically significant CYP2D6 SNPs. Adapted from Zanger and Schwab (2013).
CYP allele (PharmVar)
Accession no. (rs no.) SNP Effect
CYP2D6*3 rs35742686 2549delA Null allele CYP2D6*4 rs3892097 1846G>A Null allele CYP2D6*5 Recombination n/a Null allele CYP2D6*6 rs5030655 1707delT Null allele
CYP2D6*10 rs1065852 100C>T Reduced expression
and activity
CYP2D6*17 rs28371706
rs16947 1023C>T 2850C>T
Reduced expression and activity
CYP2D6*41 rs28371725 2988G>A Reduced expression
and activity
CYP2D6 copy no. Recombination Copy no. variations
Increased expression and
activity

18
Table 1.5: Substrates and inhibitors of CYP2D6. Adapted from the Australian Medicines Handbook (AMH, 2018) and Zanger et al. (2014); Zanger and Schwab (2013).
CYP2D6 substrates CYP2D6 inhibitors
Amitriptyline Aripiprazole Atomoxetine Bortezomib
Brexpiprazole Carvedilol
Chlorpromazine Cinacalcet Clozapine Codeine
Dapoxetine Darifenacin
Dextromethorphan Donepezil Duloxetine Flecainide Fluoxetine
Fluvoxamine Galantamine
Gefitinib Haloperidol Imipramine Lidocaine
Metoclopramide Metoprolol Nebivolol
Nortriptyline Olanzapine
Ondansetron Oxycodone Paroxetine Perhexiline Propranolol Risperidone Tamoxifen
Tolterodine Tramadol
Venlafaxine Vortioxetine
Abiraterone Amiodarone
Bupropion (strong) Celecoxib
Cimetidine Cinacalcet (moderate)
Cobicistat Duloxetine (moderate)
Fluoxetine (strong) Methadone
Mirabegron (moderate) Paroxetine (strong) Terbinafine (strong)

19
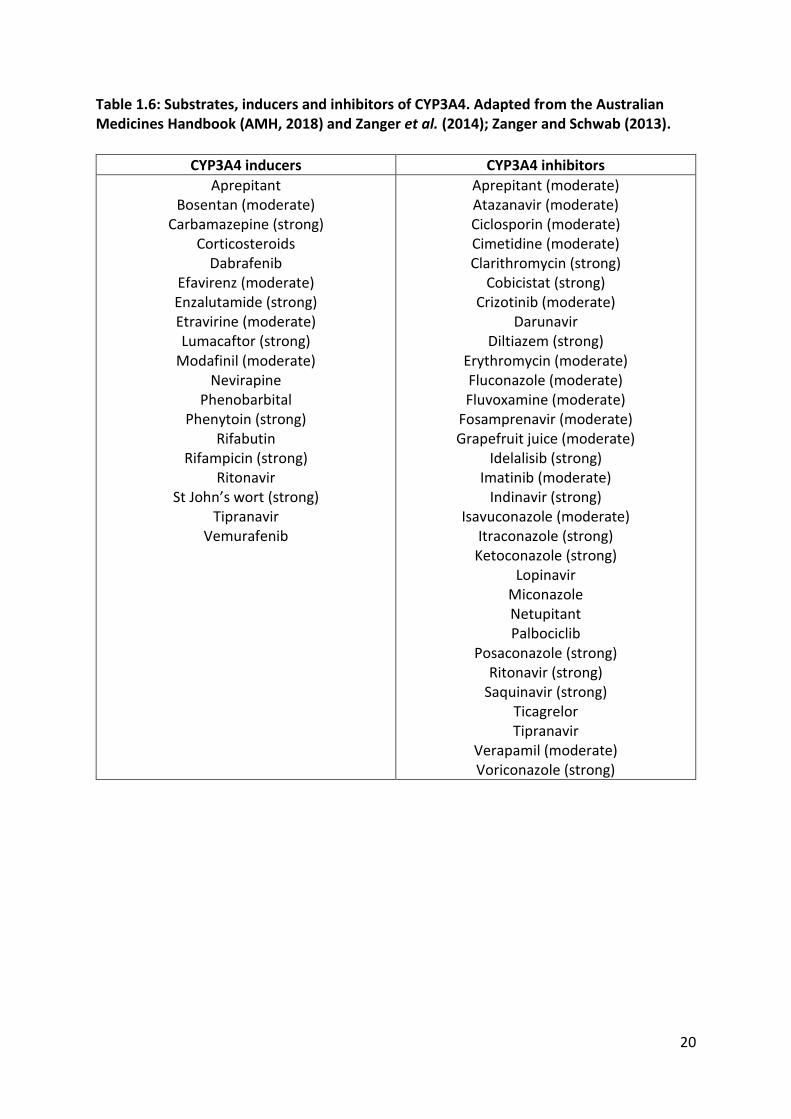
1.3.1.1.4 CYP3A4
The CYP3A4 gene is located on chromosome 7q22.1. By liver microsomal weight, it alone
constitutes 14-24% of the CYPs (Lin et al., 2002; Ohtsuki et al., 2012; Shimada et al., 1994;
Wolbold et al., 2003), emphasising its important contribution to oxidative drug metabolism
in humans. It also has an important role in intestinally-mediated first-pass metabolism due
to its relative abundance in enterocytes (Daly, 2006; Ding & Kaminsky, 2003; Von Richter et
al., 2004). Upstream pregnane X receptor (PXR) and constitutive androstane receptor (CAR)
binding sites make this gene readily inducible, as seen across a wide variety of endogenous,
exogenous and xenobiotic substrates (Jover et al., 2009; Matsumura et al., 2004; Qiu et al.,
2010). Clinically used inducers and inhibitors of CYP3A4 are listed in Table 1.6; substrate lists
are vast, and are therefore not displayed.
Two CYP3A4 genetic variants of significance have been highlighted: rs2740574 (CYP3A4*1B)
and rs35599367 (CYP3A4*22). CYP3A4*1B is a −392A>G polymorphism in the upstream
promotor region of the gene that potentially leads to decreased activity, and CYP3A4*22 is a
15389 C>T SNP in intron 6 causing decreased expression and activity (Pharmacogene
Variation Consortium at www.pharmvar.org). While the interaction between CYP3A4
substrates such as statins have been investigated for effects on activity by genotype, the
effect of diet by geographic ancestry is less-represented in the literature.
Overall, these five main CYP enzymes play a major role in the metabolism of commonly used
medicines in humans. Importantly, their activity is differentially affected by SNPs in select
variants and various environmental exposures. As a collective, they represent an ideal panel
of important enzymes to study the effects of diet, genetics and geographic ancestry on drug
metabolism in humans.
20
Table 1.6: Substrates, inducers and inhibitors of CYP3A4. Adapted from the Australian Medicines Handbook (AMH, 2018) and Zanger et al. (2014); Zanger and Schwab (2013).
CYP3A4 inducers CYP3A4 inhibitors
Aprepitant Bosentan (moderate)
Carbamazepine (strong) Corticosteroids
Dabrafenib Efavirenz (moderate) Enzalutamide (strong) Etravirine (moderate) Lumacaftor (strong)
Modafinil (moderate) Nevirapine
Phenobarbital Phenytoin (strong)
Rifabutin Rifampicin (strong)
Ritonavir St John’s wort (strong)
Tipranavir Vemurafenib
Aprepitant (moderate) Atazanavir (moderate) Ciclosporin (moderate) Cimetidine (moderate) Clarithromycin (strong)
Cobicistat (strong) Crizotinib (moderate)
Darunavir Diltiazem (strong)
Erythromycin (moderate) Fluconazole (moderate) Fluvoxamine (moderate)
Fosamprenavir (moderate) Grapefruit juice (moderate)
Idelalisib (strong) Imatinib (moderate)
Indinavir (strong) Isavuconazole (moderate)
Itraconazole (strong) Ketoconazole (strong)
Lopinavir Miconazole Netupitant Palbociclib
Posaconazole (strong) Ritonavir (strong)
Saquinavir (strong) Ticagrelor Tipranavir
Verapamil (moderate) Voriconazole (strong)

21
1.3.1.2 Uridine 5’-diphospho-glucuronosyltransferases
As discussed above, much of the drug metabolism literature focusses on the CYP
superfamily of drug metabolising enzymes due to familiarity with their molecular genetic
mechanisms and well-characterised substrate profiles (Daly, 1995). However, the depth of
knowledge encompassing other enzyme superfamilies, such as the uridine-diphosphate
glucuronosyltransferases (UGTs), has grown as a result of increased overall knowledge of
drug metabolism and an evolving appreciation of how these superfamilies’ substrate
specificities overlap and interact (Ginsberg et al., 2010; Yang et al., 2017).
UGTs are responsible for the glucuronidation and elimination of a wide range of
endogenous substances, xenobiotics, environmental pollutants, carcinogens and their phase
I metabolites (Miners et al., 2002). UGTs are type I transmembrane proteins found in the
smooth endoplasmic reticulum within cells and are expressed in high concentrations in the
liver, but also expressed in extrahepatic tissues such as the lungs, kidney and
gastrointestinal tract (GIT) (Cappiello et al., 1991). The primary function of UGTs is to
catalyse the transfer of a sugar moiety from the cofactor uridine-diphosphoglucuronic acid
(UDPGA) to hydroxyl, carboxylic, amino or sulphur constituents on the substrate (Ginsberg
et al., 2010).
The outcome of this chemical biotransformation is an increase in the substrate’s molecular
weight and hydrophilicity, facilitating excretion in bile and/or urine via the liver and/or
kidney.

22
The UGT superfamily is divided into three broad groups based on homology sequencing:
UGT1A, found on chromosome 2; and UGT2A and 2B, found on chromosome 4 (Nagar &
Remmel, 2006). UGT1 members have exons 2-5 in common and variations in exon 1
determine the enzyme’s subtype, whereas UGT2 members have six exons—all of which are
variable—that have no overlap with UGT1 exons (Maruo et al., 2005). At least 13 isoforms
are encoded by the UGT1 locus, with nine of these being functional enzymes: UGT1A1, 1A3,
1A4, 1A5, 1A6, 1A7, 1A8, 1A9 and 1A10 (Miners et al., 2002). Functional UGT2 subtypes
include UGT2A1, 2B4, 2B7, 2B10, 2B11, 2B15, 2B17 and 2B28 (Levesque et al., 2001).
Despite these subfamilies having differing amino acid sequences there is substantial overlap
in their substrate specificity. While this redundancy is beneficial for the organism as it
provides alternate glucuronidation pathways in the presence of inefficient variants or
absent enzymes, the lack of substrate specificity between UGT subtypes creates difficulty in
designing studies that assess single glucuronidation pathways. Although this overlap in
specificity is prominent, the subfamilies do differ in their general affinity for endogenous sex
Figure 1.3: An example of glucuronidation of 4-aminobiphenyl, adapted from Al-Zoughool and Talaska (2006).
Database search results CENTRAL: n = 21
Embase: n = 1,852 Medline: n = 1,245
Total: n = 3,118
Identified as potentially relevant based on title and abstract n = 91
+ Scan of references
n = 4
Studies meeting inclusion criteria based on full text n = 23
Duplicates n = 833
Articles screened n = 2,285
Excluded based on title and abstracts n = 2,194
Excluded based on full text n = 72
Figure 1.4: Forest plot showing pooled estimate of standardised mean difference in CYP1A2 activity during cruciferous vegetable versus basal/control diet.
Figure 1.5: Forest plot showing pooled estimate of standardised mean difference in GST-α activity during cruciferous vegetable versus basal/control diet.
Figure 1.6: Dose-response relationship between increase in CYP1A2 activity and daily cruciferous vegetable consumption.
Figure 1.7: Chromatogram overlays of the 10 analytes and internal standard phenacetin as a mixture in human plasma.

23
steroids. UGT1s appear to have greater activity against oestrogens and their catechol
metabolites (Lepine et al., 2004), while UGT2s tend to better glucuronidate androgens
(Belanger et al., 2003). A summary of known substrates by UGT subtype is displayed in Table
1.7.

24
Table 1.7: Known substrates of UGT isoforms, adapted from Ginsberg et al. (2010) and Levesque et al. (2001). Note: References for substrates mentioned outside of these papers are listed in the far-right column.
UGT Isoform
Substrates References
UGT1A1 Bilirubin, estrogens (β-estradiol, hydroxyestradiols, hydroxyestrones), buprenorphine, flavonoids, anthraquinone, 4-nitrophenol, 2-amino-5-nitro-4-fluoromethylphenol, raloxifene1
1Trontelj et al. (2009)
UGT1A3 Estrone, hydroxyestrone, hydroxyestradiol, amines (cyproheptadine, losartan), anthraquinones, femoprofen, ibuprofen, umbelleferone, flavonoids
UGT1A4 Amines (clozapine, aminobiphenyl, naphthylamine, benzidine, aminofluorene, imipramine), 4-hydroxytamoxifen, 5α-pregnene-3α,20β-diol
UGT1A5 Unknown
UGT1A6 Phenols (eugenol, β-naphthol, 4-nitrophenol), paracetamol, serotonin, amines, 2-amino-5-nitro-4-fluoromethylphenol, salicylic acids, deferiprone2
2Benoit-Biancamano et al. (2009)
UGT1A7 Phenols (α-naphthol), acetaminophen, 4-methlumbelliferone, octyl gallate, propyl gallate, benzo(a)pyrene metabolites
UGT1A8 Estrogens (hydroxyestrone, hydroxyestradiol, 17α- ethinylestradiol), naltrexone, phenols, flavonoids, anthraquinones, phenolphthalein, mycophenolic acid, 4-aminobiphenyl
UGT1A9 Estrogens, retinoic acid, thyroid hormones, paracetamol, SN-38 (active metabolite of irinotecan), phenols, 4- methylumbelliferone, propofol, flavonoids, anthraquinones, mycophenolic acid
UGT1A10 β-estradiol, mycophenolic acid, phenols, flavonoids
UGT2A1 Phenols (vanillin, 3-hydroxybiphenol, 4-hydroxybiphenol), scopoletin, aliphatic compounds (citronellol), steroids
UGT2B4 Eugenol, catechol estrogens, hyodeoxycholic acid, 1-napthol, 4-methylumbelliferone, 5β-pregnane-3α,20β-one
UGT2B7 Estrogens (4-hydroxyestrone, 4-hydroxyestradiol), androsterone, morphine, dihydromorphine, codeine, oxycodone, naloxone, naltrexone, valproic acid, serotonin, hyodeoxycholic acid, losartan, flurbiprofen3, gemfibrozil4, haloperidol5, 6α-hydroxyprogesterone6, 21-hydroxyprogesterone6, lorazepam7, trans-4-hydroxytamoxifen8, endoxifen8,
3Wang et al. (2011), 4Mano et al. (2007), 5Kato et al. (2012), 6Bowalgaha et al. (2007), 7Chung et al. (2008), 8Blevins-Primeau et al. (2009)
UGT2B10 Unknown
UGT2B11 Unknown
UGT2B15 Dienestrol, phenols, flavonoids (naringenin, apigenin), anthraquinones, estrogens, (2-hydroxyestrone, 4-hydroxyestrone), bisphenol A, testosterone, dihydroxytestosterone, oxazepam9
9He et al. (2009)
UGT2B17 Androgens (androgen, testosterone, dihydrotestosterone, androstenediols)
UGT2B28 Eugenol, etiocholanolone, androstane-3α,20β-diol, 4-methylumbelliferone, 1-napthol, estradiol, androsterone, hyodeoxycholic acid, lithocholic acid, testosterone

25
1.3.1.3 Glutathione S-transferases
The glutathione S-transferases (GSTs) are another type of important phase II drug-
metabolising enzyme, recently reviewed by Allocati et al. (2018). The GSTs catalyse the
attachment of glutathione (GSH) to an electrophilic substrate, with the resulting conjugate
being more water soluble than before, facilitating excretion in the urine (Pool-Zobel et al.,
2005). GSTs are localised within the cell into three main sub-categories: cytosolic,
mitochondrial and microsomal GSTs (Hayes et al., 2005; Oakley, 2011; Sheehan et al., 2001).
Important cytosolic GSTs in humans include the alpha, mu, pi and theta subtypes. The co-
substrate binding sites in these enzymes, termed the ‘H-site’, displays marked variability,
leading to a vast array of substrate binding affinities. GSTs have numerous roles in
endogenous cellular biology, including, but not limited to protecting the cell against
oxidative stress, and biotransformation of leukotrienes and prostaglandins. However, this
thesis is concerned with their role in the detoxification of drugs and their metabolites, and
factors that contribute to variability in their activity.
The GSTs are polymorphic like most of the other drug-metabolising enzymes presented in
this chapter. Gene deletion can create a null allele for GSTM1 and GSTT1, and the GSTP1
rs1695 A>G SNP is associated with reduced activity. GSTM1, GSTP1 and GSTT1 have an
important role to play in the metabolism of numerous antineoplastic drugs, paracetamol
and the isothiocyanates (section 1.7.1) (Whirl-Carrillo et al., 2012). In fact, isothiocyanate
exposure (and subsequent changes in CYP1A2 activity) are modulated by the presence of
the GSTM1 and GSTT1 null alleles (Peterson et al., 2009) (Chapter 2). Importantly, the
effects of genetics, diet and geographic ancestry on GSTs have not been simultaneously
assessed in the context of variability in response to medicines.

26
1.4 Transporters
While outside the specific scope of this thesis, which focuses on drug metabolism, it is
important to acknowledge the impact drug-transporting proteins have on variability in
pharmacokinetics. As with drug-metabolising enzymes, polymorphisms in the genes that
encode these transporters, and extrinsic factors such as drug interactions, can lead to a
variable response, and hence differences in the systemic exposure of drugs between
individuals. König et al. (2013) and Koo et al. (2015) provide excellent and comprehensive
coverage of this topic. This section provides a brief overview of transporters, their genetic
variability and effects on drug disposition.
Transporters either efflux substrates back into the lumen on the apical side of the cell or
uptake substrates into the cell through the basolateral membrane (König et al., 2013). Two
well-studied examples of efflux transporters are P-glycoprotein (P-gp; encoded by the
ABCB1 gene) and multi-drug resistance protein 2 (MRP2; encoded by the ABCC2 gene); well-
known uptake transporters include organic anion-transporting polypeptide (OATP)1B1
(encoded by the SLCO1B1 gene) and organic cation transporter (OCT)1 (encoded by the
SLC22A1 gene).
Transporter genes are regulated by mechanisms similar to drug-metabolising enzymes, for
example, induction can occur through interactions between the gene and the PXR, CAR and
the vitamin D receptor (Tirona, 2011). Several studies have shown transporter induction
following exposure to rifampicin and St John’s wort (Dürr et al., 2000; Greiner et al., 1999).
Polymorphisms in transporter genes have been shown to contribute to variability in drug
exposure: in one study, the SLC22A2 808G>T SNP significantly affected metformin renal
clearance in the presence of cimetidine (Wang et al., 2008). Another well-studied

27
polymorphism, the SLCO1B1 521T>C SNP (OATP1B1*5), has been shown to greatly reduce
the activity of the OATP1B1 transporter. Assessing the relative frequencies of transporter
SNPs in different geographic ancestries is of interest, as is the effect of diet on drug
transporters, but both topics lie outside the scope of this thesis.

28
1.5 Epigenetics
Epigenetics encompasses heritable gene expression patterns that cannot be explained in
terms of the DNA sequence itself; it can be thought of as the processes that occur ‘on-top’
of the DNA (‘epi‘, meaning ‘upon’, in Greek), rather than what is coded in DNA itself. Such
epigenetic mechanisms include DNA methylation, post-transcriptional modification of
histones and gene expression changes by non-coding RNAs (ncRNAs) (Ivanov et al., 2012).
The ways in which epigenetic mechanisms affect drug-metabolising enzymes and
transporters are largely unknown, with this field still being in its infancy. This topic has been
comprehensively reviewed by Zanger and Schwab (2013), Zanger et al. (2014), Kacevska et
al. (2011) and Ivanov et al. (2012). Epigenetic mechanisms have an inhibitory effect on the
expression of drug-metabolising enzyme genes: for a comprehensive list, the reader is
directed to Table 1 in Kacevska et al. (2011)’s review in Clinical Pharmacology and
Therapeutics.
This territory remains largely uncharted, with epigenetic targets and mechanisms being
referred to as “genetic dark matter” (Stefanska & MacEwan, 2015; Zanger et al., 2014).
Further, extremely few studies have investigated how diet, genetics and geographic
ancestry interact with epigenetics to cause variability in drug response. These themes lie
outside the scope of this thesis, but as epigenetic methodologies evolve and improve, these
avenues should be explored for the major drug-metabolising enzymes and transporters.

29
1.6 Measuring variability in drug-metabolising enzyme activity
Appropriate in vivo bioanalytical methods are required before one can study the effects of
intrinsic and extrinsic factors on drug metabolism in humans. In particular, estimation of CYP
activity in humans requires in vivo measurement of selective substrates specific for the CYP
enzyme(s) in question, along with a suitable, validated pharmacokinetic metric (Tucker et
al., 1998). These probe drugs should ideally be easy to administer (preferably via the oral
route), have no interactions amongst themselves and be well-tolerated by the patient at low
doses (Ghassabian et al., 2009). Therefore, the design, validation and optimisation of these
analytical methods are often complex, time consuming and resource-intensive. A significant
investment is made to get these tools ‘right’, so that accurate and precise measurement of
CYP activity can be made before and after interventions that test hypotheses in this area of
clinical pharmacology.
1.6.1 Simultaneous phenotyping of multiple CYP-isoenzymes: the ‘cocktail’ approach
CYP-phenotyping cocktails aim to achieve the above simultaneously for multiple CYP450
enzymes, namely CYP1A2, CYP2D6, CYP2C19, CYP2C9 and CYP3A4, by dosing individuals
with enzyme-specific probe drugs, and using the resulting concentration-time data to
calculate metrics that characterise CYP drug-metabolising activity. This approach has been
colloquially called the CYP-phenotyping ‘cocktail’, and has recently been extensively
reviewed by de Andrés and Llerena (2016).
Multiple CYP-phenotyping methods using liquid chromatography-tandem mass
spectrometry (LC-MS/MS) have been developed with a range of probe drugs, internal
standards, sampling strategies, biological matrices of interest and methods of analyte
extraction (de Andrés & Llerena, 2016). To have utility as a diagnostic or investigative tool in

30
clinical and research settings, the phenotyping approach should be minimally invasive with
simplified sample processing, and reduced costs wherever possible. Of note, complex,
multiple-step analytical protocols have served as a barrier to the routine inclusion of CYP-
phenotyping in these contexts, with some methods requiring: different extraction
techniques for their various analytes; specialised automated systems; lengthy incubations
with reagents before extraction can occur; and different chromatographic conditions across
analytes, which necessitate repeat sample processing and multiple injections (De Andrés et
al., 2014; Ghassabian et al., 2009; Grangeon et al., 2017; Lammers et al., 2016). Lack of
assay sensitivity also means that larger volumes (0.5 – 10 mL) of plasma are needed.
Further, some methods employ probes such as flurbiprofen (Bosilkovska et al., 2014a) and
tolbutamide (Yin et al., 2004), which are not widely available in appropriate dosage forms.
Other issues arise with the use of foods containing the probe phenotyping compounds as
opposed to standardised medicines (e.g. coffee or carbonated cola beverages as a caffeine
source), which likely contain additional compounds that could affect drug-metabolising
enzymes in humans (Bosilkovska et al., 2014a; Bosilkovska et al., 2016; Bosilkovska et al.,
2014b). Consequently, there exists a need for bioanalytical methods that address the above
issues, which can be readily established for clinical studies requiring simultaneous CYP-
phenotyping.
The design, validation and optimisation of one such CYP-phenotyping cocktail is covered in
Chapter 3, aligning with the thesis objectives outlined in section 1.9.
31
1.7 Diet as an extrinsic source of variability in drug metabolism
The old adage “you are what you eat” has been shown to be ostensibly true throughout
decades of research across many disciplines. In the context of clinical pharmacology, a
recent review by Yang (2015) pays tribute to the work of the late Allan Conney and
colleagues, who pioneered work in this area. Conney et al. identified that polycyclic
aromatic hydrocarbons, famously found in char-grilled meat, induce the metabolic activity
of CYP1A1 and CYP1A2 (Conney, 1982), opening the door to diet and drug metabolism
research in humans (Conney, 2003). This group of researchers is well-known for their work
that identified ingested cruciferous vegetables as inducers of CYP1A2 (Pantuck et al., 1979),
and a comprehensive review of such trials is discussed in Chapter 2 of this thesis. Because
Cruciferae are found in diets throughout the world (Li et al., 2015), they were chosen as a
candidate food to study in the context of variability in drug metabolism, and differences in
this variability across geographic ancestries.
1.7.1 Cruciferous vegetables and their constituents
Due to their apparent anti-cancer properties, the isothiocyanates (ITCs) have been of
interest to the scientific community over the past two decades (Gupta et al., 2014). These
compounds are found in high concentrations in cruciferous vegetables such as broccoli,
cabbage and watercress, which feature almost ubiquitously in many diets across the globe
(Steinkellner et al., 2001). These compounds are present in plants as thioglycoside
conjugates called glucosinolates, which are hydrolysed by myrosinase (released when plant
cells are damaged by cutting, chewing, etc.) to isothiocyanates (Grubb & Abel, 2006) (Figure
1.17).

32
Figure 1.17: The two most represented glucosinolates and their isothiocyanate hydrolysis products. Adapted from Cartea and Velasco (2008).
One of the mechanisms by which these compounds elicit their cancer-protecting effects is
through the induction of phase I and II drug-metabolising enzymes, which significantly
contribute to the metabolism, and therefore clearance, of carcinogenic compounds and
other xenobiotics (Cheung & Kong, 2010; Thornalley, 2002; Zhang, 2004). Most studies
investigating these effects are designed to test hypotheses in a cancer-focussed context,
with the two most represented ITCs being sulforaphane (SUL) and phenethyl isothiocyanate
(PEITC) (Lamy et al., 2011) (Figure 1.17). However, few studies approach the interaction
between Cruciferae and their constituents and drug-metabolising enzymes in a clinical
pharmacology context.
The majority of published studies investigating these effects focus on the CYP1A2 isoform
(section 1.3.1.1.1). Generally, data show that the constituents in Crucifeae induce or
increase the activity of this enzyme in vivo but have mixed effects in vitro (Chapter 2).
Contrary to in vivo data, PEITC has been shown to inhibit CYP1A2, CYP2C19, CYP2C9, CYP2D6
and CYP3A4 in vitro (Nakajima et al., 2001). Its glucosinolate precursor, gluconasturtiin, has

33
been detected in concentrations ranging from 0.1-0.9 µmol per gram of dry weight broccoli
across 50 different accessions of broccoli subspecies (Kushad et al., 1999). Therefore,
consumption of 500 g broccoli daily could lead to ingestion of up to 450 µmol of
gluconasturtiin, and hence a corresponding amount of phenethyl isothiocyanate, in a 24-
hour period. A related isothiocyanate compound, sulforaphane, is present in high
concentrations within broccoli as the thioglycoside conjugate glucoraphanin, and it has been
estimated that consumption of 100 g of broccoli may release 40 µmol of this particular
isothiocyanate (Hecht, 1995). As with PEITC, there is also evidence that sulforaphane can
inhibit CYP1A2. Importantly, both PEITC and SUL have been detected in significant
concentrations in plasma following cruciferous vegetable consumption (Fahey et al., 1997; Ji
& Morris, 2003). These data suggest that it is reasonable to hypothesise that a clinically
meaningful concentration of these bioactive phytochemicals may be achieved in hepatic
tissues and other sites of drug metabolism, potentially leading to altered activity of
important CYP-mediated xenobiotic elimination.
The manner in which cruciferous vegetables are prepared in a culinary context for human
consumption can affect the quantity of phytochemicals absorbed after their ingestion. A
comprehensive review in this area outlines evidence for altered glucosinolate
concentrations in cruciferous vegetables following “domestic cooking” (boiling), steaming,
microwaving and stir-fry cooking (Verkerk et al., 2009). Verkerk et al. identified that some
glucosinolates and their metabolites are water-soluble, and cooking methods involving
submerging vegetables in water, or with high surface area contact with water, could
facilitate leeching and a reduced concentration of these phytochemicals within plant tissues.
This is supported by a study that showed a 77% decrease in glucosinolate content within
broccoli that was boiled for 30 minutes (Song & Thornalley, 2007).

34
Studies that involve microwaving cruciferous vegetables display mixed effects on
glucosinolate content. Vallejo et al. (2002) showed that microwaving broccoli for five
minutes at 1000 W power reduced glucosinolate levels by 74%. In contrast, a similar study
found no significant decrease in glucosinolate content when microwaving for three minutes
at 900 W power (Song & Thornalley, 2007). It remains unclear if microwaving can truly
affect phytochemical levels within cruciferous vegetables, however it is worth noting that in
vivo broccoli diet studies with a drug-metabolising enzyme endpoint report significant
changes in enzyme activity even if the broccoli was allowed to be microwaved (Hakooz &
Hamdan, 2007; Kall et al., 1997).
Importantly, ITCs are predominantly metabolised by GSTs (section 1.3.1.3), therefore factors
affecting GST activity are also likely to contribute to variability in ITC exposure. The
contributions of GST genotype and cruciferous vegetable preparation and cooking methods
to variability in ITC exposure should not be ignored, and trials that measure their
concentration should have appropriate measures in place to control for this variability.
35
1.8 Differences in CYP activity between Europeans and South Asians
Chapter 1 has introduced the reader to the theme of variability in response to medicines
(section 1.1), with a focus on intrinsic and extrinsic factors affecting this variability (section
1.1.1), geographic ancestry (section 1.2), drug-metabolising enzymes (section 1.3.1), and the
effects of Cruciferae-enriched diets on drug metabolism (section 1.7.1). Often, these factors
interact and co-vary within geographic ancestry groups, which can be useful when
attempting to explain variability in response to medicines in these populations.
Ultimately, ancestry is a ‘cluster’ of various intrinsic and extrinsic factors that vary or co-vary
within a particular geographic ancestry group, such as frequencies of SNPs in drug-
metabolising genes, or dietary practices. Therefore, any study that aims to address
hypotheses in this area should measure the effect of individual intrinsic and extrinsic factors
and how they themselves vary between ancestry groups. Further, doing so allows for
appropriate statistical control of particular factors, which is useful in determining whether
there remains residual, unexplained variability in a given endpoint. Several good examples
of this are demonstrated in Chapter 5 of this thesis, such as CYP2C19 activity being higher in
Europeans than South Asians within genotype groups, i.e. despite having the same alleles in
the variants tested, one ancestry group still had higher activity than the other, some of
which could be explained by relative differences in dietary practices between the groups.
This approach allows for identification of new avenues of research to explore and a better
understanding of the relative contribution of factors affecting variability in response to
medicines.
Of all geographic ancestries, the most is known about Europeans, as much of the modern
clinical pharmacology movement originated in either Europe or America (in the early to mid-

36
1900s, most Americans were European immigrants or their descendants) (Dollery, 2006). In
fact, because most drugs have traditionally been developed in European patient cohorts,
they are also the reference group for comparison when registering a drug for use in non-
European populations. In the modern pharmaceutical industry context, global clinical trials
aim to address the pharmacological differences between ancestry groups, and the
International Council for Harmonisation (ICH) sets out guidelines to streamline and improve
this process (Ichimaru et al., 2010). Compared to Europeans, fewer trials are conducted in
those people of South Asian ancestry: less than 1% of global clinical trials are conducted in
populations hailing from the Indian sub-continent (Thiers et al., 2008). However, this region
of the world has one of the highest population growth rates and high annual growth in
pharmaceutical infrastructure and demand. Further, the effects of diet and genetics on
drug-metabolising enzyme activity in South Asians are under-represented in
pharmacogenomic databases such as PharmGKB (https://www.pharmgkb.org) (Whirl-
Carrillo et al., 2012) and The Allele Frequency Database (ALFRED)
(https://alfred.med.yale.edu) (Rajeevan et al., 2003). Therefore, better understanding the
variability in response to medicines between Europeans and South Asians is of growing
importance, hence choosing to focus on these two geographic ancestries in this thesis.
The remainder of this section will discuss the currently known differences in CYP genetics
between Europeans and South Asians, and finally comment on known differential effects of
diet practices on CYP activity between these groups.
1.8.1 Differences in CYP SNP frequencies between Europeans and South Asians
The 1000 Genome Project (http://www.internationalgenome.org) was a vast collaborative
undertaking that aimed to identify and catalogue as many gene variants as possible in select

37
ancestry groups across the globe (Auton et al., 2015). Table 1.8 summarises some of the
data from this project, namely frequencies of important CYP SNPs in both Europeans and
South Asians. It can be seen that for many of these important variants, frequencies of
activity change alleles are higher in one group over the other. For example, with regards to
CYP2C19, Europeans have a higher proportion of the increased activity genotypes (TT, CT)
for CYP2C19*17, and South Asians have a higher frequency of the CYP2C19*2 null allele
genotypes (AA, AG), suggesting that with all else being equal, Europeans would have higher
CYP2C19 activity than South Asians. Similar allelic patterns are seen for CYP1A2, with
Europeans having higher frequencies of the increased inducibility genotypes for CYP1A2*1F
(AA, AC), with South Asians having higher frequencies of the decreased inducibility
genotypes for CYP1A2*1C (AA, AG). For CYP2C9 and CYP3A4, the ancestry group differences
in high or low activity genotype frequencies are similar. CYP2D6 is highly polymorphic
(section 1.3.1.1.3), and variants that cause either reduced or no activity are numerous.
Frequencies of the null or reduced activity CYP2D6 variant genotypes are higher in
Europeans for CYP2D6*3, CYP2D6*4, CYP2D6*6 and CYP2D6*10, but more prevalent in
South Asians for CYP2D6*42 (Auton et al., 2015).
Ultimately, though, it is the enzyme activity in vivo (i.e. the phenotype) rather than the
genotype that dictates whether a particular CYP-substrate is effectively metabolised or not.
Therefore, environmental factors known to affect CYP activity, such as diet, should also be
investigated when aiming to explore variability in response to medicines between
geographic ancestries.

38
Table 1.8: Important CYP SNPs, their details, effects and frequencies in European and South Asian populations. Data sourced from the 1000 Genome Project (http://www.internationalgenome.org) (Auton et al., 2015).
CYP allele designation (rs no.) [SNP] | function Genotype frequency (count)
CYP1A2*1C (rs2069514) [−3860G>A] | ↓ inducibility GG AA AG European 0.960 (483) Nil 0.040 (20)
South Asian 0.847 (414) 0.006 (3) 0.147 (72)
CYP1A2*1F (rs762551) [−163C>A] | ↑ inducibility CC AA AC European 0.115 (58) 0.475 (239) 0.410 (206)
South Asian 0.227 (111) 0.297 (145) 0.476 (233)
CYP2C19*1C (rs3758581) [80161A>G] | undetermined GG AA AG European 0.865 (435) 0.002 (1) 0.133 (67)
South Asian 0.787 (385) 0.006 (3) 0.207 (101)
CYP2C19*2 (rs4244285) [19154G>A] | null allele GG AA AG European 0.722 (363) 0.012 (6) 0.266 (134)
South Asian 0.436 (213) 0.151 (74) 0.413 (202)
CYP2C19*3 (rs4986893) [17948G>A] | null allele GG AA AG European 1.000 (503) Nil Nil
South Asian 0.975 (477) Nil 0.025 (12)
CYP2C19*17 (rs12248560) [−806C>T] | ↑ activity CC TT CT European 0.596 (300) 0.044 (22) 0.360 (181)
South Asian 0.753 (368) 0.025 (12) 0.223 (109)
CYP2C9*2 (rs1799853) [3608C>T] | ↓ activity CC TT CT European 0.773 (389) 0.022 (11) 0.205 (103)
South Asian 0.933 (456) 0.002 (1) 0.065 (32)
CYP2C9*3 (rs1057910) [42614A>C] | ↓↓ activity AA CC AC European 0.857 (431) 0.002 (1) 0.141 (71)
South Asian 0.787 (385) 0.006 (3) 0.207 (101)
CYP2D6*3 (rs35742686) [2549delA] | null allele TT -T -- European 0.968 (487) 0.026 (13) 0.006 (3)
South Asian 0.996 (487) 0.004 (2) Nil
CYP2D6*4 (rs3892097) [100C>T] | null allele CC TT CT European 0.674 (339) 0.046 (23) 0.280 (141)
South Asian 0.806 (394) 0.025 (12) 0.170 (83)
CYP2D6*6 (rs5030655) [1707delT] | null allele AA -A -- European 0.960 (483) 0.040 (20) Nil
South Asian 0.998 (488) 0.002 (1) Nil
CYP2D6*10 (rs1065852) [4180G>C] | ↓ activity GG AA AG European 0.646 (325) 0.050 (25) 0.304 (153)
South Asian 0.710 (347) 0.039 (19 0.252 (123)
CYP2D6*17 (rs28371706) [1023C>T]; (rs16947) [2850C>T] | ↓ activity
rs28371706
GG AA AG European 0.996 (501) Nil 0.004 (2)
South Asian 1.000 Nil Nil
rs16947
GG AA AG European 0.461 (232) 0.147 (74) 0.392 (197)
South Asian 0.427 (209) 0.151 (74) 0.421 (206)

39
CYP allele designation (rs no.) [SNP] | function Genotype frequency (count)
CYP2D6*41 (rs28371725) [2988G>A] | ↓ activity CC TT CT European 0.827 (416) 0.014 (7) 0.159 (80)
South Asian 0.779 (381) 0.022 (11) 0.198 (97)
CYP3A4*1B (rs2740574) [−392A>G] | undetermined TT CC CT European 0.946 (476) 0.002 (1) 0.052 (26)
South Asian 0.922 (451) 0.002 (1) 0.076 (37)
CYP3A4*22 (rs35599367) [15389 C>T] | ↓ activity GG AA AG European 0.903 (454) 0.002 (1) 0.095 (48)
South Asian 0.988 (483) Nil 0.012 (6)

40
1.8.2 Differences in diet and CYP activity between Europeans and South Asians
One of the largest cross-sectional observational studies to investigate how diet, genetics
and CYP1A2 activity vary between Europeans and South Asians was conducted by Perera et
al. (2012a). In this study, median CYP1A2 activity was 29% higher in the European cohort
compared to the South Asians. This was attributed to different frequencies of diets known
to affect CYP1A2 activity, namely those high in foods that induce or inhibit the CYPs (see
section 1.7). Heavy consumption of CYP1A2 inducer foods was relatively higher in the
Europeans, whereas heavy inhibitor consumption was more prevalent in the South Asians.
Further, a predominantly curry diet was more frequent in the South Asian ancestry group.
Indian curries contain foods known to inhibit CYP1A2, such as turmeric, celery, cumin and
dill (Lampe et al., 2000b; Peterson et al., 2006; Peterson et al., 2009), which could explain
some of this variability in enzyme activity between the ancestry groups.
Studies like this are rare, with this one being unique in the sense that it was the first
observational study to simultaneously investigate genetics, diet and CYP activity in
Europeans and South Asians. Importantly, these observational results have not yet been
confirmed in a follow-up, controlled, crossover trial, nor have the other four main CYP
enzymes been investigated in this context. Because the CYPs share so many overlapping
molecular regulatory mechanisms, it is likely that factors affecting CYP1A2 also affect the
activities of CYP2C19, CYP2C9, CYP2D6 and CYP3A4 (Zanger & Schwab, 2013). These
potential avenues of enquiry were used to form the thesis objectives in the following
section of this thesis.

41
1.9 Thesis objectives and outline
Chapter 1 has summarised and discussed the published literature surrounding variability in
response to medicines and the tools required to measure and explore this variability.
Ultimately, a growing understanding of this observed variability is needed to produce better
patient outcomes by providing new ways to account for intra- and inter-patient differences
in the efficacy and safety of drugs.
In this context, the importance of the CYP superfamily of drug-metabolising enzymes was
discussed in detail, alongside the importance of several key phase II drug-metabolising
enzymes. Further, the way in which diet affects these enzymes was discussed, with a focus
on how cruciferous vegetables and their constituents induce and inhibit drug-metabolising
enzymes. The concept of geographic ancestry as a collection of known (and unknown)
intrinsic and extrinsic factors affecting response to medicines was introduced, and the
relevant background for European and South Asian ancestries was covered. It was identified
that relatively few studies have investigated how diet and genetics interact between and
within ancestry groups such as Europeans and South Asians, and a need for more studies in
this area was commented on.
Before hypotheses can be constructed that examine ancestral differences in CYP enzyme
activity, the literature must be searched systematically to identify what has already been
studied, how well these studies were designed and where gaps in the literature exist.
Therefore, apart from the objectives of Chapter 1 (above), the first main objective of this
thesis was, for the first time, to conduct a systematic review of all published cruciferous
vegetable intervention trials with drug metabolism endpoints. The sub-objectives of this
review are stated in the introduction of Chapter 2, but ultimately, results from this review
42
were used to generate hypotheses that aimed to investigate the relationships between diet,
genetics, geographic ancestry and drug metabolism.
Further, before such hypotheses can be tested, appropriate bioanalytical methods must be
designed, validated and optimised to ensure timely analysis of participant samples. The CYP
phenotyping cocktail approach was introduced in section 1.6.1 as a technique with
increasing popularity in pharmacokinetic phenotyping studies. However, these assays are
complex and resource intensive, often with cumbersome, time-consuming methods.
Therefore, the second main objective of this thesis was to design, validate and optimise a
UHPLC-MS/MS CYP-phenotyping cocktail assay that was relatively simple, sensitive and
high-throughput compared to similar assays. This process is described, reported and
discussed in Chapter 3.
Similarly, a bioanalytical method was required to measure sulforaphane, a candidate
isothiocyanate affecting changes in CYP activity, in a biological matrix. Previously published
methods have long chromatographic run times, require large sample volumes and have
complicated sample extraction procedures (discussed in section 4.4). Therefore, the third
main objective of this thesis was to design, validate and optimise a UHPLC-MS/MS assay to
measure sulforaphane in human plasma that was relatively simple, sensitive and high-
throughput compared to similar assays.
Lastly, the hypotheses generated in Chapter 2 were tested through designing and
conducting a dietary intervention trial in Europeans and South Asians. The sub-objectives of
this trial are outlined in section 5.1, however in short, for the first time, this trial aimed to
explore the effects of cruciferous vegetable consumption, other dietary components,
genetics and geographic ancestry on the activities of CYP1A2, CYP2C19, CYP2C9, CYP2D6

43
and CYP3A4. Because these five CYP enzymes contribute to the metabolism of the majority
of medicines used in humans, factors that affect their activity significantly contribute to
variability in response to medicines. Therefore, exploring the way in which diet, genetics,
and European and South Asian ancestries interact with these drug-metabolising enzymes
will aid in better understanding variability in response to medicines, and in turn, contribute
to the safer and more efficacious use of drugs in these populations.

44
2 The effects of cruciferous vegetable-enriched diets on drug
metabolism: a systematic review and meta-analysis of dietary
intervention trials in humans
2.1 Introduction
As discussed in section 1.1, variability in response to medicines has a significant impact on
the clinical outcomes of drug therapy. Ultimately, a complex interplay of intrinsic and
extrinsic factors explains why individuals respond differently when given the same dose of
the same medicine (section 1.1.1). Studies in this area aim to explore differences in the
expression and activity of drug-metabolising or drug-transporter proteins, as these proteins
significantly contribute to the clearance of a drug, and therefore influence its systemic
exposure (Yasuda et al., 2008). Variability in the genes that encode these enzymes and
transporters has been identified as a major source of inter-individual differences in systemic
drug exposure (Bjornsson et al., 2003).
Section 1.7.1 outlined the effects of cruciferous vegetables or their constituents, which are
an important portion of many people’s diets, on drug-metabolising activity in humans.
Cruciferous vegetables contain isothiocyanates (ITCs), which are phytochemicals considered
to cause the enzyme induction and inhibition observed after eating Cruciferae-enriched
diets (Steinkellner et al., 2001). Phenethyl isothiocyanate (PEITC) and sulforaphane (SFN) are
the two most widely studied ITCs (Lamy et al., 2011). In general, the ingestion of cruciferous
vegetables is associated with induction of cytochrome P450 (CYP) 1A2 activity in vivo
(Perera et al., 2012a), however there is contention between findings, and the clinical
significance of the potential diet-drug interactions remains uncertain.

45
Chapter 2 outlines the methods, results, discussion and conclusions of a systematic review
which aimed to 1) systematically review dietary intervention trials in humans that
investigated the effects of cruciferous vegetables on drug-metabolising enzymes; 2) critically
analyse the design of these studies; 3) interpret the findings in the context of study quality;
4) where possible, conduct meta-analyses on the collected data to determine the size and
significance of any Cruciferae-induced changes in drug metabolism; and 5) use this
information to generate hypotheses which examine the interactions between diet,
geographic ancestry, genetics and drug metabolism.

46
2.2 Methods
2.2.1 Databases and searches
The Cochrane Handbook for Systematic Reviews of Interventions, Version 5.1.0 (Higgins &
Green, 2011) was used to guide the design of the methodology of this review. Medline,
Embase and the Cochrane Central Register of Controlled Trials (CENTRAL) were searched
from their earliest entries through to July 2017 via the Ovid platform (Wolters Kluwer,
2017). Search terms and the strategies used for each database are listed in Appendix 8.1.
The reference lists from potentially relevant studies were hand-searched to identify
additional dietary intervention trials. The search was limited to studies published in English.
Study abstracts were screened for potential relevance by one author and two authors
independently assessed the published papers for eligibility as per Section 2.2.2. Any
differences were discussed until agreement was reached.
2.2.2 Assessment of study eligibility
Studies were deemed eligible if they included healthy volunteers or patients, implemented a
dietary intervention which involved cruciferous vegetables and had a pharmacokinetic
phenotyping metric as an endpoint. A phenotyping metric was defined as an index derived
from the administration of an enzyme-specific probe drug or substrate followed by
measurement of the concentration of the parent compound and/or metabolite(s) in a
biological matrix (plasma, urine, saliva, etc.). Studies using endogenous markers (e.g.
conjugated/unconjugated bilirubin as a probe for UDP-glucuronosyltransferase (UGT)
activity) were also included. Interventions involving cruciferous vegetable extracts and/or
their phytochemical isolates were excluded. Observational, cross-sectional studies were not
included in this review.

47
2.2.3 Data extraction and study quality assessment
Data that were gathered included: number of subjects/place of study participant
demographics; the drug-metabolising enzymes studied; the size and nature of any changes
in enzyme activity following cruciferous vegetable consumption; duration and details of the
dietary intervention; number of dietary intervention periods tested; and the type of study
design (randomised crossover, non-randomised crossover or parallel). For reported
pharmacokinetic metrics, point estimates and descriptive statistics were extracted using a
uniform data extraction sheet (Appendix 8.2) and checked by a second author. In the event
that numeric point estimates were not available, data were extracted from figures and
graphs using WebPlotDigitizer (http://arohatgi.info/WebPlotDigitizer/app). Where data
were available and computation/imputation was possible, the size, variability and
significance of enzyme activity changes following dietary interventions involving cruciferous
vegetable between studies were calculated.
Several methodological characteristics were taken into consideration when assessing the
quality of each study. Selected guidelines from the Consolidated Standards of Reporting
Trials (CONSORT) statement (Schulz et al., 2010), the CONSORT Explanation and Elaboration
document (Altman et al., 2001) and criteria outlined by Mills et al. (2004) were used to
guide the choice of study characteristics included in the critical analysis. Study
characteristics indicating higher quality included: study design (with randomised crossover
being the highest quality followed by non-randomised crossover, then parallel group study
design); similarity between groups (for designs using more than one group of participants);
sample size ≥ 10 participants (rationale by Kakuda et al. (2014)); inclusion of a basal control
diet; kJ- and/or participant weight-standardised diets; appropriate choice of statistical
analyses, previous/concurrent validation of assay methods; and measures to ensure

48
participant adherence to study protocols, including diet diaries and supervised consumption
of the intervention diet.
2.2.4 Statistical analyses
The methods outlined in the Cochrane Handbook (Higgins & Green, 2011) and those of
Elbourne et al. (Elbourne et al., 2002) were used to calculate mean differences and their
standard errors of study endpoints. The upper limits of P-value inequalities were used when
calculating standard errors of mean differences to ensure that any estimates were
conservative (e.g. P < 0.05 taken as P = 0.05). Due to most studies recruiting < 60
participants, appropriate values from the Student’s t-distribution were used in the
calculation of 95% confidence intervals (CI) for the mean difference between experimental
and control periods (Higgins & Green, 2011).
As all but one study used a crossover or pre-test, post-test design, within-subject correlation
coefficients for endpoints across study periods were necessary to estimate the standard
deviation of the mean difference between experimental and control periods. Correlation
coefficients were directly calculated for studies when the individual participant data were
available (Higgins & Green, 2011), however the majority of studies did not allow for this. For
CYP1A2, correlation coefficients from the data presented in Chapter 5 were used. Because
repeated-measures pharmacokinetic data generally display high within-subject correlation
across study periods in crossover trials (Shen et al., 2006), an average value of 0.8
(estimated using within-subject correlation data presented in Chapter 5) was used in the
estimation of the standard deviations of the mean difference for enzymes where calculation
or imputation of correlation coefficients was not possible.
49
For studies reporting natural log-back-transformed geometric mean ratios of point
estimates, the method of Higgins et al. (2008) was used to estimate the mean difference
and its standard error on the non-logarithmic scale.
Meta-analysis was deemed appropriate for the studies that investigated the effects of
cruciferous vegetables on metrics of CYP1A2 activity and GST-α. As the studies used a
variety of pharmacokinetic metrics to represent the activity of these two enzymes, the
mean differences of endpoints were divided by their pooled standard deviations to allow for
comparisons across measurement scales (Higgins & Green, 2011). For both enzymes, studies
were meta-analysed using a random-effects model under the generic inverse-variance
method in RevMan (Version 5.3). Heterogeneity across meta-analysed trials was formally
assessed using the Chi2 method as outlined in the Cochrane Handbook (Higgins & Green,
2011).

50
2.3 Results
2.3.1 Database search results
The database searches revealed 3,118 publications that were potentially relevant; this was
reduced to 2,285 studies after removing duplicates between the databases (Figure 2.1).
Ninety-one studies were confirmed to be clinical/in vivo after scanning titles and abstracts.
The full-text of the 91 studies was read, and a further four studies for assessment were
identified from the publication citations, which were also assessed for eligibility. In total, 23
cruciferous vegetable dietary intervention trials investigating an impact on drug metabolism
in humans were included in this systematic review (Table 2.1).

51
Figure 2.1: Flow diagram of study identification and selection processes with subtotals.
Database search results CENTRAL: n = 21
Embase: n = 1,852 Medline: n = 1,245
Total: n = 3,118
Identified as potentially relevant based on title and abstract
n = 91 +
Scan of references n = 4
Studies meeting inclusion criteria based on full text
n = 23
Duplicates n = 833
Articles screened n = 2,285
Excluded based on title and abstracts n = 2,194
Excluded based on full text n = 72

52
Table 2.1: Drug-metabolising enzymes, probe drugs and phenotyping metrics represented in the literature by publication
Study Sample size
(n)1 Enzymes Probe drugs (dose) Phenotyping metric2 Mean difference in metric (95% CI)3
de Waard et al. (2008) 6
CYP1A2 CYP2A6 NAT2 XO
Caffeine (2 cups of tea or 1 cup of coffee) CYP1A2: (AFMU + 1X + 1U)/17U CYP2A6: 17U/(17U + 17X + 1U+ 1X+ AFMU) NAT2: AMFU/1X XO: 1U/(1U + 1X)
0.99 (0.78, 1.19)a
1.07 (0.93, 1.20)a
1.01 (0.66, 1.36)a
0.96 (0.90, 0.99)a
Hakooz and Hamdan (2007)
10 CYP1A2 CYP2A6
Caffeine (100 mg) CYP1A2: (17U + 17X)/137X CYP2A6: 17U/(17U + 17X + 1U+ 1X+ AFMU)
20.2 (10.4, 30.0) 0.10 (0.06, 0.14)
Kall et al. (1996) 16 CYP1A2 CYP2E1
Caffeine (100 mg) Chlorzoxazone (500 mg)
(AFMU + 1X + 1U)/17U 2-h hydroxychlorzoxazone/chlorzoxazone plasma concentration
1.19 (0.65, 1.73) 0.07 (-0.03, 0.18)
Lampe et al. (2000b) 36
CYP1A2 NAT XO
Caffeine (200 mg) CYP1A2: (AFMU + 1X + 1U)/17U CYP1A2: (AFMU + 1X + 1U)/17X CYP1A2: (17U + 17X)/137X CYP1A2:17X/137X NAT: AFMU/(1X + 1U + AFMU) XO: 1U/(1U + 1X)
0.97 (0.82, 1.12) 0.006 (0.00, 0.01) 1.00 (0.75, 1.25) 0.99 (0.76, 1.22) 0.00 (-0.02, 0.02) 0.00 (-0.01, 0.01)
McDanell et al. (1992) 6
CYP1A2 Study 1: Caffeine (2 g Nescafe® in 200 mL water) Study 2: Caffeine (1 g Nescafe® in 100 mL water)
Study 1: Caffeine AUC Caffeine MCR (dose/AUC) Study 2: Caffeine AUC Caffeine MCR (dose/AUC)
55.0 (26.3, 83.7) -0.03 (-0.05, -0.01) 53.0 (-42.7, 149) -0.02 (-0.05, 0.01)
Murray et al. (2001) 20 CYP1A2 Caffeine (2 mg/kg dissolved in decaffeinated
coffee) Caffeine CL AUC0-∞
6.10 (2.81, 9.39) -0.15 (-0.07, 0.09)
Pantuck et al. (1984) 10 CYP1A2 UGT1A9 UGT1A6
Antipyrine (1.8 mg/kg) Phenacetin (900 mg)
Antipyrine CL Phenacetin AUC 4-h conjugated/unconjugated APAP
0.35 (0.17, 0.53) -2,565 (-3,514, -1,617) 0.52 (0.16, 0.88)
Peterson et al. (2009) 73 CYP1A2 Caffeine (200 mg) (AFMU + 1X + 1U)/17U 0.39 (0.18, 0.61)
Vistisen et al. (1992) 9 CYP1A2 NAT XO
Caffeine (1-4 cups of coffee) CYP1A2: (AFMU + 1X + 1U)/17U NAT: AFMU/1X or AFMU/(1U + 1X + 17U) XO: 1U/(1U + 1X)
0.35 (-0.45, 1.14) 0.06 (-0.24, 0.36) 0.01 (-0.07, 0.09)
Murphy et al. (2001) 15 CYP2A6 Coumarin (5 mg) Urine 7-hydroxycoumarin concentration 0.00 (-0.28, 0.28)
Desager et al. (2002) 9 CYP2E1 Ethanol (0.5 g/kg in cold water) Ethanol AUC0-3.33
Acetaldehyde AUC0-3.33 -2.45 (-6.27, 1.37) 2.94 (0.30, 5.58)

53
Study Sample size
(n)1 Enzymes Probe drugs (dose) Phenotyping metric2 Mean difference in metric (95% CI)3
Leclercq et al. (1998) 10 CYP2E1 Chlorzoxazone (500 mg) Chlorzoxazone AUC0-∞
Chlorzoxazone CL Hydroxychlorzoxazone AUC0-∞
24.2 (12.8, 35.7) -0.91 (-1.34, -0.48) 1.10 (-1.92, 4.12)
Chen et al. (1996) 10
CYP2E1 (indirect) UGT1A9 UGT1A6 SULT1A1 SULT2A1
Paracetamol (1 g) APAP CL APAP AUC APAPG AUC APAPS AUC APAPC AUC APAPM AUC
-0.50 (-1.14, 0.14) 0.10 (-1.62, 1.82) 14.7 (3.76, 25.6) 2.20 (-4.52, 8.92) -0.70 (-1.13, -0.27) -0.18 (-0.22, -0.14)
Bogaards et al. (1994) 10 GST-α n/a Plasma concentration of enzyme 212 (100, 324)
Lampe et al. (2000a) 43
GST-α NBD-Cl (200 μM) CDNB (1.22 µM)
Serum concentration of enzyme NBD-Cl extinction coefficient CDNB extinction coefficient
386 (-35.8, 807.35) 2.21, (-0.78, 5.21) 0.22 (-0.20, 0.64)
Navarro et al. (2009a) 67 GST-α n/a Serum concentration of enzyme 327 (0.59, 653)
Nijhoff et al. (1995) 10
GST-α GST-π
n/a GST-α: Plasma concentration of enzyme GST-α: Urine concentration of enzyme GST-π: Plasma concentration of enzyme GST-π: Urine concentration of enzyme
0.30 (0.04, 0.56) (males) -0.04 (-0.14, 0.06) (females) 0.07 (0.01, 0.13) (males) -0.03 (-0.08, 0.02) (females) 0.42 (-0.83, 1.67) (males) 0.21 (-0.67, 1.09) (females) 0.11 (0.05, 0.17) (males) 0.03 (-0.09, 0.15) (females)
Riso et al. (2009) 20 GST-α CDNB (20 mM) Formation of NBD-Cl -4.00 (-10.4, 2.39)
Riso et al. (2014) 10 GST-α CDNB (20 mM) Formation of NBD-Cl 8.80 (-4.51, 22.1)
Chang et al. (2007) UGT1A1*6/*6: 26 UGT1A1*6/*7: 23 UGT1A1*7/*7: 14
UGT1A1 Bilirubin (endogenous) UGT1A1*6/*6: serum total bilirubin UGT1A1*6/*6: serum indirect bilirubin UGT1A1*6/*6: serum direct bilirubin UGT1A1*6/*7: serum total bilirubin UGT1A1*6/*7: serum indirect bilirubin UGT1A1*6/*7: serum direct bilirubin UGT1A1*7/*7: serum total bilirubin UGT1A1*7/*7: serum indirect bilirubin UGT1A1*7/*7: serum direct bilirubin
0.72 (-0.27, 1.71 0.65 (-0.25, 1.55) 0.80 (-0.05, 0.21) -0.76 (-1.97, 0.45) -0.72 (-1.82, 0.38) -0.04 (-0.20, 0.12) -3.49 (-7.10, 0.12) -3.34 (-6.70, 0.02) 0.19 (-0.15, 0.53)

54
Study Sample size
(n)1 Enzymes Probe drugs (dose) Phenotyping metric2 Mean difference in metric (95% CI)3
Navarro et al. (2009b) UGT1A1*1/*1: 29
UGT1A1*1/*28: 36 UGT1A1*28/*28: 5
UGT1A1 Bilirubin (endogenous) UGT1A1*1/*1: serum total bilirubin UGT1A1*1/*28: serum total bilirubin UGT1A1*28/*28: serum total bilirubin
-1.03 (-2.06, -0.01) -0.17 (-2.15, 1.81) -3.42 (-6.84, -0.01)
Navarro et al. (2011)
Overall: 65 UGT1A6*1/*1: 27 UGT1A6*1/*2: 25 UGT1A6*2/*2: 13
UGT2B15*1/*1: 16 UGT2B15*1/*2: 33 UGT2B15*2/*2: 17
Overall: 65 UGT1A6*1/*1: 27 UGT1A6*1/*2: 25 UGT1A6*2/*2: 13
UGT2B15*1/*1: 16 UGT2B15*1/*2: 33 UGT2B15*2/*2: 17
UGT1A6 UGT2B15 SULT1A1 SULT2A1
Paracetamol (1 g) Overall: APAPG ratio UGT1A6*1/*1: APAPG ratio UGT1A6*1/*2: APAPG ratio UGT1A6*2/*2: APAPG ratio UGT2B15*1/*1: APAPG ratio UGT2B15*1/*2: APAPG ratio UGT2B15*2/*2: APAPG ratio Overall: APAPS/APAP UGT1A6*1/*1: APAPS/APAP UGT1A6*1/*2: APAPS/APAP UGT1A6*2/*2: APAPS/APAP UGT2B15*1/*1: APAPS/APAP UGT2B15*1/*2: APAPS/APAP UGT2B15*2/*2: APAPS/APAP
2.70 (1.18, 4.22) 3.20 (0.01, 6.40) 2.60 (0.01, 5.20) 2.30 (0.01, 4.60) 4.60 (0.01, 9.20) 2.10 (0.01, 4.20) 2.20 (0.01, 4.40) -1.10 (-1.48, -0.52) -0.90 (-1.80, -0.01) -0.80 (-1.60, -0.01) -1.10 (-2.20, -0.01) -0.80 (-1.70, 0.10) -1.20 (-1.81, -0.59) -0.70 (-1.64, 0.24)
Pantuck et al. (1984) 10
UGT1A9 UGT1A6 UGT2B7 UGT2B15 SULT1A1 SULT2A1
Paracetamol (1.5 g) Oxazepam (45 mg)
APAP plasma AUC APAP CL APAPG plasma AUC APAPS plasma AUC Oxazepam plasma AUC Oxazepam CL Oxazepam glucuronide plasma AUC
-14.8 (-29.6, -0.01) 2.90 (0.01, 5.80) -13.2 (-20.1, -6.35) -20.5 (-41.0, -0.01) -1,438 (-2,876, -0.01) 1.10 (0.01, 2.20) -260 (-613, 92.9)
1 Total sample size as reported in publication or by subgroup where appropriate.
2 Abbreviations (as listed in column from top): AFMU, 5-acetylamino-6-formylamino-3-methyluracil; 1X, 1-methylxanthine; 1U, 1-methyluric acid; 17U, 1,7-dimethyluric acid; 17X, 1,7-
dimethylxanthine (paraxanthine); 137X, 1,3,7-trimethylxanthine (caffeine); t1/2, elimination half-life; CL, clearance; AUC, area under concentration-time curve; 4-h, 4-hour post-dose; APAP, N-
acetyl-p-aminophenol (paracetamol); AUC0-∞, AUC from time 0 extrapolated to infinity; MCR, metabolic clearance (dose/AUC); APAPG, paracetamol glucuronide; APAPS, paracetamol sulfate;
APAPC, paracetamol cysteine; APAPM, paracetamol mercapturate; NBD-Cl, 7-chloro-4-nitrobenz-2-oxa-1,3-diaxole; CDNB, 1-chloro-2,4-dinitrobenzene; APAPG ratio, [APAPG/(APAP + APAPG
+ APAPS)] x 100.
3 The 95% confidence interval (CI) of the mean difference between experimental and control measures of enzyme activity (metricexperimental – metriccontrol) was estimated using the standard
error of the mean difference and relevant values from the Student’s t-distribution. Mean difference and standard error are as reported in the literature, extracted from data using a web-
based digitiser programme ((http://arohatgi.info/WebPlotDigitizer/app) or calculated/imputed as outlined in the Methods section, unless otherwise stated.
a Data are ratio of metricexperimental/metriccontrol with 95% CI as reported in the manuscript.

55
2.3.2 Nature of cruciferous vegetable dietary interventions
Cruciferous vegetables used in the eligible dietary intervention studies reported included
broccoli, Brussels sprout, cabbage, cauliflower, radish and watercress. All studies reported
standardised preparation and weighing of any cruciferous vegetables consumed. Methods
of preparing these vegetables included steaming, boiling, stir-frying and raw consumption,
however, not all studies instructed participants to cook the vegetables in the same manner,
with some leaving this decision to the participants (Hakooz & Hamdan, 2007; Kall et al.,
1996), and other studies not reporting this information (Chang et al., 2007; Lampe et al.,
2000b; Nijhoff et al., 1995; Peterson et al., 2009). Studies with controlled crossover designs
included a washout period of at least 7 days between diets or between phenotyping
sessions, with most allowing at least a 2- or 4-week washout. Table 2.2 summarises the
types of dietary interventions and the cruciferous vegetables studied, alongside details of
their preparation, consumption and any steps to standardise preparation.
2.3.3 Drug-metabolising enzymes and probe drugs assessed
The drug-metabolising enzymes investigated were CYP1A2 (n = 9) (de Waard et al., 2008;
Hakooz & Hamdan, 2007; Kall et al., 1996; Lampe et al., 2000b; McDanell et al., 1992;
Murray et al., 2001; Pantuck et al., 1979; Peterson et al., 2009; Vistisen et al., 1992), CYP2A6
(n = 3) (de Waard et al., 2008; Hakooz & Hamdan, 2007; Murphy et al., 2001), CYP2E1 (n = 3)
(Chen et al., 1996; Desager et al., 2002; Leclercq et al., 1998), glutathione S-transferase
(GST)-α (n = 6) (Bogaards et al., 1994; Lampe et al., 2000a; Navarro et al., 2009a; Nijhoff et
al., 1995; Riso et al., 2009; Riso et al., 2014), GST-π (n = 1) (Nijhoff et al., 1995), UDP-
glucuronosyltransferase (UGT)1A1 (n = 2) (Chang et al., 2007; Navarro et al., 2009b),
UGT1A6 (n = 4) (Chen et al., 1996; Navarro et al., 2011; Pantuck et al., 1984; Pantuck et al.,
1979), UGT1A9 (n = 3) (Chen et al., 1996; Pantuck et al., 1984; Pantuck et al., 1979),

56
UGT2B15 (n = 2) (Navarro et al., 2011; Pantuck et al., 1984), UGT2B7 (n = 1) (Pantuck et al.,
1984), N-acetyl transferase (NAT)2 (n = 3) (de Waard et al., 2008; Lampe et al., 2000b;
Vistisen et al., 1992), sulfotransferase (SULT)1A1 (n = 3) (Chen et al., 1996; Navarro et al.,
2011; Pantuck et al., 1984), SULT2A1 (n = 3) (Chen et al., 1996; Navarro et al., 2011; Pantuck
et al., 1984) and xanthine oxidase (XO) (n = 3) (de Waard et al., 2008; Lampe et al., 2000b;
Vistisen et al., 1992) (Figure 2.2). The number of investigations (n = 46) was greater than the
number of studies included in the review (n = 23) as some studies simultaneously
investigated multiple drug-metabolising enzymes.
The phenotyping probe drugs and metrics studied for each enzyme are listed in Table 2.1.
Probe substrates used to investigate the enzymes were: caffeine for CYP1A2, CYP2A6, NAT2
and XO activity; ethanol or chlorzoxazone for CYP2E1 activity; paracetamol for UGT1A6,
UGT1A9, UGT2B15, SULT1A1 and SULT2A1 activity; oxazepam for UGT2B7 and UGT2B15
activity; 1-chloro-2,4-dinitrobenzene or amount of enzyme for GST-α activity; and
endogenous bilirubin for UGT1A1 activity. The phenotyping metrics used varied between
studies, including metabolite-parent substrate ratios of relevant pharmacokinetic
parameters (e.g. AUC or concentration at a particular time post-dose), changes in clearance,
AUC or half-life of substrates.

57
Table 2.2: Details of the various Cruciferous vegetable dietary interventions by publication.
Study Cruciferous
vegetables consumed (amount/day))
Intervention details Preparation of diet Notes
Bogaards et al. (1994)
Brussels sprouts (300 g)
Two diets: basal (control) and Brussels sprouts. Diets consumed daily for 7 days each with no washout period before crossover.
Not stated. Basal diet was “glucosinolate free” but further details not provided.
Chang et al. (2007)
Broccoli (100 g) Cabbage (35 g) Daikon radish sprouts (16 g) Dose adjusted per 55 kg body weight
Two diets: basal (control) and fruit and vegetable diet. Diets consumed daily for 2 weeks each with 2-week washout period before crossover.
Not stated. Amount of cruciferous vegetables given standardised to a 55-kg body weight then adjusted for each participant to nearest 5 kg increment in body weight. Diets designed to contain 56% carbohydrate, 16% protein and 28% fat overall. Study diets contained other fruit and vegetables alongside crucifers.
Chen et al. (1996)
Watercress (50 g) Two diets: habitual diet and watercress. Habitual diet followed throughout, with watercress consumed either at 10 pm night before phenotyping or not at all with a 2-week washout period before crossover (randomised crossover).
Watercress consumed as a homogenate made by blending with 50 mL water for 2-3 minutes.
de Waard et al. (2008)
Broccoli (150 g) Brussels sprouts (300 g)
Two diets: grapefruit juice then cruciferous (sequential). Diets consumed daily for 3 days each with 3-week washout period.
Broccoli prepared as a soup and Brussels sprouts served as part of a meal.
Cruciferous vegetables and citrus fruits were avoided during the washout period.
Desager et al. (2002)
Watercress (50 g) Two diets: habitual diet and watercress. Habitual diet followed throughout with a standardised breakfast before each round of phenotyping. Watercress consumed either at 10 pm night before phenotyping, 7:30 am morning of phenotyping or not at all (randomised crossover).
Watercress consumed as a homogenate made by blending with 250 mL water for 2 minutes.
Standardised breakfast included 100 g bread, chocolate paste and 150 mL coffee.
Hakooz and Hamdan (2007)
Broccoli (500 g) One diet: broccoli (sequential) Broccoli consumed daily for 6 days. No details of washout period
Broccoli eaten raw with salad and dressing, steamed, microwaved or boiled (participant’s preference).
Broccoli added to participant’s normal diet.
Kall et al. (1996)
Broccoli (500 g) Three diets: basal (control), cruciferous-devoid then broccoli (sequential). Diets consumed daily for: 2 days (basal), 6 days (cruciferous-devoid) and 12 days (broccoli) No washout period.
Broccoli distributed evenly between lunch and dinner; lunch-broccoli eaten raw with bread and a pasta salad and dinner-broccoli either steamed, microwaved or boiled (participant’s choice).
Basal diet based on bread, potatoes, rice and boiled meat.
Lampe et al. (2000a)
Radish sprouts (16 g) Cauliflower (150 g) Broccoli (200 g) Cabbage (70 g)
Four diets: basal (control), cruciferous, allium and apiaceous. Diets consumed daily for 6 days 2-week washout period.
Not stated. Diets designed to deliver 2,000 kcal as 60% carbohydrate, 12% protein and 28% fat overall. ‘Unit foods’ added to basal diet to maintain body weights of participants based on daily kJ requirements.

58
Study Cruciferous
vegetables consumed (amount/day))
Intervention details Preparation of diet Notes
Lampe et al. (2000b)
Radish sprouts (16 g) Cauliflower (150 g) Broccoli (200 g) Cabbage (70 g)
Four diets: basal (control), cruciferous, allium and apiaceous. Diets consumed daily for 6 days with 2-week washout period
Not stated. Diets designed to deliver 2,000 kcal as 60% carbohydrate, 12% protein and 28% fat overall. ‘Unit foods’ added to basal diet to maintain body weights of participants based on daily kJ requirements.
Leclercq et al. (1998)
Watercress (50 g) Two diets: habitual diet and watercress. Habitual diet followed throughout with a standardised breakfast before each round of phenotyping. Watercress consumed either at 10 pm night before phenotyping, 7:30 am morning of phenotyping or not at all (randomised crossover).
Watercress consumed as a homogenate made by blending with 250 mL water for 2 minutes.
Standardised breakfast included 100 g bread, chocolate paste and 150 mL coffee.
McDanell et al. (1992)
Brussels sprouts (400 g) Cabbage (800 g)
Two studies: Study 1—basal (control) diet plus 200 g cabbage eaten for 3 meals in 24 hours; next day at 8:00 am basal diet plus 200 g cabbage for breakfast before phenotyping (sequential). Study 2—basal (control) diet plus 200 g Brussels sprouts eaten for 2 meals in 24 hours; phenotyping next morning while fasting (sequential).
Vegetables lightly steamed.
Murphy et al. (2001)
Watercress (170.4 g) Two diets: habitual diet and watercress (sequential). Habitual diet followed for two weeks with three days of watercress consumption followed by phenotyping (56.8 g three times a day on two occasions and one 56.8 g serving immediately before phenotyping on one occasion).
Watercress consumed fresh and uncooked.
Murray et al. (2001)
Broccoli (250 g) Brussels sprouts (250 g)
Three diets: habitual diet, cruciferous then habitual again (sequential). Diet consumed daily for 12 days No washout period.
Brussels sprouts peeled and broccoli stalks removed. Broccoli or Brussels sprouts prepared as a soup for breakfast or dinner as part of a 6-day menu plan which was repeated during the 12-day cruciferous vegetable diet.
Both soups were consumed each day; the vegetable not consumed at breakfast was eaten at dinner.
Navarro et al. (2009a)
Broccoli (203 g) Cauliflower (152 g) Red cabbage (36 g) Green cabbage (36 g) Radish sprouts (16 g) Dose adjusted per 70 kg body weight
Four diets: basal (control), cruciferous, double-cruciferous and cruciferous plus apiaceous. Diets consumed daily for 14 days Each with 3-week washout period.
Not stated. Diets designed to deliver either 7 g/kg (single-dose cruciferous and cruciferous plus apiaceous) or 14 g/kg (double-dose cruciferous) cruciferous vegetables. Amount of cruciferous vegetables given standardised to a 70-kg body weight then adjusted for each participant to nearest 5 kg increment in body weight.
Navarro et al. (2009b)
Broccoli (203 g) Cauliflower (152 g) Red cabbage (36 g) Green cabbage (36 g) Radish sprouts (16 g)
Four diets: basal (control), cruciferous, double-cruciferous and cruciferous plus apiaceous. Diets consumed daily for 14 days Each with 3-week washout period.
Not stated. Diets designed to deliver either 7 g/kg (single-dose cruciferous and cruciferous plus apiaceous) or 14 g/kg (double-dose cruciferous) cruciferous vegetables.

59
Study Cruciferous
vegetables consumed (amount/day))
Intervention details Preparation of diet Notes
Dose adjusted per 70 kg body weight
Amount of cruciferous vegetables given standardised to a 70-kg body weight then adjusted for each participant to nearest 5 kg increment in body weight.
Navarro et al. (2011)
Broccoli (203 g) Cauliflower (152 g) Red cabbage (36 g) Green cabbage (36 g) Radish sprouts (16 g) Dose adjusted per 70 kg body weight
Four diets: basal (control), cruciferous, double-cruciferous and cruciferous plus apiaceous. Diets consumed daily for 14 days Each with 3-week washout period.
Not stated. Diets designed to deliver either 7 g/kg (single-dose cruciferous and cruciferous plus apiaceous) or 14 g/kg (double-dose cruciferous) cruciferous vegetables. Amount of cruciferous vegetables given standardised to a 70-kg body weight then adjusted for each participant to nearest 5 kg increment in body weight.
Nijhoff et al. (1995)
Brussels sprouts (300 g)
Two diets: basal (control) and Brussels sprouts. Diets consumed daily for 7 days each with no washout period before crossover.
Not stated. Basal diet was “glucosinolate free” but further details not provided.
Pantuck et al. (1979)
Brussels sprouts (300 g) Cabbage (200 g)
Three diets: basal (control), cruciferous then basal again (sequential). Diets consumed daily for 10 days No washout period.
Vegetables lightly steamed and distributed evenly between lunch and dinner.
Diets designed to deliver 2,500-2,600 kcal with 60% carbohydrate, 12% protein and 28% fat overall.
Pantuck et al. (1984)
Brussels sprouts (300 g) Cabbage (200 g)
Three diets: basal (control), cruciferous then basal again (sequential). Diets consumed daily for 10 days No washout period.
Vegetables lightly steamed and distributed evenly between lunch and dinner.
Diets designed to deliver 2,500-2,600 kcal with 60% carbohydrate, 12% protein and 28% fat overall.
Peterson et al. (2009)
Broccoli (203 g) Cauliflower (152 g) Red cabbage (36 g) Green cabbage (36 g) Radish sprouts (16 g) Dose adjusted per 70 kg body weight
Four diets: basal (control), cruciferous, double-cruciferous and cruciferous plus apiaceous. Diets consumed daily for 14 days with 3-week washout period.
Not stated. Diets designed to deliver either 7 g/kg (single-dose cruciferous and cruciferous plus apiaceous) or 14 g/kg (double-dose cruciferous) cruciferous vegetables. Amount of cruciferous vegetables given standardised to a 70-kg body weight then adjusted for each participant to nearest 5 kg increment in body weight.
Riso et al. (2009)
Broccoli (200 g) Two diets: basal (control) and broccoli. Diets consumed daily for 10 days each with 20-day washout period before crossover.
Broccoli steamed before consumption. Basal diet was habitual diet devoid of cruciferous vegetables.
Riso et al. (2014)
Broccoli (200 g) Two diets: basal (control) and broccoli (sequential). Basal diet consumed once the day before phenotyping and broccoli meal consumed immediately before phenotyping.
Broccoli consumed steamed with cooked pasta, olive oil and salt.
Basal diet consisted of three standardised meals 1 day before phenotyping: Breakfast—milk and shortbread biscuits; Lunch—two sandwiches (cooked ham and cheese and raw ham); Dinner—Steak with potatoes, pasta or rice with butter and Parmesan cheese and two slices of wheat bread.

60
Study Cruciferous
vegetables consumed (amount/day))
Intervention details Preparation of diet Notes
Vistisen et al. (1992)
Broccoli (500 g) Three diets: habitual diet, broccoli and cruciferous-devoid. Diets consumed daily for 10 days 4-week washout period.
Broccoli lightly steamed and distributed evenly between lunch and dinner.
No controlled basal diet; habitual diet involved following usual dietary consumption patterns.
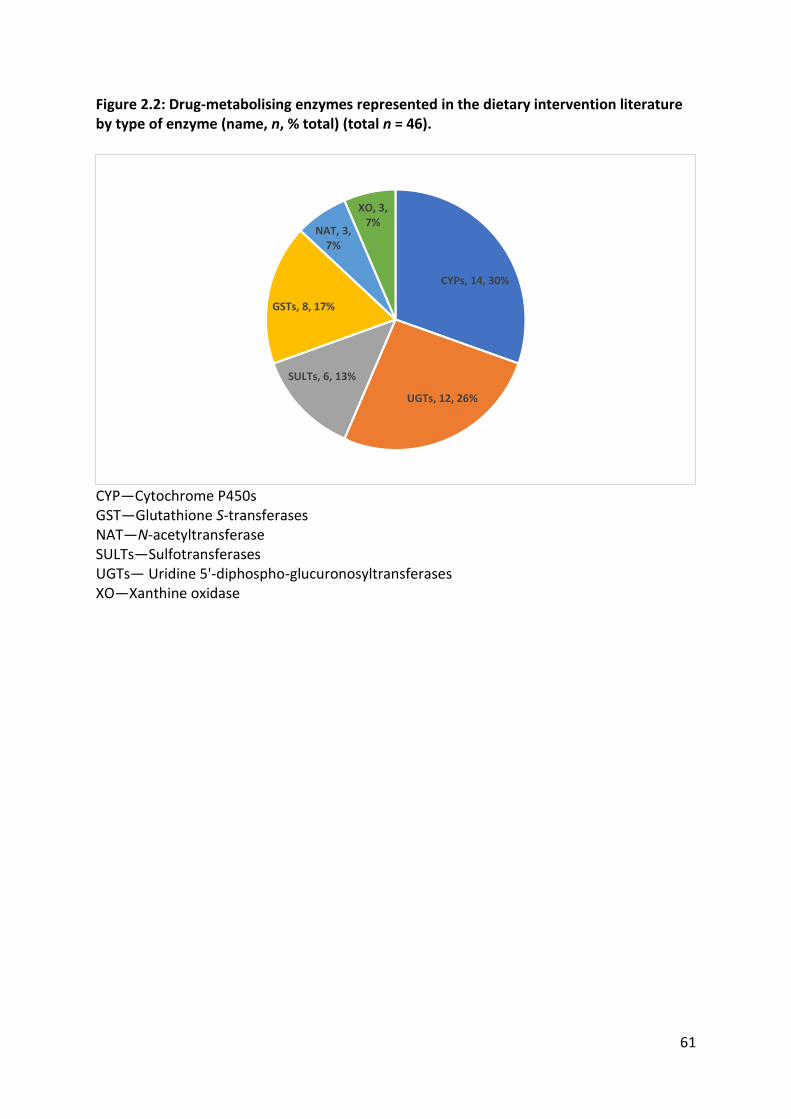
61
Figure 2.2: Drug-metabolising enzymes represented in the dietary intervention literature by type of enzyme (name, n, % total) (total n = 46).
CYP—Cytochrome P450s GST—Glutathione S-transferases NAT—N-acetyltransferase SULTs—Sulfotransferases UGTs— Uridine 5'-diphospho-glucuronosyltransferases XO—Xanthine oxidase
CYPs, 14, 30%
UGTs, 12, 26%
SULTs, 6, 13%
GSTs, 8, 17%
NAT, 3, 7%
XO, 3, 7%

62
2.3.4 Changes in drug-metabolising enzyme activity
The extent of changes in drug-metabolising enzyme activity ranged from -20% to 450%
following the various cruciferous vegetable dietary interventions (Table 2.1). The most
consistent and significant increases were for CYP1A2, ranging from 11% to 249% (de Waard
et al., 2008; Hakooz & Hamdan, 2007; Kall et al., 1996; Lampe et al., 2000b; Murray et al.,
2001; Pantuck et al., 1979; Peterson et al., 2009; Vistisen et al., 1992). Meta-analysis of the
10 experiments investigating CYP1A2 showed a significant increase of 0.61 standardised
units (95% CI = 0.26, 0.97; P = 0.0007) (Figure 2.3) following Cruciferae-enriched diets, which
approximates to a 20-40% increase in CYP1A2 activity, depending on the metric of choice.
These studies were highly heterogenous (Chi2 = 421.13 with 9 degrees of freedom; P <
0.00001), likely caused by variability in intervention diets and study design across the
CYP1A2 trials.

63
Figure 2.3: Forest plot showing pooled estimate of standardised mean difference in CYP1A2 activity during cruciferous vegetable versus basal/control diet.

64
For CYP2A6 only one study reported a significant increase in CYP2A6 activity (MD 95% CI =
0.10 [0.06, 0.14]; P = 0.002) (Hakooz & Hamdan, 2007) with the remaining two studies
reporting no significant change in activity. One of the CYP2E1 studies reported a significant
decrease in activity (inhibition) following a watercress-enriched diet intervention (MD 95%
CI = -0.91 [-1.34, -0.48]; P < 0.05) (Leclercq et al., 1998).
With regards to GST-α, four studies reported an increase in enzyme activity or plasma
concentration of the enzyme ranging from 10-61% (Bogaards et al., 1994; Lampe et al.,
2000a; Navarro et al., 2009a; Nijhoff et al., 1995). Meta-analysis of the five GST-α trials
showed a significant increase in activity of 0.41 standardised units (95% CI = 0.02, 0.81; P =
0.04) (Figure 2.4) after the various cruciferous vegetable interventions, corresponding to an
estimated 15-35% increase in GST-α activity. The GST-α trials were also highly heterogenous
(Chi2 = 41.89 with 4 degrees of freedom; P < 0.00001). Only one study investigated GST-π
and reported no significant effects of cruciferous vegetable consumption (MD 95% CI = 0.42
[-0.83, 1.67]; P > 0.05) (Nijhoff et al., 1995).
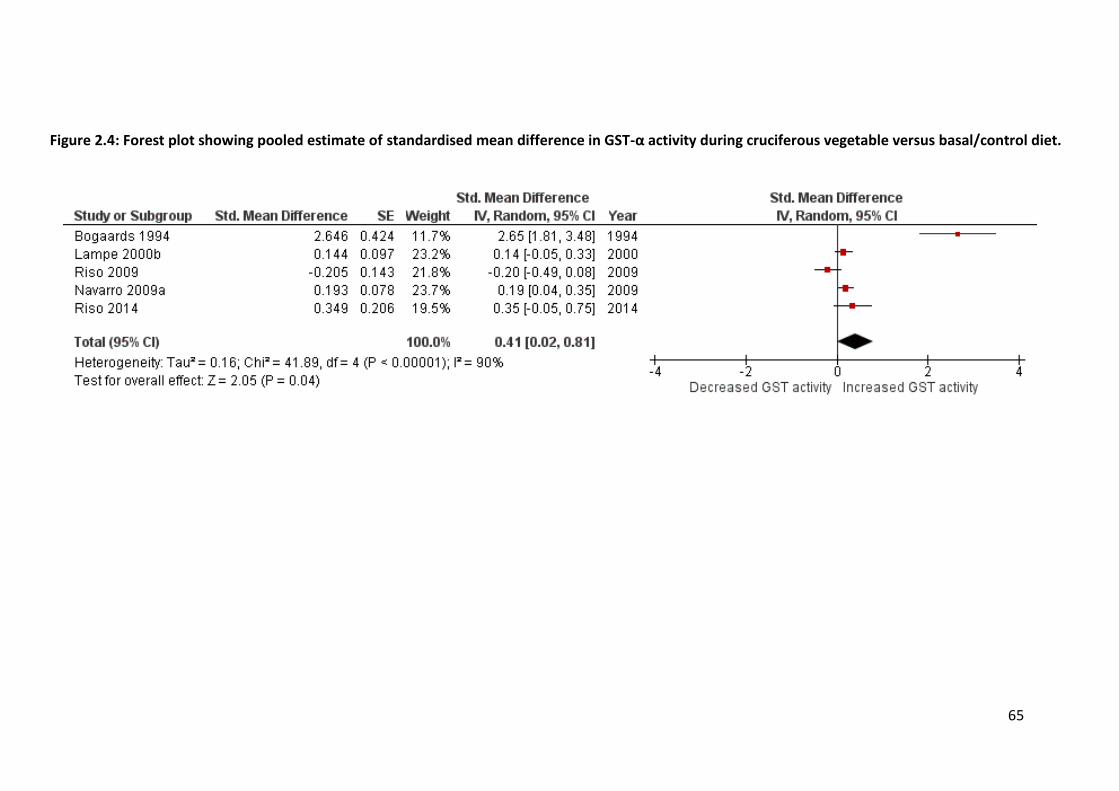
65
Figure 2.4: Forest plot showing pooled estimate of standardised mean difference in GST-α activity during cruciferous vegetable versus basal/control diet.

66
For NAT2, one study reported a small increase in activity (MR 95% CI 1.01 [0.66, 1.36]; P <
0.05) (de Waard et al., 2008), however this study had a small sample size (n = 6) and only
two quality characteristics. Heterogeneity and poor study design prevented detailed analysis
of the results of XO activity studies, although one study (de Waard et al., 2008)
demonstrated a decrease in activity after cruciferous vegetable consumption (MR 95% CI =
0.96 [0.90, 0.99]; P < 0.05).
UGT enzyme activity could not be compared across studies as the metrics chosen varied and
all of the probe drugs administered to participants were non-selective substrates for the
UGT enzymes (Chen et al., 1996; Pantuck et al., 1984). Nevertheless, one well-designed
study examining UGT1A6 and UGT2B15 activity found evidence of a 4-5% increase in
enzyme activity across different UGT genotype groups (MD 95% CI = 2.70 [1.18, 4.22]; P <
0.0001) (Navarro et al., 2011). Of interest, in this same study, a corresponding 12% decrease
in SULT1A1 and SULT2A1 activity was observed (MD 95% CI = -1.10 [-1.48, -0.52]; P <
0.0001) following the cruciferous vegetable-enriched diet intervention. A similar result was
reported in one of the other studies investigating sulfotransferases (Pantuck et al., 1984).
Of note, three studies reported evidence of dose-response relationships between the
amount of cruciferous vegetables consumed and the changes in CYP1A2 (Peterson et al.,
2009), UGT1A1 (Navarro et al., 2009b) and GST-α (Navarro et al., 2009a) activity. Consuming
double the amount of cruciferous vegetables relative to a standard Cruciferae-enriched diet
increased CYP1A2 activity in a dose-dependent manner (MDDouble-dose – Single-dose 95% CI = 0.35
[0.17, 0.54]; P < 0.05) (Figure 2.5). Similar dose-response trends were seen for the UGT1A1
(Navarro et al., 2009b) and GST-α (Navarro et al., 2009a) studies.

67
Table 2.3: Critical analysis of quality characteristics across the 23 studies.
1 Studies when participants were randomised to dietary
intervention groups are (+) (pre-test, post-test designs
marked as ‘-‘).
2 Number of participants that completed the study. N ≥ 10
was chosen as per the rationale discussed by Kakuda et al.
(2014).
3 Indicates whether participant groups were similar at
baseline before randomisation (one-group designs,
considering activity pre-diet modification post modification,
post-test designs, marked as ‘-‘).
4 Indicates whether design incorporated a control diet period
(either standardised or Cruciferae-free?).
5 Presence (+) or absence (-) of controlling kJ intake in
participants throughout study or diet standardization based
on initial participant weight in kg.
6 Studies with at least two adherence measures (+), e.g. food
diary, supervised meal consumption, other studies (-).
7 Choice of statistical test was appropriate for design (+);
failure to report marked as ‘-‘.
8 Previous or concurrent validation of any analytical
techniques used to analyse participant samples.
9 Sum of number of ‘+’ attributes for the 10 quality
characteristics recorded.
Study Design Randomisation1 n ≥ 102
Group similarity3
Basal diet4
kJ/weight standardization5 Adherence6 Statistical
analyses7
Analytical technique8 Score9
Chang, 2007 Crossover + + + + + + + + 8
Lampe, 2000a Crossover + + + + + + + + 8
Lampe, 2000b Crossover + + + + + + + + 8
Navarro, 2009a Crossover + + + + + + + + 8
Navarro, 2009b Crossover + + + + + + + + 8
Navarro, 2011 Crossover + + + + + + + + 8
Peterson, 2009 Crossover + + + + + + + + 8
Nijhoff, 1995 Crossover + - + + - + + + 6
Pantuck, 1979 Crossover - + - + + + + + 6
Pantuck, 1984 Crossover - + - + + + + + 6
Riso, 2009 Crossover + + - + - + + + 6
Bogaards, 1994 Parallel - + + + - - + + 5
Kall, 1996 Crossover - + - + - + + + 5
Murray, 2001 Crossover - + - + - + + + 5
Riso, 2014 Crossover - + - + - + + + 5
Chen, 1996 Crossover + + - - - - + + 4
Desager, 2002 Crossover + - + - - - + + 4
Vistisen, 1992 Crossover + - - + - - + + 4
Leclercq, 1998 Crossover - + - - - - + + 3
Murphy, 2001 Crossover - + - - - - + + 3
De Waard, 2008 Crossover - - - + - - - + 2
Hakooz, 2007 Crossover - + - - - - - + 2
McDanell, 1992 Crossover - - - - - - + - 1

68
2.3.5 Study design, quality and critical analysis
Studies were first ranked based on their design (randomised crossover > non-randomised
crossover > parallel group design) and then by other quality characteristics. Of the 23
studies, 12 employed a randomised, controlled, crossover design (Chang et al., 2007; Chen
et al., 1996; Desager et al., 2002; Lampe et al., 2000a; Lampe et al., 2000b; Navarro et al.,
2009a; Navarro et al., 2011; Navarro et al., 2009b; Nijhoff et al., 1995; Peterson et al., 2009;
Riso et al., 2009; Vistisen et al., 1992) meeting four to eight of the quality characteristics; 10
followed a non-randomised crossover (pre-test, post-test) design (de Waard et al., 2008;
Hakooz & Hamdan, 2007; Kall et al., 1996; Leclercq et al., 1998; McDanell et al., 1992;
Murphy et al., 2001; Murray et al., 2001; Pantuck et al., 1984; Pantuck et al., 1979; Riso et
al., 2014) meeting one to six quality characteristics; and one study had a parallel design with
two cohorts of participants (Bogaards et al., 1994), although it contained more quality
0
0.05
0.1
0.15
0.2
0.25
0.3
0 100 200 300 400 500 600 700 800 900 1000
Stan
dar
dis
ed m
ean
dif
fere
nce
Amount of cruciferous vegetables consumed (g/day)
CYP1A2
GST
Figure 2.5: Dose-response relationship between increase in CYP1A2 activity and daily cruciferous vegetable consumption.

69
characteristics (five) than half of the lower-ranked non-randomised crossover studies. With
regards to sample size, 78% of the studies had ≥ 10 participants (overall range: n = 6 to 73),
which has been suggested to be a sufficient number in quasi-experimental crossover
pharmacokinetic studies (Kakuda et al., 2014). The majority (74%) of study designs included
a basal control diet. Participant adherence to study protocols was addressed in 61% of the
studies, with the vast majority of these being randomised controlled trials. Adherence
measures included diet diaries for the participants, supervised consumption of dietary
intervention meals and housing participants in a research/clinical facility for the duration of
the study. Two studies failed to report details of the statistical analyses used in significance
testing (de Waard et al., 2008; Hakooz & Hamdan, 2007). All but one study (McDanell et al.,
1992) previously or concurrently validated the quantitative assays used to measure
substrate and metabolite concentrations or enzyme levels

70
2.3.6 Discussion
This systematic review investigated the effects of cruciferous vegetable dietary
interventions on drug-metabolising enzymes in humans. While there was marked variability
in the nature of cruciferous vegetable interventions implemented across the studies, the
largest changes in enzyme activity were seen after dietary interventions containing broccoli,
cabbage, cauliflower and Brussels sprouts. These cruciferous vegetables also demonstrated
a dose-response relationship with CYP1A2 (Peterson et al., 2009), GST-α (Navarro et al.,
2009a) and UGT1A1 (Navarro et al., 2009b) activity, in that the increase in enzyme activity
roughly doubled the when doubling the amount of these vegetables consumed. The dietary
interventions studied affected enzyme activity after at least one week of exposure, with
most dietary interventions being consumed for two weeks, giving time for enzyme induction
to occur. Conversely, studies with enzyme inhibition hypotheses, such as those investigating
CYP2E1, administered their dietary interventions within 12 hours of or immediately before
phenotyping to ensure any effect on activity was observed (Chen et al., 1996; Leclercq et al.,
1998). Methods of preparing the cruciferous vegetables for the dietary intervention were
different across the studies. It has been shown that there are significant differences in the
ITC content of cruciferous vegetables depending on whether they are boiled, steamed, stir-
fried or microwaved (Verkerk et al., 2009). Therefore, it is difficult to meaningfully compare
results between the different trials, especially those that did not use standardised dietary
interventions.
The investigated drug-metabolising enzymes included representative CYPs, UGTs and SULTs
alongside GST-α, GST-π, NAT2 and xanthine oxidase. The most frequently studied enzymes
across the 23 studies were CYP1A2, GST-α, UGT1A6 and UGT1A9 (Table 2.1), and most of

71
these studies had multiple high-quality characteristics. A wide variety of pharmacokinetic
metrics were used especially for CYP1A2. Caffeine-derived composite metrics involving
multiple metabolites, such as (AFMU + 1X + 1U)/17X, were used to quantify CYP1A2 activity.
Simpler and less resource-intensive indices (by virtue of requiring the analysis of fewer
metabolites, therefore allowing for simpler assays) have since been validated, such as the 4-
h paraxanthine/caffeine concentration ratios in plasma or saliva (Perera et al., 2012b;
Perera et al., 2011). In general, the CYPs have more validated in vivo phenotyping probes
than the UGTs (Argikar et al., 2008; Miners et al., 2006). While some relatively enzyme-
specific UGT probes have shown promise in human studies (Court, 2005; Court et al., 2002),
substrate redundancy means that most drugs used for phenotyping UGTs are not specific for
the one UGT (Miners et al., 2006). The UGT studies included in this assessment used
substrates that were metabolised by more than one enzyme, i.e. paracetamol, racemic
oxazepam and endogenous bilirubin. Therefore, it is not possible to determine the specific
UGT enzymes induced following cruciferous vegetable consumption, as is also the case for
the SULT studies reviewed. However, because it is the overall clearance of a drug that
affects systemic concentrations, these studies provide information regarding the potential
for diet-drug interactions, even if they cannot identify the specific enzymes involved. It is
worth noting that the included studies investigating UGT enzyme activity all reported a link
between UGT genotype and ITC exposure—something that has not been formally addressed
in the context of how ITC exposure related to changes in CYP activity.
With regards to changes in enzyme activity, of particular note are the studies that
investigated CYP1A2 and GST-α. Nearly all of these studies scored highly with regards to
their quality characteristics. Further, findings were consistent across these studies, with
CYP1A2 and GST-α activity being increased by cruciferous vegetable diets. Individual studies

72
reported increases in enzyme activity ranging from 15-40% (Table 2.1). The meta-analyses
performed demonstrated a significant effect on CYP1A2 and GST-α, with consumption of
Cruciferae increasing the activities of these enzymes by 20-40% and 15-35%, respectively.
Changes in the pharmacokinetics of a medicine as measured by changes in AUC, clearance
or phenotyping metrics in the order of 20-30% (Macaluso et al., 2015) can be considered to
be of potential clinical relevance, warranting further investigation. This suggests that diets
high in cruciferous vegetables could affect the efficacy of drugs (or toxicity of prodrugs)
which are substrates for these enzymes. Importantly, all studies included in this review
enrolled healthy volunteers; the effect of cruciferous vegetable diets on drug-metabolising
enzymes in specific patient groups remains unknown. Therefore, future controlled crossover
studies with pharmacokinetic and pharmacodynamic endpoints would be of benefit to
ascertain whether specific dietary recommendations are needed for patients undergoing
drug therapy with CYP1A2 and GST-α substrates.
Overall, the quality of the literature in this area was considered below average, with only
48% of the 23 included studies found to have adequate sample sizes for their intended
purpose, employ a controlled, crossover design, and have multiple high-quality
characteristics. These ‘gold-standard’ studies all implemented resource-intensive adherence
measures, such as housing participants for the duration of the study and supervising
consumption of dietary intervention meals (Chang et al., 2007; Lampe et al., 2000a; Lampe
et al., 2000b; Navarro et al., 2009a; Navarro et al., 2011; Navarro et al., 2009b; Nijhoff et al.,
1995; Peterson et al., 2009; Riso et al., 2009). Importantly, nearly all of these studies were
framed in the context of a cancer research, in order to understand their contribution to
carcinogen clearance as a proposed mechanism of anti-cancer properties (Peterson et al.,
2009). This review provides a new commentary and perspective on these data in a clinical

73
pharmacology context, highlighting how these effects might affect drug therapy patient
outcomes.
One limitation of this systematic review was that any database-searchable studies published
in languages other than English would not be included. However, the studies included using
these methods did not find any papers in other languages during the title and abstract
scanning stages of the search process. Meta-analysis was not possible for all enzymes in this
review due to the heterogeneous nature or limited number of studies, which was a direct
result of deliberately including all drug-metabolising enzymes represented in this literature.
While this review has achieved its aims as set out above, it is important to note that the
search strategy identified at least 2,000 in vitro and other in vivo studies that didn’t meet
the inclusion criteria, and these studies could also provide valuable insight into the
mechanisms by which phytochemicals in cruciferous vegetables bring about the observed
effects on drug-metabolising enzyme activity reported here. Lastly, the choice to exclude
studies that used cruciferous vegetable or ITC isolates in their interventions greatly limited
the number of studies included in the review. This decision was made while designing the
review’s methodology such that any literature included represented dietary interventions
which were as ‘real-world’ as possible, i.e. whole-food or food-homogenate dietary
interventions similar to those consumed in the community. Conversely, the strengths of this
review lie in its design, with methods adapted from guidelines such as The Cochrane
Handbook for Systematic Reviews of Interventions (2011), increasing confidence that all
published literature in this area has been included in these findings.
Despite several in vitro reports regarding ITCs inhibiting detoxification enzymes (Hamilton &
Teel, 1996; Nakajima et al., 2001; Skupinska et al., 2009a; Skupinska et al., 2009b), the
74
findings of this review are that cruciferous vegetable-enriched diets induce drug metabolism
across multiple phase I and II enzymes rather than inhibit it. One explanation for these
observations could be that ITCs affect drug-metabolising enzymes in a similar fashion to
isoniazid, i.e. short-term inhibition followed by eventual induction of detoxification enzymes
(O'Shea et al., 1997; Zand et al., 1993), which is in-line with the above in vitro/animal and
human studies. Therefore, future in-human studies in this area should include a cruciferous
vegetable intervention immediately before phenotyping as well as after 1-2 weeks of
consumption to assess potential short-term inhibition and longer-term induction of drug-
metabolising enzymes. The proposed mechanisms for ITC-induction of drug metabolism are
comprehensively discussed and reviewed elsewhere (Cheung & Kong, 2010; Thornalley,
2002; Zhang, 2004).

75
2.3.7 Conclusions
In summary, diets high in cruciferous vegetables increase the activity of CYP1A2 and GST-α
in healthy volunteers by between 15-40%, with these findings being supported by meta-
analysis of multiple studies exhibiting high-quality characteristics. Therefore, people
regularly eating large amounts of cruciferous vegetables and concomitantly taking
medicines, which are substrates for these enzymes could have altered drug-exposure
profiles, contributing to changes in the efficacy and toxicity of affected medicines. It follows
that further prospective, controlled, dietary intervention trials involving different substrates
of CYP1A2 and GST-α are needed to assess the clinical relevance of cruciferous vegetable
food-drug interactions in their relevant disease-state contexts and patient populations.
The quality of the evidence covering the other enzymes included in this review is below
average, and it remains unclear if these and other important drug-metabolising enzymes are
affected to a clinically significant extent. This statement is especially pertinent for the
remaining members of the five main CYP enzymes, namely CYP2D6, 2C19, 2C9 and 3A4, for
which there are no published studies that analyse their activity following a cruciferous
vegetable intervention.
These data suggest that any future trials investigating the interaction between CYP1A2
activity and Cruciferae-enriched diets should show subsequent induction of CYP1A2 enzyme
activity. It is important to note that none of the studies included in this review were
designed to detect any differences in response to cruciferous vegetables between various
geographic ancestries; South Asians were not represented in the data. Further, evidence has
been presented that UGT and GST genotypes, especially the null-alleles of these genes,
attenuate the response to ITC exposure.

76
Therefore, the findings of this review generate a rationale to explore how geographic
ancestry, genetics and Cruciferae-enriched diets interact to affect CYP enzyme activity,
which is of interest in Europeans and South Asians for the reasons laid out in Chapter 1.
Hypotheses based on this rationale are presented and tested in a prospective, 3-period,
controlled trial in Chapter 5 of this thesis.
However, before conducting such a trial, appropriate bioanalytical methods that allow for
the effective estimation of CYP activity in vivo and measurement of ITC systemic exposure
are required. The design, validation and optimisation of two such assays are presented over
the next two chapters, and their successful application in a clinical trial is reported in
Chapter 5.

77
3 An improved and optimised version of the ‘Inje’ and
‘Ghassabian’ cytochrome P450-phenotyping cocktails: a
simplified and highly sensitive UHPLC-MS/MS cocktail assay in
human plasma
3.1 Introduction
The importance of studying CYP enzyme activity has been reviewed and discussed in section
1.3.1.1. Further, the utility of the CYP-phenotyping cocktail approach and its relevant
background to this thesis was reviewed and discussed in sections 1.6.
Chapter 3 therefore covers the design, validation and optimisation of a simplified UHPLC-
MS/MS CYP-phenotyping assay in human plasma, that can be used to simultaneously
phenotype CYP1A2, CYP2C19, CYP2C9, CYP2D6 and CYP3A4 across a variety of clinical and
research settings. The starting points for this study were the Inje (Ryu et al., 2007) and
Ghassabian (Ghassabian et al., 2009) cocktails because of the wide global availability and
previous internal and external validation of their CYP450 enzyme-specific probe drugs:
caffeine (CYP1A2), omeprazole (CYP2C19), losartan (CYP2C9), dextromethorphan (CYP2D6)
and midazolam (CYP3A4).
78
3.2 Methods
3.2.1 Chemicals and reagents
Caffeine, losartan potassium, omeprazole, paraxanthine and phenacetin were purchased
from Sigma-Aldrich (Castle Hill, NSW, Australia); dextromethorphan, dextrorphan tartrate,
midazolam and α-hydroxymidazolam were purchased from Kinesis (Redland Bay, QLD,
Australia); 5-hydroxyomeprazole and losartan carboxylic acid (EXP-3174) were purchased
from Ramidus AB (Lund, Sweden). Acetonitrile, methanol, water, ammonium formate and
formic acid were purchased from Sigma-Aldrich (Castle Hill, NSW, Australia); all solvents and
reagents were HPLC-grade or above. Oasis HLB solid-phase extraction (SPE) cartridges (3 mL,
60 mg) were purchased from Waters (Dundas, NSW, Australia).
3.2.2 Stock and working solutions
Stock solutions (1 mg/mL) of analytes and the internal standard (IS) phenacetin were
prepared by weighing and dissolving compounds in acetonitrile (phenacetin), water
(caffeine and paraxanthine) or methanol (all other analytes); dextromethorphan,
dextrorphan tartrate, midazolam and α-hydroxymidazolam were supplied as certified
standard solutions in sealed amber vials (1 mg/mL in methanol). All stock solutions were
stored at -20 °C in silanised vials (Shimadzu, Rydalmere, NSW, Australia). Working solutions
for preparation of plasma calibrators and quality control (QC) samples were made by mixing
microlitre aliquots of stock solutions and serially diluting with water:methanol:acetonitrile
(2:1:1, v/v) to construct the standard curves (10 µL working solution added to 100 µL
plasma). Working solutions were prepared with each batch of samples analysed and stored
at -20 °C in 2 mL Eppendorf tubes (POCD, Artarmon, NSW, Australia).
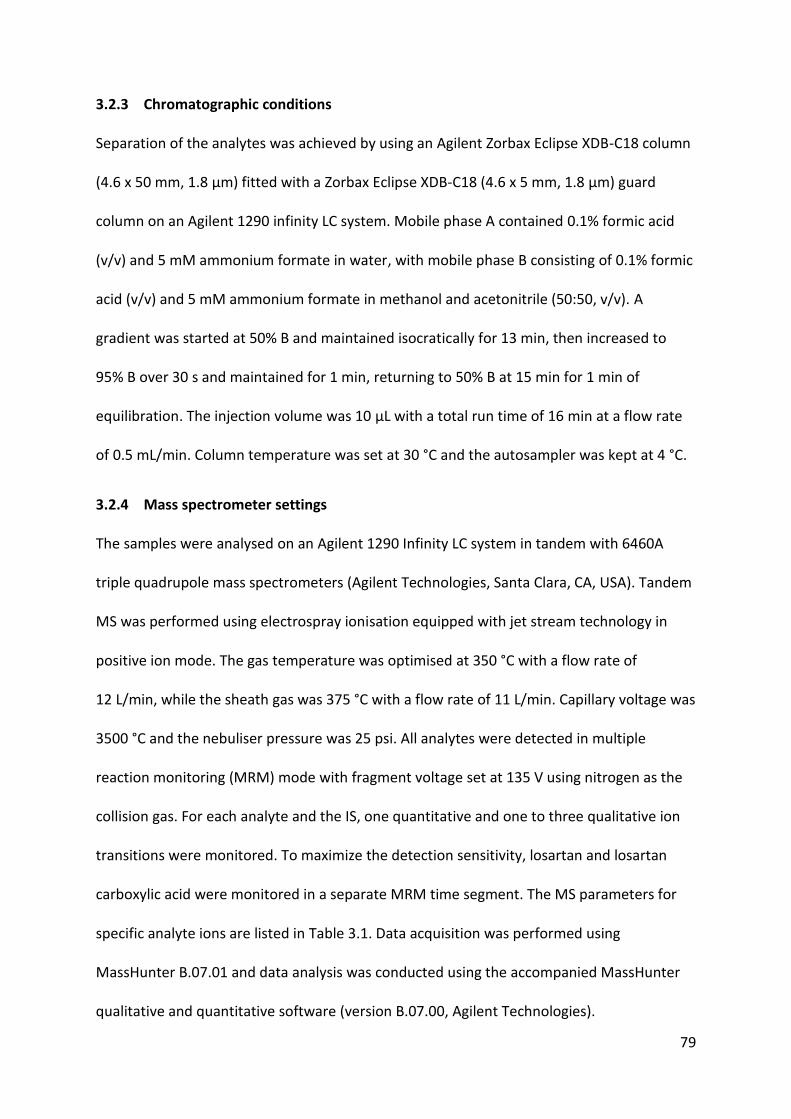
79
3.2.3 Chromatographic conditions
Separation of the analytes was achieved by using an Agilent Zorbax Eclipse XDB-C18 column
(4.6 x 50 mm, 1.8 µm) fitted with a Zorbax Eclipse XDB-C18 (4.6 x 5 mm, 1.8 µm) guard
column on an Agilent 1290 infinity LC system. Mobile phase A contained 0.1% formic acid
(v/v) and 5 mM ammonium formate in water, with mobile phase B consisting of 0.1% formic
acid (v/v) and 5 mM ammonium formate in methanol and acetonitrile (50:50, v/v). A
gradient was started at 50% B and maintained isocratically for 13 min, then increased to
95% B over 30 s and maintained for 1 min, returning to 50% B at 15 min for 1 min of
equilibration. The injection volume was 10 µL with a total run time of 16 min at a flow rate
of 0.5 mL/min. Column temperature was set at 30 °C and the autosampler was kept at 4 °C.
3.2.4 Mass spectrometer settings
The samples were analysed on an Agilent 1290 Infinity LC system in tandem with 6460A
triple quadrupole mass spectrometers (Agilent Technologies, Santa Clara, CA, USA). Tandem
MS was performed using electrospray ionisation equipped with jet stream technology in
positive ion mode. The gas temperature was optimised at 350 °C with a flow rate of
12 L/min, while the sheath gas was 375 °C with a flow rate of 11 L/min. Capillary voltage was
3500 °C and the nebuliser pressure was 25 psi. All analytes were detected in multiple
reaction monitoring (MRM) mode with fragment voltage set at 135 V using nitrogen as the
collision gas. For each analyte and the IS, one quantitative and one to three qualitative ion
transitions were monitored. To maximize the detection sensitivity, losartan and losartan
carboxylic acid were monitored in a separate MRM time segment. The MS parameters for
specific analyte ions are listed in Table 3.1. Data acquisition was performed using
MassHunter B.07.01 and data analysis was conducted using the accompanied MassHunter
qualitative and quantitative software (version B.07.00, Agilent Technologies).
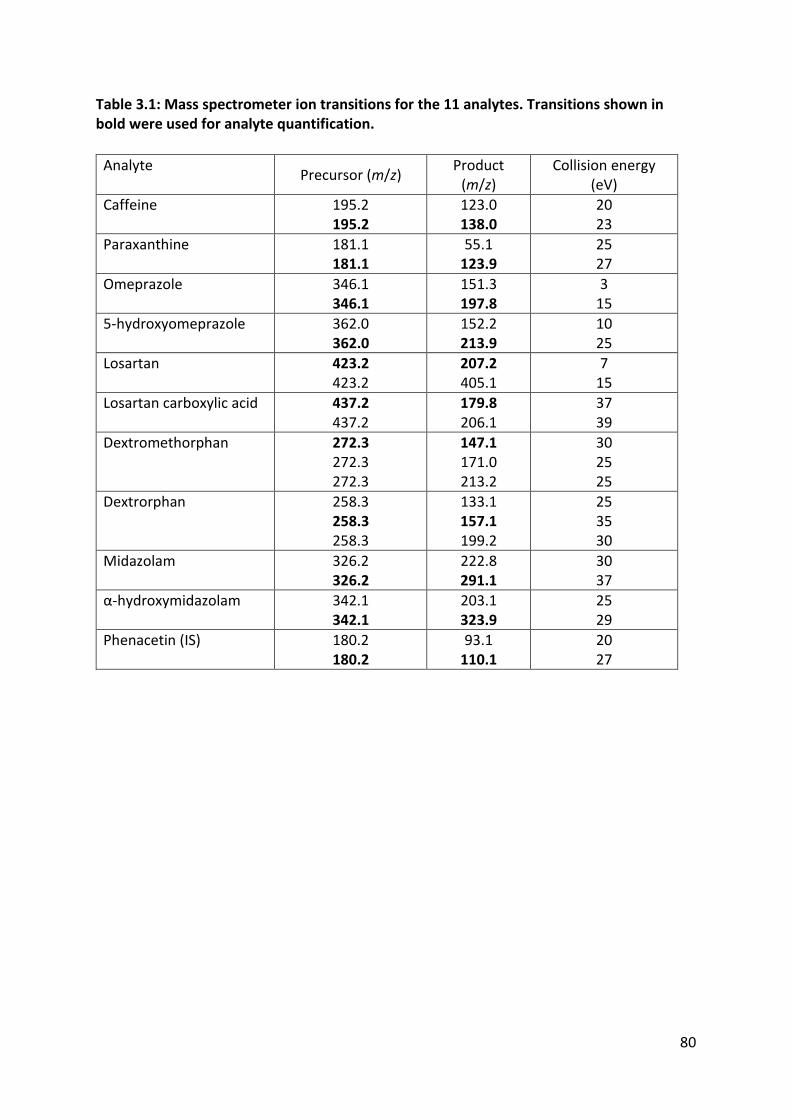
80
Table 3.1: Mass spectrometer ion transitions for the 11 analytes. Transitions shown in bold were used for analyte quantification.
Analyte Precursor (m/z)
Product (m/z)
Collision energy (eV)
Caffeine
195.2 195.2
123.0 138.0
20 23
Paraxanthine
181.1 181.1
55.1 123.9
25 27
Omeprazole
346.1 346.1
151.3 197.8
3 15
5-hydroxyomeprazole
362.0 362.0
152.2 213.9
10 25
Losartan
423.2 423.2
207.2 405.1
7 15
Losartan carboxylic acid
437.2 437.2
179.8 206.1
37 39
Dextromethorphan
272.3 272.3 272.3
147.1 171.0 213.2
30 25 25
Dextrorphan
258.3 258.3 258.3
133.1 157.1 199.2
25 35 30
Midazolam
326.2 326.2
222.8 291.1
30 37
α-hydroxymidazolam 342.1 342.1
203.1 323.9
25 29
Phenacetin (IS)
180.2 180.2
93.1 110.1
20 27

81
3.2.5 Method validation
This assay was validated with reference to the US FDA guidelines for bioanalytical studies,
which outline acceptable criteria for assay selectivity, sensitivity, accuracy and precision . All
assay parameters were validated using drug-free human plasma which was donated by
healthy volunteers who had abstained from all study medicines (including sources of dietary
caffeine) for at least 72 hours. Calibrators and QCs were prepared by spiking drug-free
plasma with known amounts of analytes; different stock and working solutions were used to
make calibrators and QCs respectively. Peak area ratios of analytes to the IS across 8
concentrations in plasma were used to generate calibration curves for each analyte.
The linearity of the curves (Table 3.2) was assessed using least-squares regression, while
accuracy of the calibrators was assessed by comparing their calculated concentrations with
nominal concentrations (relative error; RE). QC samples were prepared at low, middle and
high concentrations (Table 3.3) and were analysed in replicates of five across three different
days. Inter- and intra-day accuracy were calculated using the RE of QC samples and inter-
and intra-day precision was assessed using their relative standard deviation (RSD). Accuracy
and precision were deemed acceptable if deviations at a given concentration were ≤ 15%,
except at the lower limit of quantification (LLOQ), which could deviate up to 20%. The LLOQ
was defined as the lowest point on the analyte calibration curves that met the above
accuracy and precision criteria.
Recovery and matrix effects were also investigated. Recovery was assessed by calculating
the RE of analyte peak areas in plasma spiked pre-extraction relative to analyte peak areas
in blank plasma spiked post-extraction. Matrix effects were evaluated using the RE of
analyte peak areas in blank plasma spiked post-extraction relative to analyte peak areas in

82
water:methanol:acetonitrile (2:1:1, v/v) that contained the same amount of analyte. Formal
stability studies were not conducted as these have previously shown no significant changes
in analyte response for this cocktail during various sample storage and handling situations
(Ghassabian et al., 2009; Grangeon et al., 2017; Oh et al., 2012; Ryu et al., 2007; Yin et al.,
2004), however, analyte response was monitored in the stock solutions, working solutions
and reconstituted samples left in the autosampler at various times. All showed < 15% RE
compared to concentrations derived from fresh calibration curves. Of interest, when left in
acetonitrile at room temperature for up to a week, phenacetin showed concentration
deviations of < 5% RE, indicating high stability in this solvent.
Table 3.2: Retention times, LLOQs, calibration curve ranges and least-squares regression results. Linearity assessed over 3 different runs.
Analyte Retention time (min)
LLOQ (ng/mL) Calibration range
(ng/mL) R2 (mean ± SD)
(n = 3)
Caffeine 1.19 23.4 23.4-3000 0.983 ± 0.011 Paraxanthine 1.32 23.4 23.4-3000 0.991 ± 0.010 Omeprazole 2.78 1.95 1.95-250 0.999 ± 0.001
5-hydroxyomeprazole 1.70 7.81 7.81-1000 0.999 ± 0.001 Losartan 6.32 3.58 3.58-458.7 0.993 ± 0.003 EXP-3174 8.76 7.81 7.81-1000 0.993 ± 0.001 Dextromethorphan 2.46 1.09 1.09-139.8 0.985 ± 0.012 Dextrorphan 1.30 0.78 0.78-100 0.994 ± 0.004 Midazolam 2.75 0.78 0.78-100 0.999 ± 0.000 α-hydroxymidazolam 3.70 0.78 0.78-100 0.998 ± 0.001
3.2.6 Sample preparation and analyte extraction
All spiked and clinically-acquired plasma samples were stored at -80 °C until the time of
analysis. Plasma aliquots (100 µL) were mixed with 400 µL of acetonitrile containing 2 ng IS
and vortex-mixed for 1 min to precipitate plasma proteins, then centrifuged for 10 min at
20 817 g. The resulting supernatant was transferred to a 2 mL Eppendorf tube and
evaporated under vacuum at 45 °C using a centrifugal concentrator, followed by

83
reconstitution in 1 mL water and 1 min of vortex-mixing. The reconstituted samples (1 mL)
were then loaded onto SPE cartridges which had been conditioned with 1 mL methanol
followed by 1 mL. The cartridges were washed with 2 mL water followed by 2 mL 10%
methanol in water (v/v) before elution of the analytes with 2 mL methanol. The eluent was
evaporated under vacuum at 45 °C, reconstituted in 100 µL water:methanol:acetonitrile
(2:1:1, v/v), vortex-mixed for 1 min and centrifuged for 10 min at 20 817 g before
transferring to an autosampler vial containing a 200 µL insert.
3.2.7 Clinical application
Following validation, this assay was successfully used to analyse samples and phenotype six
healthy volunteers. This study was approved by Sydney Local Health District Human
Research Ethics Committee and required the participant to provide informed written
consent during a face-to-face interview. In brief, after an overnight fast, a venous cannula
was inserted into a forearm vein and a baseline t = 0 h blood sample was collected into a
lithium-heparinised 10 mL tube (BD, North Ryde, NSW, Australia). Immediately afterwards,
the participant was orally administered the CYP-phenotyping cocktail with 250 mL of plain
water: caffeine 100 mg (No-Doz® tablets; Key Pharmaceuticals, NSW, Australia), omeprazole
20 mg (Ozmep® enteric-coated tablets; Medis Pharma, NSW, Australia), losartan 25 mg
(Cozavan® tablets; Alphapharm, NSW, Australia), dextromethorphan 30 mg (Bisolvon Dry®
10 mg/5 mL liquid; Sanofi-Aventis Healthcare, QLD, Australia) and midazolam 2 mg
(Midazolam Sandoz® 5 mg/5 mL vials for injection; Sandoz, NSW, Australia). Caffeine,
omeprazole and losartan were administered as tablets, while dextromethorphan (15 mL)
and midazolam (2 mL) liquids were swallowed immediately after being mixed together in a
small disposable cup. Blood samples were then serially collected at t = 1, 2, 4 and 6 h post-
administration of the phenotyping medicines. Plasma was harvested from whole blood

84
samples by centrifuging the 10 mL collection tubes at 2000 g for 10 min followed by removal
of the supernatant and storage at -80 °C until analysis. The remaining haematocrit was kept
and stored at -80 °C for genotyping purposes. Participants were allowed to consume a small
snack after the 2-h sample and lunch after the 4-h sample to minimise any potential food-
effects on the pharmacokinetics of the probe drugs.
3.2.8 CYP-phenotyping and pharmacokinetic analyses
The following plasma concentration-time-derived metrics were used to estimate in vivo CYP
activity: CYP1A2 = paraxanthine/caffeine concentration ratio at 4-h; CYP2C19 = 5-
hydroxyomeprazole/ omeprazole concentration ratio at 4- or 6-h (due to variable lag in
absorption); CYP2C9 = losartan carboxylic acid AUC0-6 h/losartan AUC0-6 h ratio; CYP2D6 =
dextrorphan AUC0-6 h/dextromethorphan AUC0-6 h ratio; and CYP3A4 = α-
hydroxymidazolam/midazolam concentration ratio at 4-h. The previous validation of these
metrics was discussed in Chapter 1.
3.3 Results
3.3.1 Selectivity and sensitivity
Analyte-free plasma from six different healthy volunteers underwent sample extraction and
was checked for interference at the mass transitions and retention times of the 10 analytes
and IS. No overlapping peaks or signal abnormalities were detected. LLOQs were
determined by choosing analyte concentrations that had peaks at least 5-times higher than
the response of a blank sample, and that displayed accuracy of 80-120% and a precision of
≤ 20%. Amounts of analyte injected on-column ranged from 7.80-234.4 pg, representing up
to an 80-fold improvement in sensitivity compared to similar assays (Ghassabian et al.,
2009; Ryu et al., 2007; Yin et al., 2004). Analyte retention times and LLOQs are displayed in

85
Table 3.2, and blank plasma and analyte LLOQ chromatogram overlays are depicted in
Figure 3.1.
3.3.2 Calibration curves and linearity
Linear equations with 1/x weighting provided the best-fit regression models for all analytes.
All calibration curves had coefficients of determination (R2) of 0.983 or higher and spanned
large concentration ranges (Table 3.2).
3.3.3 Accuracy and precision
Intra- and inter-day accuracy and precision for the 10 analytes and IS are shown in Table 3.3.
All analytes had intra-day accuracy (RE) and precision (RSD) ranging between 90.7-110.2%
and 0.46-11.4% respectively. Inter-day accuracy and precision ranged between 87.0-110.5%
and 1.36-11.2% respectively.
3.3.4 Recovery and matrix effects
Recovery ranged from 34.1-104.9% across the analytes and IS at all tested concentrations
with high reproducibility and consistency (RSD range 0.48-7.9%), indicating that
quantification was not adversely affected for drugs with lower recoveries. Matrix effects
varied widely across the analytes and IS at the tested concentrations (range 23.4-251.3%).
The most marked ion enhancement was seen for α-hydroxymidazolam (233.0-251.3%), with
caffeine (30.8-41.5%), paraxanthine (23.4-27.6%) and dextrorphan (37.4-40.3%) displaying
significant ion suppression. In a similar fashion to recovery, matrix effects were consistent
and reproducible across batches and plasma sources (RSD range 0.48-10.8%) and did not
affect successful quantification of analytes across the tested concentration ranges.
86
3.3.5 Clinical application of assay
A representative concentration-time profile for each probe drug and their metabolites in a
single healthy volunteer receiving the CYP-phenotyping cocktail is shown in Figure 3.3.
Calibrators and QCs from these batches all met accuracy (RE 85-115%) and precision (RSD
< 15%) requirements.

87
Table 3.3: Accuracy and precision data for each analyte and the IS. Intra-day accuracy and precision n = 5 for each concentration. Inter-day accuracy and precision n = 15 for each concentration (5 x replicates across 3 different runs).
Analyte Nominal concentration (ng/mL)
Intra-day accuracy (RE %)
Inter-day accuracy (RE %)
Intra-day precision (RSD %)
Inter-day precision (RSD %)
Caffeine 93.8 97.2 92.9 1.44 6.05 750 107.1 100.4 4.42 2.98 3000 93.2 89.9 2.62 3.54 Paraxanthine 93.8 95.2 99.5 8.67 11.2 750 90.7 95.1 4.54 8.85 3000 94.4 97.3 3.40 9.00 Omeprazole 7.81 103.8 103.8 2.54 3.95
62.5 107.6 107.1 1.24 1.36 250 97.6 97.4 2.00 1.61 5-hydroxyomeprazole 31.3 100.8 95.8 8.90 4.28 250 98.3 99.1 1.82 2.20 1000 104.1 101.9 2.63 2.20 Losartan 14.3 97.8 101.4 0.58 2.96 114.7 96.1 96.6 3.20 3.68 458.7 101.2 110.5 1.29 3.07 EXP-3174 31.3 98.4 101.4 2.55 3.50 250 97.4 96.6 11.4 6.59 1000 110.2 110.5 1.30 3.69 Dextromethorphan 4.37 93.1 104.3 7.88 7.80
35.0 99.4 102.0 0.46 5.11 139.8 101.6 102.1 8.31 6.32 Dextrorphan 3.13 99.6 94.2 5.69 6.10 25 104.3 98.2 7.00 5.84 100 93.5 87.0 1.69 4.96 Midazolam 3.13 102.4 104.3 3.57 3.45 25 104.3 101.5 1.13 2.14 100 98.2 97.9 1.18 1.63 α-hydroxymidazolam 3.13 103.9 100.5 3.82 3.17 25 99.2 97.5 1.53 2.17 100 102.1 102.1 1.45 1.99 Phenacetin (IS) 20 N/A N/A 2.87 5.71

88
Time (min) Time (min) Time (min)
Time (min) Time (min) Time (min)
Ab
un
dan
ce
Ab
un
dan
ce
Ab
un
dan
ce
Ab
un
dan
ce
Ab
un
dan
ce
Ab
un
dan
ce
Caffeine 938 pg 195.2 → 138.0
Paraxanthine 938 pg 181.1 → 123.9
Omeprazole 78.1 pg 346.1 → 197.8
5-hydroxyomeprazole 313 pg 362.0 → 213.9
Losartan 143 pg 423.2 → 207.2
Losartan carboxylic acid 313 pg 437.2 → 179.8
Figure 3.1: Chromatogram overlays of the 10 analytes and internal standard phenacetin as a mixture in human plasma.

89
Time (min) Time (min) Time (min)
Ab
un
dan
ce
Ab
un
dan
ce
Ab
un
dan
ce
Ab
un
dan
ce
Ab
un
dan
ce
Dextromethorphan 43.7 pg 272.3 → 147.1
Dextrorphan 31.3 pg 258.3 → 157.1
Midazolam 31.3 pg 326.2 → 291.1
α-hydroxymidazolam 31.3 pg 342.1→ 323.9
Phenacetin 200 pg 180.2 → 110.1
Chromatogram overlays of the 10
analytes and internal standard
phenacetin as a mixture in human
plasma. Each figure is an overlay
of a chromatogram of an analyte
in plasma (black) and a blank
plasma sample (red). Amount of
analyte on-column (pg) and mass
transitions (m/z) are displayed
below the analyte name.
Figure 3.2 (cont.): Chromatogram overlays of the 10 analytes and internal standard phenacetin as a mixture in human plasma.
Time (min) Time (min)

90
Representative concentration-time profiles of the five probe drugs and their primary
CYP450-mediated metabolites. Data shown from one healthy participant who was
administered caffeine 100 mg, omeprazole 20 mg, losartan 25 mg, dextromethorphan 30
mg and midazolam 2 mg.
0.00
2000.00
4000.00
6000.00
8000.00
10000.00
0 2 4 6 8
Co
nce
ntr
atio
n (
nM
)
Time (h)
CYP1A2
Caffeine
Paraxanthine
0.00
10.00
20.00
30.00
40.00
50.00
0 2 4 6 8
Co
nce
ntr
atio
n (
nM
)
Time (h)
CYP2D6
Dextromethorphan
Dextrorphan
0.00
200.00
400.00
600.00
800.00
1000.00
0 2 4 6 8
Co
nce
ntr
atio
n (
nM
)
Time (h)
CYP2C19
Omeprazole
5-hydroxyomeprazole
0.00
50.00
100.00
150.00
200.00
0 2 4 6 8
Co
nce
ntr
atio
n (
nM
)
Time (h)
CYP2C9
Losartan
Losartan carboxylic acid
0.00
5.00
10.00
15.00
20.00
25.00
30.00
35.00
0 2 4 6 8
Co
nce
ntr
atio
n (
nM
)
Time (h)
CYP3A4
Midazolam1'-hydroxymidazolam
Figure 3.3: Representative concentration-time profiles of the five probe drugs and their primary CYP-catalysed metabolites.

91
3.4 Discussion
This improved and optimised analytical technique to measure a cocktail of CYP450 probe
drugs (Ghassabian et al., 2009; Ryu et al., 2007) meets FDA-recommended specifications for
specificity, sensitivity, accuracy and precision. Further, it has been used to analyse the
samples from an investigator-initiated clinical trial of the probe drugs demonstrating its
ability to be readily applied to clinical research. These methods allow for in vivo analysis of
five CYP-phenotyping probe drugs, their metabolites and an internal standard in human
plasma without evidence of low recovery or significant matrix effects impeding
quantification.
Several recently published assays simultaneously analyse more than five CYP-phenotyping
probe drugs and their metabolites (Bosilkovska et al., 2014a; Donzelli et al., 2014; Grangeon
et al., 2017), namely CYP2B6 and CYP2E1 substrates in addition to CYP1A2, CYP2C19,
CYP2C9, CYP2D6 and CYP3A4, otherwise known as ‘the main five CYP enzymes’ (Zanger &
Schwab, 2013). However, the CYP2B6 and CYP2E1 enzymes are estimated to contribute to
only 10% of drug metabolism in humans (Zanger & Schwab, 2013), and including them in a
cocktail of probe drugs can necessitate an analytical technique with multiple sample
extraction steps and chromatographic conditions, along with duplicate sample injections
(Grangeon et al., 2017). In fact, the added preparatory and chromatographic complexity
when determining these two enzymes in addition to the main five CYP enzymes is
significant. Grangeon et al. (2017) report two separate, multi-step analyte extraction
protocols (one for caffeine and another for the remaining analytes) and three separate
chromatographic runs per sample in order to analyse the activity of all seven CYP enzymes.
Further, one of the extraction protocols has multiple evaporation and reconstitution sub-

92
steps, each involving different reconstitution solutions depending on the analytes in
question. This compares with the currently presented method, which uses a two-step
extraction method (protein precipitation followed by SPE) and one set of chromatographic
conditions for all analytes, considerably saving time and money by reducing labour and
resource costs per sample.
This optimised assay uses a non-isotopically-labelled IS (phenacetin) for quantification of the
five probe drugs and their primary metabolites. Grangeon et al. (2017) suggest that using
isotopically-labelled analytes as internal standards aids in minimizing matrix effects, which
can be true in certain circumstances (Li et al., 2013). However, the extent to which this
occurs would be negligible if the analytes do not affect the other analytes present, as is the
case for the currently presented assay (Ryu et al., 2007). Further, Ghassabian et al. (2009)
demonstrated that phenacetin serves as a suitable ‘all-rounder’ surrogate for the
physicochemical profiles of the 10 cocktail analytes, and its use as an internal standard did
not adversely affect the accuracy or precision of their quantification; a finding replicated in
this improved version of the assay.
Low recovery and significant matrix effects reduce the efficiency of the LC-MS/MS
bioanalytical technique, which in turn can translate into a reduction in sensitivity, precision
and accuracy (Taylor, 2005). Lower recoveries for paraxanthine, dextromethorphan and
dextrorphan, and matrix effects for caffeine, paraxanthine, dextrorphan and α-
hydroxymidazolam were noted. While further improving the analytical efficiency of these
analytes would be of value and interest, the recoveries and matrix effects were highly
consistent within and across batches such that quantification was unaffected, even at the
lowest concentrations. Of interest, nearly all similarly-designed cocktail assays report high

93
recoveries and little or no matrix effects for these analytes in human plasma (Grangeon et
al., 2017; Lammers et al., 2016; Oh et al., 2012; Tanaka et al., 2014), which is in contrast
with the current study. Only Wohlfarth et al. (2012) report ion suppression for dextrorphan
(37-58%) at similar values. Further, neither Oh et al. (2012) or Ghassabian et al. (2009)
published matrix effect values. Most studies fail to report RSDs of the matrix effects, and
Grangeon et al. (2017) report using calibration curves to calculate matrix effects, which
should instead be calculated using peak area ratios of samples spiked post-extraction (or
from a post-column infusion) to pure analytes in solvent (Van Eeckhaut et al., 2009).
Therefore, the true variability of the matrix effects for these analytes remains unknown, and
future studies should report means, standard deviations and RSDs of any ion enhancement
and suppression observations.
This assay uses both protein precipitation and SPE to prepare the sample for UHPLC-MS/MS
analysis. While this adds time and cost for sample preparation compared to simple dilution
techniques, the addition of these steps was necessary when routinely injecting large
numbers of samples onto the UHPLC system. Preliminary tests injecting untreated plasma
on-column caused high-pressure issues and needle seat blockages as injecting untreated,
diluted plasma on-column is widely accepted as being problematic for UHPLC-MS/MS
systems in a general sense, including negative implications for sensitivity, selectivity and
matrix effects (Bonfiglio et al., 1999; Müller et al., 2002). Even when using protein
precipitation and SPE, large numbers of samples still caused some high-pressure issues, at a
lower frequency and slower rate of pressure rise, highlighting the importance of sample
clean-up steps when using sensitive, high-throughput setups Some recent cocktail assays
injecting untreated human plasma directly on-column report no adverse effects on

94
sensitivity, selectivity or matrix effects (Bosilkovska et al., 2014a; Zadoyan et al., 2012),
however these techniques do not discuss the effects on assay robustness.
3.5 Conclusions
In conclusion, the currently-presented analytical technique successfully uses UHPLC-MS/MS
to simultaneously analyse five CYP phenotyping probe drugs, their primary CYP-mediated
metabolites and an internal standard in human plasma. This technique can support the
simultaneous in vivo phenotyping of the activity of CYP1A2, CYP2C19, CYP2C9, CYP2D6 and
CYP3A4. This method meets US FDA recommendations for bioanalytical methods including
selectivity, sensitivity, accuracy and precision. This assay’s relative simplicity and
applicability compares favourably to other published assays for CYP probe drugs. This
method represents an improved and optimised version of the internally- and externally-
validated cocktails used in the Inje (Ryu et al., 2007) and Ghassabian (Ghassabian et al.,
2009) assays, with increases in sensitivity of up to 80-fold, and a significant reduction in
sample handling and preparatory complexity.
Following validation of this assay, it was used as described at the end of Chapter 2 to
estimate CYP activity in 21 people of either European or South Asian geographic ancestry
before, during and after consuming a broccoli-enriched diet (Chapter 5). In a similar fashion,
the next chapter outlines a second bioanalytical method that was needed to measure
sulforaphane exposure when testing the other hypotheses set out in Chapter 5.

95
4 An improved UHPLC-MS/MS assay for measuring sulforaphane
in human plasma following a broccoli-enriched diet
4.1 Introduction
The importance of the isothiocyanates (ITCs) and their effects on drug-metabolising
enzymes were discussed in section 1.7.1 of this thesis. Briefly recapping, these compounds
are found in relatively high concentrations in cruciferous vegetables such as broccoli,
cabbage and watercress, which feature almost ubiquitously in many diets across the globe
(Steinkellner et al., 2001). These compounds induce phase I and II drug-metabolising
enzymes, which significantly contribute to the metabolism, and therefore the clearance, of
carcinogenic compounds and other xenobiotics (Cheung & Kong, 2010; Thornalley, 2002;
Zhang, 2004). Most studies investigating these effects are designed to test hypotheses in a
cancer-focussed context, with the two most represented ITCs being sulforaphane (SUL) and
phenethyl isothiocyanate (PEITC) (Lamy et al., 2011).
Food-drug interaction studies require selective, sensitive, accurate and precise bioanalytical
methods to quantify molecules of interest in biological matrices, which is usually achieved
with high-performance liquid chromatography (HPLC) or liquid chromatography-tandem
mass spectrometry (LC-MS/MS). Studies to validate and implement assays that quantify SUL
that meet these criteria have been used with varying levels of success over the years
(Agrawal et al., 2006; Alumkal et al., 2015; Ares et al., 2015; Clarke et al., 2011; Gasper et
al., 2005; Hauder et al., 2011; Janobi et al., 2006; Kumar & Sabbioni, 2010; Platz et al.,
2015). However, these assays are not without their issues, including 13-35 minute
chromatographic run times (Agrawal et al., 2006; Alumkal et al., 2015; Janobi et al., 2006)
and relatively large plasma volumes (0.5 mL) (Hauder et al., 2011; Janobi et al., 2006).

96
Therefore, as outlined in the main objectives of this thesis (section 1.9), the aim of this study
was to design, optimise and validate a simplified ultra-performance liquid chromatography
(UHPLC)-MS/MS assay for sulforaphane in human plasma, which addresses the above issues
and can readily be set up for use in food-drug and ITC-drug interaction studies.

97
4.2 Methods
4.2.1 Chemicals and reagents
Phenacetin (Internal standard) was purchased from Sigma-Aldrich (Castle Hill, NSW,
Australia); (R,S)-sulforaphane was purchased from Abcam (Melbourne, VIC, Australia).
Acetonitrile, methanol, water, formic acid and trifluoroacetic acid (TFA) were purchased
from Sigma-Aldrich (Castle Hill, NSW, Australia). All solvents and reagents were HPLC-grade
or above. Discovery C18 solid-phase extraction (SPE) cartridges (1 mL, 100 mg) were
purchased from Sigma-Aldrich (Castle Hill, NSW, Australia).
4.2.2 Stock and working solutions
Stock solutions of SUL and the internal standard (IS) phenacetin were prepared at 1 mg/mL
by weighing and dissolving the compounds in acetonitrile. All stock solutions were stored at
-20 °C in silanised vials (Shimadzu, Rydalmere, NSW, Australia). Working solutions for
preparation of plasma calibrators and quality control (QC) samples were made by mixing
microlitre aliquots of stock solutions and serially diluting with 0.1% formic acid in water
(v/v), such that 10 µL of working solution when added to 100 µL plasma produced analyte
concentrations used to construct standard curves. Working solutions were prepared fresh at
the start of a given batch of samples and stored at -20 °C in 2 mL Eppendorf tubes (POCD,
Artarmon, NSW, Australia).
4.2.3 Chromatographic conditions
Analyte separation was achieved on an Agilent Zorbax Eclipse XDB-C18 column (4.6 x
50 mm, 1.8 µm) fitted with a UHPLC Zorbax Eclipse XDB-C18 (4.6 x 5 mm, 1.8 µm) guard
column. Mobile phase A contained 0.1% formic acid in water (v/v) and mobile phase B
consisted of 0.1% formic acid in acetonitrile (v/v). A gradient was started at 50% B and

98
maintained isocratically for 5 min, then increased to 100% B over 1 min and maintained for
1 min, returning to 50% B over 0.5 min followed by 1 min of equilibration. The injection
volume was 10 µL with a total run time of 8.5 min at a flow rate of 0.2 mL/min. Column
temperature was set at 30 °C and the autosampler was kept at 4 °C.
4.2.4 Mass spectrometer settings
Analyses were performed on an Agilent 1290 series UHPLC system in tandem with 6460A
triple quadrupole mass spectrometers (Agilent Technologies, Santa Clara, CA, USA). Tandem
MS was conducted using electrospray ionisation equipped with jet stream technology in
positive ion mode. The gas temperature was optimised at 350 °C with a flow rate of
12 L/min, while the sheath gas was 375 °C with a flow rate of 11 L/min. Capillary voltage was
3500 °C and the nebuliser pressure was 25 psi. SUL and the IS were detected in multiple
reaction monitoring (MRM) mode with fragment voltages set at 60 V and 80 V, respectively,
using nitrogen as the collision gas. For both molecules, one quantitative and one qualitative
ion transition were monitored. A detailed summary of the MS parameters for specific
analyte ions is presented in Table 4.1. Data was acquired using MassHunter B.07.01 and
data analysis was conducted using the accompanied MassHunter qualitative and
quantitative software (version B.07.00, Agilent Technologies).
Table 4.1: Mass spectrometer ion transitions for SUL and the phenacetin (IS). Transitions shown in bold were used for analyte quantification.
Analyte Precursor (m/z) Product
(m/z) Collision energy
(eV)
Sulforaphane
178.0 178.0
72.0 114.1
40 15
Phenacetin (IS)
180.1 180.1
65.1 110.0
35 25

99
4.2.5 Method validation
This assay was validated with reference to the US FDA guidelines for bioanalytical studies,
which outline acceptable criteria for assay selectivity, sensitivity, accuracy and precision. All
assay parameters were validated using ITC/drug-free human plasma, which was donated by
healthy volunteers who had abstained from all medicines and cruciferous vegetables for at
least one week. Calibrators and QCs were made by spiking ITC/drug-free plasma with known
amounts of SUL; different stock and working solutions were used to make calibrators and
QCs respectively. The peak area ratios of SUL to the IS across eight concentrations in plasma
were used to generate calibration curves for the purpose of quantification. The linearity of
the curve was assessed using least-squares regression, while accuracy of the calibrators was
assessed by comparing their calculated concentrations with nominal concentrations
(relative error; RE).
QC samples were prepared at low, middle and high concentrations and were analysed in
replicates of five across three different days. Inter- and intra-day accuracy were calculated
using the RE of QC samples and inter- and intra-day precision was assessed using their
relative standard deviation (RSD). Accuracy and precision were deemed acceptable if
deviations at a given concentration were ≤ 15%, except at the lower limit of quantification
(LLOQ), which could deviate up to 20%. Recovery and matrix effects were also investigated.
Recovery was assessed by calculating the RE of SUL or IS peak areas in plasma spiked pre-
extraction with analyte peak areas in blank plasma spiked post-extraction. Matrix effects
were evaluated using the RE of analyte peak areas in blank plasma spiked post-extraction, to
analyte peak areas in 0.1% formic acid in water (v/v) that contained the same amount of
analyte.

100
Formal stability studies in plasma were not conducted as these have been reported
extensively by others (Janobi et al., 2006; Platz et al., 2015). However, SUL and IS responses
were monitored in stock solutions, working solutions and reconstituted samples left in the
autosampler at various times, all showing < 15% RE compared to concentrations determined
from fresh calibration curves.
4.2.6 Sample preparation and analyte extraction
All spiked and clinically-acquired plasma samples were stored at -80 °C. Plasma aliquots
(100 µL) were mixed with 10 µL of acetonitrile containing 5.5 ng IS and briefly vortex-mixed.
Then, 20 µL of TFA was added to the samples followed by vortex-mixing for 1 min to
precipitate plasma proteins, which were then centrifuged for 10 min at 20 817 g, 4 °C. The
samples then underwent SPE: cartridges were conditioned with 1 mL methanol followed by
1 mL 0.1% formic acid in water (v/v) prior to loading of the above supernatant (approx.
140 µL). The cartridges were washed with 1 mL 5% methanol in water (v/v) before elution of
the analytes with 2 x 0.5 mL 90% acetonitrile + 0.1% formic acid in water (v/v). The eluent
was evaporated under vacuum at 45 °C, reconstituted in 100 µL 0.1% formic acid in water
(v/v), vortex-mixed for 1 min then centrifuged for 10 min at 20 817 g, 4 °C, before
transferring to an autosampler vial containing a 200 µL insert.
4.2.7 Clinical application
Following validation, this assay was successfully used to analyse samples provided by
healthy volunteers on a broccoli-enriched diet (n = 21), which formed part of a larger study
detailed in Chapter 5. The study had ethics approval from the Sydney Local Health District
Ethics Committee and required participants to provide written informed consent during a
face-to-face interview. Sample collection was as follows: after providing a baseline sample

101
and an overnight fast, participants ate a 200 g microwave-steamed broccoli meal followed
by insertion of a venous cannula into a forearm vein. Serial blood samples were then
collected into lithium-heparinised 10 mL tubes (BD, North Ryde, NSW, Australia) at t = 2, 3,
4, 6 and 8 h post-broccoli consumption. Plasma was harvested from whole blood samples by
centrifuging the 10 mL collection tubes at 2000 g for 10 min followed by removal of the
supernatant and storage at -80 °C until analysis. Participants were allowed to have a small
snack after the 4 h sample and lunch after the 6 h sample to minimise any potential food-
effects on the study endpoints.

102
4.3 Results
4.3.1 Selectivity and sensitivity
Analyte-free plasma from six different volunteers underwent sample extraction and was
checked for interference at the mass transitions and retention times of SUL and the IS. No
overlapping peaks or signal abnormalities were detected. LLOQs were determined by
choosing analyte concentrations that had peaks at least 5-times higher than the response of
a blank sample and that displayed accuracy of 80-120% and a precision of ≤ 20%. Amounts
of analyte injected on-column ranged from 7.8-100 pg, representing up to a 227% increase
in sensitivity compared to similar assays (Gasper et al., 2005). Retention times for SUL and
the IS were 3.42 min and 4.42 min, respectively. The LLOQ for SUL was 0.78 ng/mL (7.8 pg
on-column). Chromatogram overlays of blank plasma and SUL at low concentrations are
shown in Figure 4.1.
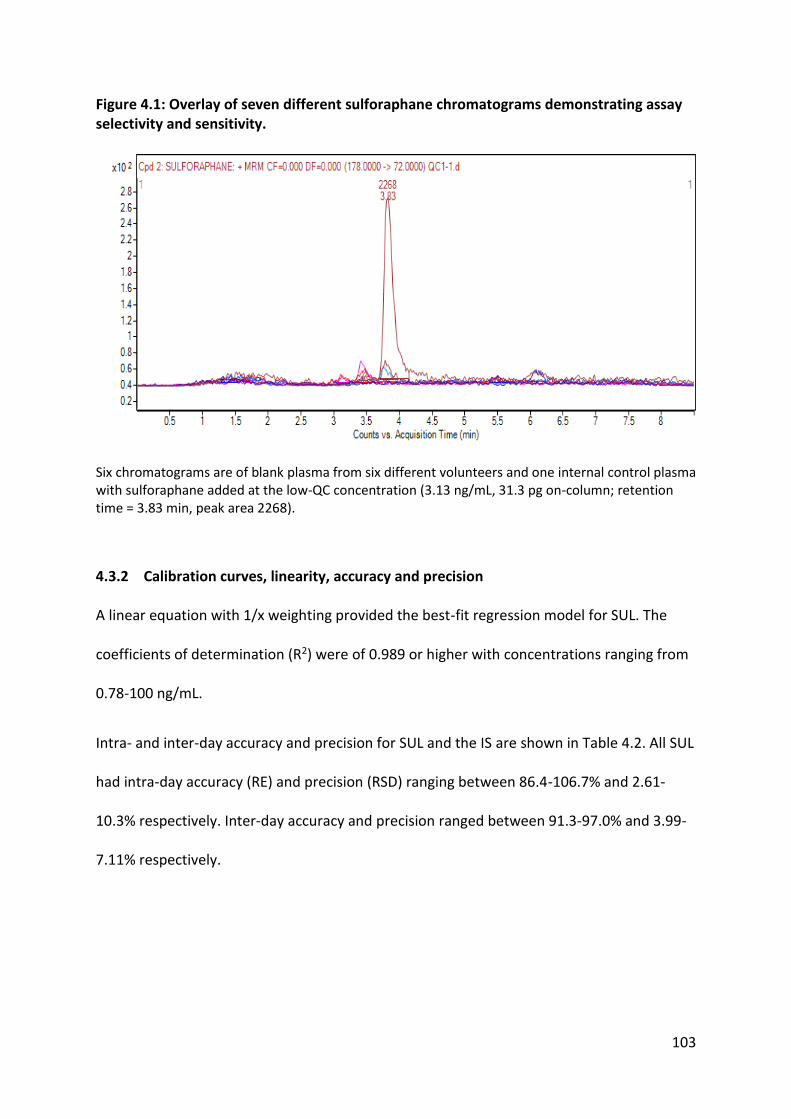
103
Figure 4.1: Overlay of seven different sulforaphane chromatograms demonstrating assay selectivity and sensitivity.
Six chromatograms are of blank plasma from six different volunteers and one internal control plasma with sulforaphane added at the low-QC concentration (3.13 ng/mL, 31.3 pg on-column; retention time = 3.83 min, peak area 2268).
4.3.2 Calibration curves, linearity, accuracy and precision
A linear equation with 1/x weighting provided the best-fit regression model for SUL. The
coefficients of determination (R2) were of 0.989 or higher with concentrations ranging from
0.78-100 ng/mL.
Intra- and inter-day accuracy and precision for SUL and the IS are shown in Table 4.2. All SUL
had intra-day accuracy (RE) and precision (RSD) ranging between 86.4-106.7% and 2.61-
10.3% respectively. Inter-day accuracy and precision ranged between 91.3-97.0% and 3.99-
7.11% respectively.

104
Table 4.2: Accuracy and precision data for SUL and the phenacetin (IS).
Analyte Nominal
concentration (ng/mL)
Measured mean concentration
(ng/mL) (mean ± SD) (n = 15)
Intra-day accuracy (RE
%) (n = 3)
Inter-day accuracy (RE
%) (n = 3)
Intra-day precision
(RSD %) (n = 15)
Inter-day precision
(RSD %) (n = 15)
SUL 100 92.4 ± 6.48 106.7 97.0 7.18 7.11
25 23.9 ± 1.32 101.2 95.6 2.61 3.99
3.125 3.03 ± 0.32 96.3 91.3 3.73 6.40
IS 55 N/A N/A N/A 7.48 2.94
4.3.3 Recovery and matrix effects
Recovery was low for both SUL and the IS (Table 4.3). However, both molecules had
reproducible and consistent recoveries across all tested concentrations (RSD range 6.82-
11.0%), therefore quantification was not adversely affected. With regards to matrix effects,
ion suppression was seen for SUL and the IS (Table 4.3), although as with recovery, matrix
effects were consistent and reproducible across batches and plasma sources (RSD range
6.59-10.6%) and did not affect successful quantification of SUL across the tested
concentration ranges.
Table 4.3: Recovery (RSD% ± SD) and matrix effect data (mean ± SD) for sulforaphane and the phenacetin (IS).
Analyte Nominal
concentration (ng/mL)
Recovery
(mean ± SD)
Recover
y RSD %
Absolute matrix
effect (mean ±
SD)
Absolute matrix effect
RSD %
SUL 100 34.7 ± 2.36 6.82 62.3 ± 4.11 6.59 25 25.2 ± 2.78 11.0 78.2 ± 8.29 10.6 3.125 26.4 ± 2.30 8.69 82.1 ± 7.29 8.88
IS 55 46.3 ± 4.39 9.50 75.0 ± 7.52 10.0

105
4.3.4 Clinical application of assay
This assay has been used to phenotype 21 participants (> 150 plasma samples) in the above-
mentioned clinical trial (these data are further explored and discussed in Chapter 5).
Calibrators and QCs from these batches all met accuracy (RE = 85-115%) and precision (RSD
< 15%) requirements.

106
4.4 Discussion
This validated UHPLC-MS/MS assay meets appropriate specifications for selectivity,
sensitivity, accuracy and precision, and has successfully been used to analyse SUL in over
150 clinical trial samples, demonstrating its ability to be readily applied to dietary
intervention studies. These methods allow for in vivo analysis of SUL in studies involving a
cruciferous vegetable or SUL intervention, and provide evidence that low recovery and ion
suppression do not impede analyte quantification.
Other assays that analyse SUL and its metabolites have relatively long chromatographic run
times of 13-35 min (Agrawal et al., 2006; Alumkal et al., 2015; Janobi et al., 2006), which is a
barrier to high-throughput and efficiency when analysing large numbers of samples. The
per-sample run time of the currently presented assay is 8.5 min, which represents up to a 4-
fold improvement compared to similar assays.
In an effort to further reduce the resource demands and costs of this assay, a non-
isotopically-labelled IS (ILIS) was used for quantification of SUL in plasma. ILISs can help to
reduce matrix effects (Grangeon et al., 2017; Li et al., 2013). However, phenacetin has been
used as a suitable IS for a range of analytes with varying physicochemical properties
(Ghassabian et al., 2009) (Chapter 3). Its use as an internal standard produced appropriate
accuracy and precision for analyte quantification in these studies, which has also been
observed for this SUL assay.
As discussed in Chapter 3, sensitivity, precision and accuracy can be reduced by low
recovery and significant matrix effects (Taylor, 2005). The presented methods demonstrate
low recoveries and ion suppression for SUL and the IS. However, the recoveries and matrix
effects were highly consistent within and across batches such that quantification was

107
unaffected, even at the lowest concentrations. Unfortunately, matrix effect comparisons
with other studies are not possible, as published SUL assays with similar analyte extraction
techniques do not report matrix effect data (Alumkal et al., 2015; Clarke et al., 2011; Gasper
et al., 2005; Hauder et al., 2011; Janobi et al., 2006; Platz et al., 2015). Future studies should
report the means, standard deviations and RSDs of any observed matrix effects in order to
better assess whether they affect the quantification of the analytes being investigated.
This assay uses both protein precipitation and SPE to prepare the sample for UHPLC-MS/MS
analysis, which adds to sample preparation time in contrast to dilution and filtration
methods. However, we found the addition of these steps necessary when injecting large
numbers of samples onto the UHPLC system, as preliminary tests of injecting undiluted
plasma on-column caused frequent high-pressure issues and needle seat blockages,
consistent with previous reports that injection of untreated, diluted plasma on-column is
problematic for UHPLC-MS/MS systems (Bonfiglio et al., 1999; Müller et al., 2002) (Chapter
3).
The sulforaphane concentration-time profiles generated using this assay are presented in
Chapter 5, and highlight the utility of this assay in clinical studies that have cruciferous
vegetable or isothiocyanate extract interventions. The sensitivity and resolution of this assay
allow for quantification down to 7.8 pg on-column, representing plasma concentrations of
0.78 ng/mL—high enough to detect sulforaphane up to 8 hours post-consumption. Due to
its ready applicability, the use of this validated, simplified assay is encouraged when
conducting future cruciferous vegetable/ITC studies.

108
4.5 Conclusions
In conclusion, the currently-presented assay successfully uses UHPLC-MS/MS to analyse SUL
and an internal standard in human plasma. The methods described meet recommendations
for bioanalytical methods concerning selectivity, sensitivity, accuracy and precision (Booth &
Kadavil, 2001). This assay’s relative simplicity and short chromatographic run times
compared to other published SUL assays has been demonstrated by its use in analysing over
150 samples. The presented method demonstrates an increase in sensitivity of up to 227%
alongside reductions in sample handling and resource costs.
Following validation of this assay, it was used as described at the end of Chapter 2 to
measure the plasma concentrations and exposure profiles of SUL in 21 people of either
European or South Asian geographic ancestry before, during and after consuming a broccoli-
enriched diet (Chapter 5). This assay and the CYP-phenotyping cocktail assay presented in
Chapter 3 were both used successfully to test hypotheses generated from the thesis
objectives (section 1.9), and these data are analysed and discussed in the next chapter.
109
5 The effects of broccoli consumption, sulforaphane exposure and
genetics on the activity of drug-metabolising enzymes in people
of European and South Asian ancestry
5.1 Introduction
Thus far, this thesis on variability in drug metabolism has explored the effects of cruciferous
vegetables on phase I and II enzymes, identifying that in particular, CYP1A2 is significantly
induced in persons consuming diets rich in these foods. The theme of geographic ancestry
has also been introduced in Chapter 1, and understanding geographic ancestry as a
composite of known and unknown intrinsic and extrinsic factors that affect the
pharmacokinetics of drugs has been discussed. Suitable bioanalytical methods are required
in order to conduct prospective human trials that explore the interactions between
cruciferous vegetable-enriched diets, ancestry and drug metabolism; the design,
optimisation and validation of two such assays have been described in Chapters 3 and 4.
This chapter unites all of the themes and research presented thus far, by demonstrating the
application of the presented assays to answering hypotheses involving geographic ancestry,
genetics, cruciferous vegetable-enriched diets and drug metabolism.
CYP1A2 activity has been shown to vary in populations of European or South Asian ancestry
and the presence or absence of Cruciferae in the diet (Chapters 1 and 2). In one particular
observational study, broccoli consumption was associated with increased CYP1A2 activity in
the European cohort, but lower activity in the South Asian cohort (Perera et al., 2012a). It
was hypothesised that differences in food preparation, including the currying of foods, could
be producing this difference in enzyme activity, alongside other unknown ancestry-specific

110
differences. Of note, these findings have not been confirmed in a prospective, controlled
trial.
Further, CYP2C19, CYP2C9, CYP2D6 and CYP3A4 have not been investigated in this context
(Chapter 2) and no studies were identified that have investigated the effects of both
geographic ancestry and Cruciferae on these enzymes. There are common overlaps between
the CYPs with respect to induction mechanisms and hence a molecule that induces CYP1A2
could also, via the same pathways, induce other CYP enzymes (Tompkins & Wallace, 2007).
Therefore, the known effects of broccoli on increased CYP1A2 activity may also be reflected
in the effects on other CYP enzymes represented in the phenotyping cocktail.
Therefore, the aims of this clinical trial were to:
1) Investigate the acute and medium-term effects of a broccoli-enriched diet on
CYP1A2, CYP2C19, CYP2C9, CYP2D6 and CYP3A4 activities;
2) Establish if the above effects vary between healthy subjects of European and South
Asian ancestry;
3) Explore the effects of diet and genetics on SUL exposure, and see if these vary
between Europeans and South Asians;
4) Confirm that CYP1A2 is induced in Europeans on a broccoli-enriched diet, with no or
a reduced change in South Asians; and
5) Explore the contribution of diet, genetics and geographic ancestry on CYP1A2,
CYP2C19, CYP2C9, CYP2D6 and CYP3A4 activities in the two ancestry groups.

111
5.2 Methods
This trial received general ethics approval and site-specific approval (SSA) from the Sydney
Local Health District (SLHD) ethics committee at Concord Repatriation General Hospital
(CRGH) (Approval ID HREC/12/CRGH/206) (Appendices 8.3 and 8.4). The study was
conducted in an outpatient clinic at CRGH. The trial was prospectively registered with the
Australian New Zealand Clinical Trials Registry (ANZCTR) (Trial ID ACTRN12613001112752)
(Appendix 8.5), which is a World Health Organisation International Clinical Trials Registry
Platform (WHO ICTRP). The Therapeutic Goods Administration (TGA) was notified of the use
of the study medicines as CYP enzyme probe drugs (Appendix 8.6).
5.2.1 Participants
The study population consisted of healthy, community-dwelling males aged between 18-55
years (n = 21; see section 5.2.7.1 for sample size calculations). Participants were of
European (n = 11) and South Asian (n = 10) geographic ancestry who were willing to
participate in a dietary intervention trial. All participants were screened for study eligibility
at a face-to-face interview during which a questionnaire was completed (Appendix 8.7),
ensuring that the inclusion criteria were met and no exclusion criteria were met (Figure 5.1).
Patients were labelled as ‘self-reported healthy’ if they reported no diseases or concurrent
therapeutic substance use as per the questionnaire. After eligibility was confirmed, written,
informed consent to participate was obtained (Appendix 8.8) and a copy of the Participant
Information Sheet (PIS) was given (Appendix 8.9).
Previous reports of differences in CYP activity by sex are varied, with findings being divided
between no difference and activity being higher in men than women (Nehlig, 2018). Further,
CYP1A2 activity can be influenced by sex hormones, including the contraceptive pill (Perera

112
et al., 2012a). Therefore, to reduce the potential for confounding by the influence of sex
differences, it was decided to recruit only male participants in this study in order to achieve
higher confidence in and better explain the observed interactions between diet, ancestry
and genetics.
Geographic ancestry was self-determined by each participant based on the geographic
origins of the participant’s four grandparents. Participants were eligible to participate if all
four of their grandparents (explicitly, their biological parents’ biological parents) were of the
same geographic ancestry.
Participants were recruited via university noticeboards and web distribution services by
means of a poster (Appendix 8.10) and electronic advertisements approved by the HREC. On
successful and full completion of the study, participants received A$500 to compensate
them for their time and effort.
Participants were assigned a random number and thus de-identified in paper and electronic
records. Hard copy consent forms and survey questionnaires were stored in a locked cabinet
in a secured room. All information obtained from participants was coded in spreadsheets
and password protected. Data will be kept for at least six years and then disposed of
through deletion (in the case of computer files), shredded (in the case of hardcopy
documents) or disposed in clinical waste (for clinical samples). All procedures were in
accordance with the University of Sydney Research Data Management Policy, 2014
(http://sydney.edu.au/policies/showdoc.aspx?recnum=PDOC2013/337&RendNum=0,
retrieved 17/01/18) and Research Data Management Procedures, 2015
(http://sydney.edu.au/policies/showdoc.aspx?recnum=PDOC2014/366, retrieved
17/01/18).

113
Inclusion criteria
i. Male, aged 18-55 years
ii. European or South Asian geographic ancestry
iii. Non-smoker or ex-smoker that has abstained from smoking for at least 6 months
iv. Ability to comply with the planned procedures and provide written informed
consent which requires a level of English language competency to effectively
understand the protocol and adequately meet the definition of informed consent
v. Self-reported healthy with no reported or diagnosed acute or chronic health
conditions
vi. Access to a microwave with an appropriate cooking setting
Exclusion criteria
i. Known hypersensitivity or intolerance to any of the five drugs used in the study
ii. History of clinical signs of hypotension, specifically fainting, light-headedness
and/or a blood pressure lower than 80/60 mmHg
iii. Female
iv. Known food allergies or intolerances that limit participation in this study
v. Oral antimicrobial use within the past 3 months
vi. Body mass index (BMI) outside of 18.5-32.5 kg.m-2
vii. Currently taking or using any prescription, over-the-counter, herbal,
complementary or illicit medicines
viii. Given blood or participating in another clinical study in the last 3 months
Figure 5.1: Participant inclusion and exclusion criteria.
114
5.2.2 Study design
This study adopted an open-label, 3-period, sequential, crossover dietary intervention trial
design. Participants completed two 3-day food diaries (Appendices 8.11 and 8.12) over the
three days leading up to Day 1 and during Days 6-8, inclusive. Figure 5.2 outlines the study
design. On Day 1, the CYP probe cocktail (see section 5.2.3 below) was administered
following an overnight fast. All food and beverages were provided on-site during the study
days; a plain muffin, choice of a chicken and salad or plain salad sandwich and water were
offered to the participants. Each study day, this food was ordered from the same on-site
canteen at the same time of day to minimise the introduction of any potential variability.
The muffin was offered after collecting the 2-hour blood sample and the sandwich was
offered after the 4-hour blood sample was collected. Water was freely available throughout
the study days.
On Day 2, 200 g of microwave-steamed broccoli (see 5.2.3 below) was consumed 2 hours
before the CYP probe cocktail was administered to assess the acute effects of broccoli
consumption on CYP activity. After the last venous blood sample was collected at six hours
post-dose, participants were provided with pre-packaged and labelled ‘snap-lock’ bags
containing weighed broccoli servings to be microwaved and consumed for the next six days
(Days 3-8).
From Days 3-8, participants consumed 200 g of broccoli with lunch and dinner whilst
following their usual dietary habits. Participants were instructed to maintain their usual diet
throughout the study and make no major changes to the types and quantities of food that
they usually consume. They were also asked to avoid consumption of grapefruit juice
throughout the study, have no more than 4 standard drinks of alcohol on any one occasion

115
and avoid caffeine on the mornings that the CYP phenotyping cocktail was being
administered. As mentioned above, a second food diary was completed during this period to
monitor foodstuffs consumed and encourage adherence to the study protocol. On Day 9,
participants returned following an overnight fast for the final administration of the CYP
probe cocktail.
To ensure participant safety, pressure and pulse (via automated blood pressure monitor),
respiratory rate and level of sedation were monitored hourly throughout the study period.
This monitoring process is described in Appendix 8.13.

116
Figure 5.2: Summary diagram of sequential timeline of the clinical study.
5.2.3 Broccoli procurement and preparation
Broccoli was purchased fresh from one local supplier (Stewart Dickson Produce Pty Ltd) to
reduce inter-batch variability. For the duration of the study, an arrangement was made with
the supplier that broccoli would come from the same two growers, who had neighbouring
farms. The broccoli was washed for 5 seconds under running tap water and then cut at the
short part of the stem with the florets still attached into easily eaten pieces. The pieces
were then weighed and divided into 200 g quantities, placed in snap-lock sealable plastic
bags and stored at 4 °C until use. Participants were instructed to ensure that the broccoli
Days -2 to 0: 3-day diet diary
Day 1: Baseline CYP phenotyping
Day 2: CYP phenotyping with consumption of 200 g broccoli to
measure acute effects on CYP activity
Days 3 to 8: 200 g broccoli consumed at lunch and dinner in addition to normal
diet. Food diary is kept on Days 6-8
Day 9: Final CYP phenotyping to measure medium-term effects of
broccoli on CYP activity

117
was kept refrigerated until consumed. Participants were provided with a BPA-free steaming
container and instructed to microwave the broccoli at a wattage and time specified below in
Table 5.1. These recommendations were based on Verkerk et al. (2009) and Song and
Thornalley (2007) which suggested that microwave steaming for 3 min at 1000 W produced
the lowest decrease in ITC content. During informal palatability testing it was determined
that this could be further decreased to 2 min at 1000 W, which was then linearly scaled to
produce the times in Table 5.1.
Table 5.1: Recommended broccoli cooking times based on available microwave power and published evidence of broccoli constituent stability (Chapter 1).
Microwave power (watts) Recommended cooking time (seconds)
700 150 (2 min 30 s)
800 135 (2 min 15 s)
900 130 (2 min 10 s)
1000
1200
120 (2 min)
110 (1 min 50 s)
Participants consumed the entire contents of the 200 g broccoli sample on each occasion. If
this method of eating the broccoli was unappealing to the participant to the point of non-
compliance or drop-out, a small amount (< 10 mL) of salad dressing was permitted to be
added before eating. Details on how to handle, prepare and consume the broccoli were
given to participants in a handout (Appendix 8.14).
5.2.4 CYP-phenotyping procedure
The CYP probe drugs, metabolites, phenotyping metrics and sampling procedure used are
described in section 3.2.7 of this thesis and summarised in Figure 5.3 below.

118
Figure 5.3: CYP probe drugs, metabolites and phenotyping metrics.
5.2.5 Analytical methods
UHPLC-MS/MS analytical methods for the 5 probe drugs, their 5 enzyme-specific
metabolites (Chapter 3) (Figure 5.3) and sulforaphane (SUL) (Chapter 4) have been
described in this thesis. Samples for CYP phenotyping were collected on all 3 study days,
with SUL being analysed in the baseline D1 and D9 samples, as well as in all six samples on
D2 to explore exposure after consuming a broccoli meal (200 g).
5.2.6 Genotyping
Each participant was genotyped for variants known to affect CYP activity or SUL metabolism
(Chapter 1). The full list of SNPs and copy number assays for the relevant drug-metabolising
enzymes in this study are listed in Appendix 8.16. However, only variants where genotype
varied between participants were included in the analyses. DNA extraction/purification and
subsequent genotyping was conducted by the Australian Genome Research Facility
(Brisbane, QLD). DNA was purified and extracted from participant blood samples using the
•Probe drug: caffeine (CAF) (100 mg)
•Metabolite: paraxanthine (PAR)
•Metric: 4-h PAR/CAF plasma concentration ratioCYP1A2•Probe drug: omeprazole (OME) (20 mg)
•Metabolite: 5-hydroxyomeprazole (OH-OME)
•Metric: post-absorption OH-OME/OME plasma concentration ratioCYP2C19•Probe drug: losartan (LOS) (25 mg)
•Metabolite: losartan carboxylic acid (EXP)
•Metric: EXP/LOS AUC0-6 h ratioCYP2C9•Probe drug: dextromethorphan (DXM) (30 mg)
•Metabolite: dextrorphan (DXR)
•Metric: DXR/DXM AUC0-6 h ratioCYP2D6•Probe drug: midazolam (MID) (2 mg)
•Metabolite: α-hydroxymidazolam (OH-MID)
•Metric: 4-h OH-MID/MID plasma concentration ratioCYP3A4

119
methods outlined in Appendix 8.15. Genotyping was performed using the Agena Bioscience
MassARRAY platform and the iPLEX ADME PGx panel according to the manufacturer’s
protocols (Agena Bioscience, San Diego, CA) (Lee et al., 2016).
5.2.7 Data and statistical analyses
5.2.7.1 Sample size calculations
When designing this study, the sample size was based on the assumption that a paired-
samples t test or non-parametric equivalent would be used. CYP1A2 activity metrics across
the study days and between ancestry groups were used in the variability calculation due to
familiarity with its variability and access to previous raw data. Using this information and a
standard deviation of 0.30 for CYP1A2 activity (Ghassabian et al., 2009), a sample size of n =
14 participants in each ancestry group (total n = 28) was calculated to detect up to a 25%
difference in CYP1A2 activity with 80% power and a type I error (α) of 0.05. Because CYP1A2
activity displays the largest intra- and inter-subject variability (Perera et al., 2012a), it was
deemed a suitable surrogate for sample size approximation for the other CYP enzymes being
simultaneously studied, n = 28 subjects allowed for detection of up to a 25% difference in
CYP2C19, CYP2C9, CYP2D6 and CYP3A4 activity with 80% power and a type I α of 0.05.
Mixed-effects models have been widely recommended due to their utility when analysing
repeated-measured data arising from crossover trials (Goh et al., 2010; Kakuda et al., 2014;
Nordmark et al., 2014; Turpault et al., 2009). Some of the reasons for this are their superior
power compared to other types of analyses, their ability to include statistically-controlling
covariates, which can greatly reduce the sample sizes needed to detect significant
differences in endpoints, and control of familywise error across multiple comparisons
(Gueorguieva & Krystal, 2004; Putt & Chinchilli, 1999). Because the method of sample size

120
calculation depends on the choice of planned statistical tests in a study’s analyses, sample
size was also calculated based on the use of multiple mixed-effects models.
As preliminary results had been collected by the time of this realisation, post hoc sample
size re-calculations were possible. These were performed using the GLIMMPSE sample size
calculator for crossover studies with repeat-measures found at
http://glimmpse.samplesizeshop.org (Kreidler et al., 2013). The parameters constant across
the 5 enzyme activities were power = 0.8 and α = 0.1 (for 90% confidence intervals, in a
similar fashion to a bioequivalence design) (Kakuda et al., 2014; Nordmark et al., 2014) to
detect a difference in enzyme activity of up to 25%. For each CYP enzyme activity, estimates
of the standard deviations and within-subject correlation coefficients were derived from the
preliminary data of this study, as well as from Turpault et al. (2009) (CYP2C19), Vogl et al.
(2015) (CYP2C9), Dorado et al. (2012) (CYP2D6) and Dorne et al. (2003) (CYP3A4). The
results are presented in Table 5.2, and indicate that n = 10-12 participants in each ancestry
group is appropriate to test the proposed hypotheses (section 5.1) for most of the CYP
enzymes.
Table 5.2: GLIMMPSE sample size calculations from a linear mixed-effects model. Calculated n is for Study Day, Ancestry and Study Day*Ancestry in the linear model for each geographic ancestry group, unless specified otherwise.
CYP enzyme Power Type I error Difference in
metric (%) Calculated n
CYP1A2 0.8 0.1 25 6
CYP2C19 0.8 0.1 25 8
CYP2C9 0.8 0.1 25 12
CYP2D6 0.8 0.1 25 6
CYP3A4 0.8 0.1 25 16

121
5.2.7.2 Pharmacokinetic analyses
Non-compartmental methods were used to calculate pharmacokinetic parameters. Area
under the concentration-time curves (AUCs) for each probe drug, metabolite and SUL were
calculated from plasma concentrations using the linear trapezoidal rule.
5.2.7.3 Food diary analyses
The food diaries were analysed using the methods presented by Perera et al. (2012a).
Participants were categorised based on their consumption of foods known to inhibit or
induce CYP1A2 activity (Table 5.3) as well as their curry consumption (Table 5.4). The two-
tailed Pearson’s correlation coefficient was used to assess correlations between diet sub-
categories and CYP enzyme activity.
5.2.7.4 Statistical analyses
All data were analysed in SPSS Statistics for Windows, version 23 (IBM Corp., Armonk, N.Y.,
USA). Normality of endpoint and residual distributions was assessed using the Shapiro-Wilk
test and by visually observing the distributions. Differences in food consumption category
proportions were analysed using a 2-way chi-square test with a Bonferroni-corrected type I
error to account for familywise error across multiple comparisons.

122
Table 5.3: Foodstuffs known to inhibit or induce CYP1A2. Methods by Perera et al. (2012a).
CYP1A2 Inducers CYP1A2 Inhibitors Other Dietary Factors
Bok Choy Carrots Chocolate consumption
Broccoli Celeriac Tea consumption
Brussels sprouts Celery Soft drink/energy drink consumption
Cabbage Coriander Coffee consumption
Cauliflower Cumin Alcohol consumption
Char-grilled meats Grapefruit juice Any dietary restrictions
Radish Parsnip Predominantly curry diet
Rocket Parsley Vegetarian
Wasabi
Table 5.4: Categories used to define subject diets based on CYP1A2 inducer, CYP1A2 inhibitor and curry consumption.
The various CYP phenotyping metrics were natural log-transformed prior to statistical
analysis to reduce variability and approximate normal distributions (Shen et al., 2006). A
linear mixed-effects model was created for each CYP enzyme (with the exception of CYP2D6,
whose analyses required three separate models—see section 5.3.4.4.3) to produce
estimated marginal means (EMMs) (least-squares means) of log-transformed metrics. In the
models, Study Day, Ancestry, Genotype and their various interactions were fixed effects and
Category Definition
High CYP inducer consumption Greater than 8 servings per week (across
both food diaries)
High CYP inhibitor consumption Greater than 6 servings per week (across
both food diaries)
Predominantly curry diet At least 1 serving of curry per day for a
whole food diary
123
the intercept of each participant was a random effect. Post-hoc tests for significant factor
interactions were performed using the Least Significant Difference (LSD) method. The type I
error was set at 0.1 to produce 90% confidence intervals (CIs) for differences in log-
transformed EMMs between study days and between ancestry groups. These CIs were log-
back-transformed to produce geometric EMM (GEMM) ratios with corresponding 90%
confidence intervals (see section 5.2.7.1 for a rationale supporting the use of these
methods). The model structures, repeat-measures covariance structures, random-effects
covariance structures and SPSS syntaxes are presented in Appendix 8.17.
For SUL analyses, the two-tailed Pearson’s correlation coefficient was used to assess
correlations between the various SUL time points and D2 AUC0-8 h after natural log-
transformation. A linear mixed-effects model was used to assess the differences in D2 SUL
AUC0-8 h between geographic ancestry groups and explore the effects of genetics on SUL
exposure. As with CYP activity metrics, the liberal type I error of 0.1 was used to assess
statistical significance of differences in SUL concentrations and AUCs between ancestry
groups.

124
5.3 Results
All enrolled participants completed the study in full with no serious adverse events.
Transient drowsiness and light-headedness were reported by some participants, which were
attributed to fasting and taking the midazolam, dextromethorphan and losartan
combination.
5.3.1 Participant demographics
Participant age, weight, height, BMI and ancestry are presented in Table 5.5. Differences in
demographics between ancestry groups were not statistically analysed, as this study was
not powered or designed to detect differences in these parameters. However, there were
no major differences in the means and standard deviations of these demographics between
the groups.
5.3.2 Dietary data
The proportions of those who reportedly consumed diets high in CYP1A2 inducers, CYP1A2
inhibitors and curry are shown in Table 5.6, Table 5.7 and Table 5.8, respectively. Of those
consuming low amounts of CYP1A2 inducer foods, 14% were European and 86% were South
Asian (P < 0.05). With regards to high consumption of inducer foods, 71% were European
and 29% were South Asian (P < 0.05). For CYP1A2 inhibitor foods, there were no significant
differences between ancestry groups. However, with regards to curry consumption, 69% of
low curry consumers were European and 31% were South Asian. Of those consuming a
predominantly curry diet, 100% were South Asian (P < 0.05).

125
Table 5.5: Participant demographics.
ID Geographic ancestry Age (years) Weight (kg) Height (m) BMI (kg.m-2)
1 European 33 77.6 1.78 24.5
2 South Asian 51 70.0 1.62 26.7
3 European 18 62.0 1.60 24.2
4 South Asian 18 79.8 1.78 25.3
5 South Asian 43 71.2 1.77 22.9
6 South Asian 19 92.9 1.76 30.0
7 South Asian 24 63.4 1.78 20.0
8 European 20 72.2 1.81 22.0
9 European 22 56.0 1.77 17.9
10 European 23 64.0 1.80 19.8
11 European 19 72.1 1.86 20.9
12 European 20 85.3 1.83 25.5
13 European 23 89.8 1.84 26.4
14 European 19 87.3 1.81 26.6
15 European 23 62.7 1.81 19.1
16 European 28 84.7 1.83 25.4
17 South Asian 23 82.7 1.77 26.3
18 South Asian 20 66.0 1.70 22.9
19 South Asian 22 82.5 1.80 25.4
20 South Asian 33 73.0 1.72 24.7
21 South Asian 20 90.0 1.70 31.1
Mean ± SD (total) n = 21 24.8 ± 8.59 75.5 ± 10.8 1.77 ± 0.07 24.2 ± 3.40
Mean ± SD (European) n = 11 22.5 ± 4.46 74.0 ± 11.77 1.80 ± 0.07 22.9 ± 3.13
Mean ± SD (South Asian) n = 10 27.3 ± 11.35 77.2 ± 9.98 1.70 ± 0.05 25.5 ± 3.31

126
Table 5.6: Consumption of CYP1A2 inducers by ancestry.
Geographic ancestry
Total European South Asian
CYP inducer diet Low consumption of CYP
inducers
Count (n) 1 6 7
% within CYP inducer diet 14.3% 85.7% 100.0%
% within Geographic
ancestry 9.1% 60.0% 33.3%
% of Total 4.8% 28.6% 33.3%
High consumption of CYP
inducers
Count (n) 10 4 14
% within CYP inducer diet 71.4% 28.6% 100.0%
% within Geographic
ancestry 90.9% 40.0% 66.7%
% of Total 47.6% 19.0% 66.7%
Total Count (n) 11 10 21
% within CYP inducer diet 52.4% 47.6% 100.0%
% within Geographic
ancestry 100.0% 100.0% 100.0%
% of Total 52.4% 47.6% 100.0%
Table 5.7: Consumption of CYP1A2 inhibitors by ancestry.
Geographic ancestry
Total European South Asian
CYP inhibitor diet Low consumption of CYP
inhibitors
Count 9 8 17
% within CYP inhibitor diet 52.9% 47.1% 100.0%
% within Geographic
ancestry 81.8% 80.0% 81.0%
% of Total 42.9% 38.1% 81.0%
High consumption of CYP
inhibitors
Count 2 2 4
% within CYP inhibitor diet 50.0% 50.0% 100.0%
% within Geographic
ancestry 18.2% 20.0% 19.0%
% of Total 9.5% 9.5% 19.0%
Total Count 11 10 21
% within CYP inhibitor diet 52.4% 47.6% 100.0%
% within Geographic
ancestry 100.0% 100.0% 100.0%
% of Total 52.4% 47.6% 100.0%
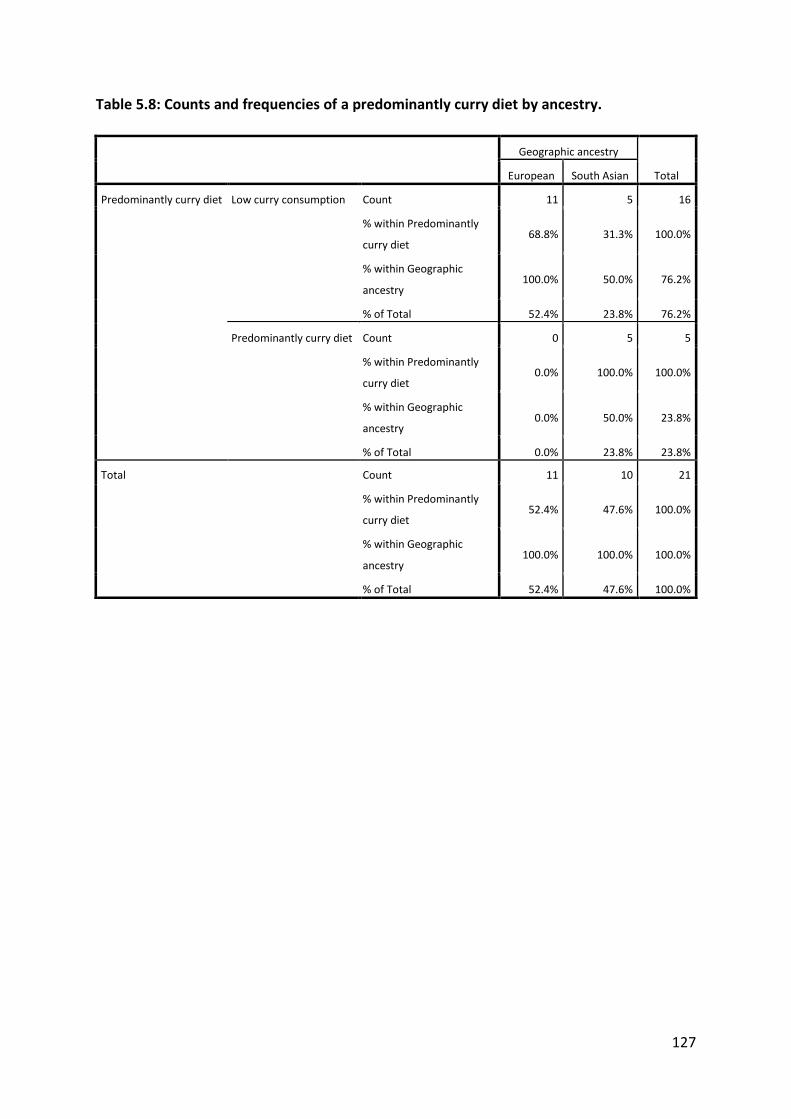
127
Table 5.8: Counts and frequencies of a predominantly curry diet by ancestry.
Geographic ancestry
Total European South Asian
Predominantly curry diet Low curry consumption Count 11 5 16
% within Predominantly
curry diet 68.8% 31.3% 100.0%
% within Geographic
ancestry 100.0% 50.0% 76.2%
% of Total 52.4% 23.8% 76.2%
Predominantly curry diet Count 0 5 5
% within Predominantly
curry diet 0.0% 100.0% 100.0%
% within Geographic
ancestry 0.0% 50.0% 23.8%
% of Total 0.0% 23.8% 23.8%
Total Count 11 10 21
% within Predominantly
curry diet 52.4% 47.6% 100.0%
% within Geographic
ancestry 100.0% 100.0% 100.0%
% of Total 52.4% 47.6% 100.0%

128
5.3.3 Sulforaphane exposure
Sulforaphane (SUL) concentrations and AUCs after broccoli ingestion showed remarkable
variability both overall and in the two ancestry groups, and required natural log-
transformation to achieve a normal distribution (Table 5.10). Across the seven time points
where SUL was measured and D2 AUC0-8 h, CV% of log-transformed data ranged from 12-
76% in the European ancestry group, 18-55% in the South Asians and 15-71% overall. Mean
concentration-time plots of SUL on D2 are shown in Figure 5.4.
In the mixed-effects model, GSTM1 and GSTP1 genotypes had a significant effect on SUL
AUC0-8 h (P < 0.05 for both), whereas GSTT1, GSTT2, UGT1A1 and geographic ancestry had no
effect. The differences in SUL exposure by GSTM1 and GSTP1 genotypes are reported in
Table 5.9. There was a genotype-exposure relationship, with SUL exposure being the highest
in GSTM1 and GSTP1 null homozygotes, intermediate in GSTM1 and GSTP1 null
heterozygotes, and lowest in those with two functional alleles.
All natural log-transformed SUL concentration-time points and the D2 AUC0-8 h were
correlated. In particular, the 3- and 4-h post-broccoli time points were strongly correlated
with the AUC0-8 h (correlation coefficients 0.981 and 0.982, respectively [both P < 0.01]). Of
note, SUL AUC0-8 was significantly correlated with a predominantly curry diet (correlation
coefficient 0.441 [P = 0.045]). SUL AUC0-8 did not significantly correlate with the various
activity metrics for all 5 CYP enzymes across the three study days.
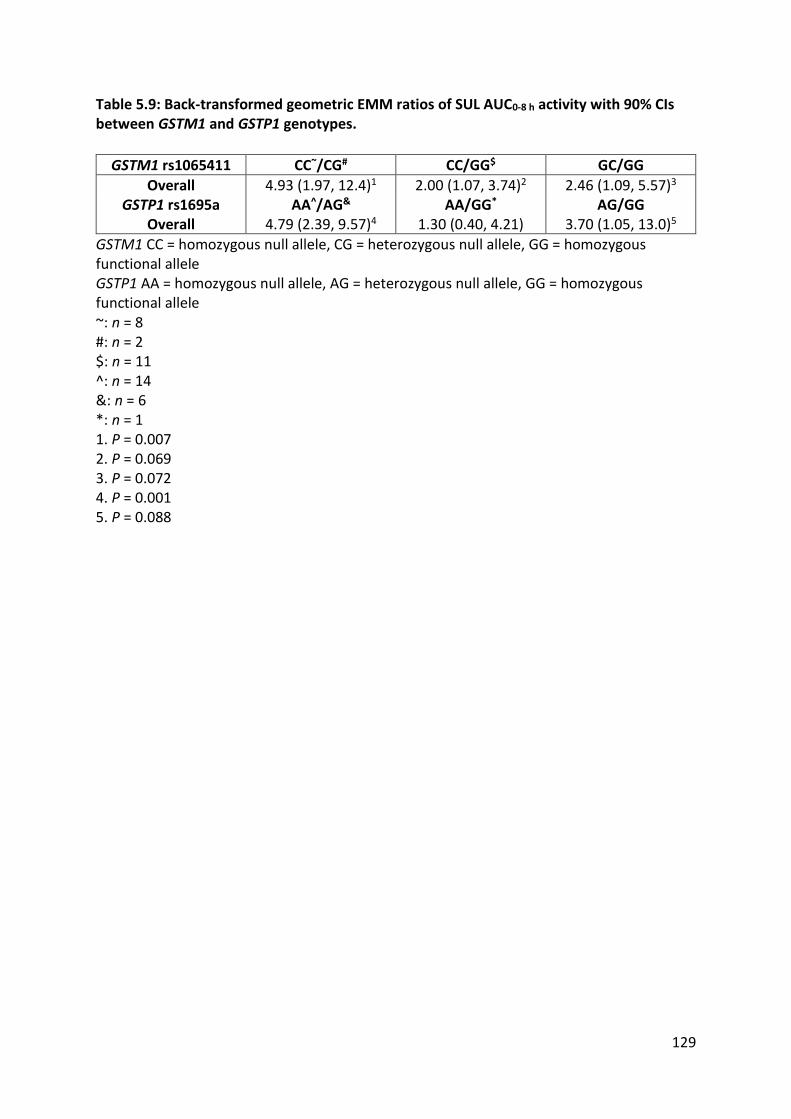
129
Table 5.9: Back-transformed geometric EMM ratios of SUL AUC0-8 h activity with 90% CIs between GSTM1 and GSTP1 genotypes.
GSTM1 rs1065411 CC~/CG# CC/GG$ GC/GG
Overall 4.93 (1.97, 12.4)1 2.00 (1.07, 3.74)2 2.46 (1.09, 5.57)3
GSTP1 rs1695a AA^/AG& AA/GG* AG/GG Overall 4.79 (2.39, 9.57)4 1.30 (0.40, 4.21) 3.70 (1.05, 13.0)5
GSTM1 CC = homozygous null allele, CG = heterozygous null allele, GG = homozygous functional allele GSTP1 AA = homozygous null allele, AG = heterozygous null allele, GG = homozygous functional allele ~: n = 8 #: n = 2 $: n = 11 ^: n = 14 &: n = 6 *: n = 1 1. P = 0.007 2. P = 0.069 3. P = 0.072 4. P = 0.001 5. P = 0.088

130
Table 5.10: Natural log-transformed sulforaphane plasma concentrations and D2 AUC0-8 h by participant and ancestry.
Participant ID
Geographic ancestry
D1 baseline (nM)
D2 2-h (nM)
D2 3-h (nM)
D2 4-h (nM)
D2 6-h (nM)
D2 8-h (nM)
AUC0-8 h (nM.h)
D9 (nM)
1 European 1.94 5.13 4.81 4.40 4.18 3.58 6.52 2.58
3 European 1.08 4.60 4.74 4.20 3.67 2.61 6.20 1.19
8 European 1.91 5.57 5.32 5.03 4.67 3.74 7.03 3.52
9 European 0.35 3.45 3.00 2.85 2.85 2.71 5.03 3.30
10 European 1.59 5.90 5.49 5.38 5.08 4.59 7.41 3.29
11 European 0.35 5.69 5.20 4.67 4.18 3.49 6.92 2.85
12 European 0.39 4.95 4.49 4.19 3.54 2.71 6.19 2.64
13 European 0.35 5.79 5.36 5.04 4.14 3.43 7.02 1.85
14 European 0.72 5.31 4.38 3.76 3.36 2.54 6.26 1.50
15 European 0.35 4.22 3.16 2.99 1.55 1.49 5.24 2.66
16 European 0.42 4.63 4.79 4.23 3.80 3.29 6.26 2.84 Mean (Europeans) 0.86 5.02 4.61 4.25 3.73 3.11 6.37 2.57 SD (Europeans) 0.66 0.75 0.84 0.81 0.95 0.81 0.74 0.75 CV% 76.39 14.97 18.19 19.00 25.44 26.21 11.58 29.35
2 South Asian 0.44 5.84 5.36 5.01 4.16 3.39 7.05 2.40
4 South Asian 1.12 4.66 3.53 3.45 3.37 3.29 5.86 3.21
5 South Asian 1.21 6.83 6.69 5.99 5.64 4.26 8.16 2.86
6 South Asian 0.98 6.25 6.05 5.75 5.09 4.76 7.67 4.18
7 South Asian 0.43 5.47 5.26 4.87 4.14 3.45 6.84 3.46
17 South Asian 0.42 3.69 3.40 3.23 2.44 2.19 5.11 2.22
18 South Asian 0.35 3.08 2.64 2.62 2.42 2.13 4.65 2.54
19 South Asian 0.45 4.07 4.58 4.37 3.53 2.74 6.00 2.50
20 South Asian 0.45 4.06 3.92 3.49 2.79 2.46 5.56 1.84
21 South Asian 0.34 4.07 3.64 3.23 2.35 1.75 5.39 2.20
Mean (South Asians)
0.62 4.80 4.51 4.20 3.59 3.04 6.23 2.74

131
Participant ID
Geographic ancestry
D1 baseline (nM)
D2 2-h (nM)
D2 3-h (nM)
D2 4-h (nM)
D2 6-h (nM)
D2 8-h (nM)
AUC0-8 h (nM.h)
D9 (nM)
SD (South Asians) 0.34 1.23 1.30 1.16 1.15 0.97 1.15 0.70 CV% 54.90 25.59 28.84 27.68 32.15 31.86 18.48 25.58 Mean (Total) 0.75 4.92 4.56 4.23 3.66 3.08 6.30 2.65 SD (Total) 0.53 0.99 1.06 0.97 1.03 0.87 0.93 0.72 CV% 71.40 20.08 23.15 22.88 28.03 28.25 14.83 27.03

132
0.00
1.00
2.00
3.00
4.00
5.00
6.00
0 1 2 3 4 5 6 7 8
Nat
ura
l-lo
g SU
L p
lasm
a co
nce
ntr
atio
n (
nM
)
Time post-broccoli consumption (h)
Overall (n = 21)
Europeans (n = 11)
South Asians (n = 10)
Figure 5.4: Plasma concentration-time profile for SUL on D2 (natural log-transformed data). T = 0 data taken from baseline D1 SUL plasma sample, as participants consumed no Cruciferae between this sample and the D2 sampling window.

133
5.3.4 CYP activity
5.3.4.1 CYP1A2
5.3.4.1.1 Caffeine
Changes in caffeine 4-h plasma concentrations and the CYP1A2 activity metric across study
days showed marked variability, both overall and when stratified by ancestry (Table 5.11).
The coefficient of variation (CV%) of 4-h caffeine plasma concentrations ranged from 27-
38% in Europeans and 55-63% in South Asians. Interestingly, these CV% varied little within
ancestry groups across the study days, validating the choice of a repeated-measures
prospective design for this trial. Individual participant caffeine plasma concentrations by
ancestry and genotype across study days are shown in Figure 5.5. Caffeine plasma
concentrations were higher throughout the study in the South Asian cohort compared to
the Europeans (9,235 ± 5,535 nM vs 6,345 ± 2,131 nM, respectively). In the Europeans,
mean caffeine concentrations increased immediately after a broccoli meal (D1 to D2), and
decreased after 6 days of broccoli consumption (D1 to D9). In the South Asian ancestry
group, mean caffeine concentrations decreased between D1 and D2, and decreased
between D1 and D9.

134
Table 5.11: CYP1A2 data across study day by ancestry.
Genotypes
CYP1A2
D1 D2 D9
ID CYP1A2*1C rs2069514 -3860G>A
CYP1A2*1F rs762551 -163C>A
Geographic ancestry
4-h CAF
conc. (nM)
4-h PAR
conc. (nM)
PAR/CAF 4-h conc.
ratio
4-h CAF
conc. (nM)
4-h PAR
conc. (nM)
PAR/CAF 4-h conc.
ratio
4-h CAF
conc. (nM)
4-h PAR
conc. (nM)
PAR/CAF 4-h conc.
ratio
1 GG AC European 5350 3923 0.733 5696 3880 0.681 5003 4121 0.824
3 GG CC European 6773 4190 0.619 6874 5632 0.819 5318 4660 0.876
8 GG AC European 4532 541 0.119 4945 597 0.121 5160 598 0.116
9 Fail AC European 10568 910 0.086 10845 1031 0.095 6859 1036 0.151
10 GG AC European 8810 712 0.081 9392 549 0.058 6509 946 0.145
11 GG AA European 5016 1344 0.268 3837 1275 0.332 3572 1091 0.305
12 GG AA European 3255 3406 1.046 5120 4246 0.829 3042 3547 1.166
13 GG AA European 6008 3257 0.542 6236 4550 0.730 6217 4487 0.722
14 GG AA European 5352 5305 0.991 6599 4873 0.738 5023 5119 1.019
15 GG CA European 11017 5541 0.503 10527 6351 0.603 8291 4289 0.517
16 GG AA European 5840 5027 0.861 5024 3283 0.654 6778 7050 1.040
Mean
(Europeans) 6593 3105 0.532 6827 3297 0.515 5616 3359 0.626
SD (Europeans) 2494 1914 0.357 2382 2101 0.303 1518 2125 0.395 CV% 37.8 61.7 67.1 34.9 63.7 58.8 27.0 63.3 63.1
2 GG AA South Asian 18478 8207 0.444 21355 7751 0.363 18541 10152 0.548
4 GG CC South Asian 5929 5489 0.926 7201 4320 0.600 4929 3615 0.733
5 AG AA South Asian 9261 6916 0.747 12680 9302 0.734 14486 7738 0.534
6 GG AC South Asian 5649 718 0.127 5045 380 0.075 4516 400 0.089
7 GG AC South Asian 9584 763 0.080 9223 781 0.085 5985 596 0.100
17 GG CA South Asian 16329 17165 1.051 14330 18093 1.263 11454 14636 1.278
18 GA AA South Asian 15448 11003 0.712 11419 8848 0.775 11739 7180 0.612

135
Genotypes
CYP1A2
D1 D2 D9
ID CYP1A2*1C rs2069514 -3860G>A
CYP1A2*1F rs762551 -163C>A
Geographic ancestry
4-h CAF
conc. (nM)
4-h PAR
conc. (nM)
PAR/CAF 4-h conc.
ratio
4-h CAF
conc. (nM)
4-h PAR
conc. (nM)
PAR/CAF 4-h conc.
ratio
4-h CAF
conc. (nM)
4-h PAR
conc. (nM)
PAR/CAF 4-h conc.
ratio
19 GG CC South Asian 7800 4179 0.536 9806 7896 0.805 8381 5556 0.663
20 GG CA South Asian 3524 2100 0.596 1781 1328 0.745 3808 1551 0.407
21 GA AA South Asian 4595 3652 0.795 2001 1355 0.677 1776 1651 0.930
Mean (South
Asians) 9660 6019 0.601 9484 6005 0.612 8562 5308 0.589
SD (South
Asians) 5298 5110 0.317 5952 5547 0.358 5354 4674 0.357
CV% 54.9 84.9 52.7 62.8 92.4 58.4 62.5 88.1 60.5 Mean (Total) 8053 4493 0.565 8092 4587 0.561 7018 4287 0.608 SD (Total) 4267 3976 0.332 4542 4240 0.325 4041 3617 0.368 CV% 53.0 88.5 58.8 56.1 92.4 58.0 57.6 84.4 60.5

136
Figure 5.5: Caffeine 4-h plasma concentrations across study days by ancestry and CYP1A2*1C (rs2069514) (A) and CYP1A2*1F (rs762551) (B) genotypes.
A B

137
5.3.4.1.2 Paraxanthine
Paraxanthine concentrations were more variable than caffeine concentrations: CV% of
paraxanthine concentrations ranged from 62-64% in Europeans and 85-92% in South Asians,
which were similar within the ancestry groups across study days. Individual participant
paraxanthine plasma concentrations by ancestry, and genotype across study days are
depicted below in Figure 5.6. Paraxanthine plasma concentrations were higher throughout
the study in the South Asian cohort compared to the Europeans (5,777 ± 5,110 nM vs 3,254
± 2,047 nM, respectively). In the Europeans, mean paraxanthine concentrations increased
immediately after a broccoli meal (D1 to D2), and increased overall after 6 days of broccoli
consumption (D1 to D9). In the South Asian ancestry group, mean paraxanthine
concentrations decreased slightly between D1 and D2 and decreased overall between D1
and D9.
5.3.4.1.3 CYP1A2 activity
The 4-h paraxanthine/caffeine ratio displayed large variability: CV% of CYP1A2 activity
ranged from 59-68% in Europeans and 53-61% in South Asians, but this variability remained
consistent within the ancestry groups across study days. There was a significant effect
between Study Day and Ancestry in the mixed-effects model for the European cohort (F =
3.499, P = 0.040). When examined further, there was a significant 20% increase in CYP1A2
activity after 6 days of broccoli consumption (D1 to D9) in the Europeans (Table 5.12), but
no changes in the South Asian cohort. With respect to genetics, overall, the CYP1A2*1C
genotype did not significantly affect enzyme activity (F = 0.310, P = 0.584), however there
was a significant 2.67-fold difference in activity between those who had the CC and CA
CYP1A2*1F genotypes, respectively (GEMM ratio 2.69 [1.19, 6.10], P = 0.049) (Table 5.13).
SUL exposure had no significant effect on CYP1A2 activity across the study days, in that

138
there was no significant correlation between SUL exposure and CYP1A2 activity. Individual
changes in CYP1A2 activity by ancestry and genotype across study days are shown in Figure
5.7.
Table 5.12: Back-transformed geometric EMM ratios of CYP1A2 activity between study days with 90% CIs by ancestry group.
D2/D1 D9/D1 D9/D2
Europeans (n = 11) 0.98 (0.85, 1.13) 1.20 (1.04, 1.38)* 1.22 (1.06, 1.41) South Asians (n = 10) 0.96 (0.84, 1.11) 0.96 (0.83, 1.10) 0.99 (0.86, 1.14)
Overall (n = 21) 0.97 (0.87, 1.07) 1.03 (0.93, 1.14) 1.06 (0.96, 1.18)
*P = 0.038
Table 5.13: Back-transformed geometric EMM ratios of CYP1A2 activity with 90% CIs between CYP1A2*1F (rs762551) genotypes.
CC1/AC2 CC/AA3 AA/AC
Overall 2.69 (1.19, 6.10)* 1.40 (0.48, 4.06) 1.93 (0.76, 4.85)
1. N = 3 2. N = 9 3. N = 9 *P = 0.049

139
Figure 5.6: Paraxanthine 4-h plasma concentrations across study days by ancestry and CYP1A2*1C (rs2069514) (A) and CYP1A2*1F (rs762551) (B) genotypes.
A B
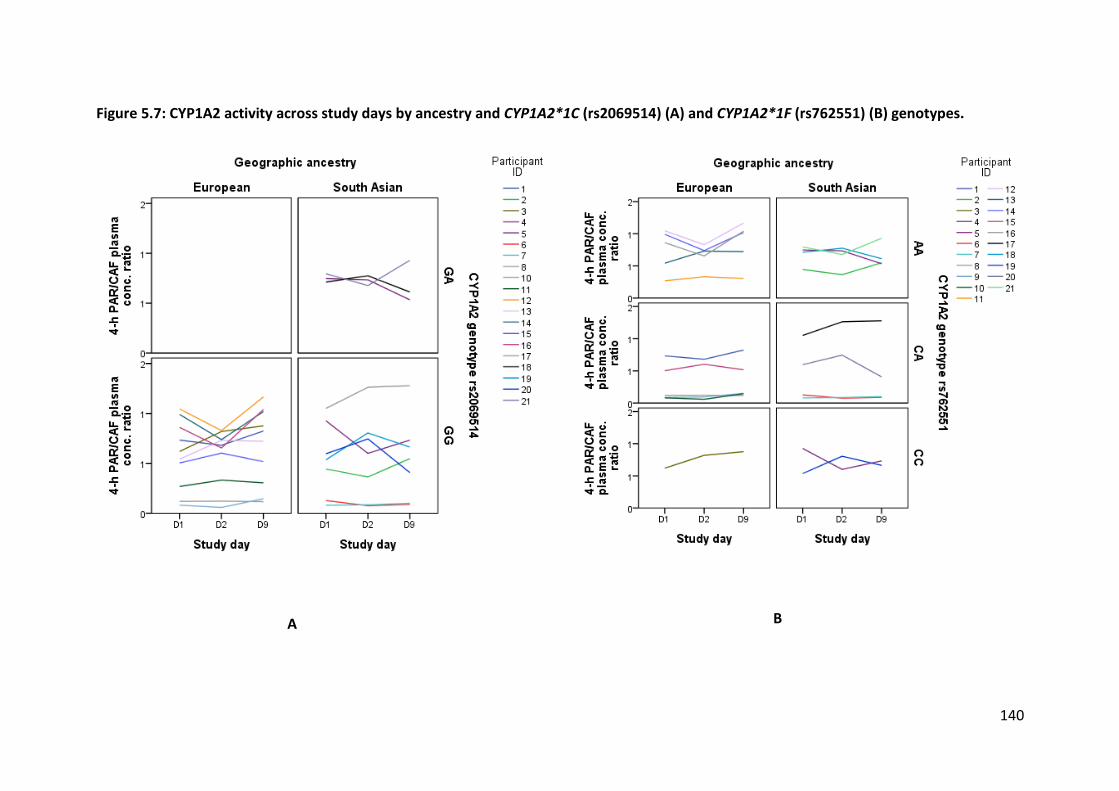
140
Figure 5.7: CYP1A2 activity across study days by ancestry and CYP1A2*1C (rs2069514) (A) and CYP1A2*1F (rs762551) (B) genotypes.
A B

141
5.3.4.2 CYP2C19
5.3.4.2.1 Omeprazole
As discussed in Chapter 3, omeprazole showed erratic absorption lag-times, such that
concentrations are missing for some participants, who presumably did not absorb an
appreciable amount of omeprazole in the 6-hour sampling window. Further, the post-
absorption plasma concentrations of omeprazole and 5-hydroxyomeprazole and their
corresponding ratio were chosen to investigate CYP2C19, as these parameters displayed less
variability than the calculated AUC0-6 h. The omeprazole post-absorption plasma
concentrations showed marked variability, both overall and when stratified by ancestry
(Table 5.14). Omeprazole CV% ranged from 53-66% in Europeans and 60-69% in South
Asians; CV% varied little within ancestry groups across the study days. Individual participant
omeprazole data by ancestry and genotype across study days are depicted in Figure 5.8.
Omeprazole plasma concentrations were higher throughout the study in the European
cohort compared to the South Asians (1,111 ± 674 nM vs 1,020 ± 662 nM, respectively). In
the Europeans, mean omeprazole concentrations increased immediately after a broccoli
meal (D1 to D2) and increased after 6 days of broccoli consumption (D1 to D9). In the South
Asian ancestry group, they increased between D1 and D2 and decreased between D1 and
D9. Omeprazole concentration data was available for n = 19, n = 21 and n = 15 participants
on D1, D2 and D9, respectively.
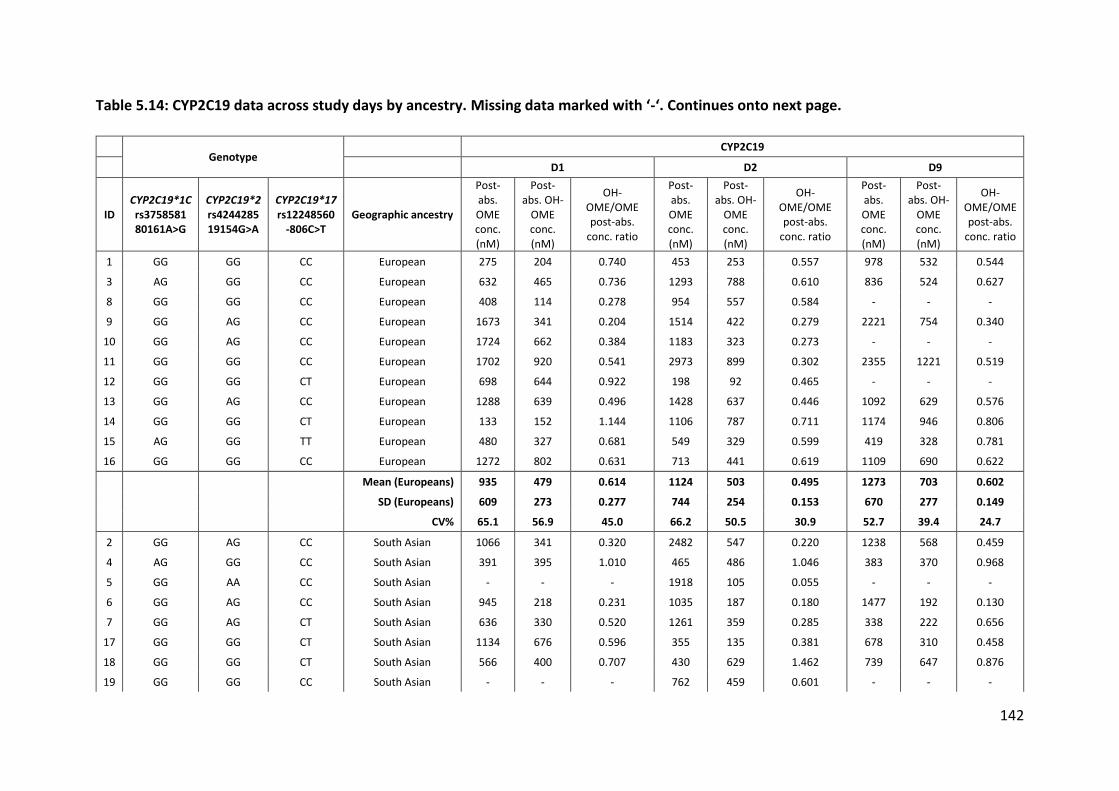
142
Table 5.14: CYP2C19 data across study days by ancestry. Missing data marked with ‘-‘. Continues onto next page.
Genotype
CYP2C19
D1 D2 D9
ID CYP2C19*1C rs3758581 80161A>G
CYP2C19*2 rs4244285 19154G>A
CYP2C19*17 rs12248560
-806C>T Geographic ancestry
Post-abs. OME conc. (nM)
Post-abs. OH-
OME conc. (nM)
OH-OME/OME post-abs.
conc. ratio
Post-abs. OME conc. (nM)
Post-abs. OH-
OME conc. (nM)
OH-OME/OME post-abs.
conc. ratio
Post-abs. OME conc. (nM)
Post-abs. OH-
OME conc. (nM)
OH-OME/OME post-abs.
conc. ratio
1 GG GG CC European 275 204 0.740 453 253 0.557 978 532 0.544
3 AG GG CC European 632 465 0.736 1293 788 0.610 836 524 0.627
8 GG GG CC European 408 114 0.278 954 557 0.584 - - -
9 GG AG CC European 1673 341 0.204 1514 422 0.279 2221 754 0.340
10 GG AG CC European 1724 662 0.384 1183 323 0.273 - - -
11 GG GG CC European 1702 920 0.541 2973 899 0.302 2355 1221 0.519
12 GG GG CT European 698 644 0.922 198 92 0.465 - - -
13 GG AG CC European 1288 639 0.496 1428 637 0.446 1092 629 0.576
14 GG GG CT European 133 152 1.144 1106 787 0.711 1174 946 0.806
15 AG GG TT European 480 327 0.681 549 329 0.599 419 328 0.781
16 GG GG CC European 1272 802 0.631 713 441 0.619 1109 690 0.622
Mean (Europeans) 935 479 0.614 1124 503 0.495 1273 703 0.602
SD (Europeans) 609 273 0.277 744 254 0.153 670 277 0.149
CV% 65.1 56.9 45.0 66.2 50.5 30.9 52.7 39.4 24.7
2 GG AG CC South Asian 1066 341 0.320 2482 547 0.220 1238 568 0.459
4 AG GG CC South Asian 391 395 1.010 465 486 1.046 383 370 0.968
5 GG AA CC South Asian - - - 1918 105 0.055 - - -
6 GG AG CC South Asian 945 218 0.231 1035 187 0.180 1477 192 0.130
7 GG AG CT South Asian 636 330 0.520 1261 359 0.285 338 222 0.656
17 GG GG CT South Asian 1134 676 0.596 355 135 0.381 678 310 0.458
18 GG GG CT South Asian 566 400 0.707 430 629 1.462 739 647 0.876
19 GG GG CC South Asian - - - 762 459 0.601 - - -

143
Genotype
CYP2C19
D1 D2 D9
ID CYP2C19*1C rs3758581 80161A>G
CYP2C19*2 rs4244285 19154G>A
CYP2C19*17 rs12248560
-806C>T Geographic ancestry
Post-abs. OME conc. (nM)
Post-abs. OH-
OME conc. (nM)
OH-OME/OME post-abs.
conc. ratio
Post-abs. OME conc. (nM)
Post-abs. OH-
OME conc. (nM)
OH-OME/OME post-abs.
conc. ratio
Post-abs. OME conc. (nM)
Post-abs. OH-
OME conc. (nM)
OH-OME/OME post-abs.
conc. ratio
20 GG AG CC South Asian 2461 188 0.076 2643 163 0.062 393 30 0.075
21 GG AG CC South Asian 525 113 0.215 2111 214 0.101 - - -
Mean (South Asians) 965 333 0.459 1346 328 0.439 749 334 0.517
SD (South Asians) 662 173 0.308 877 191 0.470 448 216 0.343
CV% 68.6 51.9 67.1 65.2 58.2 106.9 59.8 64.7 66.2
Mean (Total) 948 417 0.549 1230 420 0.468 1029 531 0.562
SD (Total) 614 242 0.293 797 238 0.334 620 308 0.251
CV% 64.7 57.9 53.3 64.8 56.7 71.4 60.2 58.0 44.7

144
Figure 5.8: Omeprazole post-absorption plasma concentrations by study day, ancestry and CYP2C19*17 (rs12248560) (A), CYP2C19*1C (rs3758581) (B) and CYP2C19*2 (rs4244285) (C) genotypes.
A B
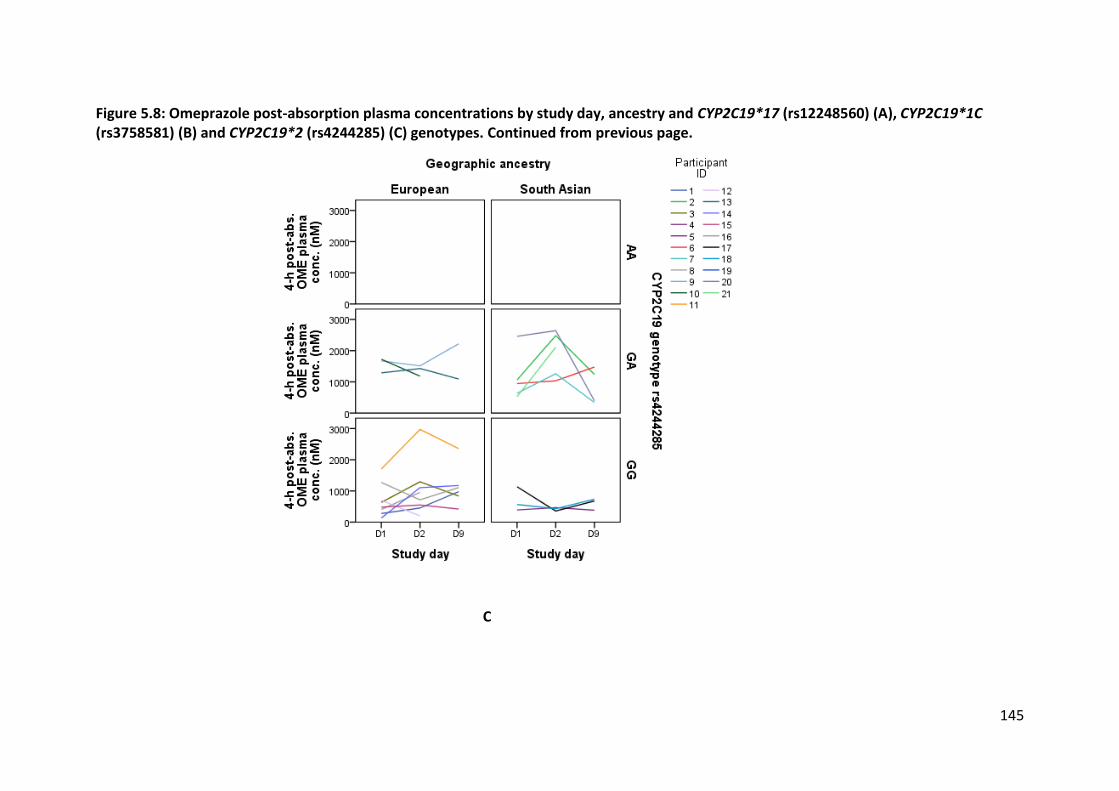
145
Figure 5.8: Omeprazole post-absorption plasma concentrations by study day, ancestry and CYP2C19*17 (rs12248560) (A), CYP2C19*1C (rs3758581) (B) and CYP2C19*2 (rs4244285) (C) genotypes. Continued from previous page.
C

146
5.3.4.2.2 5-hydroxyomeprazole
5-hydroxyomeprazole (OH-OME) concentrations had comparable variability to omeprazole:
CV% ranged from 40-57% in Europeans and 52-65% in South Asians (Table 5.14). Individual
participant OH-OME plasma concentrations by ancestry, and genotype across study days are
depicted below in Figure 5.9. Plasma concentrations were higher throughout the study in
the European cohort compared to the South Asians (562 ± 268 nM vs 332 ± 193 nM,
respectively). Mean OH-OME concentrations increased over the duration of the study (D1 to
D2 to D9) in the European ancestry group and remained near-constant in the South Asians.
As with OME, OH-OME concentration data was available for n = 19, n = 21 and n = 15
participants on D1, D2 and D9, respectively.
5.3.4.2.3 CYP2C19 activity
In the European ancestry group, the 5-OH-OME/OME post-absorption ratio displayed
relatively less variability than for other CYP enzymes, with CV% ranging from 25-45%. The
opposite was observed for the South Asians, with CV% spanning 66-107%, attributed to two
participants with higher values (4 and 18). However, the mixed effect model was able to
account for missing data and adjust CYP2C19 activity according to ancestry and genotype,
leading to detection of a significant effect across study days (F = 2.835, P = 0.072). When
further explored, overall, CYP2C19 activity decreased 17% immediately after a broccoli meal
(D1 to D2), then rebounded 18% by the end of the study after 6-days of broccoli
consumption (D2 to D9) (Table 5.15). This pattern was reflected in the two ancestry groups,
but did not achieve statistical significance (Study Day*Ancestry interaction F = 1.450, P =
0.248).

147
CYP2C19 activity significantly varied by genotype in the mixed-effects model for
CYP2C19*17 (F = 4.175, P = 0.029), CYP2C19*1C (F = 3.928, P = 0.060) and CYP2C19*2 (F =
8.610, P = 0.001). The overall effects for each gene are listed in Table 5.16. Particular
genotypes had large, significant effects on CYP2C19 activity as anticipated. For CYP2C19*17,
CT individuals had 73% higher activity than those with the CC genotype; for CYP2C19*1C, GA
individuals had 75% higher activity than GG individuals. For CYP2C19*2, there was roughly a
dose-response relationship: CYP2C19 activity was 5.7-fold higher in GG individuals relative
to AA individuals and 3.2-fold higher in GA individuals relative to those with the AA
genotype.
Genotype also interacted with ancestry in the model, with CYP2C19*17 CC Europeans
having 90% higher CYP2C19 activity than CC South Asians (GEMM ratio 1.90 [1.16, 3.10], P =
0.035). Further, there was a difference in enzyme activity between Europeans and South
Asians with the CYP2C19*1C GG genotype (GEMM ratio 2.19 [1.41, 3.39], P = 0.005). This
pattern was not repeated across those with CYP2C19*2 null alleles.
High consumption of CYP1A2 inducers was positively correlated with CYP2C19 activity
(correlation coefficient 0.661, P = 0.001) and high consumption of CYP1A2 inhibitors was
negatively correlated with activity (correlation coefficient -0.742, P = 0.002). SUL exposure
did not significantly correlate with CYP2C19 activity across the three study days.
For better visualisation, individual changes in CYP2C19 activity by ancestry and genotype
across study days are depicted below in Figure 5.10.

148
Figure 5.9: 5-hydroxyomeprazole post-absorption plasma concentrations by study day, ancestry and CYP2C19*17 (rs12248560) (A), CYP2C19*1C (rs3758581) (B) and CYP2C19*2 (rs4244285) (C) genotypes.
A B

149
Figure 5.9: 5-hydroxyomeprazole post-absorption plasma concentrations by study day, ancestry and CYP2C19*17 (rs12248560) (A), CYP2C19*1C (rs3758581) (B) and CYP2C19*2 (rs4244285) (C) genotypes. Continued from previous page.
C

150
Table 5.15: Back-transformed geometric EMM ratios of CYP2C19 activity with 90% CIs across study days by ancestry group.
D2/D1 D9/D1 D9/D2
Europeans (n = 11) 0.85 (0.71, 1.03) 1.02 (0.83, 1.25) 1.19 (0.97, 1.47) South Asians (n = 10) 0.81 (0.66, 1.01) 0.96 (0.76, 1.20) 1.17 (0.94, 1.47)
Overall (n = 21) 0.83 (0.72, 0.96)1 0.99 (0.85, 1.15) 1.18 (1.02, 1.38)2
1. P = 0.036
2. P = 0.072
Table 5.16: Back-transformed geometric EMM ratios with 90% CIs of CYP2C19 activity between CYP2C19*17, CYP2C19*1C and CYP2C19*2 genotypes.
CYP2C19*17 (rs12248560)
CT~/CC# CT/TT$ TT/CC 1.73 (1.22, 2.46)1 1.13 (0.51, 2.54) 1.53 (0.74, 3.15)
CYP2C19*1C (rs3758581)
AG^/GG* 1.75 (1.08, 2.84)2
CYP2C19*2 (rs4244285)
GGx/AAy GG/AGz AG/AA 5.66 (2.47, 12.9)3 1.78 (1.29, 2.47)4 3.17 (1.42, 7.05)5
~: n = 5 #: n = 15 $: n = 1 ^: n = 3 *: n = 18 x: n = 12 y: n = 1 z: n = 8 1. P = 0.013 2. P = 0.060 3. P = 0.001 4. P = 0.006 5. P = 0.020

151
Figure 5.10: CYP2C19 activity across study days by ancestry and CYP2C19*17 (rs12248560) (A), CYP2C19*1C (rs3758581) (B) and CYP2C19*2 (rs4244285) (C) genotypes.
A B

152
Figure 5.10: CYP2C19 activity across study days by ancestry and CYP2C19*17 (rs12248560) (A), CYP2C19*1C (rs3758581) (B) and CYP2C19*2 (rs4244285) (C) genotypes.
C

153
5.3.4.3 CYP2C9
5.3.4.3.1 Losartan
Losartan AUC0-6 h CV% ranged from 41-49% in Europeans and 49-52% in South Asians; CV%
varied little within ancestry groups across the study days (Table 5.17). Individual participant
losartan data by ancestry and CYP2C9 genotype across study days are shown in Figure 5.11.
Losartan plasma concentrations were similar in both ancestry groups (Europeans: 372 ± 162
nM.h, South Asians: 375 ± 191 nM.h). In the Europeans, mean losartan concentrations
increased throughout the study after 6 days of broccoli consumption (D1 to D2 to D9); in the
South Asian ancestry group, the concentrations were stable immediately after a broccoli
meal (D1 to D2) and decreased slightly after 6 days of broccoli consumption (D2 to D9).
5.3.4.3.2 Losartan carboxylic acid
Losartan carboxylic acid (EXP) concentrations had comparable variability to losartan: CV%
ranged from 41-53% in Europeans and 56-58% in South Asians (Table 5.17). Individual
participant EXP plasma concentrations by ancestry, and genotype across study days are
shown in Figure 5.9. Plasma concentrations were higher throughout the study in the South
Asian cohort compared to the Europeans (912 ± 520 nM.h vs 563 ± 251 nM.h, respectively).
Mean EXP concentrations increased immediately after a broccoli meal (D1 to D2) then
decreased after 6 days of broccoli consumption (D2 to D9), and this pattern was also
observed in the South Asian ancestry group.
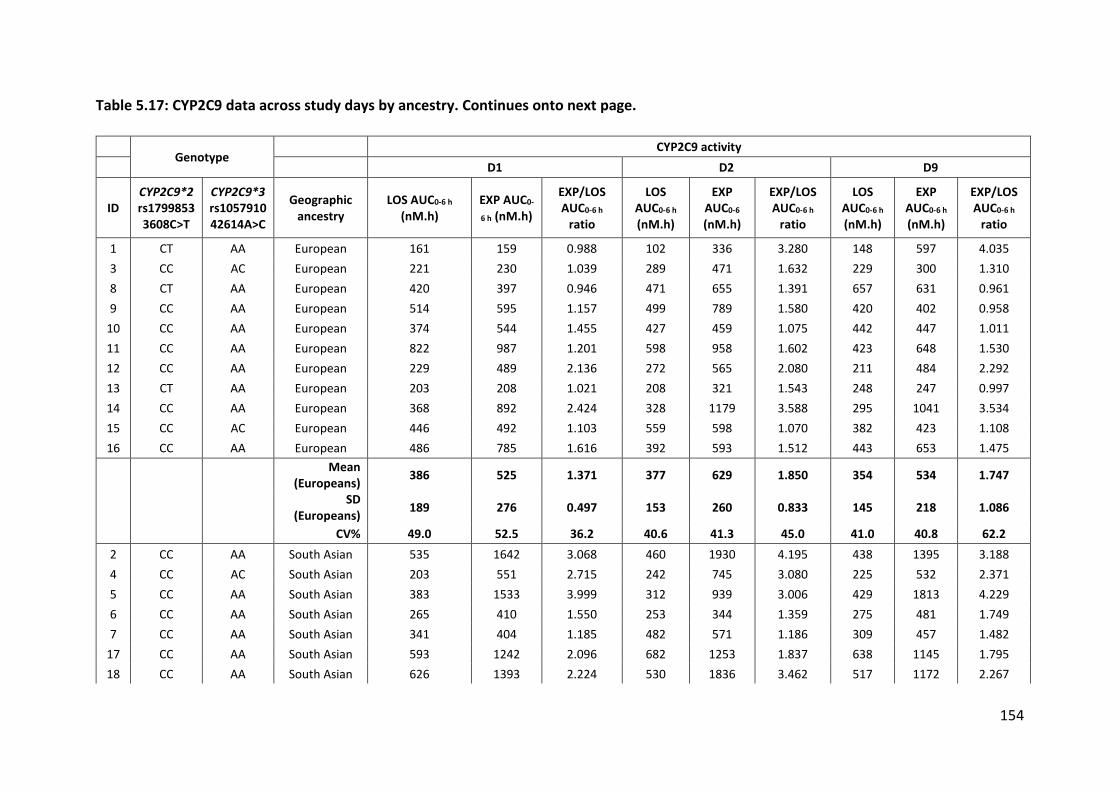
154
Table 5.17: CYP2C9 data across study days by ancestry. Continues onto next page.
Genotype
CYP2C9 activity D1 D2 D9
ID CYP2C9*2 rs1799853 3608C>T
CYP2C9*3 rs1057910 42614A>C
Geographic ancestry
LOS AUC0-6 h (nM.h)
EXP AUC0-
6 h (nM.h)
EXP/LOS AUC0-6 h
ratio
LOS AUC0-6 h (nM.h)
EXP AUC0-6 (nM.h)
EXP/LOS AUC0-6 h
ratio
LOS AUC0-6 h (nM.h)
EXP AUC0-6 h (nM.h)
EXP/LOS AUC0-6 h
ratio
1 CT AA European 161 159 0.988 102 336 3.280 148 597 4.035
3 CC AC European 221 230 1.039 289 471 1.632 229 300 1.310
8 CT AA European 420 397 0.946 471 655 1.391 657 631 0.961
9 CC AA European 514 595 1.157 499 789 1.580 420 402 0.958
10 CC AA European 374 544 1.455 427 459 1.075 442 447 1.011
11 CC AA European 822 987 1.201 598 958 1.602 423 648 1.530
12 CC AA European 229 489 2.136 272 565 2.080 211 484 2.292
13 CT AA European 203 208 1.021 208 321 1.543 248 247 0.997
14 CC AA European 368 892 2.424 328 1179 3.588 295 1041 3.534
15 CC AC European 446 492 1.103 559 598 1.070 382 423 1.108
16 CC AA European 486 785 1.616 392 593 1.512 443 653 1.475
Mean
(Europeans) 386 525 1.371 377 629 1.850 354 534 1.747
SD
(Europeans) 189 276 0.497 153 260 0.833 145 218 1.086
CV% 49.0 52.5 36.2 40.6 41.3 45.0 41.0 40.8 62.2
2 CC AA South Asian 535 1642 3.068 460 1930 4.195 438 1395 3.188
4 CC AC South Asian 203 551 2.715 242 745 3.080 225 532 2.371
5 CC AA South Asian 383 1533 3.999 312 939 3.006 429 1813 4.229
6 CC AA South Asian 265 410 1.550 253 344 1.359 275 481 1.749
7 CC AA South Asian 341 404 1.185 482 571 1.186 309 457 1.482
17 CC AA South Asian 593 1242 2.096 682 1253 1.837 638 1145 1.795
18 CC AA South Asian 626 1393 2.224 530 1836 3.462 517 1172 2.267
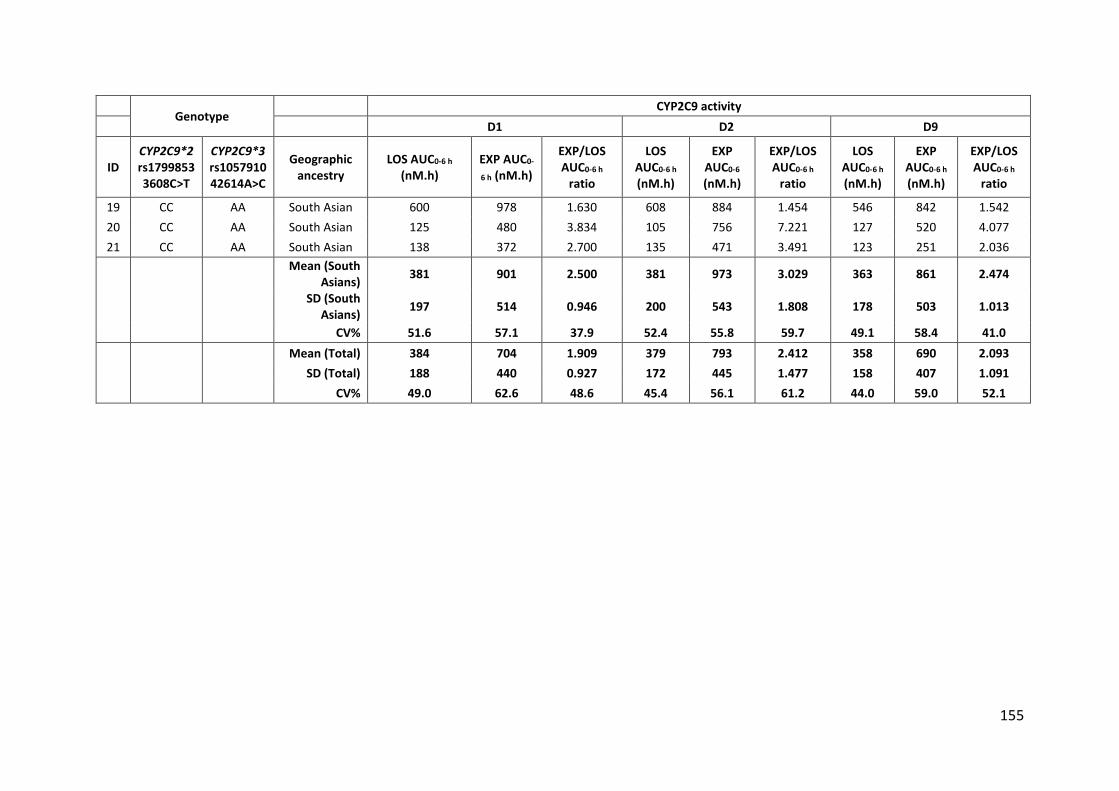
155
Genotype
CYP2C9 activity D1 D2 D9
ID CYP2C9*2 rs1799853 3608C>T
CYP2C9*3 rs1057910 42614A>C
Geographic ancestry
LOS AUC0-6 h (nM.h)
EXP AUC0-
6 h (nM.h)
EXP/LOS AUC0-6 h
ratio
LOS AUC0-6 h (nM.h)
EXP AUC0-6 (nM.h)
EXP/LOS AUC0-6 h
ratio
LOS AUC0-6 h (nM.h)
EXP AUC0-6 h (nM.h)
EXP/LOS AUC0-6 h
ratio
19 CC AA South Asian 600 978 1.630 608 884 1.454 546 842 1.542
20 CC AA South Asian 125 480 3.834 105 756 7.221 127 520 4.077
21 CC AA South Asian 138 372 2.700 135 471 3.491 123 251 2.036
Mean (South
Asians) 381 901 2.500 381 973 3.029 363 861 2.474
SD (South
Asians) 197 514 0.946 200 543 1.808 178 503 1.013
CV% 51.6 57.1 37.9 52.4 55.8 59.7 49.1 58.4 41.0 Mean (Total) 384 704 1.909 379 793 2.412 358 690 2.093 SD (Total) 188 440 0.927 172 445 1.477 158 407 1.091 CV% 49.0 62.6 48.6 45.4 56.1 61.2 44.0 59.0 52.1

156
Figure 5.11: Losartan AUC0-6 h across study days by ancestry and CYP2C9*3 (rs1057910) (A), CYP2C9*2 (rs1799853) (B) genotypes.
A B

157
5.3.4.3.3 CYP2C9 activity
In the European ancestry group, the EXP/losartan AUC0-6 h ratio CV% ranged from 36-62%.
For the South Asian participants, CV% spanned 38-60%. There was a significant change in
CYP2C9 activity across study days (F = 4.736, P = 0.014). When explored further, overall,
CYP2C9 activity increased 25% from D1 to D2, but decreased 11% by the end of the study
(D2 to D9) (Table 5.18). Ancestry had a significant overall effect in the model (F = 6.802, P =
0.016), with South Asians having 1.94-fold higher CYP2C9 activity than Europeans ([1.25,
3.00], P = 0.016). Further, there was a Study Day*Ancestry interaction in the European
cohort (F = 4.180, P = 0.022): CYP2C9 activity increased 32% between D1 to D2 (Table 5.18).
There were no significant overall effects in the model for differences in CYP2C9 activity
between genotypes. However, the Ancestry*Genotype interaction in the model was
significant, with CYP2C9 activity significantly varying by ancestry within genotypes for
CYP2C9*3 (F = 6.016, P = 0.023) and CYP2C9*2 (F = 5.899, P = 0.024). The overall differences
between the ancestry groups by genotype are listed in Table 5.19. For both variants, South
Asians had higher activity than Europeans regardless of genotype. There was no significant
correlation between SUL exposure and CYP2C9 activity across the study days.
Individual changes in CYP2C9 activity by ancestry and genotype across study days are shown
in Figure 5.13.

158
Figure 5.12: Losartan carboxylic acid AUC0-6 h across study days by ancestry and CYP2C9*3 (rs1057910) (A), CYP2C9*2 (rs1799853) (B) genotypes.
A B
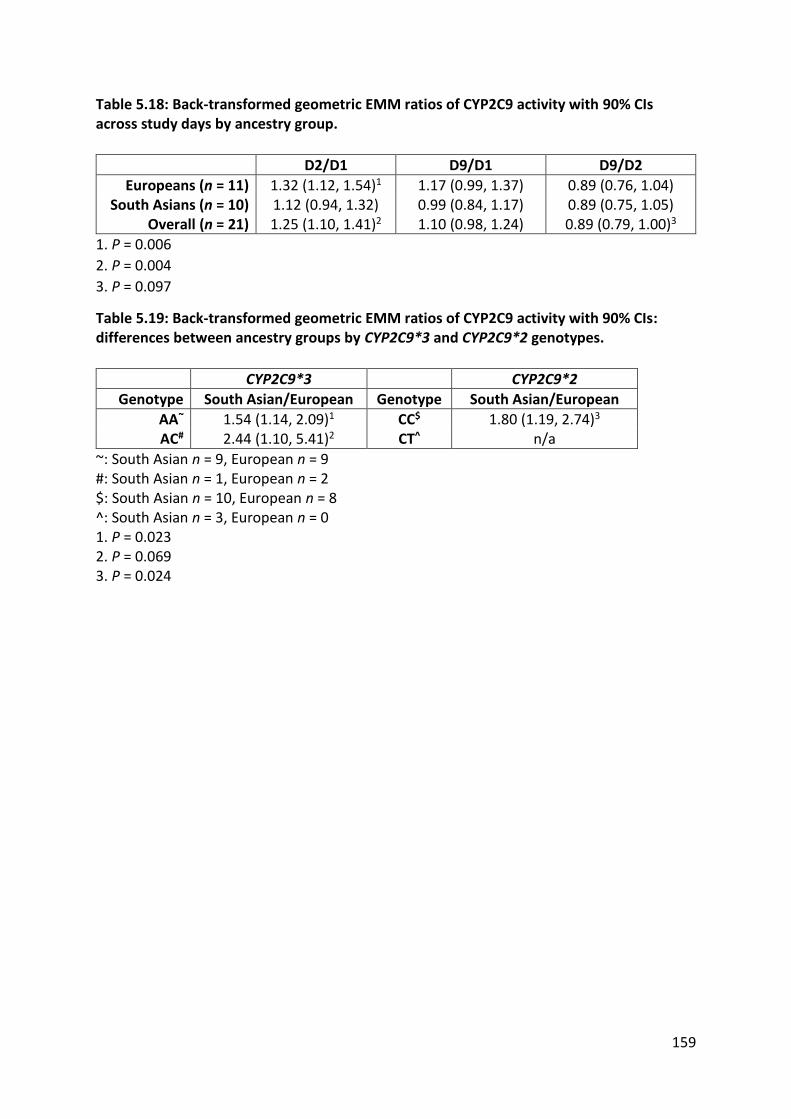
159
Table 5.18: Back-transformed geometric EMM ratios of CYP2C9 activity with 90% CIs across study days by ancestry group.
D2/D1 D9/D1 D9/D2
Europeans (n = 11) 1.32 (1.12, 1.54)1 1.17 (0.99, 1.37) 0.89 (0.76, 1.04) South Asians (n = 10) 1.12 (0.94, 1.32) 0.99 (0.84, 1.17) 0.89 (0.75, 1.05)
Overall (n = 21) 1.25 (1.10, 1.41)2 1.10 (0.98, 1.24) 0.89 (0.79, 1.00)3
1. P = 0.006
2. P = 0.004
3. P = 0.097
Table 5.19: Back-transformed geometric EMM ratios of CYP2C9 activity with 90% CIs: differences between ancestry groups by CYP2C9*3 and CYP2C9*2 genotypes.
CYP2C9*3 CYP2C9*2
Genotype South Asian/European Genotype South Asian/European
AA~ 1.54 (1.14, 2.09)1 CC$ 1.80 (1.19, 2.74)3
AC# 2.44 (1.10, 5.41)2 CT^ n/a
~: South Asian n = 9, European n = 9 #: South Asian n = 1, European n = 2 $: South Asian n = 10, European n = 8 ^: South Asian n = 3, European n = 0 1. P = 0.023 2. P = 0.069 3. P = 0.024

160
Figure 5.13: CYP2C9 activity across study days by ancestry and CYP2C9*3 (rs1057910) (A), CYP2C9*2 (rs1799853) (B) genotypes.
A B

161
5.3.4.4 CYP2D6
5.3.4.4.1 Dextromethorphan
Dextromethorphan (DXM) AUC0-6 h CV% ranged from 53-60% in Europeans and 60-66% in
South Asians; CV% varied little within ancestry groups across the study days (Table 5.20).
Because of the large number of genotypes present in the CYP2D6 analyses, individual
participant DXM spaghetti plots by ancestry and genotype across study days are displayed in
Appendix 8.18, instead of within this chapter. DXM AUC was slightly higher in the South
Asian ancestry group compared to the Europeans (45.6 ± 29.2 nM.h vs 36.8 ± 20.6 nM.h,
respectively). In the Europeans, mean DXM concentrations increased immediately after a
broccoli meal and then increased further after 6 days of broccoli consumption (D1 to D2 to
D9); this pattern was also found in the South Asian ancestry group. Frequencies of DXM
variant genotypes are displayed in Appendix 8.19.
5.3.4.4.2 Dextrorphan
Dextrorphan (DXR) concentrations had lower variability than DXM: CV% ranged from 35-
36% in Europeans and 43-46% in South Asians (Table 5.20). Individual participant DXR
plasma concentrations by ancestry, and genotype across study days are depicted with the
corresponding DXM data in Appendix 8.18. DXM AUC was higher throughout the study in
the European cohort compared to the South Asians (96.8 ± 34.7 nM.h vs 84.0 ± 37.3 nM.h,
respectively). In the Europeans, mean DXR concentrations decreased immediately after a
broccoli meal and then decreased further after 6 days of broccoli consumption (D1 to D2 to
D9); this pattern was also seen in the South Asian ancestry group. Frequencies of DXR
variant genotypes are displayed in Appendix 8.19.

162
Table 5.20: CYP2D6 data across study days by ancestry. Continues onto next page.
CYP2D6 D1 D2 D9
Participant Geographic ancestry
DXM AUC0-6 h (nM.h)
DXR AUC0-6 h (nM.h)
DXR/DXM AUC0-6 h
ratio
DXM AUC0-6 h (nM.h)
DXR AUC0-6 h (nM.h)
DXR/DXM AUC0-6 h
ratio
DXM AUC0-6 h (nM.h)
DXR AUC0-6 h (nM.h)
DXR/DXM AUC0-6 h
ratio
1 European 43.9 101.1 2.303 26.1 62.5 2.392 32.0 56.5 1.766
3 European 20.0 100.4 5.032 11.6 86.5 7.445 11.8 75.9 6.444
8 European 40.4 76.7 1.900 55.9 72.7 1.301 67.6 95.5 1.412
9 European 66.8 170.0 2.544 71.8 169.6 2.361 30.7 155.1 5.052
10 European 47.4 161.5 3.405 38.7 123.3 3.182 51.2 158.0 3.086
11 European 75.7 121.5 1.605 57.0 130.8 2.297 35.4 85.0 2.398
12 European 44.4 59.8 1.347 52.7 62.2 1.180 54.9 53.7 0.979
13 European 46.5 94.5 2.035 44.7 72.5 1.623 50.8 98.5 1.938
14 European 12.5 92.3 7.398 14.1 83.9 5.952 7.12 75.1 10.551
15 European 10.3 64.0 6.210 16.8 100.6 5.998 10.2 82.8 8.099
16 European 17.4 72.9 4.182 27.3 91.1 3.342 22.1 88.9 4.024 Mean (Europeans) 38.7 101.3 3.451 37.9 96.0 3.370 34.0 93.2 4.159 SD (Europeans) 21.6 36.6 2.015 20.1 33.2 2.132 20.2 34.3 3.082 CV% 55.8 36.1 58.4 53.2 34.6 63.3 59.5 36.9 74.1
2 South Asian 27.8 76.2 2.738 28.8 109.9 3.813 32.8 99.5 3.030
4 South Asian 27.2 59.3 2.180 27.3 60.1 2.202 30.8 58.7 1.908
5 South Asian 29.6 145.1 4.905 34.1 126.7 3.710 26.8 83.0 3.092
6 South Asian 9.88 68.8 6.964 8.14 41.9 5.147 7.95 50.2 6.323
7 South Asian 10.0 60.8 6.071 22.0 72.1 3.279 19.3 105.9 5.479
17 South Asian 69.5 52.3 0.752 38.3 32.6 0.850 11.9 41.4 3.472
18 South Asian 80.4 128.2 1.595 59.0 104.4 1.768 50.0 116.7 2.331
19 South Asian 94.2 108.1 1.148 71.0 74.5 1.049 69.9 67.6 0.966

163
CYP2D6 D1 D2 D9
Participant Geographic ancestry
DXM AUC0-6 h (nM.h)
DXR AUC0-6 h (nM.h)
DXR/DXM AUC0-6 h
ratio
DXM AUC0-6 h (nM.h)
DXR AUC0-6 h (nM.h)
DXR/DXM AUC0-6 h
ratio
DXM AUC0-6 h (nM.h)
DXR AUC0-6 h (nM.h)
DXR/DXM AUC0-6 h
ratio
20 South Asian 95.9 157.6 1.643 95.8 139.5 1.456 86.5 139.8 1.615
21 South Asian 72.3 53.6 0.741 73.1 49.0 0.670 57.3 36.7 0.640 Mean (South Asians) 51.7 91.0 2.874 45.8 81.1 2.394 39.3 79.9 2.886 SD (South Asians) 34.1 40.2 2.279 27.6 37.0 1.512 25.8 34.7 1.842 CV% 66.0 44.2 79.3 60.4 45.7 63.2 65.7 43.4 63.8 Mean (Total) 44.9 96.4 3.176 41.6 88.9 2.906 36.5 86.9 3.553 SD (Total) 28.3 37.8 2.111 23.7 35.0 1.885 22.6 34.3 2.589 CV% 63.1 39.2 66.5 57.0 39.4 64.9 62.0 39.5 72.9

164
5.3.4.4.3 CYP2D6 activity
Due to the large number of CYP2D6 variants and copy number variants tested, three linear
mixed models were necessary to avoid over-parameterisation and allow for successful EMM
generation. In the European ancestry group, the DXR/DXM AUC0-6 h ratio CV% ranged from
58-74%. For the South Asian participants, CV% spanned 64-79%. There was a significant
change in CYP2D6 activity across study days: activity increased 17% from D2 to D9 (F =
1.806, P = 0.052), although this was not supported by statistically significant changes
between the other study days (Table 5.21). Ancestry did not have a significant overall effect
in the model, nor did Study Day*Ancestry.
Genetic variants and gene copy number had no significant overall effects in the models due
to the low numbers in each variant genotype sub-group. However, the Ancestry*Genotype
interactions in the models were significant, with CYP2D6 activity significantly varying
between ancestries by genotype for CYP2D6*10 (F = 4.202, P = 0.061), CYP2D6*4 (F = 6.725,
P = 0.019) and copy number (F = 4.164, P = 0.059). The overall differences between the
ancestry groups by genotype are listed in Table 5.22. For CYP2D6*10 GG and CYP2D6*4 CC
individuals, Europeans had higher CYP2D6 activity than South Asians. For those individuals
with one copy of the CYP2D6 gene, Europeans had 3-fold higher activity than South Asians.
Table 5.21: Back-transformed geometric EMM ratios of CYP2D6 activity with 90% CIs across study days by ancestry group.
D2/D1 D9/D1 D9/D2
Europeans (n = 11) 0.95 (0.78, 1.15) 1.08 (0.89, 1.32) 1.14 (0.94, 1.38) South Asians (n = 10) 0.91 (0.74, 1.11) 1.09 (0.89, 1.34) 1.20 (0.98, 1.47)
Overall (n = 21) 0.93 (0.81, 1.06) 1.09 (0.95, 1.24) 1.17 (1.02, 1.35)1
1. P = 0.052

165
Table 5.22: Back-transformed geometric EMM ratios of CYP2D6 activity with 90% CIs between ancestry by CYP2D6*4 and CYP2D6*10 genotypes and CYP2D6 gene copy number.
CYP2D6*4 CYP2D6*10 CYP2D6 gene copy
number
Genotype European/South
Asian Genotype
European/South Asian
Category European/South
Asian
GG~ 2.02 (1.10, 3.70)1 CC$ 2.13 (1.28, 3.52)2 1 copy& 3.02 (1.17, 7.81)3
AG# 0.43 (0.10, 1.73) CT^ 0.42 (0.14, 1.30) 2 copies* 0.39 (0.12, 1.29)
> 2
copiesx 1.70 (0.93, 3.10)
~: European n = 7, South Asian n = 9
#: European n = 4, South Asian n = 1
$: European n = 7, South Asian n = 9
^: European n = 4, South Asian n = 1
&: European n = 2, South Asian n = 3
*: European n = 3, South Asian n = 1
x: European n = 6, South Asian n = 6
1. P = 0.061
2. P = 0.019
3. P = 0.059

166
5.3.4.5 CYP3A4
5.3.4.5.1 Midazolam
The 4-h midazolam plasma concentration CV% ranged from 39-50% in Europeans and 36-
50% in South Asians; CV% varied little within ancestry groups across the study days (Table
5.23). Individual participant midazolam data across study days by ancestry and genotype are
shown in Figure 5.14. Mean 4-h midazolam plasma concentrations were similar in both
ancestry groups (Europeans: 5.99 ± 2.68 nM, South Asians: 6.13 ± 2.73 nM). In the
Europeans, mean 4-h midazolam concentrations increased immediately after a broccoli
meal (D1 to D2), then decreased after 6 days of broccoli consumption (D2 to D9).
Midazolam concentrations at 4-h increased from D1 to D2 to D9 in the South Asian ancestry
group.
5.3.4.5.2 α-hydroxymidazolam
α-hydroxymidazolam (OH-MID) concentrations had larger variability than midazolam: CV%
ranged from 37-64% in Europeans and 54-76% in South Asians (Table 5.23). Individual
participant 4-h OH-MID plasma concentrations across study days by ancestry and genotype
are shown in Figure 5.15. Mean 4-h plasma concentrations were very similar in both
ancestry groups (Europeans: 2.93 ± 1.52 nM, South Asians: 2.42 ± 1.52 nM). Mean OH-MID
concentrations increased between D1 to D2 then decreased between D2 to D9, and this
pattern was also seen in the South Asian ancestry group.

167
Table 5.23: CYP3A4 data across study days by ancestry. Continues onto next page.
Genotype
CYP3A4 D1 D2 D9
Participant CYP3A4*22 rs35599367 15389C>T
Geographic ancestry
4-h MID conc. (nM)
4-h OH-MID conc. (nM)
OH-MID/MID 4-h conc.
ratio
4-h MID conc. (nM)
4-h OH-MID conc. (nM)
OH-MID/MID 4-h conc.
ratio
4-h MID conc. (nM)
4-h OH-MID conc. (nM)
OH-MID/MID 4-h conc.
ratio
1 CC European 4.08 2.43 0.595 5.87 4.98 0.848 5.48 3.06 0.558
3 CT European 3.91 1.62 0.414 2.55 1.25 0.490 4.63 1.87 0.403
8 CC European 2.84 1.70 0.598 3.71 2.44 0.657 5.13 3.79 0.739
9 CC European 5.57 3.64 0.654 10.5 4.57 0.434 4.50 4.07 0.904
10 CC European 9.09 2.99 0.329 10.7 3.68 0.345 8.89 2.77 0.312
11 CC European 11.7 5.97 0.510 8.40 7.91 0.942 7.37 1.81 0.245
12 CC European 2.71 1.12 0.413 4.20 0.99 0.235 3.92 1.25 0.318
13 CC European 5.82 2.06 0.354 6.59 1.99 0.303 3.92 1.77 0.450
14 CC European 3.89 3.13 0.804 3.01 2.28 0.759 2.53 2.17 0.858
15 CC European 10.0 5.64 0.563 6.21 2.94 0.474 7.39 3.90 0.528
16 CC European 6.72 2.32 0.345 6.31 1.92 0.304 9.45 2.51 0.266 Mean (Europeans) 6.03 2.97 0.507 6.19 3.18 0.526 5.75 2.63 0.508 SD (Europeans) 3.04 1.58 0.151 2.79 2.02 0.240 2.22 0.97 0.235 CV% 50.4 53.4 29.7 45.0 63.6 45.6 38.6 36.8 46.3
2 CC South Asian 3.38 2.60 0.768 5.08 3.34 0.657 4.57 2.34 0.511
4 CC South Asian 1.76 1.41 0.799 3.31 2.28 0.691 2.21 1.56 0.707
5 CC South Asian 4.01 1.86 0.464 5.36 2.54 0.474 3.35 1.77 0.528
6 CC South Asian 6.09 2.06 0.338 7.05 2.34 0.332 8.71 2.37 0.272
7 CC South Asian 7.02 3.09 0.440 4.76 1.97 0.415 10.7 7.09 0.660
17 CC South Asian 7.95 2.95 0.371 7.07 2.66 0.377 6.73 2.39 0.356
18 CC South Asian 8.36 4.36 0.521 5.95 3.76 0.632 7.51 3.65 0.486

168
Genotype
CYP3A4 D1 D2 D9
Participant CYP3A4*22 rs35599367 15389C>T
Geographic ancestry
4-h MID conc. (nM)
4-h OH-MID conc. (nM)
OH-MID/MID 4-h conc.
ratio
4-h MID conc. (nM)
4-h OH-MID conc. (nM)
OH-MID/MID 4-h conc.
ratio
4-h MID conc. (nM)
4-h OH-MID conc. (nM)
OH-MID/MID 4-h conc.
ratio
19 CC South Asian 10.8 2.80 0.260 11.2 5.45 0.486 12.5 3.05 0.244
20 CC South Asian 3.94 0.27 0.069 4.94 0.84 0.169 4.53 0.59 0.129
21 CC South Asian 4.31 0.32 0.074 5.23 0.69 0.133 5.45 0.28 0.052
Mean (South
Asians) 5.76 2.17 0.410 5.99 2.59 0.436 6.63 2.51 0.395
SD (South Asians) 2.76 1.27 0.248 2.14 1.39 0.193 3.28 1.91 0.220 CV% 48.0 58.5 60.5 35.6 53.6 44.2 49.5 76.0 55.7 Mean (Total) 5.90 2.59 0.461 6.10 2.90 0.484 6.17 2.57 0.454 SD (Total) 2.84 1.46 0.204 2.44 1.73 0.218 2.74 1.45 0.229 CV% 48.1 56.6 44.2 40.0 59.8 45.2 44.4 56.4 50.6

169
Figure 5.14: 4-h midazolam plasma concentrations across study days by ancestry and CYP3A4*22 (rs35599367) genotype.

170
Figure 5.15: 4-h α-hydroxymidazolam plasma concentrations across study days by ancestry and CYP3A4*22 (rs35599367) genotype.

171
5.3.4.5.3 CYP3A4 activity
In the European ancestry group, the 4-h OH-MID/MID plasma concentration ratio CV%
ranged from 30-46% (Table 5.23). For the South Asian participants, CV% spanned 44-61%.
There was a no significant effect of Study Day on the mixed-effects model, and therefore no
statistically significant changes in CYP3A4 activity across study days (F = 0.588, P = 0.560).
Similarly, Ancestry had no significant overall effect on the model (F = 0.713, P = 0.410).
Further, there was no significant effect of Study Day*Ancestry (F = 1.845, P = 0.172), but the
post hoc test panel indicated that CYP3A4 activity decreased 19% between D2 to D9 (Table
5.24). This should be interpreted cautiously due to a failed Study Day*Ancestry F test.
Genotype had no significant overall effects on the model (F = 0.016, P = 0.902), nor was
there an Ancestry*Genotype interaction (F = 1.825, P = 0.194)
For better visualisation, individual changes in CYP3A4 activity by ancestry and genotype
across study days are depicted below in Figure 5.16.
Table 5.24: Back-transformed geometric EMM ratios of CYP3A4 activity with 90% CIs across study days by ancestry group.
D2/D1 D9/D1 D9/D2
Europeans (n = 11) 0.98 (0.81, 1.19) 0.94 (0.78, 1.15) 0.96 (0.79, 1.17) South Asians (n = 10) 1.22 (0.99, 1.49) 0.99 (0.81, 1.21) 0.81 (0.66, 0.99)1
Overall (n = 21) 1.05 (0.91, 1.22) 0.96 (0.83, 1.11) 0.91 (0.79, 1.05)
1. P = 0.096

172
Figure 5.16: CYP3A4 activity across study days by ancestry and CYP3A4*22 (rs35599367) genotype.

173
5.3.5 Genetics
Frequencies of drug-metabolising gene variants by ancestry group are shown in Appendix
8.19. Statistical analyses on differences in allele frequencies between ancestry groups were
not performed because this study was not designed nor powered around these
comparisons. Further, with n = 21 participants overall, there were few subjects with
variants, complicating any interpretation of statistical comparisons between ancestry
groups. However, numerous variant genotypes were significant predictors of CYP enzyme
activity and SUL exposure, and these have been reported above for the relevant mixed-
effects models studied described in this chapter.

174
5.4 Discussion
This study is the first report of a simultaneous investigation into how diet, genetics and
geographic ancestry affect the activities of five CYP enzymes, and how these effects can be
related to SUL exposure. In this study, genetics and a predominantly curry diet were strong
predictors of SUL exposure. In Chapter 2, studies were identified that showed a relationship
between GSTM1, GSTP1 and UGT1A1 genotypes and ITC exposure, alongside corresponding
increases in drug-metabolising enzyme activity. In particular, work by Peterson et al. (2009)
report data showing that the GSTM1-null allele is associated with higher amounts of
isothiocyanates excreted in urine, presumably due to inhibition of ITC metabolism. While
none of the natural log-transformed CYP metrics significantly correlated with SUL D2 AUC0-8
h, this does not preclude an effect, as local exposure following absorption on intestinal
enzymes and transporters could contribute to these observations.
There were no significant differences in SUL exposure between ancestry groups. However,
as increased SUL exposure was strongly associated with a predominantly curry diet, curry
constituents could inhibit the phase II enzymes that metabolise SUL (as they do with
CYP1A2). It is worth noting that this study only measured one ITC, SUL (Chapter 4), and that
phenethyl isothiocyanate (PEITC), indoles and glucosinolates themselves are also reported
to affect drug-metabolising enzyme activity (Chapter 1). Future studies should measure the
plasma concentrations of other ITCs and their active metabolites to further explore the
mechanisms of ITC-induced increases in drug-metabolising enzyme activity. This study
reports for the first-time data on optimal sampling times for SUL plasma concentrations as
metrics for ITC exposure. SUL D2 AUC0-8 h significantly correlated with all other SUL
concentration-time points, with the 3- and 4-hour samples having nearly 1:1 correlation.

175
These results are useful for future studies when measuring SUL exposure; one 4-h SUL
sample provides information about systematic exposure equivalent to the 6 samples
required to calculate the AUC0-8 h.
Broccoli consumption significantly increased CYP1A2 in the European cohort, but not in the
South Asians, in agreement with observations in a previous study (Perera et al., 2012a) and
consistent with other controlled trials (Chapter 2). Further, the parent drug (caffeine)
decreased and its CYP1A2-mediated metabolite (paraxanthine) increased in the European
group, supporting a case for increased CYP1A2 enzyme activity in Europeans who consume
broccoli-enriched diets. There was no evidence of short-term inhibition on D2 immediately
following a broccoli meal. Genetics contributed to variability in CYP1A2 activity overall, with
the CYP1A2*1F variant having the greatest effect. There were however no significant
Ancestry*Genotype interactions in the model, therefore the difference in activity between
ancestry groups were not explained in terms of a difference in SNP frequencies. Curry
consumption was significantly higher in the South Asians and heavy CYP-inducer
consumption was higher in the Europeans. Curry constituents are potential CYP1A2
inhibitors (Chapter 1), and their higher consumption in South Asians could explain lower
CYP1A2 activity in this group after broccoli consumption.
There were issues encountered when studying CYP2C19 activity, namely erratic and
unpredictable absorption of omeprazole from the commercial tablet used (and therefore
erratic and unpredictable formation of 5-hydroxyomeprazole). Other studies have reported
similar issues with using omeprazole as an in vivo probe for CYP2C19 activity in humans
(Chapter 3). However, one of the strengths of the mixed-effects modelling approach for
analysing pharmacokinetic crossover data is that the model can account for missing data

176
across the included factors. Therefore, even with some cases missing, an analysis was still
made possible. There was evidence of short-term inhibition of CYP2C19 immediately after a
broccoli meal, which then increased to approximately the same initial activity after 6 days of
broccoli consumption. This was observed in both ancestry groups. Genotype played a large
role in accounting for CYP2C19 variability, with activity differences for all three variants
(CYP2C19*17, CYP2C19*1C and CYP2C19*2) studied in the model. Interestingly, there was
also an ancestry group difference by genotype: Europeans tended to have higher activity
than South Asians when their higher-activity variant genotypes were the same. One
hypothesis to explain this is the increased curry consumption in the South Asian cohort: the
CYPs share common molecular regulatory mechanisms, therefore if curry constituents can
inhibit CYP1A2, they may also inhibit other CYP enzymes (Chapter 1). If an enzyme is being
inhibited at the active site, induction will not produce an increased activity response, as any
new enzyme formed will be inhibited by the presence of the dietary constituent. Moreover,
CYP2C19 activity was positively associated with high CYP1A2 inducer consumption and
negatively associated with a high CYP1A2 inhibitor diet. The CYP1A2 inducer diets were
more prevalent in Europeans and the inhibitor diets more prevalent in South Asians,
offering an explanation of these observations. In the mixed effects model, there was no
overall effect of ancestry, nor an overall difference between ancestry groups across study
days, indicating that individual gene variants and diet must be considered together when
explaining the variability in CYP2C19 in dietary intervention trials. This study represents the
first reported attempt to simultaneously explore the effects of diet, ancestry and genetics
on CYP2C19 (Chapter 2).
Similarly, the effects of cruciferous vegetable-enriched diets, genetics and geographic
ancestry on CYP2C9 activity have not yet been reported (Chapter 2). Interestingly, activity

177
increased immediately after a broccoli meal, and then decreased following 6-days of
broccoli consumption, as indicated by an increase in losartan and a decrease in EXP
concentrations. South Asians had nearly 2-fold higher overall CYP2C9 activity than the
Europeans, but this result could not be explained by differences in genotype, as the ancestry
group difference was still noted in the variant genotype sub-groups. It remains uncertain
why a marked difference in CYP2C9 activity between the ancestry groups was observed,
especially given that it could not be explained by differences in the genotypes studies or diet
data captured between Europeans and South Asians. Further, the various diet categories
and SUL exposure did not correlate with CYP2C9 activity, complicating the interpretation of
these findings. Lastly, losartan and EXP relative exposure patterns were the same in each
ancestry group, suggesting that the changes were not a chance finding.
The activity of CYP2D6 is largely influenced by genetics rather than environmental factors
such as diet (Chapter 1), and therefore induction from cruciferous vegetables was not
expected. However, there is some research suggesting potential inhibition by the SUL found
in broccoli (section 1.7.1). In the current study, acute inhibition followed by an increase in
activity between D2 to D9 (similar to CYP2C19) was observed, however only the D2 to D9
difference was statistically significant. There were no overall differences in changes in
relation to the broccoli-enriched diet between ancestry groups, either in general or by study
day. Interestingly, despite the well-documented variability in CYP2D6 activity between
variant genotypes (Chapter 1), genotype and gene copy number did not significantly
account for variability in the various mixed-effects models used in this study. However, for a
given variant genotype, and also for participants with one copy of the CYP2D6 gene,
Europeans had 2- to 3-fold higher CYP2D6 activity than South Asians. Consequently, when
genotype and ancestry are both considered factorially in the models, there is still a

178
difference between ancestry groups. Seeing as the only measured differentiating factor
between the ancestry groups was a higher proportion of predominantly curry consumers in
the South Asian cohort, perhaps the CYP-inhibiting constituents in the high-curry diet could
explain the higher activity in Europeans when genotypes are equivalent.
As expected, CYP3A4 displayed marked variability even within each ancestry group, and no
significant differences in activity were observed between study days. Further, no resolution
was possible in the mixed-effects model to determine if there were differences between
ancestries across the study days, and there were no significant differences in CYP3A4
activity by CYP3A4*22 genotype. However, post hoc sample size calculations (section
5.2.7.1) suggested that this study was too small to meaningfully assess CYP3A4 across some
of this study’s endpoints, and further investigation in larger subject cohorts is warranted.
The main weakness of this study is its relatively small sample size (quality characteristics of
dietary intervention trials were discussed in Chapter 2). While appropriate design measures
and mixed-effects models were used, ultimately more participants are needed across the
various genetic and diet sub-categories to perform sufficiently powerful comparisons in
each sub-group. Further, some studies, for example, Peterson et al. (2009) and Navarro et
al. (2009b), actively recruited by genotype to test specific hypotheses, which was not
possible in this smaller study. It is clear though, that some of the CYPs—especially CYP2C19,
CYP2C9 and CYP2D6—have interesting ancestry-diet-genotype interactions as reported in
this study, and future investigations should consider recruiting sufficient participants of
relevant genotypes for appropriately powered sub-group analyses. Also, with respect to
design, this study recruited only male healthy volunteers, and therefore the effects of
Cruciferae-enriched diets on CYP activity on females cannot be commented on from these
179
results. Larger, well-designed studies in this area recruited near-equal numbers of males and
females, also incorporating sex as a factor or covariate into their mixed-effects models (see
work by Navarro et al., Peterson et al. and Lampe et al. in Chapter 2). Future investigators
are encouraged to take this approach of investigating the effect of sex on enzyme activity
and response to dietary interventions into their study designs if resources allow.
A further limitation of this study is a lack of methods to assess epigenetic effects on CYP
activity and how these might differ between subjects of European and South Asian
ancestries. As discussed in Chapter 1, epigenetics as a source of variability in drug-
metabolising enzymes is a largely uncharted landscape, and much research is required
before a strong clinical foundation of these important concepts is established. Inheritable
(or otherwise) epigenetic differences between ancestry groups could be the key to
explaining some observations in this study. The activity of CYP2C9 in South Asians was
consistently higher than Europeans, even when stratified by genotypes. Perhaps the answer
lies in yet-undiscovered regulatory genes and proteins, or ancestry group differences in
histone methylation. Future studies should incorporate these considerations into their study
designs and testable hypotheses, perhaps through epigenetic ex vivo analysis of liver biopsy
tissue. Similarly, constituents of foodstuffs have been shown to affect the activity of drug
transporting proteins (Dolton et al., 2012) (section 1.4), and exploring differences in their
expression and activity following cruciferous vegetable-enriched diets is warranted in future
research.
Lastly, with respect to design weaknesses, this study did not employ a standardised basal
diet. Although participants were asked to make no major changes to their diet during the
study period (which was confirmed qualitatively by comparing the two food diaries), having

180
a basal diet to which the cruciferous vegetable intervention is added allows for more robust
control of dietary constituents, which if different at baseline, could confound results. While
this study was able to consider the consumption of CYP1A2 inducers, inhibitors and high
curry consumption for some of the enzymes, controlling them altogether in a control diet
would be beneficial from a design standpoint, and future studies are encouraged to do so if
resources and time allow.
181
5.5 Conclusions
The significance of the research performed here can be framed in the context of the overall
objectives of this thesis: to better understand how diet, genetics and geographic ancestry
contribute to variability in drug metabolism. This trial is the first to report on how these
factors affect five CYP enzymes simultaneously using the phenotyping cocktail approach.
Further, data are presented from a prospective, controlled study suggesting that CYP1A2
inducer foods, CYP1A2 inhibitor foods, a predominantly curry diet and a collection of genetic
variants contribute to the interindividual variation in CYP activity, in particular for CYP1A2,
CYP2C19 and CYP2C9. Some of the enzyme activity effect sizes observed are significant,
ranging from approximately 20% to 4-fold differences between participant sub-groups.
Effect sizes of this magnitude can be clinically significant for drugs with narrow therapeutic
ranges that are substrates for these enzymes. Further research is needed to determine if
differences in pharmacokinetics translate to differences in drug efficacy and safety.
The results presented demonstrate successful and effective use of the analytical techniques
developed and validated in Chapters 3 and 4. Further, a clear evidence framework has been
provided explaining how cruciferous vegetable-enriched diets affect CYP1A2, and to a lesser
extent, CYP2C19. The activity of these enzymes varies between individuals of European and
South Asian ancestry in terms of genetics and other dietary constituents. There could be
implications for patients eating appreciable amounts of cruciferous vegetables when taking
medicines metabolised by these enzymes. These data should help investigators when
designing future trials in this area of clinical pharmacology.

182
6 Overall conclusions and closing comments
The research described in this thesis has explored the effects of various intrinsic and
extrinsic factors on variability in response to medicines, specifically, on drug-metabolising
enzyme activity (as a contributor to variability in pharmacokinetics). Chapter 1 described
and explored the relevant background literature covering variability in response to
medicines, and this was used to build a thematic, evidence-based framework from which
testable hypotheses were formed and investigated. A systematic review with meta-analyses
was conducted that assessed the results of studies investigating cruciferous vegetable
interventions and drug metabolism (Chapter 2). The results of this review informed the
design of a clinical study that investigated the effects of diet, genetics and geographic
ancestry on the activities of CYP1A2, CYP2C19, CYP2C9, CYP2D6 and CYP3A4. Before this
trial could be conducted, appropriate bioanalytical methods were developed and validated
to analyse biological samples collected. The assays for the CYP-phenotyping cocktail and
sulforaphane (SUL) are presented in Chapters 3 and 4, respectively. Finally, a 3-period
crossover trial in Europeans and South Asians investigated CYP activity between ancestry
groups by genotype and diet (Chapter 5).
This body of work contributes to a better understanding of the variability in response to
medicines between European and South Asian populations. The systematic review identified
literature indicating that the activity of CYP1A2 and GST-α are significantly affected by
Cruciferae-enriched diets. Further, the effects of cruciferous vegetable consumption on
CYP2C19, CYP2C9, CYP2D6 and CYP3A4 activity have not been reported. The study
characteristics that are considered appropriate for dietary intervention trials with
pharmacokinetic endpoints were profiled. Of significance, none of the studies identified in

183
the systematic review were designed or powered to explore differences in the effects of
Cruciferae-enriched diets on drug metabolising enzyme activity between geographic
ancestry groups.
For the pharmacokinetic study performed, the Inje and Ghassabian CYP-phenotyping
cocktails were used as a platform for the development and validation of an optimised
UHPLC-MS/MS CYP assay to measure analytes probing for CYP1A2, CYP2C19, CYP2C9,
CYP2D6 and CYP3A4 activities. This assay was successfully used to phenotype the 21 healthy
subjects of the study. Similarly, a simplified, optimised SUL assay was developed and
validated to measure SUL concentrations following broccoli consumption. The use of these
assays allowed for SUL systematic exposure to be measured at the same time as CYP-
phenotyping, enabling further exploration of the relationships between diet, genetics,
ancestry and CYP activity in Europeans and South Asians.
Since these assays were developed and used, a series of validation studies have been
reported that use dry blood spots from capillary, finger-prick whole blood samples as their
biological matrix of interest (Bosilkovska et al., 2014a; Bosilkovska et al., 2016; Bosilkovska
et al., 2014b). While some of the probe drugs used in these studies are not available in
Australia, and use cola beverages as a source of caffeine (see Chapter 3), the minimally-
invasive methods presented by Bosilkovska et al. are the way forward for in vivo
phenotyping of CYP enzyme activity. Future pharmacokinetic studies should consider
adopting a capillary blood-sampling approach, as using this method greatly reduces
sampling volumes, sample handling and storage issues, as well as reducing risk to study
participants. Further, with respect to the bioanalysis of ITCs, attempts were made to also
incorporate phenethyl isothiocyanate (PEITC) into the SUL bioanalysis. However, due to

184
poor ionisation in both electrospray and atmospheric chemical ionisation modes (ESI and
APCI, respectively), this was not possible. Previous reports indicate that ESI in particular
struggles to produce a stable product ion or adduct for analyte quantification, which can be
fixed by using APCI instead (Zheng & Zheng, 2015). Unfortunately, the methods and
suggestions by Zheng et al. were not replicable on the Agilent UHPLC-MS/MS system used in
the studies reported in this thesis, and PEITC was unable to be included in the analysis.
There is a body of literature that suggests PEITC can affect drug-metabolising enzyme
activity (section 1.7.1), therefore efforts to find ways of reliably quantifying this ITC in
human biological matrices are encouraged.
The clinical study performed represents the culmination of this research programme
(Chapter 5). This study showed that CYP1A2 activity is increased in Europeans, but not South
Asians, after a broccoli-enriched diet intervention, supporting previous reports (Perera et
al., 2012a). This population difference in CYP1A2 activity could not be explained by ancestry
group differences in the CYP1A2 variants explored. However, diet, and in particular, the
consumption of CYP1A2 inducers relative to the consumption of CYP1A2 inhibitors, and
differences in the preparation of curry between the ancestry groups could contribute to
differences in enzyme activity. Further, GSTs can be inhibited by ITCs (section 1.7.1), and
evidence supporting these previous reports is presented here. Sulforaphane exposure was
positively correlated with a predominantly curry diet, suggesting that curry constituents can
inhibit the GSTs responsible for their clearance. Further, the GSTM1 and GSTP1 null alleles
were significant predictors of SUL exposure, and when ancestry and genotype were
incorporated into the mixed model together, no significant difference was observed
between Europeans and South Asians. GSTT1, GSTT2 and UGT1A1 variant genotypes did not
significantly affect SUL exposure, nor did SUL correlate with any of the CYP enzymes studied.

185
The 4-h SUL plasma concentration was correlated with the AUC0-8 h, and future studies are
encouraged to explore the use of this single time point as a metric for SUL exposure.
This study is the first reported to simultaneously investigate the effects of diet and genetics
on CYP2C19 activity between European and South Asian ancestry groups. Evidence of acute
inhibition followed by return to baseline following broccoli consumption was presented in
this study. Several drugs with narrow therapeutic concentration ranges are metabolised by
CYP2C19, such as clopidogrel, cyclophosphamide, phenytoin, voriconazole and the R-isomer
of warfarin (AMH, 2018). Therefore, variability in the activity of this enzyme caused by
environmental and genetic influences can directly affect patient outcomes in those taking
CYP2C19 substrates for various diseases (Amsden & Gubbins, 2017; Hicks et al., 2013; Li et
al., 2012; Stingl & Viviani, 2015). It is interesting that CYP2C19 activity was higher in
Europeans than South Asians with the same variant genotypes for CYP2C19*1C and
CYP2C19*17. Allele frequencies of these variants were comparable to those found in the
1000 genome project (Table 1.8 and Appendix 8.19). One hypothesis explaining this
observation is that a heavy CYP1A2 inducer diet was more common in the Europeans than
the South Asians, which could explain the overall higher activity when variant genotypes
were equal. Relatively few studies have investigated the effects of genetics on CYP2C19
activity in South Asian populations, but the ones that do report a similar gene-activity
relationship with CYP2C19*17 and CYP2C19*2 compared to Europeans, suggesting diet (and
other extrinsic factors) are responsible for explaining the difference in activity between
these two ancestry groups (Arya et al., 2015; Jose et al., 2016; Mahadevan et al., 2014;
Shalia et al., 2013; Sridharan et al., 2016; Tantray et al., 2017; Xavier et al., 2016). Future
studies should also explore the effects of transporters and epigenetics on differences in
CYP2C19 activity between these ancestry groups (sections 1.4, 1.5 and 5.4).

186
Similarly, there are no reports of how cruciferous vegetable-enriched diets and genetics
affect CYP2C9 activity differently in Europeans relative to South Asians. Overall, enzyme
activity increased immediately after a broccoli meal, and decreased slightly following 6 days
of broccoli consumption. An ancestry group difference was present: South Asians had nearly
2-fold higher CYP2C9 activity than Europeans throughout the study, even when stratified by
the same variant genotypes. Further, none of the diet categories or SUL exposure correlated
with CYP2C9 activity. Variant allele frequencies for CYP2C9*2 and CYP2C9*3 were
comparable to those reported for Europeans and South Asians in the 1000 genomes project
(Table 1.8 and Appendix 8.19). As CYP2C9 activity is regulated by genetics more than
extrinsic factors, few studies have investigated the effects of diet on this enzyme. Therefore,
it is difficult to attribute the higher activity in South Asians compared to Europeans of the
same variant genotypes to differences in dietary practices. However, a recent clinical study
has shown that overnight fasting before phenotyping significantly reduces CYP2C9 activity
by up to 25% (Lammers et al., 2015). Perhaps the nature of this ‘fasting effect’ on CYP2C9
activity could be different between those of different geographic ancestries, and should be
explored further. Because CYP2C9 is involved in the metabolic clearance of medicines with
narrow therapeutic indices, such as bosentan, cyclophosphamide, phenytoin, ruxolitinib,
voriconazole and the S-isomer of warfarin, the 2-fold difference in enzyme activity between
South Asians and Europeans presented in this study is of potential clinical significance, and
ancestry group differences in the pharmacokinetics and dynamics of these substrate drugs
should be investigated.
The effects of cruciferous vegetables, dietary constituents, genetics and ancestry on CYP2D6
and CYP3A4 have not previously been studied simultaneously before. In this research,
CYP2D6 activity was 2- to 3-fold higher in Europeans than South Asians in CYP2D6*4 and

187
CYP2D6*10 homozygotes, and those with one copy of the CYP2D6 gene. Diet was unable to
explain this difference between the ancestry groups, although there was evidence of
enzyme inhibition following broccoli consumption in both groups. CYP2D6 is highly
polymorphic, and haplotypes can be constructed from the numerous variant genotypes,
which then correspond to activity phenotype sub-groups (Hicks et al., 2014; Hicks et al.,
2013). Because this study was relatively small, some variant genotype sub-groups had few-
to-no cases in them, and allele frequencies in Europeans and South Asians were different
compared to those reported in the 1000 genome project (Table 1.8 and Appendix 8.19).
Therefore, despite the gain in power from using mixed-effects models, the difference in
CYP2D6 activity between ancestry groups within the same variant genotypes could be due
to chance, rather than a true observed difference as a result of the small sample size.
However, the ancestry group difference in activity is large, and therefore warrants further
investigation in appropriately powered studies that recruit based on CYP2D6 variant
haplotypes. Lastly, the difference in activity between Europeans and South Asians could be
explained by differential involvement of other enzymes. While the conversion of
dextromethorphan (DXM) to dextrorphan (DXR) has been shown to be mostly mediated by
CYP2D6, other CYP enzymes also contribute, including CYP2C9 and CYP3A4 (Yu & Haining,
2001). Perhaps ancestry-group differences in CYP2C9, as reported in this study, could be
driving the observed difference in CYP2D6 activity between Europeans and South Asians of
the same variant genotypes.
CYP3A4 displayed marked interindividual variability in both ancestry groups, and post hoc
sample size and power calculations suggest that a much larger sample size in each ancestry
group would be needed to assess the studied effects further for this enzyme. CYP3A4 is far
less polymorphic compared to CYP2C19, CYP2C9 and CYP2D6, and this was reflected in the

188
current study, with only one participant out of the 21 studies having a different genotype
for CYP3A4*22, in alignment with data from the 1000 genome project (Table 1.8 and
Appendix 8.19). From the results of this study, it remains unclear how intrinsic and extrinsic
factors interact to explain differences in CYP3A4 activity between Europeans and South
Asians. Future research should recruit large enough numbers in both ancestry groups to
conduct appropriately powered sub-group comparisons of enzyme activity.
Overall, this research project has explored factors contributing to variability in response to
medicines, with a focus on how diet, genetics and geographic ancestry contribute to the
activity of drug-metabolising enzymes. Specifically, the effects of cruciferous vegetables,
CYP variant genotypes and dietary practices can contribute to variability in the activities of
CYP1A2, CYP2C19, CYP2C9, CYP2D6 and CYP3A4. Future dietary intervention trials are
encouraged to adopt a basal control diet, and appropriately power the study to account for
intra- and inter-individual variability in CYP activity. Simultaneously investigating dietary and
genetic information when aiming to understand ancestry group differences in CYP activity
are recommended. Ideally, subjects of relevant enzyme variant genotypes should be
considered. While numerous pharmacokinetic effects and interactions were explored in this
research, it remains unclear if these differences in concentration and systemic exposure
translate into clinically significant variability in patients. Ultimately, more trials are needed
to assess whether Cruciferae-enriched diets can affect the safe and efficacious use of CYP
substrates in pharmacotherapy. Some of the ancestry group differences in CYP activity
reported in this research were large, and further investigations should explore how
cruciferous vegetables and variant genotypes affect important therapeutic CYP substrates,
such as theophylline, warfarin and voriconazole, in Europeans and South Asians.
189
7 References
Agrawal S., Winnik B., Buckley B., Mi L., Chung F.L., & Cook T.J. (2006). Simultaneous
determination of sulforaphane and its major metabolites from biological matrices
with liquid chromatography-tandem mass spectroscopy. Journal of Chromatography
B: Analytical Technologies in the Biomedical and Life Sciences 840: 99-107.
Al-Zoughool M., & Talaska G. (2006). 4-Aminobiphenyl N-glucuronidation by liver
microsomes: Optimization of the reaction conditions and characterization of the
UDP-glucuronosyltransferase isoforms. Journal of Applied Toxicology 26: 524-532.
Allocati N., Masulli M., Di Ilio C., & Federici L. (2018). Glutathione transferases: substrates,
inihibitors and pro-drugs in cancer and neurodegenerative diseases. Oncogenesis 7:
8.
Altman D.G., Schulz K.F., Moher D., Egger M., Davidoff F., Elbourne D., et al. (2001). The
revised CONSORT statement for reporting randomized trials: explanation and
elaboration. Annals of Internal Medicine 134: 663-694.
Alumkal J.J., Slottke R., Schwartzman J., Cherala G., Munar M., Graff J.N., et al. (2015). A
phase II study of sulforaphane-rich broccoli sprout extracts in men with recurrent
prostate cancer. Investigational New Drugs 33: 480-489.
AMH (2018) Australian Medicines Handbook (online). Available from:
https://amhonline.amh.net.au/. Adelaide.
Amsden J.R., & Gubbins P.O. (2017). Pharmacogenomics of triazole antifungal agents:
implications for safety, tolerability and efficacy. Expert Opinion on Drug Metabolism
and Toxicology 13: 1135-1146.

190
Ares A.M., Valverde S., Bernal J.L., Nozal M.J., & Bernal J. (2015). Development and
validation of a LC-MS/MS method to determine sulforaphane in honey. Food
Chemistry 181: 263-269.
Argikar U.A., Iwuchukwu O.F., & Nagar S. (2008). Update on tools for evaluation of uridine
diphosphoglucuronosyltransferase polymorphisms. Expert Opinion on Drug
Metabolism and Toxicology 4: 879-894.
Arya V., Mahajan P., Saraf A., Mohanty A., Sawhney J.P., & Bhargava M. (2015). Association
of CYP2C19, CYP3A5 and GPIIb/IIIa gene polymorphisms with Aspirin and Clopidogrel
Resistance in a cohort of Indian patients with Coronary Artery Disease. International
Journal of Laboratory Hematology 37: 809-818.
Auton A., Brooks L.D., Durbin R.M., Garrison E.P., Kang H.M., Korbel J.O., et al. (2015). A
global reference for human genetic variation. Nature 526: 68-74.
Belanger A., Pelletier G., Labrie F., Barbier O., & Chouinard S. (2003). Inactivation of
androgens by UDP-glucuronosyltransferase enzymes in humans. Trends in
Endocrinology and Metabolism 14: 473-479.
Benoit-Biancamano M.O., Connelly J., Villeneuve L., Caron P., & Guillemette C. (2009).
Deferiprone glucuronidation by human tissues and recombinant UDP
glucuronosyltransferase 1A6: An in vitro investigation of genetic and splice variants.
Drug Metabolism and Disposition 37: 322-329.
Bjornsson T.D., Wagner J.A., Donahue S.R., Harper D., Karim A., Khouri M.S., et al. (2003). A
review and assessment of potential sources of ethnic differences in drug
responsiveness. Journal of Clinical Pharmacology 43: 943-967.
191
Blevins-Primeau A.S., Sun D., Chen G., Sharma A.K., Gallagher C.J., Amin S., et al. (2009).
Functional significance of UDP-Glucuronosyltransferase variants in the metabolism
of active tamoxifen metabolites. Cancer Research 69: 1892-1900.
Bock K.W., Schrenk D., Forster A., Griese E.U., Mörike K., Brockmeier D., et al. (1994). The
influence of environmental and genetic factors on CYP2D6, CYP1A2 and UDP-
glucuronosyltransferases in man using sparteine, caffeine, and paracetamol as
probes. Pharmacogenetics 4: 209-218.
Bogaards J.J.P., Verhagen H., Willems M.I., Poppel v.G., & Bladeren v.P.J. (1994).
Consumption of Brussels sprouts results in elevated alpha-class glutathione S-
transferase levels in human blood plasma. Carcinogenesis 15: 1073-1075.
Bonfiglio R., King R.C., Olah T.V., Merkle K., & Henion J. (1999). The effects of sample
preparation methods on the variability of the electrospray ionization response for
model drug compounds. Rapid Communications in Mass Spectrometry 13: 1175-
1185.
Booth B., & Kadavil J. (2001). Guidance for Industry. Bioanalytical Method Validation.
Bosilkovska M., Deglon J., Samer C., Walder B., Desmeules J., Staub C., et al. (2014a).
Simultaneous LC-MS/MS quantification of P-glycoprotein and cytochrome P450
probe substrates and their metabolites in DBS and plasma. Bioanalysis 6: 151-164.
Bosilkovska M., Samer C., Deglon J., Thomas A., Walder B., Desmeules J., et al. (2016).
Evaluation of Mutual Drug-Drug Interaction within Geneva Cocktail for Cytochrome
P450 Phenotyping using Innovative Dried Blood Sampling Method. Basic & Clinical
Pharmacology & Toxicology 119: 284-290.

192
Bosilkovska M., Samer C.F., Deglon J., Rebsamen M., Staub C., Dayer P., et al. (2014b).
Geneva cocktail for cytochrome P450 and P-glycoprotein activity assessment using
dried blood spots. Clinical Pharmacology and Therapeutics 96: 349-359.
Bowalgaha K., Elliot D.J., Mackenzie P.I., Knights K.M., & Miners J.O. (2007). The
glucuronidation of (Delta)4-3-keto C19- and C21-hydroxysteroids by human liver
microsomal and recombinant UDP-glucuronosyltransferases (UGTs): 6(alpha)- and
21-hydroxyprogesterone are selective substrates for UGT2B7. Drug Metabolism and
Disposition 35: 363-370.
Cappiello M., Giuliani L., & Pacifice G.M. (1991). Distribution of UDP-glucuronosyltransferase
and its endogenous substrate uridine 5'-diphosphoglucuronic acid in human tissues.
European Journal of Clinical Pharmacology 41: 345-350.
Caraco Y., Sheller J., & Wood A.J.J. (1997). Pharmacogenetic determinants of codeine
induction by rifampin: The impact on codeine's respiratory, psychomotor and miotic
effects. Journal of Pharmacology and Experimental Therapeutics 281: 330-336.
Cartea M., & Velasco P. (2008). Glucosinolates in <i>Brassica foods: bioavailability in
food and significance for human health. Phytochemistry Reviews 7: 213-229.
Chang J.L., Bigler J., Schwarz Y., Li S.S., Li L., King I.B., et al. (2007). UGT1A1 polymorphism is
associated with serum bilirubin concentrations in a randomized, controlled, fruit and
vegetable feeding trial. Journal of Nutrition 137: 890-897.
Chen L., Mohr S.N., & Yang C.S. (1996). Decrease of plasma and urinary oxidative
metabolites of acetaminophen after consumption of watercress by human
volunteers. Clinical Pharmacology and Therapeutics 60: 651-660.

193
Cheung K.L., & Kong A.N. (2010). Molecular targets of dietary phenethyl isothiocyanate and
sulforaphane for cancer chemoprevention. The AAPS Journal 12: 87-97.
Chung J.Y., Cho J.Y., Yu K.S., Kim J.R., Lim K.S., Sohn D.R., et al. (2008). Pharmacokinetic and
pharmacodynamic interaction of lorazepam and valproic acid in relation to UGT2B7
genetic polymorphism in healthy subjects. Clinical Pharmacology and Therapeutics
83: 595-600.
Clarke J.D., Hsu A., Riedl K., Bella D., Schwartz S.J., Stevens J.F., et al. (2011). Bioavailability
and inter-conversion of sulforaphane and erucin in human subjects consuming
broccoli sprouts or broccoli supplement in a cross-over study design.
Pharmacological Research 64: 456-463.
Coller J.K., Krebsfaenger N., Klein K., Endrizzi K., Wolbold R., Lang T., et al. (2002). The
influence of CYP2B6, CYP2C9 and CYP2D6 genotypes on the formation of the potent
antioestrogen Z-4-hydroxy-tamoxifen in human liver. British Journal of Clinical
Pharmacology 54: 157-167.
Conney A.H. (1982). Induction of Microsomal Enzymes by Foreign Chemicals and
Carcinogenesis by Polycyclic Aromatic Hydrocarbons: G. H. A. Clowes Memorial
Lecture. Cancer Research 42: 4875-4917.
Conney A.H. (2003). Induction of Drug-Metabolizing Enzymes: A Path to the Discovery of
Multiple Cytochromes P450. In Annual Review of Pharmacology and Toxicology. pp
1-30.
Corchero J., Granvil C.P., Akiyama T.E., Hayhurst G.P., Pimprale S., Feigenbaum L., et al.
(2001). The CYP2D6 humanized mouse: Effect of the human CYP2D6 transgene and

194
HNF4α on the disposition of debrisoquine in the mouse. Molecular Pharmacology
60: 1260-1267.
Court M.H. (2005). Isoform‐Selective Probe Substrates for In Vitro Studies of Human UDP‐
Glucuronosyltransferases. In Methods in Enzymology. eds Helmut S., & Lester P.
Academic Press, pp 104-116.
Court M.H., Duan S.X., Guillemette C., Journault K., Krishnaswamy S., Von Moltke L.L., et al.
(2002). Stereoselective conjugation of oxazepam by human UDP-
glucuronosyltransferases (UGTS): S-oxazepam is glucuronidated by UGT2B15, while
R-oxazepam is glucuronidated by UGT2B7 and UGT1A9. Drug Metabolism and
Disposition 30: 1257-1265.
Daly A.K. (1995). Molecular basis of polymorphic drug metabolism. Journal of Molecular
Medicine 73: 539-553.
Daly A.K. (2006). Significance of the minor cytochrome P450 3A isoforms. Clinical
Pharmacokinetics 45: 13-31.
de Andrés F., & Llerena A. (2016). Simultaneous determination of cytochrome P450
oxidation capacity in humans: A review on the phenotyping cocktail approach.
Current Pharmaceutical Biotechnology 17: 1159-1180.
De Andrés F., Sosa-Macías M., & Llerena A. (2014). A rapid and simple LC-MS/MS method
for the simultaneous evaluation of CYP1A2, CYP2C9, CYP2C19, CYP2D6 and CYP3A4
hydroxylation capacity. Bioanalysis 6: 683-696.
de Waard P.W., Peijnenburg A.A., Baykus H., Aarts J.M., Hoogenboom R.L., van Schooten
F.J., et al. (2008). A human intervention study with foods containing natural Ah-

195
receptor agonists does not significantly show AhR-mediated effects as measured in
blood cells and urine. Chemico-Biological Interactions 176: 19-29.
DeLozier T.C., Kissling G.E., Coulter S.J., Dai D., Foley J.F., Bradbury J.A., et al. (2007).
Detection of human CYP2C8, CYP2C9, and CYP2J2 in cardiovascular tissues. Drug
Metabolism and Disposition 35: 682-688.
Desager J.P., Golnez J.L., De Buck C., & Horsmans Y. (2002). Watercress has no Importance
for the elimination of ethanol by CYP2E1 inhibition. Pharmacology & Toxicology 91:
103-105.
Ding X., & Kaminsky L.S. (2003). Human Extrahepatic Cytochromes P450: Function in
Xenobiotic Metabolism and Tissue-Selective Chemical Toxicity in the Respiratory and
Gastrointestinal Tracts. In Annual Review of Pharmacology and Toxicology. pp 149-
173.
Dollery C.T. (2006). Clinical pharmacology – the first 75 years and a view of the future.
British Journal of Clinical Pharmacology 61: 650-665.
Dolton M.J., Roufogalis B.D., & McLachlan A.J. (2012). Fruit juices as perpetrators of drug
interactions: the role of organic anion-transporting polypeptides. Clinical
Pharmacology and Therapeutics 92: 622-630.
Donzelli M., Derungs A., Serratore M.-G., Noppen C., Nezic L., Krähenbühl S., et al. (2014).
The Basel Cocktail for Simultaneous Phenotyping of Human Cytochrome P450
Isoforms in Plasma, Saliva and Dried Blood Spots. Clinical Pharmacokinetics 53: 271-
282.

196
Dorado P., Heras N., Machín E., Hernández F., Teran E., & Llerena A. (2012). CYP2D6
genotype and dextromethorphan hydroxylation phenotype in an Ecuadorian
population. European Journal of Clinical Pharmacology 68: 637-644.
Dorne J.L.C.M., Walton K., & Renwick A.G. (2003). Human variability in CYP3A4 metabolism
and CYP3A4-related uncertainty factors for risk assessment. Food and Chemical
Toxicology 41: 201-224.
Dürr D., Stieger B., Kullak-Ublick G.A., Rentsch K.M., Steinert H.C., Meier P.J., et al. (2000). St
John's Wort induces intestinal P-glycoprotein/MDR1 and intestinal and hepatic
CYP3A4. Clinical Pharmacology and Therapeutics 68: 598-604.
Elbourne D.R., Altman D.G., Higgins J.P., Curtin F., Worthington H.V., & Vail A. (2002). Meta-
analyses involving cross-over trials: methodological issues. International Journal of
Epidemiology 31: 140-149.
Fahey J.W., Zhang Y., & Talalay P. (1997). Broccoli sprouts: An exceptionally rich source of
inducers of enzymes that protect against chemical carcinogens. Proceedings of the
National Academy of Sciences 94: 10367-10372.
Farooq M., Kelly E.J., & Unadkat J.D. (2016). CYP2D6 Is Inducible by Endogenous and
Exogenous Corticosteroids. Drug Metabolism and Disposition: The Biological Fate of
Chemicals 44: 750-757.
Gasper A.V., Al-Janobi A., Smith J.A., Bacon J.R., Fortun P., Atherton C., et al. (2005).
Glutathione S-transferase M1 polymorphism and metabolism of sulforaphane from
standard and high-glucosinolate broccoli.[Erratum appears in Am J Clin Nutr. 2006
Mar;83(3):724]. American Journal of Clinical Nutrition 82: 1283-1291.

197
Ghassabian S., Chetty M., Tattam B.N., Chem M.C., Glen J., Rahme J., et al. (2009). A high-
throughput assay using liquid chromatography-tandem mass spectrometry for
simultaneous in vivo phenotyping of 5 major cytochrome p450 enzymes in patients.
Therapeutic Drug Monitoring 31: 239-246.
Ginsberg G., Guyton K., Johns D., Schimek J., Angle K., & Sonawane B. (2010). Genetic
polymorphism in metabolism and host defense enzymes: Implications for human
health risk assessment. Critical Reviews in Toxicology 40: 575-619.
Glaeser H., Drescher S., Eichelbaum M., & Fromm M.F. (2005). Influence of rifampicin on the
expression and function of human intestinal cytochrome P450 enzymes. British
Journal of Clinical Pharmacology 59: 199-206.
Goh B.C., Reddy N.J., Dandamudi U.B., Laubscher K.H., Peckham T., Hodge J.P., et al. (2010).
An evaluation of the drug interaction potential of pazopanib, an oral vascular
endothelial growth factor receptor tyrosine kinase inhibitor, using a modified
Cooperstown 5+1 cocktail in patients with advanced solid tumors. Clinical
Pharmacology and Therapeutics 88: 652-659.
Grangeon A., Gravel S., Gaudette F., Turgeon J., & Michaud V. (2017). Highly sensitive LC-
MS/MS methods for the determination of seven human CYP450 activities using small
oral doses of probe-drugs in human. Journal of Chromatography B: Analytical
Technologies in the Biomedical and Life Sciences 1040: 144-158.
Greiner B., Eichelbaum M., Fritz P., Kreichgauer H.P., Von Richter O., Zundler J., et al. (1999).
The role of intestinal P-glycoprotein in the interaction of digoxin and rifampin.
Journal of Clinical Investigation 104: 147-153.

198
Grubb C.D., & Abel S. (2006). Glucosinolate metabolism and its control. Trends in Plant
Science 11: 89-100.
Gueorguieva R., & Krystal J.H. (2004). Move over ANOVA: progress in analyzing repeated-
measures data and its reflection in papers published in the Archives of General
Psychiatry. Archives of General Psychiatry 61: 310-317.
Gupta P., Wright S.E., Kim S.H., & Srivastava S.K. (2014). Phenethyl isothiocyanate: a
comprehensive review of anti-cancer mechanisms. Biochimica et Biophysica Acta
1846: 405-424.
Hakooz N., & Hamdan I. (2007). Effects of dietary broccoli on human in vivo caffeine
metabolism: a pilot study on a group of Jordanian volunteers. Current Drug
Metabolism 8: 9-15.
Hamilton S.M., & Teel R.W. (1996). Effects of isothiocyanates on cytochrome P-450 1A1 and
1A2 activity and on the mutagenicity of heterocyclic amines. Anticancer Research 16:
3597-3602.
Hara H., & Adachi T. (2002). Contribution of hepatocyte nuclear factor-4 to down-regulation
of CYP2D6 gene expression by nitric oxide. Molecular Pharmacology 61: 194-200.
Hauder J., Winkler S., Bub A., Rufer C.E., Pignitter M., & Somoza V. (2011). LC-MS/MS
quantification of sulforaphane and indole-3-carbinol metabolites in human plasma
and urine after dietary intake of selenium-fortified broccoli. Journal of Agricultural
and Food Chemistry 59: 8047-8057.
Hayes J.D., Flanagan J.U., & Jowsey I.R. (2005). Glutathione transferases. Annual Review of
Pharmacology and Toxicology 45: 51-88.

199
He X., Hesse L.M., Hazarika S., Masse G., Harmatz J.S., Greenblatt D.J., et al. (2009). Evidence
for oxazepam as an in vivo probe of UGT2B15: Oxazepam clearance is reduced by
UGT2B15 D85Y polymorphism but unaffected by UGT2B17 deletion. British Journal
of Clinical Pharmacology 68: 721-730.
Hecht S.S. (1995). Chemoprevention by isothiocyanates. Journal of Cellular Biochemistry 59:
195-209.
Hicks J.K., Swen J.J., & Gaedigk A. (2014). Challenges in CYP2D6 phenotype assignment from
genotype data: a critical assessment and call for standardization. Current Drug
Metabolism 15: 218-232.
Hicks J.K., Swen J.J., Thorn C.F., Sangkuhl K., Kharasch E.D., Ellingrod V.L., et al. (2013).
Clinical Pharmacogenetics Implementation Consortium guideline for CYP2D6 and
CYP2C19 genotypes and dosing of tricyclic antidepressants. Clinical Pharmacology
and Therapeutics 93: 402-408.
Higgins J.P., White I.R., & Anzures-Cabrera J. (2008). Meta-analysis of skewed data:
combining results reported on log-transformed or raw scales. Statistics in Medicine
27: 6072-6092.
Higgins J.P.T., & Green S. (eds) (2011). Cochrane Handbook for Systematic Reviews of
Interventions. The Cochrane Collaboration.
Huang S.M., & Temple R. (2008). Is this the drug or dose for you?: Impact and consideration
of ethnic factors in global drug development, regulatory review, and clinical practice.
Clinical Pharmacology and Therapeutics 84: 287-294.

200
Hunt L.M., & Megyesi M.S. (2008). Genes, race and research ethics: Who's minding the
store? Journal of Medical Ethics 34: 495-500.
Ichimaru K., Toyoshima S., & Uyama Y. (2010). Effective global drug development strategy
for obtaining regulatory approval in japan in the context of ethnicity-related drug
response factors. Clinical Pharmacology and Therapeutics 87: 362-366.
Ivanov M., Kacevska M., & Ingelman-Sundberg M. (2012). Epigenomics and interindividual
differences in drug response. Clinical Pharmacology and Therapeutics 92: 727-736.
Janobi A.A.A., Mithen R.F., Gasper A.V., Shaw P.N., Middleton R.J., Ortori C.A., et al. (2006).
Quantitative measurement of sulforaphane, iberin and their mercapturic acid
pathway metabolites in human plasma and urine using liquid chromatography–
tandem electrospray ionisation mass spectrometry. Journal of Chromatography B
844: 223-234.
Ji Y., & Morris M.E. (2003). Determination of phenethyl isothiocyanate in human plasma and
urine by ammonia derivatization and liquid chromatography–tandem mass
spectrometry. Analytical Biochemistry 323: 39-47.
Jorge-Nebert L.F., Jiang Z., Chakraborty R., Watson J., Jin L., McGarvey S.T., et al. (2010).
Analysis of human CYP1A1 and CYP1A2 genes and their shared bidirectional
promoter in eight world populations. Human Mutation 31: 27-40.
Jose M., Mathaiyan J., Kattimani S., Adithan S., & Chandrasekaran A. (2016). Role of
CYP2C19 gene polymorphism in acute alcohol withdrawal treatment with loading
dose of diazepam in a South Indian population. European Journal of Clinical
Pharmacology 72: 807-812.

201
Jover R., Moya M., & Gómez-Lechón M.J. (2009). Transcriptional regulation of cytochrome
P450 genes by the nuclear receptor hepatocyte nuclear factor 4-alpha. Current Drug
Metabolism 10: 508-519.
Kacevska M., Ivanov M., & Ingelman-Sundberg M. (2011). Perspectives on epigenetics and
its relevance to adverse drug reactions. Clinical Pharmacology and Therapeutics 89:
902-907.
Kakuda T.N., Van Solingen-Ristea R.M., Onkelinx J., Stevens T., Aharchi F., De Smedt G., et al.
(2014). The effect of single- and multiple-dose etravirine on a drug cocktail of
representative cytochrome P450 probes and digoxin in healthy subjects. Journal of
Clinical Pharmacology 54: 422-431.
Kall M.A., Vang O., & Clausen J. (1996). Effects of dietary broccoli on human in vivo drug
metabolizing enzymes: evaluation of caffeine, oestrone and chlorzoxazone
metabolism. Carcinogenesis 17: 793-799.
Kall M.A., Vang O., & Clausen J. (1997). Effects of dietary broccoli on human drug
metabolising activity. Cancer Letters 114: 169-170.
Kato Y., Nakajima M., Oda S., Fukami T., & Yokoi T. (2012). Human UDP-
glucuronosyltransferase isoforms involved in haloperidol glucuronidation and
quantitative estimation of their contribution. Drug Metabolism and Disposition 40:
240-248.
Kaufman J.S., & Cooper R.S. (2001). Commentary: Considerations for use of racial/ethnic
classification in etiologic research. American Journal of Epidemiology 154: 291-298.

202
Kawakami H., Ohtsuki S., Kamiie J., Suzuki T., Abe T., & Terasaki T. (2011). Simultaneous
absolute quantification of 11 cytochrome P450 isoforms in human liver microsomes
by liquid chromatography tandem mass spectrometry with In silico target peptide
selection. Journal of Pharmaceutical Sciences 100: 341-352.
Klein K., Winter S., Turpeinen M., Schwab M., & Zanger U.M. (2010). Pathway-targeted
pharmacogenomics of CYP1A2 in human liver. Frontiers in Pharmacology 1: 129.
König J., Müller F., & Fromm M.F. (2013). Transporters and drug-drug interactions:
important determinants of drug disposition and effects. Pharmacological Reviews
65: 944-966.
Koo S.H., Lo Y.L., Yee J.Y., & Lee E.J. (2015). Genetic and/or non-genetic causes for inter-
individual and inter-cellular variability in transporter protein expression: implications
for understanding drug efficacy and toxicity. Expert Opinion on Drug Metabolism and
Toxicology 11: 1821-1837.
Koukouritaki S.B., Manro J.R., Marsh S.A., Stevens J.C., Rettie A.E., McCarver D.G., et al.
(2004). Developmental Expression of Human Hepatic CYP2C9 and CYP2C19. Journal
of Pharmacology and Experimental Therapeutics 308: 965-974.
Kreidler S.M., Muller K.E., Grunwald G.K., Ringham B.M., Coker-Dukowitz Z.T., Sakhadeo
U.R., et al. (2013). GLIMMPSE: Online Power Computation for Linear Models with
and without a Baseline Covariate. Journal of statistical software 54: i10.
Kumar A., & Sabbioni G. (2010). New biomarkers for monitoring the levels of
isothiocyanates in humans. Chemical Research in Toxicology 23: 756-765.

203
Kushad M.M., Brown A.F., Kurilich A.C., Juvik J.A., Klein B.P., Wallig M.A., et al. (1999).
Variation of Glucosinolates in Vegetable Crops of Brassica oleracea. Journal of
Agricultural and Food Chemistry 47: 1541-1548.
Lammers L.A., Achterbergh R., de Vries E.M., van Nierop F.S., Klumpen H.J., Soeters M.R., et
al. (2015). Short-term fasting alters cytochrome P450-mediated drug metabolism in
humans. Drug Metabolism and Disposition: The Biological Fate of Chemicals 43: 819-
828.
Lammers L.A., Achterbergh R., Pistorius M.C.M., Bijleveld Y., De Vries E.M., Boelen A., et al.
(2016). Quantitative method for simultaneous analysis of a 5-probe cocktail for
cytochrome p450 enzymes. Therapeutic Drug Monitoring 38: 761-768.
Lampe J.W., Chen C., Li S., Prunty J., Grate M.T., Meehan D.E., et al. (2000a). Modulation of
human glutathione S-transferases by botanically defined vegetable diets. Cancer
Epidemiology, Biomarkers & Prevention 9: 787-793.
Lampe J.W., King I.B., Li S., Grate M.T., Barale K.V., Chen C., et al. (2000b). Brassica
vegetables increase and apiaceous vegetables decrease cytochrome P450 1A2
activity in humans: changes in caffeine metabolite ratios in response to controlled
vegetable diets. Carcinogenesis 21: 1157-1162.
Lamy E., Scholtes C., Herz C., & Mersch-Sundermann V. (2011). Pharmacokinetics and
pharmacodynamics of isothiocyanates. Drug Metabolism Reviews 43: 387-407.
Leclercq I., Desager J.P., & Horsmans Y. (1998). Inhibition of chlorzoxazone metabolism, a
clinical probe for CYP2E1, by a single ingestion of watercress. Clinical Pharmacology
and Therapeutics 64: 144-149.
204
Lee E., Shon J.C., & Liu K.H. (2016). Simultaneous evaluation of substrate-dependent CYP3A
inhibition using a CYP3A probe substrates cocktail. Biopharmaceutics and Drug
Disposition 37: 366-372.
Lepine J., Bernard O., Plante M., Tetu B., Pelletier G., Labrie F., et al. (2004). Specificity and
regioselectivity of the conjugation of estradiol, estrone, and their catecholestrogen
and methoxyestrogen metabolites by human uridine diphospho-
glucuronosyltransferases expressed in endometrium. Journal of Clinical
Endocrinology and Metabolism 89: 5222-5232.
Levesque E., Turgeon D., Carrier J.S., Montminy V., Beaulieu M., & Belanger A. (2001).
Isolation and characterization of the UGT2B28 cDNA encoding a novel human steroid
conjugating UDP-glucuronosyltransferase. Biochemistry 40: 3869-3881.
Li L.-y., Luo Y., Lu M.-d., Xu X.-w., Lin H.-d., & Zheng Z.-q. (2015). Cruciferous vegetable
consumption and the risk of pancreatic cancer: a meta-analysis. World Journal of
Surgical Oncology 13: 44.
Li W., Zhang J., & Tse F.L.S. (2013) Handbook of LC-MS bioanalysis: best practices,
experimental protocols, and regulations. John Wiley & Sons: Hoboken, New Jersey.
Li Y., Tang H.L., Hu Y.F., & Xie H.G. (2012). The gain-of-function variant allele CYP2C19*17: a
double-edged sword between thrombosis and bleeding in clopidogrel-treated
patients. Journal of Thrombosis and Haemostasis 10: 199-206.
Lin Y.S., Dowling A.L.S., Quigley S.D., Farin F.M., Zhang J., Lamba J., et al. (2002). Co-
regulation of CYP3A4 and CYP3A5 and contribution to hepatic and intestinal
midazolam metabolism. Molecular Pharmacology 62: 162-172.

205
Macaluso M., Nichols A.I., & Preskorn S.H. (2015). How the Probability and Potential Clinical
Significance of Pharmacokinetically Mediated Drug-Drug Interactions Are Assessed in
Drug Development: Desvenlafaxine as an Example. Primary Care Companion to CNS
Disorders 17.
Mahadevan L., Yesudas A., Sajesh P.K., Revu S., Kumar P., Santhosh D., et al. (2014).
Prevalence of genetic variants associated with cardiovascular disease risk and drug
response in the Southern Indian population of Kerala. Indian Journal of Human
Genetics 20: 175-184.
Mano Y., Usui T., & Kamimura H. (2007). The UDP-glucuronosyltransferase 2B7 isozyme is
responsible for gemfibrozil glucuronidation in the human liver. Drug Metabolism and
Disposition 35: 2040-2044.
Maruo Y., Iwai M., Mori A., Sato H., & Takeuchi Y. (2005). Polymorphism of UDP-
glucuronosyltransferase and drug metabolism. Current Drug Metabolism 6: 91-99.
Matsumura K., Saito T., Takahashi Y., Ozeki T., Kiyotani K., Fujieda M., et al. (2004).
Identification of a Novel Polymorphic Enhancer of the Human CYP3A4 Gene.
Molecular Pharmacology 65: 326-334.
McDanell R.E., Henderson L.A., Russell K., & McLean A.E.M. (1992). The Effect of Brassica
Vegetable Consumption on Caffeine Metabolism in Humans. Human & Experimental
Toxicology 11: 167-172.
Mills E., Montori V.M., Wu P., Gallicano K., Clarke M., & Guyatt G. (2004). Interaction of St
John's wort with conventional drugs: systematic review of clinical trials. BMJ 329: 27-
30.

206
Miners J.O., Knights K.M., Houston J.B., & Mackenzie P.I. (2006). In vitro-in vivo correlation
for drugs and other compounds eliminated by glucuronidation in humans: pitfalls
and promises. Biochemical Pharmacology 71: 1531-1539.
Miners J.O., McKinnon R.A., & Mackenzie P.I. (2002). Genetic polymorphisms of UDP-
glucuronosyltransferases and their functional significance. Toxicology 181-182: 453-
456.
Müller C., Schäfer P., Störtzel M., Vogt S., & Weinmann W. (2002). Ion suppression effects in
liquid chromatography–electrospray-ionisation transport-region collision induced
dissociation mass spectrometry with different serum extraction methods for
systematic toxicological analysis with mass spectra libraries. Journal of
Chromatography B: Analytical Technologies in the Biomedical and Life Sciences 773:
47-52.
Murphy S.E., Johnson L.M., Losey L.M., Carmella S.G., & Hecht S.S. (2001). Consumption of
Watercress Fails to Alter Coumarin Metabolism in Humans. Drug Metabolism and
Disposition 29: 786-788.
Murray S., Lake B.G., Gray S., Edwards A.J., Springall C., Bowey E.A., et al. (2001). Effect of
cruciferous vegetable consumption on heterocyclic aromatic amine metabolism in
man. Carcinogenesis 22: 1413-1420.
Nagar S., & Remmel R.P. (2006). Uridine diphosphoglucuronosyltransferase
pharmacogenetics and cancer. Oncogene 25: 1659-1672.
Nakajima M., Yoshida R., Shimada N., Yamazaki H., & Yokoi T. (2001). Inhibition and
inactivation of human cytochrome P450 isoforms by phenethyl isothiocyanate. Drug
Metabolism and Disposition 29: 1110-1113.

207
Navarro S.L., Chang J.L., Peterson S., Chen C., King I.B., Schwarz Y., et al. (2009a).
Modulation of human serum glutathione S-transferase A1/2 concentration by
cruciferous vegetables in a controlled feeding study is influenced by GSTM1 and
GSTT1 genotypes. Cancer Epidemiology, Biomarkers & Prevention 18: 2974-2978.
Navarro S.L., Chen Y., Li L., Li S.S., Chang J.-L., Schwarz Y., et al. (2011). UGT1A6 and
UGT2B15 polymorphisms and acetaminophen conjugation in response to a
randomized, controlled diet of select fruits and vegetables. Drug Metabolism and
Disposition 39: 1650-1657.
Navarro S.L., Peterson S., Chen C., Makar K.W., Schwarz Y., King I.B., et al. (2009b).
Cruciferous vegetable feeding alters UGT1A1 activity: Diet- and genotype-dependent
changes in serum bilirubin in a controlled feeding trial. Cancer Prevention Research
2: 345-352.
Nebert D.W., Dalton T.P., Okey A.B., & Gonzalez F.J. (2004). Role of aryl hydrocarbon
receptor-mediated induction of the CYP1 enzymes in environmental toxicity and
cancer. Journal of Biological Chemistry 279: 23847-23850.
Nehlig A. (2018). Interindividual Differences in Caffeine Metabolism and Factors Driving
Caffeine Consumption. Pharmacological Reviews 70: 384-411.
Nelson D.R., Zeldin D.C., Hoffman S.M.G., Maltais L.J., Wain H.M., & Nebert D.W. (2004).
Comparison of cytochrome P450 (CYP) genes from the mouse and human genomes,
including nomenclature recommendations for genes, pseudogenes and alternative-
splice variants. Pharmacogenetics 14: 1-18.
208
Nijhoff W.A., Mulder T.P., Verhagen H., van Poppel G., & Peters W.H. (1995). Effects of
consumption of brussels sprouts on plasma and urinary glutathione S-transferase
class-alpha and -pi in humans. Carcinogenesis 16: 955-957.
Nordmark A., Andersson A., Baranczewski P., Wanag E., & Stahle L. (2014). Assessment of
interaction potential of AZD2066 using in vitro metabolism tools, physiologically
based pharmacokinetic modelling and in vivo cocktail data. European Journal of
Clinical Pharmacology 70: 167-178.
O'Shea D., Kim R.B., & Wilkinson G.R. (1997). Modulation of CYP2E1 activity by isoniazid in
rapid and slow N-acetylators. British Journal of Clinical Pharmacology 43: 99-103.
Oakley A. (2011). Glutathione transferases: a structural perspective. Drug Metabolism
Reviews 43: 138-151.
Oh K.S., Park S.J., Shinde D.D., Shin J.G., & Kim D.H. (2012). High-sensitivity liquid
chromatography-tandem mass spectrometry for the simultaneous determination of
five drugs and their cytochrome P450-specific probe metabolites in human plasma.
Journal of Chromatography B: Analytical Technologies in the Biomedical and Life
Sciences 895-896: 56-64.
Ohtsuki S., Schaefer O., Kawakami H., Inoue T., Liehner S., Saito A., et al. (2012).
Simultaneous absolute protein quantification of transporters, cytochromes P450,
and UDP-glucuronosyltransferases as a novel approach for the characterization of
individual human liver: Comparison with mRNA levels and activities. Drug
Metabolism and Disposition 40: 83-92.
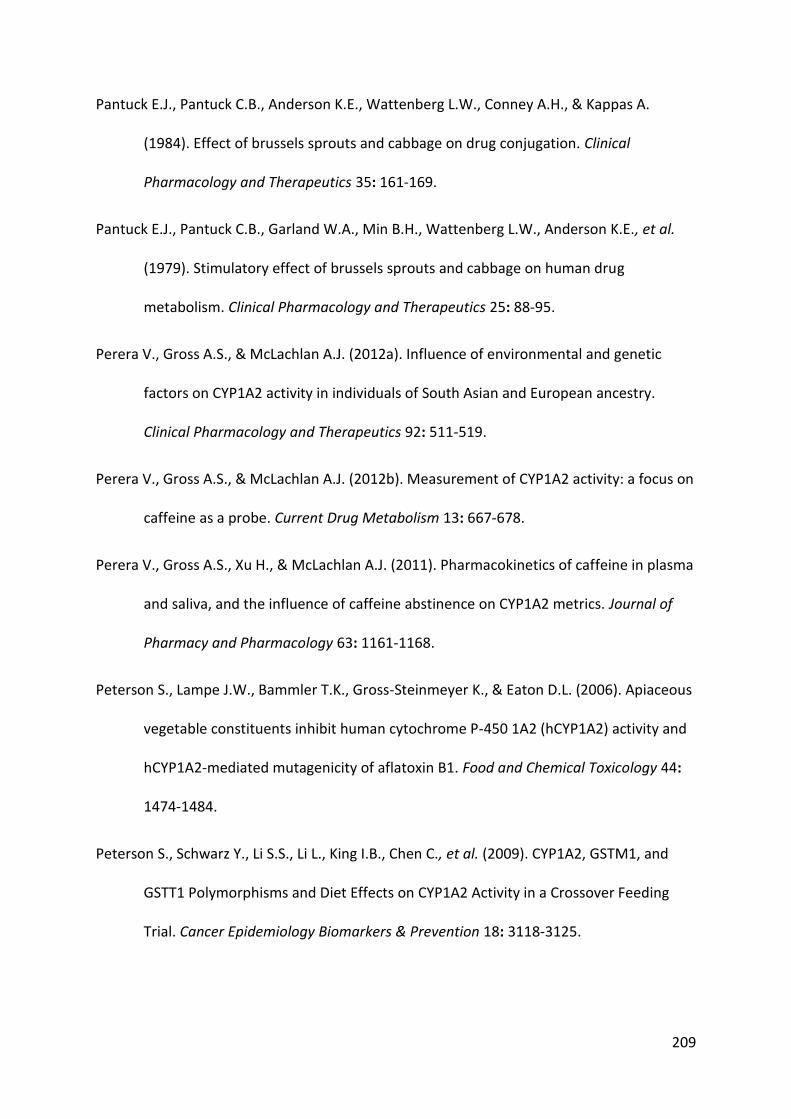
209
Pantuck E.J., Pantuck C.B., Anderson K.E., Wattenberg L.W., Conney A.H., & Kappas A.
(1984). Effect of brussels sprouts and cabbage on drug conjugation. Clinical
Pharmacology and Therapeutics 35: 161-169.
Pantuck E.J., Pantuck C.B., Garland W.A., Min B.H., Wattenberg L.W., Anderson K.E., et al.
(1979). Stimulatory effect of brussels sprouts and cabbage on human drug
metabolism. Clinical Pharmacology and Therapeutics 25: 88-95.
Perera V., Gross A.S., & McLachlan A.J. (2012a). Influence of environmental and genetic
factors on CYP1A2 activity in individuals of South Asian and European ancestry.
Clinical Pharmacology and Therapeutics 92: 511-519.
Perera V., Gross A.S., & McLachlan A.J. (2012b). Measurement of CYP1A2 activity: a focus on
caffeine as a probe. Current Drug Metabolism 13: 667-678.
Perera V., Gross A.S., Xu H., & McLachlan A.J. (2011). Pharmacokinetics of caffeine in plasma
and saliva, and the influence of caffeine abstinence on CYP1A2 metrics. Journal of
Pharmacy and Pharmacology 63: 1161-1168.
Peterson S., Lampe J.W., Bammler T.K., Gross-Steinmeyer K., & Eaton D.L. (2006). Apiaceous
vegetable constituents inhibit human cytochrome P-450 1A2 (hCYP1A2) activity and
hCYP1A2-mediated mutagenicity of aflatoxin B1. Food and Chemical Toxicology 44:
1474-1484.
Peterson S., Schwarz Y., Li S.S., Li L., King I.B., Chen C., et al. (2009). CYP1A2, GSTM1, and
GSTT1 Polymorphisms and Diet Effects on CYP1A2 Activity in a Crossover Feeding
Trial. Cancer Epidemiology Biomarkers & Prevention 18: 3118-3125.

210
Platz S., Piberger A.L., Budnowski J., Herz C., Schreiner M., Blaut M., et al. (2015).
Bioavailability and biotransformation of sulforaphane and erucin metabolites in
different biological matrices determined by LC–MS–MS. Analytical and Bioanalytical
Chemistry 407: 1819-1829.
Pool-Zobel B., Veeriah S., & Böhmer F.D. (2005). Modulation of xenobiotic metabolising
enzymes by anticarcinogens - Focus on glutathione S-transferases and their role as
targets of dietary chemoprevention in colorectal carcinogenesis. Mutation Research -
Fundamental and Molecular Mechanisms of Mutagenesis 591: 74-92.
Putt M., & Chinchilli V.M. (1999). A mixed effects model for the analysis of repeated
measures cross-over studies. Statistics in Medicine 18: 3037-3058.
Qiu H., Mathäs M., Nestler S., Bengel C., Nem D., Gödtel-Armbrust U., et al. (2010). The
unique complexity of the CYP3A4 upstream region suggests a nongenetic
explanation of its expression variability. Pharmacogenetics and Genomics 20: 167-
178.
Raimundo S., Toscano C., Klein K., Fischer J., Griese E.U., Eichelbaum M., et al. (2004). A
novel intronic mutation, 2988G>A, with high predictivity for impaired function of
cytochrome P450 2D6 in white subjects. Clinical Pharmacology and Therapeutics 76:
128-138.
Rajeevan H., Osier M.V., Cheung K.H., Deng H., Druskin L., Heinzen R., et al. (2003). ALFRED:
the ALelle FREquency Database. Update. Nucleic Acids Research 31: 270-271.
Rebbeck T.R., & Sankar P. (2005). Ethnicity, ancestry, and race in molecular epidemiologic
research. Cancer Epidemiology Biomarkers and Prevention 14: 2467-2471.

211
Rettie A.E., & Jones J.P. (2005). Clinical and toxicological relevance of CYP2C9: Drug-drug
interactions and pharmacogenetics. In Annual Review of Pharmacology and
Toxicology. pp 477-494.
Riso P., Brusamolino A., Moro M., & Porrini M. (2009). Absorption of bioactive compounds
from steamed broccoli and their effect on plasma glutathione S-transferase activity.
International Journal of Food Sciences and Nutrition 60 Suppl 1: 56-71.
Riso P., Del Bo C., Vendrame S., Brusamolino A., Martini D., Bonacina G., et al. (2014).
Modulation of plasma antioxidant levels, glutathione S-transferase activity and DNA
damage in smokers following a single portion of broccoli: a pilot study. Journal of the
Science of Food and Agriculture 94: 522-528.
Rodrigues A.D. (1999). Integrated cytochrome P450 reaction phenotyping: attempting to
bridge the gap between cDNA-expressed cytochromes P450 and native human liver
microsomes. Biochemical Pharmacology 57: 465-480.
Ryu J.Y., Song I.S., Sunwoo Y.E., Shon J.H., Liu K.H., Cha I.J., et al. (2007). Development of the
"Inje cocktail" for high-throughput evaluation of five human cytochrome P450
isoforms in vivo. Clinical Pharmacology and Therapeutics 82: 531-540.
Schulz K.F., Altman D.G., & Moher D. (2010). CONSORT 2010 statement: updated guidelines
for reporting parallel group randomised trials. BMC Medicine 8: 18.
Shalia K.K., Shah V.K., Pawar P., Divekar S.S., & Payannavar S. (2013). Polymorphisms of
MDR1, CYP2C19 and P2Y12 genes in Indian population: effects on clopidogrel
response. Indian Heart Journal 65: 158-167.

212
Sheehan D., Meade G., Foley V.M., & Dowd C.A. (2001). Structure, function and evolution of
glutathione transferases: implications for classification of non-mammalian members
of an ancient enzyme superfamily. Biochemical Journal 360: 1-16.
Shen H., Brown L.D., & Zhi H. (2006). Efficient estimation of log-normal means with
application to pharmacokinetic data. Statistics in Medicine 25: 3023-3038.
Shimada T., Yamazaki H., Mimura M., Inui Y., & Guengerich F.P. (1994). Interindividual
variations in human liver cytochrome P-450 enzymes involved in the oxidation of
drugs, carcinogens and toxic chemicals: Studies with liver microsomes of 30 Japanese
and 30 Caucasians. Journal of Pharmacology and Experimental Therapeutics 270:
414-423.
Skupinska K., Misiewicz-Krzeminska I., Lubelska K., & Kasprzycka-Guttman T. (2009a). The
effect of isothiocyanates on CYP1A1 and CYP1A2 activities induced by polycyclic
aromatic hydrocarbons in Mcf7 cells. Toxicology in Vitro 23: 763-771.
Skupinska K., Misiewicz-Krzeminska I., Stypulkowski R., Lubelska K., & Kasprzycka-Guttman
T. (2009b). Sulforaphane and its analogues inhibit CYP1A1 and CYP1A2 activity
induced by benzo[a]pyrene. Journal of Biochemical and Molecular Toxicology 23: 18-
28.
Song L., & Thornalley P.J. (2007). Effect of storage, processing and cooking on glucosinolate
content of Brassica vegetables. Food and Chemical Toxicology 45: 216-224.
Sorich M.J., & McKinnon R.A. (2012). Personalized medicine: potential, barriers and
contemporary issues. Current Drug Metabolism 13: 1000-1006.

213
Sridharan K., Kataria R., Tolani D., Bendkhale S., Gogtay N.J., & Thatte U.M. (2016).
Evaluation of CYP2C19, P2Y12, and ABCB1 polymorphisms and phenotypic response
to clopidogrel in healthy Indian adults. Indian Journal of Pharmacology 48: 350-354.
Stefanska B., & MacEwan D.J. (2015). Epigenetics and pharmacology. British Journal of
Pharmacology 172: 2701-2704.
Steinkellner H., Rabot S., Freywald C., Nobis E., Scharf G., Chabicovsky M., et al. (2001).
Effects of cruciferous vegetables and their constituents on drug metabolizing
enzymes involved in the bioactivation of DNA-reactive dietary carcinogens. Mutation
Research 480-481: 285-297.
Stingl J., & Viviani R. (2015). Polymorphism in CYP2D6 and CYP2C19, members of the
cytochrome P450 mixed-function oxidase system, in the metabolism of psychotropic
drugs. Journal of Internal Medicine 277: 167-177.
Tanaka S., Uchida S., Inui N., Takeuchi K., Watanabe H., & Namiki N. (2014). Simultaneous
LC-MS/MS analysis of the plasma concentrations of a cocktail of 5 cytochrome P450
substrate drugs and their metabolites. Biological & Pharmaceutical Bulletin 37: 18-
25.
Tantray J.A., Reddy K.P., Jamil K., & Kumar Y.S. (2017). Pharmacodynamic and cytogenetic
evaluation in CYP2C19*2 and CYP2C19*3 allelomorphism in South Indian population
with clopidogrel therapy. International Journal of Cardiology 229: 113-118.
Taylor P.J. (2005). Matrix effects: The Achilles heel of quantitative high-performance liquid
chromatography-electrospray-tandem mass spectrometry. Clinical Biochemistry 38:
328-334.

214
Thiers F.A., Sinskey A.J., & Berndt E.R. (2008). Trends in the globalization of clinical trials.
Nature Reviews Drug Discovery 7: 13-14.
Thornalley P.J. (2002). Isothiocyanates: mechanism of cancer chemopreventive action. Anti-
Cancer Drugs 13: 331-338.
Tirona R.G. (2011). Molecular mechanisms of drug transporter regulation. In Handbook of
Experimental Pharmacology. pp 373-402.
Tompkins L.M., & Wallace A.D. (2007). Mechanisms of cytochrome P450 inductionWiley
Subscription Services, Inc., A Wiley Company: Hoboken, pp 176-181.
Trontelj J., Marc J., Zavratnik A., Bogataj M., & Mrhar A. (2009). Effects of UGT1A1*28
polymorphism on raloxifene pharmacokinetics and pharmacodynamics. British
Journal of Clinical Pharmacology 67: 437-444.
Tucker G.T., Rostami-Hodjegan A., & Jackson P.R. (1998). Determination of drug-
metabolizing enzyme activity in vivo: pharmacokinetic and statistical issues.
Xenobiotica 28: 1255-1273.
Turpault S., Brian W., Van Horn R., Santoni A., Poitiers F., Donazzolo Y., et al. (2009).
Pharmacokinetic assessment of a five-probe cocktail for CYPs 1A2, 2C9, 2C19, 2D6
and 3A. British Journal of Clinical Pharmacology 68: 928-935.
Ueda R., Iketaki H., Nagata K., Kimura S., Gonzalez F.J., Kusano K., et al. (2006). A common
regulatory region functions bidirectionally in transcriptional activation of the human
CYP1A1 and CYP1A2 genes. Molecular Pharmacology 69: 1924-1930.

215
Vallejo F., Tomás-Barberán F.A., & García-Viguera C. (2002). Potential bioactive compounds
in health promotion from broccoli cultivars grown in Spain. Journal of the Science of
Food and Agriculture 82: 1293-1297.
Van Eeckhaut A., Lanckmans K., Sarre S., Smolders I., & Michotte Y. (2009). Validation of
bioanalytical LC–MS/MS assays: Evaluation of matrix effects. Journal of
Chromatography B: Analytical Technologies in the Biomedical and Life Sciences 877:
2198-2207.
Verkerk R., Schreiner M., Krumbein A., Ciska E., Holst B., Rowland I., et al. (2009).
Glucosinolates in Brassica vegetables: the influence of the food supply chain on
intake, bioavailability and human health. Molecular Nutrition & Food Research 53
Suppl 2: S219.
Vistisen K., Poulsen H.E., & Loft S. (1992). Foreign compound metabolism capacity in man
measured from metabolites of dietary caffeine. Carcinogenesis 13: 1561-1568.
Vogl S., Lutz R.W., Schönfelder G., & Lutz W.K. (2015). CYP2C9 genotype vs. metabolic
phenotype for individual drug dosing--a correlation analysis using flurbiprofen as
probe drug. PloS One 10: e0120403.
Von Richter O., Burk O., Fromm M.F., Thon K.P., Eichelbaum M., & Kivistö K.T. (2004).
Cytochrome P450 3A4 and P-glycoprotein expression in human small intestinal
enterocytes and hepatocytes: A comparative analysis in paired tissue specimens.
Clinical Pharmacology and Therapeutics 75: 172-183.
Wang H., Yuan L., & Zeng S. (2011). Characterizing the effect of UDP-
glucuronosyltransferase (UGT) 2B7 and UGT1A9 genetic polymorphisms on

216
enantioselective glucuronidation of flurbiprofen. Biochemical Pharmacology 82:
1757-1763.
Wang Z.J., Yin O.Q.P., Tomlinson B., & Chow M.S.S. (2008). OCT2 polymorphisms and in-vivo
renal functional consequence: Studies with metformin and cimetidine.
Pharmacogenetics and Genomics 18: 637-645.
Whirl-Carrillo M., McDonagh E.M., Hebert J.M., Gong L., Sangkuhl K., Thorn C.F., et al.
(2012). Pharmacogenomics Knowledge for Personalized Medicine. Clinical
Pharmacology and Therapeutics 92: 414-417.
Wilkinson G.R. (2005). Drug therapy: Drug metabolism and variability among patients in
drug response. New England Journal of Medicine 352: 2211-2221+2259.
Wohlfarth A., Naue J., Lutz-Bonengel S., Dresen S., & Auwarter V. (2012). Cocktail approach
for in vivo phenotyping of 5 major CYP450 isoenzymes: Development of an effective
sampling, extraction, and analytical procedure and pilot study with comparative
genotyping. Journal of Clinical Pharmacology 52: 1200-1214.
Wolbold R., Klein K., Burk O., Nüssler A.K., Neuhaus P., Eichelbaum M., et al. (2003). Sex is a
major determinant of CYP3A4 expression in human liver. Hepatology 38: 978-988.
Xavier A.S., Kumar S.V., Sundaram R., Francis J., & Shewade D.G. (2016). Effect of
antituberculosis treatment on CYP2C19 enzyme activity in genetically polymorphic
South Indian Tamilian population. Fundamental and Clinical Pharmacology 30: 607-
615.

217
Yang C.S. (2015). Influences of Dietary and Other Factors on Xenobiotic Metabolism and
Carcinogenesis-A Review Article in Memory of Dr. Allan H. Conney (1930-2013).
Nutrition and Cancer 67: 1207-1213.
Yang N., Sun R., Liao X., Aa J., & Wang G. (2017). UDP-glucuronosyltransferases (UGTs) and
their related metabolic cross-talk with internal homeostasis: A systematic review of
UGT isoforms for precision medicine. Pharmacological Research 121: 169-183.
Yasuda S.U., Zhang L., & Huang S.M. (2008). The role of ethnicity in variability in response to
drugs: Focus on clinical pharmacology studies. Clinical Pharmacology and
Therapeutics 84: 417-423.
Yin O.Q.P., Lam S.S.L., Lo C.M.Y., & Chow M.S.S. (2004). Rapid determination of five probe
drugs and their metabolites in human plasma and urine by liquid
chromatography/tandem mass spectrometry: Application to cytochrome P450
phenotyping studies. Rapid Communications in Mass Spectrometry 18: 2921-2933.
Yu A., & Haining R.L. (2001). Comparative contribution to dextromethorphan metabolism by
cytochrome P450 isoforms in vitro: Can dextromethorphan be used as a dual probe
for both CYP2D6 and CYP3A activities? Drug Metabolism and Disposition 29: 1514-
1520.
Yudell M., Roberts D., DeSalle R., & Tishkoff S. (2016). Taking race out of human genetics.
Science 351: 564-565.
Zadoyan G., Rokitta D., Klement S., Dienel A., Hoerr R., Gramatte T., et al. (2012). Effect of
Ginkgo biloba special extract EGb 761(R) on human cytochrome P450 activity: a
cocktail interaction study in healthy volunteers. European Journal of Clinical
Pharmacology 68: 553-560.

218
Zand R., Nelson S.D., Slattery J.T., Thummel K.E., Kalhorn T.F., Adams S.P., et al. (1993).
Inhibition and induction of cytochrome P4502E1-catalyzed oxidation by isoniazid in
humans. Clinical Pharmacology and Therapeutics 54: 142-149.
Zanger U.M., Fischer J., Raimundo S., Stüven T., Evert B.O., Schwab M., et al. (2001).
Comprehensive analysis of the genetic factors determining expression and function
of hepatic CYP2D6. Pharmacogenetics 11: 573-585.
Zanger U.M., & Hofmann M.H. (2008). Polymorphic cytochromes P450 CYP2B6 and CYP2D6:
Recent advances on single nucleotide polymorphisms affecting splicing. Acta Chimica
Slovenica 55: 38-44.
Zanger U.M., Klein K., Thomas M., Rieger J.K., Tremmel R., Kandel B.A., et al. (2014).
Genetics, Epigenetics, and Regulation of Drug‐Metabolizing Cytochrome P450
Enzymes. Clinical Pharmacology and Therapeutics 95: 258-261.
Zanger U.M., & Schwab M. (2013). Cytochrome P450 enzymes in drug metabolism:
Regulation of gene expression, enzyme activities, and impact of genetic variation.
Pharmacology and Therapeutics 138: 103-141.
Zhang Y. (2004). Cancer-preventive isothiocyanates: measurement of human exposure and
mechanism of action. Mutation Research 555: 173-190.
Zheng L., & Zheng F. (2015). Development and validation of an LC-APCI-MS/MS method for
the determination of phenethyl isothiocyanate in human plasma. Biomedical
Chromatography 29: 619-625.

219
8 Appendices 8.1 Systematic review search terms and strategy
The Cochrane Central Register of Controlled Trials (CENTRAL)
CENTRAL was accessed online via the Ovid platform. Several keywords were used to search
for relevant studies. These included ($ = truncation): cruciferous$, Brassica, Brassicaceae,
Raphanus, Nasturtium, broccoli, cauliflower, watercress, radish, drug-metaboli$, drug
metaboli$, GST$, UGT$, cytochrome$, and CYP$. Search results within each group
(cruciferous vegetables and drug metabolism) were combined with the Boolean operator
OR and the two groups then merged with AND.
Embase
Embase was accessed online via the Ovid portal. Medline Subject Headings (MeSH) were
identified and chosen to encompass broad subject areas and were implemented in tandem
with keywords to maximise the sensitivity of the search. MeSHs and keywords were divided
into the two groups and combined using OR and AND as above.
The MeSHs and keywords chosen within each group were:
Drug metabolism MeSHs:
- Cytochrome P-450 Enzyme System
- Glucuronosyltransferase
- Glutathione Transferase
- Glutathione S-Transferase pi
Drug metabolism keywords:
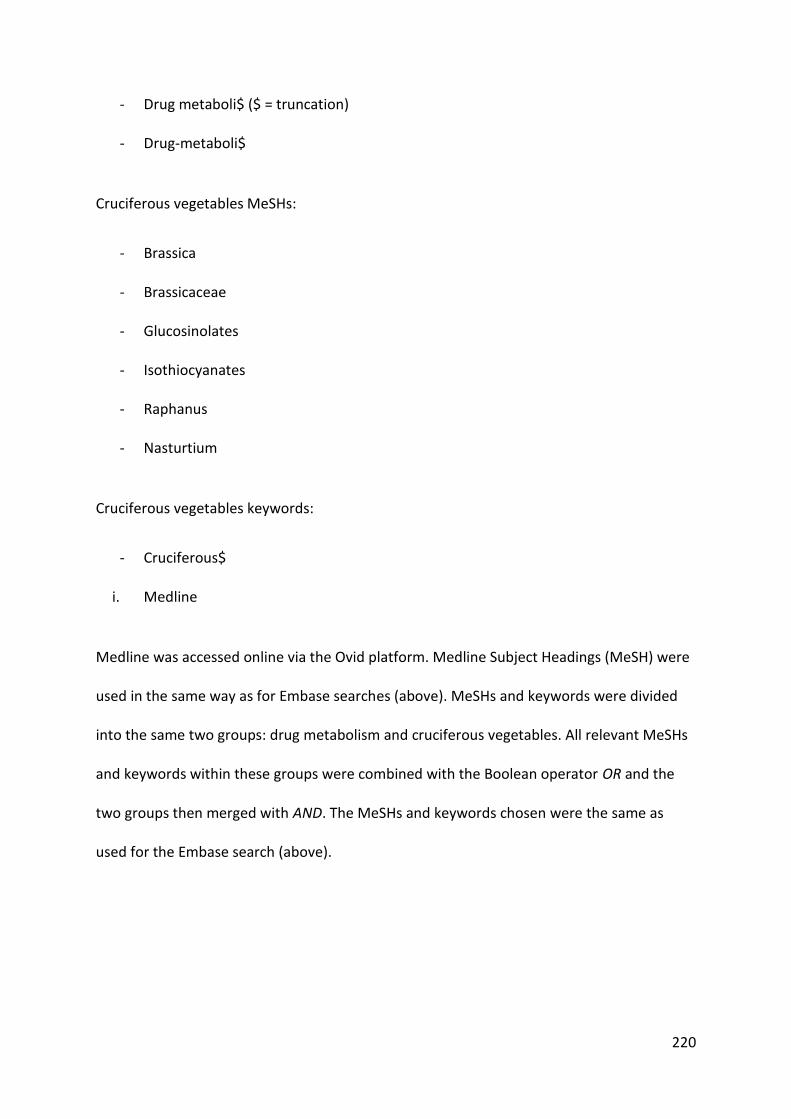
220
- Drug metaboli$ ($ = truncation)
- Drug-metaboli$
Cruciferous vegetables MeSHs:
- Brassica
- Brassicaceae
- Glucosinolates
- Isothiocyanates
- Raphanus
- Nasturtium
Cruciferous vegetables keywords:
- Cruciferous$
i. Medline
Medline was accessed online via the Ovid platform. Medline Subject Headings (MeSH) were
used in the same way as for Embase searches (above). MeSHs and keywords were divided
into the same two groups: drug metabolism and cruciferous vegetables. All relevant MeSHs
and keywords within these groups were combined with the Boolean operator OR and the
two groups then merged with AND. The MeSHs and keywords chosen were the same as
used for the Embase search (above).
221
8.2 Systematic review data extraction sheet Author (year): ____________________ Enzyme(s) studied:
______________________________
Sample size: ____ Males: ____ Females: _____ Mean age: _____
Mean weight: _____ Mean height: _____ Mean BMI: ___
Participant group similarity: statistically significant difference(s) in participant demographic
characteristics? Yes □ No □ Not stated explicitly □
Study design: Pre-test/post-test □ Crossover □ Parallel □
Randomisation: Yes □ No □ n/a (no bias plausible from design) □
Aside from intervention, groups treated equally? Yes □ No □
Sample size/power/effect size calculation stated? Yes □ No □
Dietary intervention details:
Metric(s) chosen to measure PK endpoints: ______________________________________________
Assay validated? Yes □ No □
Difference in enzyme activity (value, % change, SD, CI, P-value):

222
8.3 National Ethics Application Form (NEAF) approval
223
8.4 Site-specific Approval (SSA) approval

224
8.5 ANZCTR registration details

225
8.6 TGA CTN approval

226
8.7 Eligibility questionnaire
Faculty of Pharmacy Pharmacy Aged Care Research Lab The University of Sydney Concord Repatriation General Hospital
Broccoli and Drug Metabolism
DATA COLLECTION SHEET
1. Patient Demographics
1.1 Patient initials: ____ 1.2 Date of Birth: ___/___/___
1.3 Study Code: ____ (Investigator) 1.4 Age: ______
1.5 Weight: ______ (kg) 1.6 Height: ______cm
2. Ethnicity - General
2.1 What is your ethnic ancestry? ________________________ (European or South Asian)
2.1.1 Where were you born? _________________________
2.2 Were all four of your biological grandparents born in the same country? □ Y □ N

227
2.2.1 Please fill out the following table with country of birth:
Grandmother Grandfather
Maternal (Mum’s side)
Paternal (Dad’s side)
2.3 How many years have you resided in Australia? ______
2.3.1 Do your parents reside in Australia? If so, for how many years? ______
2.4 Is English your first language? □ YES □ NO
2.4.1 What other languages do you speak at home? _________________________
3. Ethnicity – South Asian
3.1 If Indian Ancestry - What area of the Indian sub-continent is your family background?
□ North □ South
3.1.1 How would you define your heritage?
□ Himachal Pradesh □ Uttar Pradesh □ Punjab □ Andhra
□ Pradesh □ Tamil □ Orissa □ Rajasthan
□ Maharashtra □ Sri Lankan/Sinhalese □ Sri Lankan/Tamil

228
4. Medication/Medical History
4.1 Would you consider yourself healthy? _______________________
4.1.1 Please list any previous or ongoing health problems you have (e.g. diabetes,
high blood pressure)
_________________________________________________________________________
________________________________________________________________________
4.2 How regularly would you take over the counter medicines (such as pain relieving
medications e.g. paracetamol)?
□ Two to three times a week □ Once a week □ Once a month
□ Less than once a month
4.3 How regularly would you take complementary medicines (such as health vitamins e.g.
fish oil)?
□ Two to three times a week □ Once a week □ Once a month
□ Less than once a month
4.4 Do you take any over-the-counter, complementary, herbal (such as gingko) or ayurvedic
medicines? □ Y □ N
4.4.1 If so, please list
___________________________________________________________________________
___________________________________________________________________________
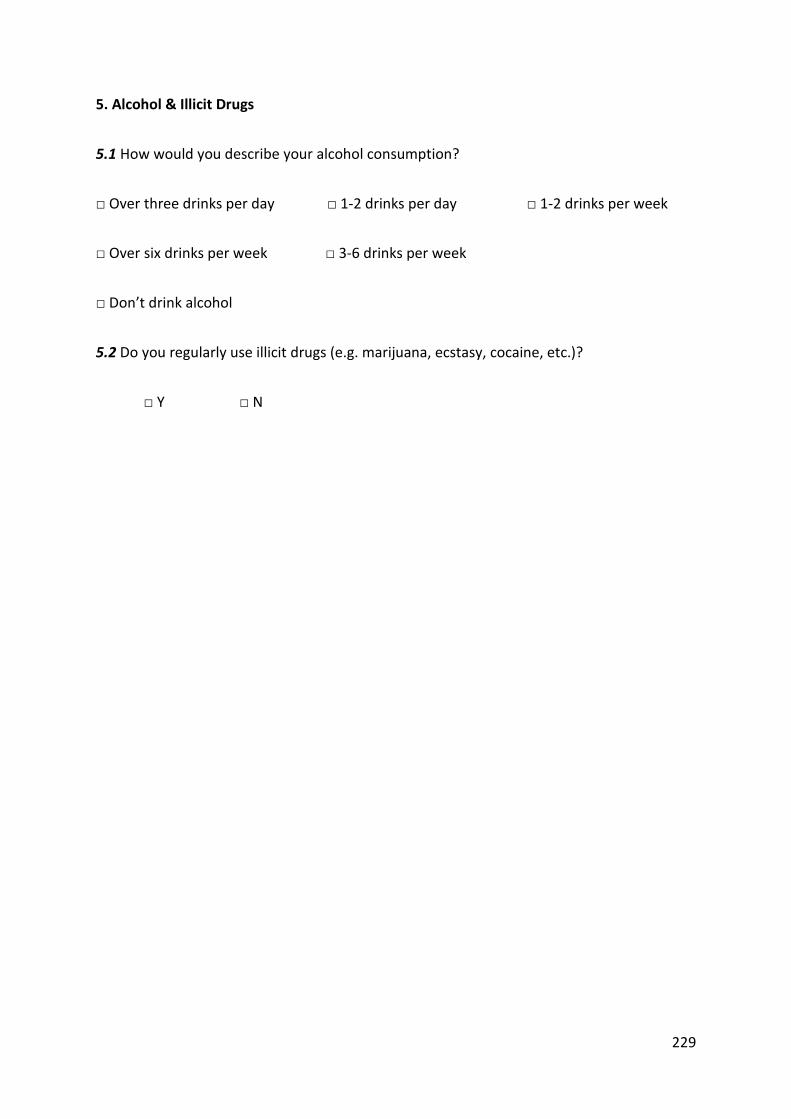
229
5. Alcohol & Illicit Drugs
5.1 How would you describe your alcohol consumption?
□ Over three drinks per day □ 1-2 drinks per day □ 1-2 drinks per week
□ Over six drinks per week □ 3-6 drinks per week
□ Don’t drink alcohol
5.2 Do you regularly use illicit drugs (e.g. marijuana, ecstasy, cocaine, etc.)?
□ Y □ N

230
8.8 Participant consent form
Consent form
Faculty of Pharmacy Pharmacy Aged Care Research Lab The University of Sydney Concord Repatriation General Hospital
RESEARCH STUDY INTO
Broccoli and Drug Metabolism
PARTICIPANT CONSENT FORM
I, .………………………………………………………………..…….……… [name] of ……………………………………………………………………………… [address] have read and understood the Information for Participants for the above-named research study and have discussed the study with the study researchers.
• I have been made aware of the procedures involved in the study, including any known or expected inconvenience, risk, discomfort or potential side effect and of their implications as far as they are currently known by the researchers.
• I freely choose to participate in this study and understand that I can withdraw at any time.
• I also understand that this research study is strictly confidential.
• I hereby agree to participate in this research study. Name (Please Print): ..................................................................................................................................... . Signature: ........................................................................ Date: ............................................................... Name of Person who conducted informed consent discussion (Please Print): Signature: ........................................................................ Date: ............................................................... of Person who conducted informed consent discussion

231
8.9 Participant Information Sheet (PIS)
Faculty of Pharmacy Pharmacy Aged Care Research Lab The University of Sydney Concord Repatriation General Hospital
Broccoli and drug metabolism
INFORMATION FOR PARTICIPANTS
You are invited to take part in a research study in healthy volunteers that will investigate the
impact of eating broccoli on the activity of five enzymes that ‘break down’ (metabolise)
medicines in the body.
What is this study about?
The aim of this study is to investigate the effect that eating broccoli can have on five
enzymes that metabolise medicines in the body. Previous studies suggest that materials
found in broccoli may increase or decrease the ability of the body to break down some
medicines. This study aims to understand how this can happen and what it might mean for
people taking these medicines. You are being asked to take part because you are healthy,
male, aged between 18 and 55 years and of either South Asian (based on the information
that both sets of grandparents have South Asian ancestry) or European ancestry (both sets
of grandparents have European ancestry).
The study is being conducted by Mr Shane Eagles (PhD Student), Adjunct Associate
Professor Annette Gross and Professor Andrew McLachlan from the University of Sydney
and Concord Hospital.
Who can enter this study (inclusion and exclusion criteria)?
Inclusion: Men who are of European and South Asian ancestry between the ages of 18 and
55 years who are healthy (i.e. no current short-term or long-term health problems).
Exclusion: People who are suffering from any current illness or long-term illness or are
taking prescription medication, over-the-counter medicines or herbal/complementary
medicines. People who are current cigarette smokers or ex-smokers who have quit smoking
in the last 6 months. People with a known allergy or previous reaction to any of the
following medications: caffeine, omeprazole, losartan, dextromethorphan and midazolam.
What does this study involve?
If you agree to participate in this study, you will be required to have a face-to-face interview
(approx. 20 minutes duration) with the researchers at a time and place that suits you.
In this study you will be asked to participate in four main activities:
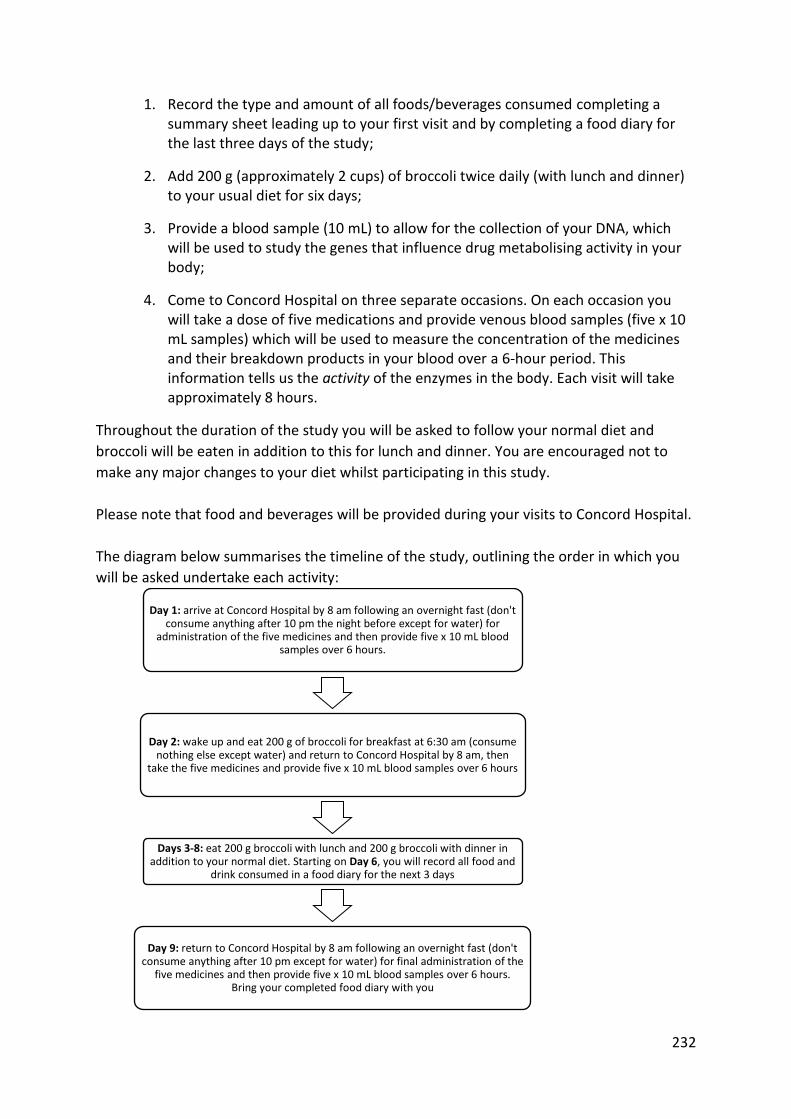
232
1. Record the type and amount of all foods/beverages consumed completing a summary sheet leading up to your first visit and by completing a food diary for the last three days of the study;
2. Add 200 g (approximately 2 cups) of broccoli twice daily (with lunch and dinner) to your usual diet for six days;
3. Provide a blood sample (10 mL) to allow for the collection of your DNA, which will be used to study the genes that influence drug metabolising activity in your body;
4. Come to Concord Hospital on three separate occasions. On each occasion you will take a dose of five medications and provide venous blood samples (five x 10 mL samples) which will be used to measure the concentration of the medicines and their breakdown products in your blood over a 6-hour period. This information tells us the activity of the enzymes in the body. Each visit will take approximately 8 hours.
Throughout the duration of the study you will be asked to follow your normal diet and
broccoli will be eaten in addition to this for lunch and dinner. You are encouraged not to
make any major changes to your diet whilst participating in this study.
Please note that food and beverages will be provided during your visits to Concord Hospital.
The diagram below summarises the timeline of the study, outlining the order in which you
will be asked undertake each activity:
Day 1: arrive at Concord Hospital by 8 am following an overnight fast (don't consume anything after 10 pm the night before except for water) for
administration of the five medicines and then provide five x 10 mL blood samples over 6 hours.
Day 2: wake up and eat 200 g of broccoli for breakfast at 6:30 am (consume nothing else except water) and return to Concord Hospital by 8 am, then
take the five medicines and provide five x 10 mL blood samples over 6 hours
Days 3-8: eat 200 g broccoli with lunch and 200 g broccoli with dinner in addition to your normal diet. Starting on Day 6, you will record all food and
drink consumed in a food diary for the next 3 days
Day 9: return to Concord Hospital by 8 am following an overnight fast (don't consume anything after 10 pm except for water) for final administration of the
five medicines and then provide five x 10 mL blood samples over 6 hours. Bring your completed food diary with you

233
Why do I have to provide a list of food and drink I consume?
In the same way that broccoli can affect drug-metabolising enzyme activity in our bodies,
most of what we eat and drink on a daily basis can have a similar effect on the way our body
responds to medicines. The food diary will assist the investigators in explaining the different
responses to eating broccoli amongst the participants, as certain foods and beverages have
been shown to directly affect the enzymes being investigated in this study.
What foods and beverages should I avoid while participating in this study?
Grapefruit and grapefruit juice are known to affect the activity of some drug-metabolising
enzymes being investigated in this study. Consuming grapefruit products during the study
may change the results and participants are required to avoid them until after the study is
complete. Also, you are required to avoid drinking any caffeinated beverages such as coffee
(all types), tea (all types), Coke/Pepsi (all types) and energy drinks (all types) after 6 pm the
night before coming to Concord on study days, and to avoid these beverages on the study
days also. You may however consume caffeinated beverages during the 6 days of broccoli
consumption.
Why will I be asked to take five medicines on three separate occasions?
Each of the five medicines used in this study are selectively broken down by one of the five
enzymes being investigated in the study. The amount of the medicines and their metabolism
by-products in your blood allows the researchers to measure the activity of the enzymes
involved. These medicines have been chosen because they are specific for the breakdown
pathway of interest, they have been proven to be safe, commonly used and have been
shown not to interact or affect each other.
The administration of the five medications and collection of blood samples needs to take
place on three separate occasions so that the effect of eating broccoli on enzyme activity
can be measured. The first occasion will be a ‘baseline’ measurement, the second occasion
will also involve you eating 200 g of broccoli just before taking the medicines (to measure
the short-term effects of eating broccoli) and the third occasion will be after six days of
broccoli consumption (to measure the medium-term effects of eating broccoli).
How safe are the medicines in this study?
These medicines have been selected because they have been widely used and much is
known about their effects on the body. All medicines have some risk of unwanted effects
but in this study the chances of experiencing these effects are low because only a single
dose is taken on each occasion. The medicines and their possible effects are summarized in
the table below.

234
Medicine Usual use in
humans Usual dose
range
Dose used in
this study
Possible side effects (occur in between 1%
to 10% of people)
Caffeine
Stimulant present in beverages (e.g. tea, coffee, energy drinks)
Varies greatly—as a guide, an average cup of coffee contains 80-150 mg of caffeine
100 mg
Stomach upset, sleeplessness, restlessness, nervousness, shakes, headache and lightheadedness
Omeprazole
Treatment of ‘heartburn’ or acid reflux from the stomach
10-40 mg per day
20 mg
Stomach upset, headache, dizziness, mild tingling or ‘pins-&-needles’ in arms/legs, mild skin rash
Losartan
Treatment of high blood pressure (hypertension)
50-100 mg per day
25 mg
Dizziness, muscle cramps, leg pain, nasal congestion
Dextromethorphan
Over-the-counter cough suppressant (e.g. Bisolvon, Benadryl)
30–120 mg per day
30 mg
Diarrhoea, sedation
Midazolam
Sedative usually used in the hospital setting during short surgical procedures
1-3.5 mg as a single dose
2 mg oral
liquid which
you will drink
Drowsiness, altered alertness, slowed breathing rate, short-term changes in blood pressure and heart rate, headache
What is involved with providing blood samples?
To measure the amount of the medicines and their by-products in your blood we will need
you to provide blood samples. This will take place at Concord Hospital following an
overnight fast (no food/drink besides water after 10 pm the night before) immediately
before and over the six hours after you take the five medicines (at 0, 1, 2, 4 and 6 hours
post-dose for a total of five samples taken on each occasion). 2 hours after the medicines
are administered you will be provided with a muffin and water to break your fast, and a
light lunch (sandwich/roll) will be provided later in the day. Samples will be taken via an
intravenous cannula, which is a small tube that is inserted inside the vein or intravenous
needle by trained nursing and/or pathology staff under the supervision of a medical doctor.
The same research team will be with you at all times over this six-hour period and will
answer and address any concerns you have whilst providing the blood samples.
235
Two of the medicines, midazolam and dextromethorphan, can cause mild sedation and
drowsiness so driving is not recommended to and from the hospital on the days you take
these medicines. We suggest that a friend/family member drop you off and pick you up. If
this is not possible then a taxi can be provided to take you to and from the hospital. While
under the sedative effects of midazolam you are advised to avoid operating machinery and
catching public transport.
How will my blood samples be used?
Blood samples will only be used to measure the amounts of the five medicines and their
respective by-products to determine the activity of the enzymes that they are involved
with.
A sample of your blood (approximately 10 mL) will be collected for DNA testing. Everyone’s
DNA is different to some degree. The purpose of this testing is to investigate the genes that
control the ability of your body to breakdown the medicines in this study.
How will my DNA sample be used?
Your DNA sample will ONLY be used to analyse the genes that can influence the activity of
the drug-metabolising enzymes of interest in this study. Certain variations in these genes
can influence the activity of the drug-metabolising enzymes. The researchers will be
attempting to match any increases/decreases in enzyme activity with the presence of these
particular gene variants. Your DNA sample will NOT be used for any other purpose.
How do I store and eat the broccoli?
After your second visit to Concord Hospital (after the second occasion of taking the five
medicines and providing blood samples) the investigators will provide you with sealed, pre-
weighed “snap-lock” labeled bags containing 200 g (approximately 2 cups) of broccoli. You
will be given 13 bags—enough to eat 200 g at lunch and 200 g at dinner for the next six days
and one bag for breakfast on Day 2 of the study. These bags need to be kept in a refrigerator
until use. If you are taking the broccoli to work with you only take the relevant portion
needed for that day and ensure it is kept refrigerated until use; use a cooler bag with an ice
pack when travelling.
All participants are required to microwave one 200 g bag of broccoli in the microwave-safe
container provided. Add a small amount of water underneath the white steaming tray, but
ensure the water level stays below the tray, as nutrients can leak from the broccoli if it is
touching water. Microwave for a time based on your microwave’s power settings (see table
below). Take care in removing the broccoli from the microwave and when eating as the
contents of the container may be hot. Proceed to eat the ENTIRE contents. All broccoli must
be consumed. The broccoli is to be eaten in addition to your normal diet (continue
eating/drinking what you normally would).
Broccoli is a rich source of dietary fibre, and a sudden increase of fibre in your diet can slow
down the movement of material through your gastrointestinal tract and in some cases

236
cause constipation. You are advised to drink plenty of water for the duration of the study to
reduce the chance of this occurring.
Table 8.1: Recommended cooking times based on microwave wattages.
Microwave power (watts) Recommended cooking time (seconds)
700 150 (2 min 30 s)
800 135 (2 min 15 s)
900 130 (2 min 10 s)
1000
1200
120 (2 min)
110 (1 min 50 s)
Healthy volunteer statement
People often volunteer to take part in medical research because they have a medical
condition and the research may offer a chance of improving their health. Your role in this
study is different. You are a healthy volunteer. As such, you need to carefully consider the
risks associated with the research before you consent to take part. There is no expected
benefit to your health from participation in this study.
Will I be reimbursed for my time?
You will be compensated for your time and inconvenience with a $500 payment on the
provision that the study is completed in full.
What are the risks associated with this study?
Possible side effects that can arise from taking the five medications used in this study are
listed above in this information sheet. None of these are considered serious or life-
threatening and will pass after the medicines are cleared from your body. While at Concord
Hospital for the administration of these medicines/to provide blood samples, you will be
monitored by the researchers and will be cared for should anything unexpected occur.
Risks associated with intravenous blood sampling are usually limited to mild redness,
swelling, and/or bruising around the site where the needle breaks the skin. Infection of the
puncture site and/or associated veins is possible but is an extremely unlikely complication
associated with this procedure. All blood samples will be taken under standard hospital
conditions according to NSW Health guidelines to ensure your safety in this regard.
There are no known risks associated with eating 400 g of broccoli daily for six days, however
this dietary intake of broccoli may cause flatulence and constipation in some people.
What are the benefits of this study?
While we intend that this research study furthers medical knowledge, it may not be of direct
benefit to you.

237
Who owns my samples?
By signing the attached consent form, you relinquish all rights to ownership of your samples.
Can I obtain the results of tests on my sample?
The results of any tests done on your sample will not be made known to you, your family
members or any other person. The results of these tests will not affect any present or future
insurance policies, or your ability to get or keep a job.
Can I withdraw from the study?
Participation in this study is entirely voluntary. You are in no way obliged to participate and -
if you do participate - you can withdraw at any time. Whatever your decision, please be
assured that it will not affect your relationship with medical or research staff.
Confidentiality
All details obtained from participants will remain confidential. A report of this study may be
submitted for publication, but individual participants will not be identifiable in such a report.
Compensation
Every reasonable precaution will be taken to ensure your safety during the course of the
study. In the event that you suffer any injury as a result of participating in this research
project, hospital care and treatment will be provided at no extra cost to you.
Further Information
When you have read this information, Mr Shane Eagles will discuss it with you further and
answer any questions you may have. If you would like to know more at any stage, please
feel free to contact Professor Andrew McLachlan, on 9767 7373 or Mr Shane Eagles from
the University of Sydney on 0431 635 958. This information sheet is for you to keep.
This study has been approved by the Human Research Ethics Committee - CRGH of the Sydney Local Health District. If you have any concerns or complaints about the conduct of the research study, you may contact the Secretary of the Concord Hospital Human Research Ethics Committee, on (02) 9767 5622. Alternatively, if you wish to speak with an independent person within the Hospital about any problems or queries about the way in which the study was conducted, you may contact the Patient Representative on (02) 9767 7488.

238
8.10 Approved clinical study advertisement
Faculty of Pharmacy Pharmacy Aged Care Research Lab The University of Sydney Concord Repatriation General Hospital
AN INVITATION TO PARTICIPATE
Are you interested in taking part in a clinical study
investigating the effect of broccoli on drug
metabolism?
We are looking for healthy MALE volunteers aged between
18 to 55 years of European or South Asian geographic
ancestry (ethnicity or origin):
• European Ancestry (all countries of Europe including the UK and Ireland)
• South Asian Ancestry (India, Pakistan and Sri Lanka)
If you are interested please contact either:
(Eligible participants will be reimbursed for their time on
completion of the study)
A project conducted by researchers at the Faculty of Pharmacy, University of
Sydney in collaboration with Concord Repatriation General Hospital
Mr Shane Eagles [email protected]
(phone 0431 635 958)
Professor Andrew McLachlan [email protected]
(phone 9767 7373)
239
8.11 First participant 3-day food diary
Faculty of Pharmacy Pharmacy Aged Care Research Lab The University of Sydney Concord Repatriation General Hospital
Broccoli and Drug Metabolism
3-day diet summary sheet
Over the next three days, please fill out the following diet summary sheet.
To the best of your ability, accurately record what you eat/drink for breakfast, lunch and
dinner for the three days leading up to your first Concord visit.
Write the name/type of the food or drink on the lines provided along with the
amount/quantity consumed. If you are unsure of the amount in grams or mL/L, try to
estimate or describe the amount, e.g. one can of… one tin of… 6 slices of… and so on. Please
describe the items in as much detail as possible. For example, instead of “ham sandwich”
write “ham, lettuce, tomato and cheese sandwich with butter (white bread)”.
The researchers need this information to identify other items in your everyday diet that may
affect the study’s results in a similar way to the broccoli.

240
Breakfast Day 1
Breakfast Day 2
Breakfast Day 3
Lunch Day 1
Lunch Day 2 Lunch Day 3
Dinner Day 1
Dinner Day 2 Dinner Day 3
Snacks & Drinks
Snacks & Drinks Snacks & Drinks

241
8.12 Second 3-day food diary (D6-D8)
Faculty of Pharmacy Pharmacy Aged Care Research Lab The University of Sydney Concord Repatriation General Hospital
Broccoli and Drug Metabolism
FOOD DIARY
Participant instructions:
From days 6-8 of the study you will be required to accurately record of all of the food and
drinks you consume in this diary. The researchers need this information to identify other
items in your everyday diet that may affect the study’s results in a similar way to the
broccoli.
Write the name/type of the food or drink on the lines provided along with the
amount/quantity consumed. If you are unsure of the amount in grams or mL/L, try to
estimate or describe the amount, e.g. one can of… one tin of… 6 slices of… and so on. Please
describe the items in as much detail as possible. For example, instead of “ham sandwich”
write “ham, lettuce, tomato and cheese sandwich with butter (white bread)”.
Each page is divided into easy to manage sections based around the three main meals of the
day: breakfast, lunch and dinner.
It is recommended that you record an entry in the diary IMMEDIATELY AFTER eating or
drinking something to maximise the accuracy of the entries.
There is a section for snacks in between each meal of the day—all food and drinks, no
matter how small a serving should be recorded.
There is also a broccoli check-box to help you to remember if you have eaten your broccoli
portions. Please initial these sections as you microwave and eat each 200 g serving.
242
Breakfast Day 6
Breakfast Day 7
Breakfast Day 8
Lunch Day 6
Broccoli eaten? Y N
Lunch Day 7 Broccoli eaten? Y N
Lunch Day 8 Broccoli eaten? Y N
Dinner Day 6
Broccoli eaten? Y N
Dinner Day 7 Broccoli eaten? Y N
Dinner Day 8 Broccoli eaten? Y N
Snacks & Drinks
Snacks & Drinks Snacks & Drinks

243
8.13 Study day medical support protocol Responsibilities of medical staff in preparation for study days:
- Write a clinical trials prescription for all participants
- Arrange for the on-call clinician to be available to come to Andrology and assess any
participants presenting with mild ADRs/medical complaints
Responsibilities of medical staff on the day:
- Insert/withdraw cannula
- Check on any participants presenting with mild ADRs/medical complaints
Responsibilities of researchers on the day:
- Welcome participants and assess eligibility to participate on the day (i.e. not recently
unwell, not currently unwell, successfully fasted since 10 pm the night before,
baseline BP > 80/60 mmHg)
- Drawing blood via cannula/handing of samples
- Recording onto the data recording sheet
- Monitoring clinical signs/symptoms of hypotension and sedation every hour
- Monitoring clinical signs/symptoms of ADRs
- Ensuring participants receive morning snack and lunch
- Escorting participants to their means of transportation
IF
Mild drop in BP/HR accompanied by clinical signs of an ADR (light headedness, dizziness,
sweaty/clammy/pale complexion) and/or increase in sedation score
THEN
Contact on-call clinician to assess participant in Andrology
IF
Moderate to severe as above or presents with nausea/vomiting
THEN
Arrange for participant to go to ED

244
IF
Severe ADR/medical emergency (anaphylaxis, extreme sedation, extremely low BP/HR)
THEN
Call 222 and report Code Blue
Assessing sedation:
Use the Sedation Score for opioid use as per the Australian Medicines Handbook (AMH)
2013, page 46.
Sedation score:
0 – wide awake
1 – easy to rouse
2 – easy to rouse, but cannot stay awake
3 – difficult to rouse.
Aim to keep the sedation score < 2; a score of 2 represents early respiratory depression.
If any participant persistently has a sedation score of 2 or more the on-call clinician will be
contacted to assess the participant in Andrology.
Assessing BP:
As there is no universal ‘cut-off’ value for determining when clinical hypotension is present,
this will be assessed primarily by the presence of the clinical signs of hypotension: dizziness,
light headedness, sweating/clammy with pale pallor and in extreme circumstances fainting.
A drop in systolic BP of >30 will be used as a guide however the clinical signs will determine
the course of action taken.
BP drop > 30 and/or participant complains of dizziness, light headedness or presents as
clammy, pale, etc. then contact the on-call clinician to assess the participant in Andrology.
Assessing HR:
A HR persistently below 50 bpm will be considered as a warning sign of bradycardia (BMJ
Best Practice Guidelines – Bradycardia). Clinical signs of bradycardia such as dizziness/light
headedness fainting or shortness of breath accompanied with a HR close to or below 50 will
be considered criteria to contact the on-call clinician to assess the participant in Andrology.
Assessing a medical emergency:
If signs of anaphylaxis (shortness of breath, hives/acute rash, etc.) or extreme medical
dysfunction/distress are observed in a participant, the researchers will transport the
participant to the ED. If immediate assistance is required 222 will be called to report a Code
Blue emergency.

245
8.14 Participant broccoli hand-out Broccoli handling/cooking instructions
Each bag contains 200 g of washed and prepared broccoli. You must eat one WHOLE bag
with lunch and dinner for 6 days as directed. ALL broccoli must be consumed. If you are full
try spreading the two bags out over the whole day rather than with lunch and dinner.
Broccoli must be kept at 4-6˚C at ALL times unless microwave cooking. If taking it to
work/school/university etc., use the eski and cooler brick provided as a means of
transporting the broccoli.
If, for some reason, a portion of the broccoli is not consumed, record this in as much detail
as possible (e.g. how much eaten, amount lost or forgotten, etc.) in the second food diary at
the bottom.
Please note: we will be analysing your blood samples for broccoli constituent levels, and
will be able to determine if broccoli is not being eaten. If the investigators have sufficient
reason to believe the broccoli has not been consumed as agreed to, the participant will be
deemed to have not completed the study in full – thus not receive payment for their
participation.
Microwaving the broccoli
1. Ensure the white tray is in the bottom of the container, and add a small amount of
tap water up to just below the line of the tray – ensure the broccoli is not touching
the water
2. Secure the lid tightly and close the steam hole, then microwave at the specified time
as per the wattage of your microwave as below:
Microwave power (watts) Recommended cooking time (seconds)
700 150 (2 min 30 s)
800 135 (2 min 15 s)
900 130 (2 min 10 s)
1000
1200
120 (2 min)
110 (1 min 50 s)
3. The broccoli will be hot so be careful in removing it from the container.
4. Eat the broccoli – if it is really unpalatable you may add a small amount (< 10 mL) of
salad dressing to add flavour

246
8.15 DNA purification and extraction Pages 17-19 of “Genomic DNA from blood: User manual” (Macherey-Nagel, Dec. 2015/Rev. 15). Provided by Trent Peters courtesy of the Australian Genome Research Facility Ltd Genomic DNA purification with NucleoSpin® Blood L Before starting the preparation:
• Check if Buffer BQ2 and Proteinase K were prepared according to section 3. • Set an incubator or water bath to 56 °C. • Preheat Elution Buffer BE to 70 °C. • For centrifugation, a centrifuge with a swing-out rotor and appropriate buckets
• capable of reaching 4,000–4,500 x g is required.
1. Lyse blood sample Pipette up to 2 mL blood (or body fluid) sample (equilibrated to room temperature) and 150 μL Proteinase K into a 15-mL tube (not provided). If processing buffy coat, do not use more than 1 mL and add PBS to adjust the volume to 2 mL. If cultured cells are used, resuspend up to 2 x 10⁷ cells in a final volume of 2 mL PBS. If old or clotted blood samples are processed, see section 6.1 for recommendations. Add 2 mL Buffer BQ1 (if processing less than 2 mL blood, add one volume of Buffer BQ1) to the samples and vortex the mixture vigorously for 10 s. Note: Vigorous mixing is important to obtain high yield and purity of DNA. Incubate samples at 56 °C for 15 min. Let the samples cool down to room temperature before proceeding with addition of ethanol. The lysate should become brownish during incubation with Buffer BQ1. Increase incubation time with Proteinase K (up to 20 min) and vortex once or twice during incubation if processing older or clotted blood samples.
2. Adjust DNA binding conditions Add 2 mL ethanol (96–100 %) (if processing less than 2 mL blood, add 1 volume of ethanol) to each sample and mix by inverting the tube 10 times. Note: High local ethanol concentration must be avoided by immediate mixing after addition. Be sure that the lysate has cooled down to room temperature before loading it onto the column. Loading of hot lysate may lead to diminished yields.
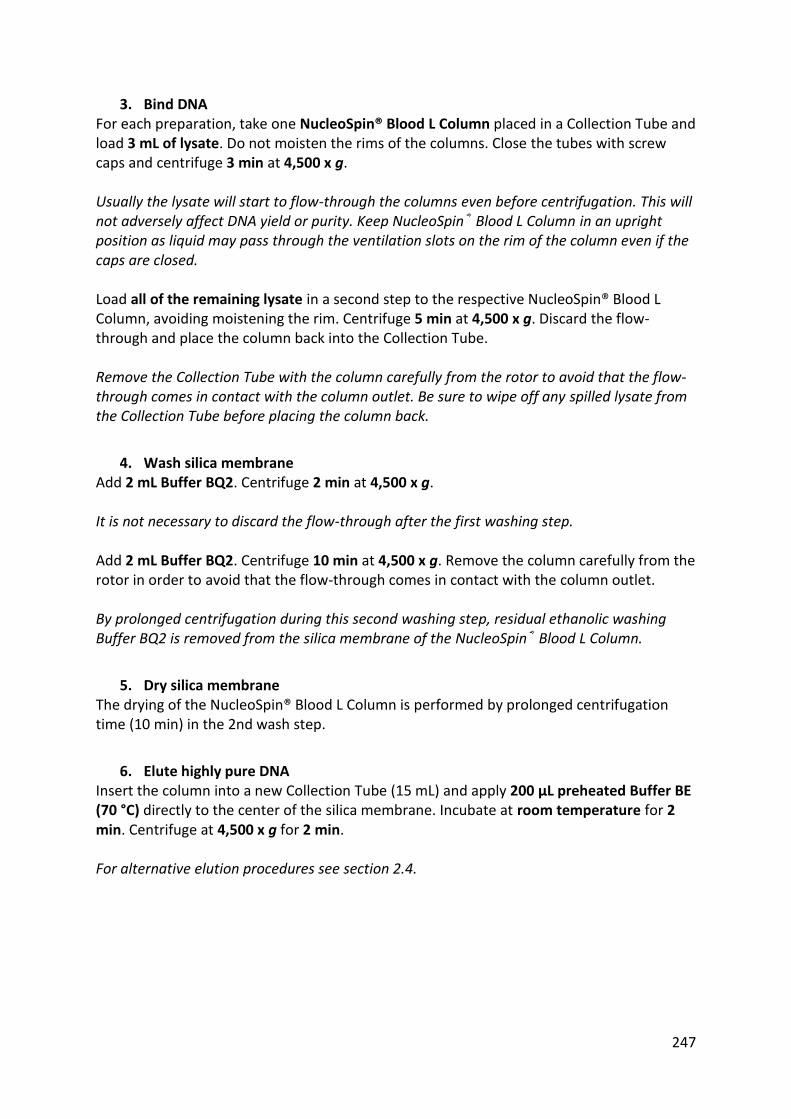
247
3. Bind DNA For each preparation, take one NucleoSpin® Blood L Column placed in a Collection Tube and load 3 mL of lysate. Do not moisten the rims of the columns. Close the tubes with screw caps and centrifuge 3 min at 4,500 x g. Usually the lysate will start to flow-through the columns even before centrifugation. This will not adversely affect DNA yield or purity. Keep NucleoSpin® Blood L Column in an upright position as liquid may pass through the ventilation slots on the rim of the column even if the caps are closed. Load all of the remaining lysate in a second step to the respective NucleoSpin® Blood L Column, avoiding moistening the rim. Centrifuge 5 min at 4,500 x g. Discard the flow-through and place the column back into the Collection Tube. Remove the Collection Tube with the column carefully from the rotor to avoid that the flow-through comes in contact with the column outlet. Be sure to wipe off any spilled lysate from the Collection Tube before placing the column back.
4. Wash silica membrane Add 2 mL Buffer BQ2. Centrifuge 2 min at 4,500 x g. It is not necessary to discard the flow-through after the first washing step. 2nd wash Add 2 mL Buffer BQ2. Centrifuge 10 min at 4,500 x g. Remove the column carefully from the rotor in order to avoid that the flow-through comes in contact with the column outlet. By prolonged centrifugation during this second washing step, residual ethanolic washing Buffer BQ2 is removed from the silica membrane of the NucleoSpin® Blood L Column.
5. Dry silica membrane The drying of the NucleoSpin® Blood L Column is performed by prolonged centrifugation time (10 min) in the 2nd wash step.
6. Elute highly pure DNA Insert the column into a new Collection Tube (15 mL) and apply 200 μL preheated Buffer BE (70 °C) directly to the center of the silica membrane. Incubate at room temperature for 2 min. Centrifuge at 4,500 x g for 2 min. For alternative elution procedures see section 2.4.

248
8.16 List of ADME iPLEX gene variants
R
etrieved fro
m h
ttp://agen
abio
.com
/wp
-con
ten
t/up
load
s/20
15
/05
/51
-20
03
7R
2.0
-iPLEX
-AD
ME-P
Gx-P
ro-P
anel-Flyer_W
EB.p
df o
n 2
9/01
/18
.

249
8.17 SPSS mixed-effects model syntaxes
CYP1A2
MIXED LnCYP1A2 BY Day Ethnicity rs2069514a rs762551a
/CRITERIA=CIN(90) MXITER(150) MXSTEP(10000) SCORING(1)
SINGULAR(0.000000000001) HCONVERGE(0,
ABSOLUTE) LCONVERGE(0, ABSOLUTE) PCONVERGE(0.000001, ABSOLUTE)
/FIXED=Day Ethnicity rs2069514a rs762551a Day*Ethnicity
Ethnicity*rs2069514a Ethnicity*rs762551a |
SSTYPE(3)
/METHOD=ML
/PRINT=SOLUTION
/RANDOM=INTERCEPT | SUBJECT(ID) COVTYPE(ID)
/REPEATED=Day | SUBJECT(ID) COVTYPE(CSR)
/EMMEANS=TABLES(Day) COMPARE ADJ(LSD)
/EMMEANS=TABLES(Ethnicity) COMPARE ADJ(LSD)
/EMMEANS=TABLES(rs2069514a) COMPARE ADJ(LSD)
/EMMEANS=TABLES(rs762551a) COMPARE ADJ(LSD)
/EMMEANS=TABLES(Day*Ethnicity) COMPARE(Day) ADJ(LSD)
/EMMEANS=TABLES(Day*Ethnicity) COMPARE(Ethnicity) ADJ(LSD)
/EMMEANS=TABLES(Ethnicity*rs2069514a) COMPARE(Ethnicity) ADJ(LSD)
/EMMEANS=TABLES(Ethnicity*rs2069514a) COMPARE(rs2069514a) ADJ(LSD)
/EMMEANS=TABLES(Ethnicity*rs762551a) COMPARE(Ethnicity) ADJ(LSD)
/EMMEANS=TABLES(Ethnicity*rs762551a) COMPARE(rs762551a) ADJ(LSD).
CYP2C19
MIXED LnCYP2C191 BY Day Ethnicity rs12248560a rs3758581a rs4244285a
/CRITERIA=CIN(90) MXITER(150) MXSTEP(10000) SCORING(1)
SINGULAR(0.000000000001) HCONVERGE(0,
ABSOLUTE) LCONVERGE(0, ABSOLUTE) PCONVERGE(0.000001, ABSOLUTE)
/FIXED=Day Ethnicity rs12248560a rs3758581a rs4244285a Day*Ethnicity
Ethnicity*rs12248560a Ethnicity*rs3758581a Ethnicity*rs4244285a |
SSTYPE(3)
/METHOD=ML
/PRINT=SOLUTION
/RANDOM=INTERCEPT | SUBJECT(ID) COVTYPE(ID)
/REPEATED=Day | SUBJECT(ID) COVTYPE(CSR)
/EMMEANS=TABLES(Day) COMPARE ADJ(LSD)
/EMMEANS=TABLES(Ethnicity) COMPARE ADJ(LSD)
/EMMEANS=TABLES(rs12248560a) COMPARE ADJ(LSD)
/EMMEANS=TABLES(rs3758581a) COMPARE ADJ(LSD)
/EMMEANS=TABLES(rs4244285a) COMPARE ADJ(LSD)
/EMMEANS=TABLES(Day*Ethnicity) COMPARE(Day) ADJ(LSD)
/EMMEANS=TABLES(Day*Ethnicity) COMPARE(Ethnicity) ADJ(LSD)
/EMMEANS=TABLES(Ethnicity*rs12248560a) COMPARE(Ethnicity) ADJ(LSD)
/EMMEANS=TABLES(Ethnicity*rs12248560a) COMPARE(rs12248560a) ADJ(LSD)
/EMMEANS=TABLES(Ethnicity*rs3758581a) COMPARE(Ethnicity) ADJ(LSD)
/EMMEANS=TABLES(Ethnicity*rs3758581a) COMPARE(rs3758581a) ADJ(LSD)
/EMMEANS=TABLES(Ethnicity*rs4244285a) COMPARE(Ethnicity) ADJ(LSD)
/EMMEANS=TABLES(Ethnicity*rs4244285a) COMPARE(rs4244285a) ADJ(LSD).
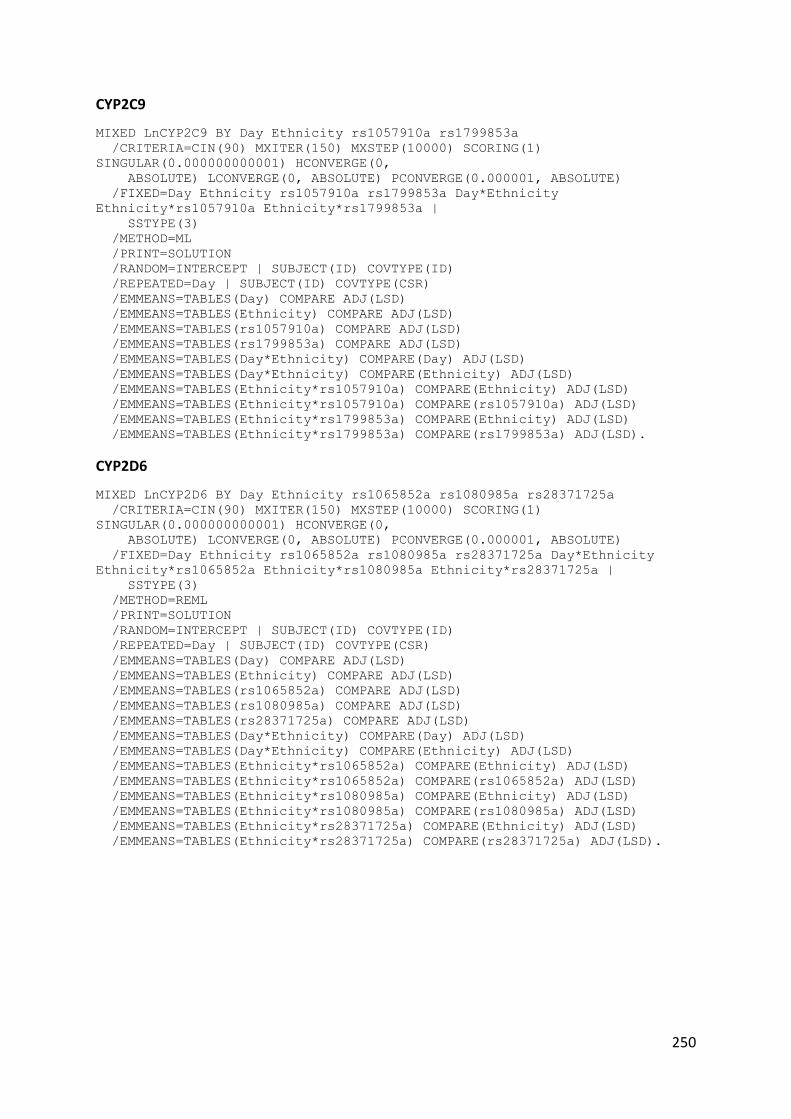
250
CYP2C9
MIXED LnCYP2C9 BY Day Ethnicity rs1057910a rs1799853a
/CRITERIA=CIN(90) MXITER(150) MXSTEP(10000) SCORING(1)
SINGULAR(0.000000000001) HCONVERGE(0,
ABSOLUTE) LCONVERGE(0, ABSOLUTE) PCONVERGE(0.000001, ABSOLUTE)
/FIXED=Day Ethnicity rs1057910a rs1799853a Day*Ethnicity
Ethnicity*rs1057910a Ethnicity*rs1799853a |
SSTYPE(3)
/METHOD=ML
/PRINT=SOLUTION
/RANDOM=INTERCEPT | SUBJECT(ID) COVTYPE(ID)
/REPEATED=Day | SUBJECT(ID) COVTYPE(CSR)
/EMMEANS=TABLES(Day) COMPARE ADJ(LSD)
/EMMEANS=TABLES(Ethnicity) COMPARE ADJ(LSD)
/EMMEANS=TABLES(rs1057910a) COMPARE ADJ(LSD)
/EMMEANS=TABLES(rs1799853a) COMPARE ADJ(LSD)
/EMMEANS=TABLES(Day*Ethnicity) COMPARE(Day) ADJ(LSD)
/EMMEANS=TABLES(Day*Ethnicity) COMPARE(Ethnicity) ADJ(LSD)
/EMMEANS=TABLES(Ethnicity*rs1057910a) COMPARE(Ethnicity) ADJ(LSD)
/EMMEANS=TABLES(Ethnicity*rs1057910a) COMPARE(rs1057910a) ADJ(LSD)
/EMMEANS=TABLES(Ethnicity*rs1799853a) COMPARE(Ethnicity) ADJ(LSD)
/EMMEANS=TABLES(Ethnicity*rs1799853a) COMPARE(rs1799853a) ADJ(LSD).
CYP2D6
MIXED LnCYP2D6 BY Day Ethnicity rs1065852a rs1080985a rs28371725a
/CRITERIA=CIN(90) MXITER(150) MXSTEP(10000) SCORING(1)
SINGULAR(0.000000000001) HCONVERGE(0,
ABSOLUTE) LCONVERGE(0, ABSOLUTE) PCONVERGE(0.000001, ABSOLUTE)
/FIXED=Day Ethnicity rs1065852a rs1080985a rs28371725a Day*Ethnicity
Ethnicity*rs1065852a Ethnicity*rs1080985a Ethnicity*rs28371725a |
SSTYPE(3)
/METHOD=REML
/PRINT=SOLUTION
/RANDOM=INTERCEPT | SUBJECT(ID) COVTYPE(ID)
/REPEATED=Day | SUBJECT(ID) COVTYPE(CSR)
/EMMEANS=TABLES(Day) COMPARE ADJ(LSD)
/EMMEANS=TABLES(Ethnicity) COMPARE ADJ(LSD)
/EMMEANS=TABLES(rs1065852a) COMPARE ADJ(LSD)
/EMMEANS=TABLES(rs1080985a) COMPARE ADJ(LSD)
/EMMEANS=TABLES(rs28371725a) COMPARE ADJ(LSD)
/EMMEANS=TABLES(Day*Ethnicity) COMPARE(Day) ADJ(LSD)
/EMMEANS=TABLES(Day*Ethnicity) COMPARE(Ethnicity) ADJ(LSD)
/EMMEANS=TABLES(Ethnicity*rs1065852a) COMPARE(Ethnicity) ADJ(LSD)
/EMMEANS=TABLES(Ethnicity*rs1065852a) COMPARE(rs1065852a) ADJ(LSD)
/EMMEANS=TABLES(Ethnicity*rs1080985a) COMPARE(Ethnicity) ADJ(LSD)
/EMMEANS=TABLES(Ethnicity*rs1080985a) COMPARE(rs1080985a) ADJ(LSD)
/EMMEANS=TABLES(Ethnicity*rs28371725a) COMPARE(Ethnicity) ADJ(LSD)
/EMMEANS=TABLES(Ethnicity*rs28371725a) COMPARE(rs28371725a) ADJ(LSD).

251
MIXED LnCYP2D6 BY Day Ethnicity rs3892097a
/CRITERIA=CIN(90) MXITER(150) MXSTEP(10000) SCORING(1)
SINGULAR(0.000000000001) HCONVERGE(0,
ABSOLUTE) LCONVERGE(0, ABSOLUTE) PCONVERGE(0.000001, ABSOLUTE)
/FIXED=Day Ethnicity rs3892097a Day*Ethnicity Ethnicity*rs3892097a|
SSTYPE(3)
/METHOD=REML
/PRINT=SOLUTION
/RANDOM=INTERCEPT | SUBJECT(ID) COVTYPE(ID)
/REPEATED=Day | SUBJECT(ID) COVTYPE(CSR)
/EMMEANS=TABLES(Day) COMPARE ADJ(LSD)
/EMMEANS=TABLES(Ethnicity) COMPARE ADJ(LSD)
/EMMEANS=TABLES(rs3892097a) COMPARE ADJ(LSD)
/EMMEANS=TABLES(Day*Ethnicity) COMPARE(Day) ADJ(LSD)
/EMMEANS=TABLES(Day*Ethnicity) COMPARE(Ethnicity) ADJ(LSD)
/EMMEANS=TABLES(Ethnicity*rs3892097a) COMPARE(Ethnicity) ADJ(LSD)
/EMMEANS=TABLES(Ethnicity*rs3892097a) COMPARE(rs3892097a) ADJ(LSD).
MIXED LnCYP2D6 BY Day Ethnicity CYP2D6copies
/CRITERIA=CIN(90) MXITER(150) MXSTEP(10000) SCORING(1)
SINGULAR(0.000000000001) HCONVERGE(0,
ABSOLUTE) LCONVERGE(0, ABSOLUTE) PCONVERGE(0.000001, ABSOLUTE)
/FIXED=Day Ethnicity CYP2D6copies Day*Ethnicity Ethnicity*CYP2D6copies|
SSTYPE(3)
/METHOD=REML
/PRINT=SOLUTION
/RANDOM=INTERCEPT | SUBJECT(ID) COVTYPE(ID)
/REPEATED=Day | SUBJECT(ID) COVTYPE(CSR)
/EMMEANS=TABLES(Day) COMPARE ADJ(LSD)
/EMMEANS=TABLES(Ethnicity) COMPARE ADJ(LSD)
/EMMEANS=TABLES(CYP2D6copies) COMPARE ADJ(LSD)
/EMMEANS=TABLES(Day*Ethnicity) COMPARE(Day) ADJ(LSD)
/EMMEANS=TABLES(Day*Ethnicity) COMPARE(Ethnicity) ADJ(LSD)
/EMMEANS=TABLES(Ethnicity*CYP2D6copies) COMPARE(Ethnicity) ADJ(LSD)
/EMMEANS=TABLES(Ethnicity*CYP2D6copies) COMPARE(rs3892097a) ADJ(LSD).
CYP3A4
MIXED LnCYP3A4 BY Day Ethnicity rs35599367a
/CRITERIA=CIN(90) MXITER(150) MXSTEP(10000) SCORING(1)
SINGULAR(0.000000000001) HCONVERGE(0,
ABSOLUTE) LCONVERGE(0, ABSOLUTE) PCONVERGE(0.000001, ABSOLUTE)
/FIXED=Day Ethnicity rs35599367a Day*Ethnicity Ethnicity*rs35599367a|
SSTYPE(3)
/METHOD=REML
/PRINT=SOLUTION
/RANDOM=INTERCEPT | SUBJECT(ID) COVTYPE(ID)
/REPEATED=Day | SUBJECT(ID) COVTYPE(CSR)
/EMMEANS=TABLES(Day) COMPARE ADJ(LSD)
/EMMEANS=TABLES(Ethnicity) COMPARE ADJ(LSD)
/EMMEANS=TABLES(rs35599367a) COMPARE ADJ(LSD)
/EMMEANS=TABLES(Day*Ethnicity) COMPARE(Day) ADJ(LSD)
/EMMEANS=TABLES(Day*Ethnicity) COMPARE(Ethnicity) ADJ(LSD)
/EMMEANS=TABLES(Ethnicity*rs35599367a) COMPARE(Ethnicity) ADJ(LSD)
/EMMEANS=TABLES(Ethnicity*rs35599367a) COMPARE(rs35599367a) ADJ(LSD).

252
8.18 Dextromethorphan and dextrorphan AUC data and CYP2D6 activity by genotype

253

254

255

256

257

258
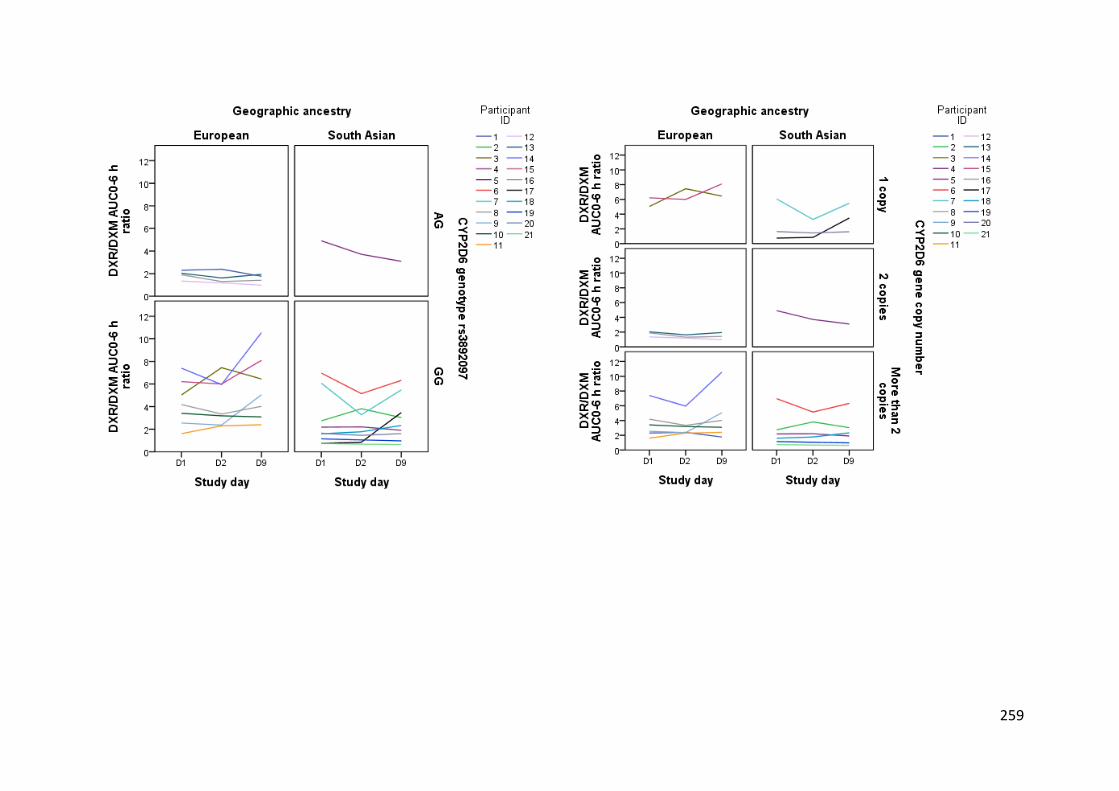
259

260
8.19 Allele frequencies by ancestry
CYP1A2 genotype CYP1A2*1C * Geographic ancestry Crosstabulation
Geographic ancestry
Total European South Asian
CYP1A2 genotype rs2069514 GA Count 0 3 3
% within CYP1A2 genotype rs2069514 0.0% 100.0% 100.0%
% within Geographic ancestry 0.0% 30.0% 15.0%
% of Total 0.0% 15.0% 15.0%
GG Count 10 7 17
% within CYP1A2 genotype rs2069514 58.8% 41.2% 100.0%
% within Geographic ancestry 100.0% 70.0% 85.0%
% of Total 50.0% 35.0% 85.0%
Total Count 10 10 20
% within CYP1A2 genotype rs2069514 50.0% 50.0% 100.0%
% within Geographic ancestry 100.0% 100.0% 100.0%
% of Total 50.0% 50.0% 100.0%
CYP1A2 genotype CYP1A2*1F * Geographic ancestry Crosstabulation
Geographic ancestry
Total European South Asian
CYP1A2 genotype rs762551 AA Count 5 4 9
% within CYP1A2 genotype rs762551 55.6% 44.4% 100.0%
% within Geographic ancestry 45.5% 40.0% 42.9%
% of Total 23.8% 19.0% 42.9%
CA Count 5 4 9
% within CYP1A2 genotype rs762551 55.6% 44.4% 100.0%
% within Geographic ancestry 45.5% 40.0% 42.9%
% of Total 23.8% 19.0% 42.9%
CC Count 1 2 3
% within CYP1A2 genotype rs762551 33.3% 66.7% 100.0%
% within Geographic ancestry 9.1% 20.0% 14.3%
% of Total 4.8% 9.5% 14.3%
Total Count 11 10 21
% within CYP1A2 genotype rs762551 52.4% 47.6% 100.0%
% within Geographic ancestry 100.0% 100.0% 100.0%
% of Total 52.4% 47.6% 100.0%

261
CYP2C19 genotype CYP2C19*1C * Geographic ancestry Crosstabulation
Geographic ancestry
Total European
South
Asian
CYP2C19 genotype
rs3758581
GA Count 2 1 3
% within CYP2C19 genotype
rs3758581 66.7% 33.3% 100.0%
% within Geographic ancestry 18.2% 10.0% 14.3%
% of Total 9.5% 4.8% 14.3%
GG Count 9 9 18
% within CYP2C19 genotype
rs3758581 50.0% 50.0% 100.0%
% within Geographic ancestry 81.8% 90.0% 85.7%
% of Total 42.9% 42.9% 85.7%
Total Count 11 10 21
% within CYP2C19 genotype
rs3758581 52.4% 47.6% 100.0%
% within Geographic ancestry 100.0% 100.0% 100.0%
% of Total 52.4% 47.6% 100.0%

262
CYP2C19 genotype CYP2C19*2 * Geographic ancestry Crosstabulation
Geographic ancestry
Total European
South
Asian
CYP2C19 genotype
rs4244285
AA Count 0 1 1
% within CYP2C19 genotype
rs4244285 0.0% 100.0% 100.0%
% within Geographic ancestry 0.0% 10.0% 4.8%
% of Total 0.0% 4.8% 4.8%
GA Count 3 5 8
% within CYP2C19 genotype
rs4244285 37.5% 62.5% 100.0%
% within Geographic ancestry 27.3% 50.0% 38.1%
% of Total 14.3% 23.8% 38.1%
GG Count 8 4 12
% within CYP2C19 genotype
rs4244285 66.7% 33.3% 100.0%
% within Geographic ancestry 72.7% 40.0% 57.1%
% of Total 38.1% 19.0% 57.1%
Total Count 11 10 21
% within CYP2C19 genotype
rs4244285 52.4% 47.6% 100.0%
% within Geographic ancestry 100.0% 100.0% 100.0%
% of Total 52.4% 47.6% 100.0%

263
CYP2C19 genotype CYP2C19*17 * Geographic ancestry Crosstabulation
Geographic ancestry
Total European
South
Asian
CYP2C19 genotype
rs12248560
CC Count 8 7 15
% within CYP2C19 genotype
rs12248560 53.3% 46.7% 100.0%
% within Geographic ancestry 72.7% 70.0% 71.4%
% of Total 38.1% 33.3% 71.4%
CT Count 2 3 5
% within CYP2C19 genotype
rs12248560 40.0% 60.0% 100.0%
% within Geographic ancestry 18.2% 30.0% 23.8%
% of Total 9.5% 14.3% 23.8%
TT Count 1 0 1
% within CYP2C19 genotype
rs12248560 100.0% 0.0% 100.0%
% within Geographic ancestry 9.1% 0.0% 4.8%
% of Total 4.8% 0.0% 4.8%
Total Count 11 10 21
% within CYP2C19 genotype
rs12248560 52.4% 47.6% 100.0%
% within Geographic ancestry 100.0% 100.0% 100.0%
% of Total 52.4% 47.6% 100.0%

264
CYP2D6 genotype CYP2D6*10 * Geographic ancestry Crosstabulation
Geographic ancestry
Total European South Asian
CYP2D6 genotype rs1065852 CC Count 7 9 16
% within CYP2D6 genotype rs1065852 43.8% 56.3% 100.0%
% within Geographic ancestry 63.6% 90.0% 76.2%
% of Total 33.3% 42.9% 76.2%
CT Count 4 1 5
% within CYP2D6 genotype rs1065852 80.0% 20.0% 100.0%
% within Geographic ancestry 36.4% 10.0% 23.8%
% of Total 19.0% 4.8% 23.8%
Total Count 11 10 21
% within CYP2D6 genotype rs1065852 52.4% 47.6% 100.0%
% within Geographic ancestry 100.0% 100.0% 100.0%
% of Total 52.4% 47.6% 100.0%
CYP2C9 genotype CYP2C9*3 * Geographic ancestry Crosstabulation
Geographic ancestry
Total European South Asian
CYP2C9 genotype rs1057910 AA Count 9 9 18
% within CYP2C9 genotype rs1057910 50.0% 50.0% 100.0%
% within Geographic ancestry 81.8% 90.0% 85.7%
% of Total 42.9% 42.9% 85.7%
CA Count 2 1 3
% within CYP2C9 genotype rs1057910 66.7% 33.3% 100.0%
% within Geographic ancestry 18.2% 10.0% 14.3%
% of Total 9.5% 4.8% 14.3%
Total Count 11 10 21
% within CYP2C9 genotype rs1057910 52.4% 47.6% 100.0%
% within Geographic ancestry 100.0% 100.0% 100.0%
% of Total 52.4% 47.6% 100.0%
CYP2C9 genotype CYP2C9*2 * Geographic ancestry Crosstabulation
Geographic ancestry
Total European South Asian
CYP2C9 genotype rs1799853 CC Count 8 10 18
% within CYP2C9 genotype rs1799853 44.4% 55.6% 100.0%
% within Geographic ancestry 72.7% 100.0% 85.7%
% of Total 38.1% 47.6% 85.7%
CT Count 3 0 3
% within CYP2C9 genotype rs1799853 100.0% 0.0% 100.0%
% within Geographic ancestry 27.3% 0.0% 14.3%
% of Total 14.3% 0.0% 14.3%
Total Count 11 10 21
% within CYP2C9 genotype rs1799853 52.4% 47.6% 100.0%
% within Geographic ancestry 100.0% 100.0% 100.0%
% of Total
52.4% 47.6% 100.0%

265
CYP2D6 genotype CYP2D6*2A * Geographic ancestry Crosstabulation
Geographic ancestry
Total European South Asian
CYP2D6 genotype rs1080985 CC Count 5 5 10
% within CYP2D6 genotype rs1080985 50.0% 50.0% 100.0%
% within Geographic ancestry 45.5% 50.0% 47.6%
% of Total 23.8% 23.8% 47.6%
GC Count 6 5 11
% within CYP2D6 genotype rs1080985 54.5% 45.5% 100.0%
% within Geographic ancestry 54.5% 50.0% 52.4%
% of Total 28.6% 23.8% 52.4%
Total Count 11 10 21
% within CYP2D6 genotype rs1080985 52.4% 47.6% 100.0%
% within Geographic ancestry 100.0% 100.0% 100.0%
% of Total 52.4% 47.6% 100.0%
CYP2D6 genotype CYP2D6*41 * Geographic ancestry Crosstabulation
Geographic ancestry
Total European
South
Asian
CYP2D6 genotype
rs28371725
AG Count 2 3 5
% within CYP2D6 genotype
rs28371725 40.0% 60.0% 100.0%
% within Geographic ancestry 18.2% 30.0% 23.8%
% of Total 9.5% 14.3% 23.8%
GG Count 9 7 16
% within CYP2D6 genotype
rs28371725 56.3% 43.8% 100.0%
% within Geographic ancestry 81.8% 70.0% 76.2%
% of Total 42.9% 33.3% 76.2%
Total Count 11 10 21
% within CYP2D6 genotype
rs28371725 52.4% 47.6% 100.0%
% within Geographic ancestry 100.0% 100.0% 100.0%
% of Total 52.4% 47.6% 100.0%

266
CYP2D6 genotype CYP2D6*4 * Geographic ancestry Crosstabulation
Geographic ancestry
Total European South Asian
CYP2D6 genotype rs3892097 AG Count 4 1 5
% within CYP2D6 genotype rs3892097 80.0% 20.0% 100.0%
% within Geographic ancestry 36.4% 10.0% 23.8%
% of Total 19.0% 4.8% 23.8%
GG Count 7 9 16
% within CYP2D6 genotype rs3892097 43.8% 56.3% 100.0%
% within Geographic ancestry 63.6% 90.0% 76.2%
% of Total 33.3% 42.9% 76.2%
Total Count 11 10 21
% within CYP2D6 genotype rs3892097 52.4% 47.6% 100.0%
% within Geographic ancestry 100.0% 100.0% 100.0%
% of Total 52.4% 47.6% 100.0%
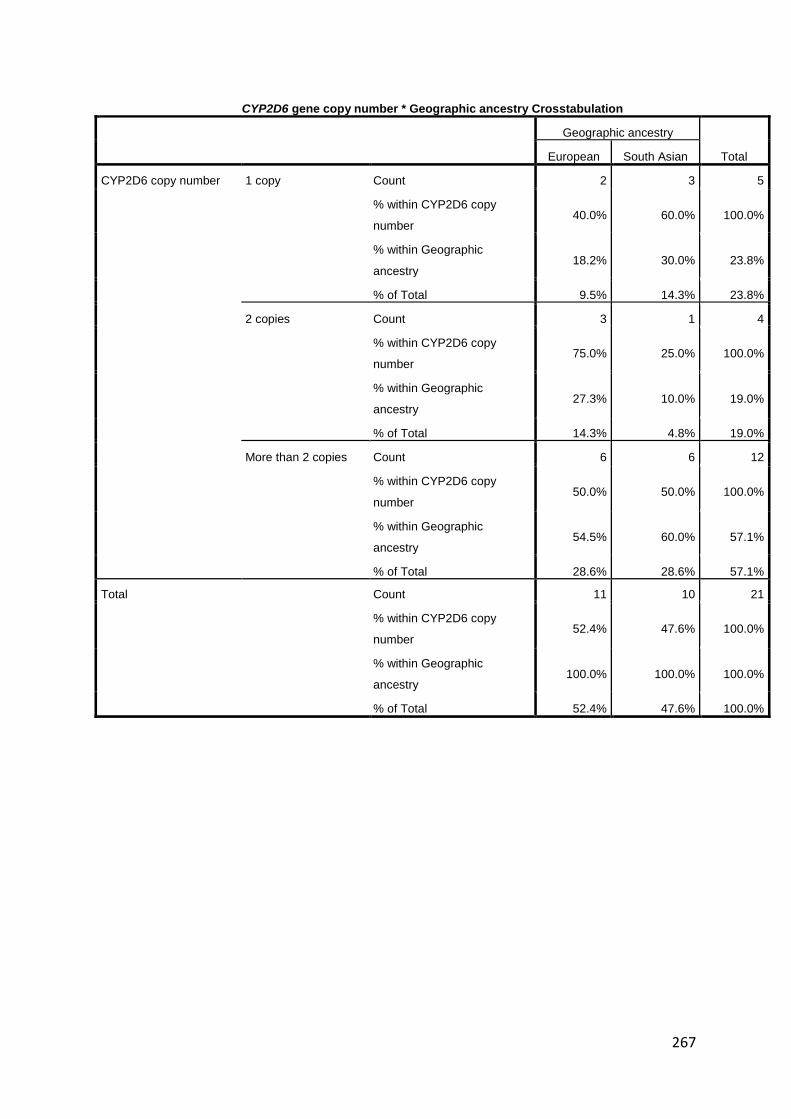
267
CYP2D6 gene copy number * Geographic ancestry Crosstabulation
Geographic ancestry
Total European South Asian
CYP2D6 copy number 1 copy Count 2 3 5
% within CYP2D6 copy
number 40.0% 60.0% 100.0%
% within Geographic
ancestry 18.2% 30.0% 23.8%
% of Total 9.5% 14.3% 23.8%
2 copies Count 3 1 4
% within CYP2D6 copy
number 75.0% 25.0% 100.0%
% within Geographic
ancestry 27.3% 10.0% 19.0%
% of Total 14.3% 4.8% 19.0%
More than 2 copies Count 6 6 12
% within CYP2D6 copy
number 50.0% 50.0% 100.0%
% within Geographic
ancestry 54.5% 60.0% 57.1%
% of Total 28.6% 28.6% 57.1%
Total Count 11 10 21
% within CYP2D6 copy
number 52.4% 47.6% 100.0%
% within Geographic
ancestry 100.0% 100.0% 100.0%
% of Total 52.4% 47.6% 100.0%

268
CYP3A4 genotype CYP3A4*22 * Geographic ancestry Crosstabulation
Geographic ancestry
Total European
South
Asian
CYP3A4 genotype
rs35599367
CC Count 10 10 20
% within CYP3A4 genotype
rs35599367 50.0% 50.0% 100.0%
% within Geographic ancestry 90.9% 100.0% 95.2%
% of Total 47.6% 47.6% 95.2%
CT Count 1 0 1
% within CYP3A4 genotype
rs35599367 100.0% 0.0% 100.0%
% within Geographic ancestry 9.1% 0.0% 4.8%
% of Total 4.8% 0.0% 4.8%
Total Count 11 10 21
% within CYP3A4 genotype
rs35599367 52.4% 47.6% 100.0%
% within Geographic ancestry 100.0% 100.0% 100.0%
% of Total 52.4% 47.6% 100.0%
GSTM1 rs1065411 * Geographic ancestry Crosstabulation
Geographic ancestry
Total European South Asian
GSTM1 rs1065411 CC Count 4 4 8
% within GSTM1 rs1065411 50.0% 50.0% 100.0%
% within Geographic ancestry 36.4% 40.0% 38.1%
% of Total 19.0% 19.0% 38.1%
CG Count 1 1 2
% within GSTM1 rs1065411 50.0% 50.0% 100.0%
% within Geographic ancestry 9.1% 10.0% 9.5%
% of Total 4.8% 4.8% 9.5%
GG Count 6 5 11
% within GSTM1 rs1065411 54.5% 45.5% 100.0%
% within Geographic ancestry 54.5% 50.0% 52.4%
% of Total 28.6% 23.8% 52.4%
Total Count 11 10 21
% within GSTM1 rs1065411 52.4% 47.6% 100.0%
% within Geographic ancestry 100.0% 100.0% 100.0%
% of Total 52.4% 47.6% 100.0%
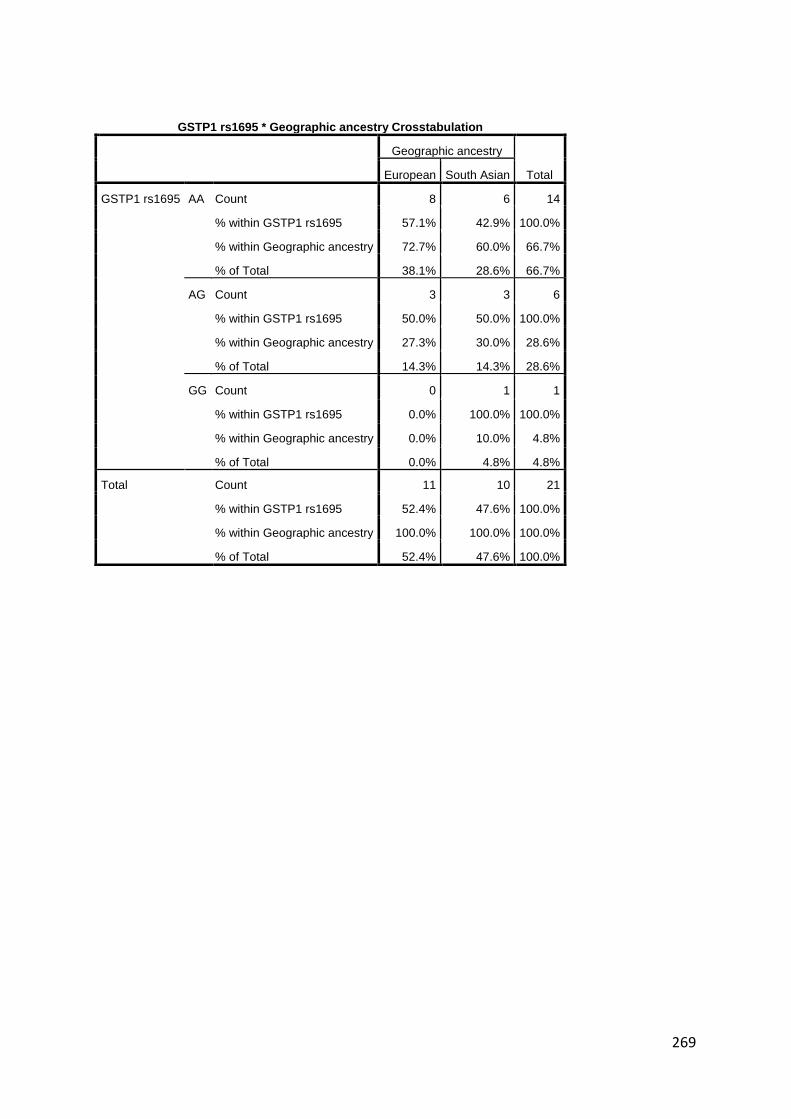
269
GSTP1 rs1695 * Geographic ancestry Crosstabulation
Geographic ancestry
Total European South Asian
GSTP1 rs1695 AA Count 8 6 14
% within GSTP1 rs1695 57.1% 42.9% 100.0%
% within Geographic ancestry 72.7% 60.0% 66.7%
% of Total 38.1% 28.6% 66.7%
AG Count 3 3 6
% within GSTP1 rs1695 50.0% 50.0% 100.0%
% within Geographic ancestry 27.3% 30.0% 28.6%
% of Total 14.3% 14.3% 28.6%
GG Count 0 1 1
% within GSTP1 rs1695 0.0% 100.0% 100.0%
% within Geographic ancestry 0.0% 10.0% 4.8%
% of Total 0.0% 4.8% 4.8%
Total Count 11 10 21
% within GSTP1 rs1695 52.4% 47.6% 100.0%
% within Geographic ancestry 100.0% 100.0% 100.0%
% of Total 52.4% 47.6% 100.0%