The Effects of Chemical Etching and Ultra-Fine Grain ...
20
metals Article The Effects of Chemical Etching and Ultra-Fine Grain Structure of Titanium on MG-63 Cells Response Denis Nazarov 1,2, * , Elena Zemtsova 1 , Vladimir Smirnov 1 , Ilya Mitrofanov 2 , Maxim Maximov 2 , Natalia Yudintceva 3 and Maxim Shevtsov 3,4 Citation: Nazarov, D.; Zemtsova, E.; Smirnov, V.; Mitrofanov, I.; Maximov, M.; Yudintceva, N.; Shevtsov, M. The Effects of Chemical Etching and Ultra-Fine Grain Structure of Titanium on MG-63 Cells Response. Metals 2021, 11, 510. https:// doi.org/10.3390/met11030510 Academic Editor: Elena Gordo Received: 17 February 2021 Accepted: 16 March 2021 Published: 19 March 2021 Publisher’s Note: MDPI stays neutral with regard to jurisdictional claims in published maps and institutional affil- iations. Copyright: © 2021 by the authors. Licensee MDPI, Basel, Switzerland. This article is an open access article distributed under the terms and conditions of the Creative Commons Attribution (CC BY) license (https:// creativecommons.org/licenses/by/ 4.0/). 1 Saint Petersburg State University, Universitetskaya Nab, 7/9, 199034 Saint Petersburg, Russia; [email protected] (E.Z.); [email protected] (V.S.) 2 Peter the Great Saint Petersburg Polytechnic University, Polytechnicheskaya 29, 195221 Saint Petersburg, Russia; [email protected] (I.M.); [email protected] (M.M.) 3 Institute of Cytology of the Russian Academy of Sciences (RAS), Tikhoretsky Ave. 4, 194064 Saint Petersburg, Russia; [email protected] (N.Y.); [email protected] (M.S.) 4 Radiation Immuno-Oncology Group, Center for Translational Cancer Research Technische Universität München (TranslaTUM), Klinikum Rechts der Isar, Einstein Str. 25, 81675 Munich, Germany * Correspondence: [email protected]; Tel.: +7-812-428-4033 Abstract: In this work, we study the influence of the surface properties of ultrafine grained (UFG) and coarse grained (CG) titanium on the morphology, viability, proliferation and differentiation of osteoblast-like MG-63 cells. Wet chemical etching in H 2 SO 4 /H 2 O 2 and NH 4 OH/H 2 O 2 solutions was used for producing surfaces with varying morphology, topography, composition and wettability. The topography and morphology have been studied by scanning electron microscopy (SEM) and atomic force microscopy (AFM). The composition was determined by time of flight mass-spectrometry (TOF-SIMS) and X-ray photoelectron spectroscopy (XPS). The results showed that it is possible to obtain samples with different compositions, hydrophilicity, topography and nanoscale or/and microscale structures by changing the etching time and the type of etching solution. It was found that developed topography and morphology can improve spreading and proliferation rate of MG-63 cells. A significant advantage of the samples of the UFG series in comparison with CG in adhesion, proliferation at later stages of cultivation (7 days), higher alkaline phosphatase (ALP) activity and faster achievement of its maximum values was found. However, there is no clear benefit of the UFG series on osteopontin (OPN) expression. All studied samples showed no cytotoxicity towards MG-63 cells and promoted their osteogenic differentiation. Keywords: titanium; ultrafine grained materials; chemical etching; surface science; osteoblast response 1. Introduction Titanium and its alloys are the most suitable and widely used materials for producing orthopedic and dental implants [1–3]. Success of using these materials is caused by combi- nation of unique mechanical properties and excellent biocompatibility [1,3]. The former are high strength, low density, and relatively low modulus of elasticity in comparison to other metallic biomaterials such as stainless steels and cobalt–chromium alloys [1,4]. The latter is due to presence of thin film (2–6 nm) of titanium oxide on the titanium surface. This film is biocompatible, chemically stable and provides strong biocorrosion resistance [3]. The alloys have much more suitable mechanical properties for medical application than pure titanium [5]. However, they are potentially more dangerous due to possible release of allergic, carcinogenic and toxic elements such as nickel, vanadium, niobium, aluminum etc. [4,6,7]. Therefore, pure titanium is still regarded as an indispensable material for the production of medical implants. To improve the mechanical properties of titanium, bulk nanostructuring of the material by the methods of severe plastic deformation (SPD) is Metals 2021, 11, 510. https://doi.org/10.3390/met11030510 https://www.mdpi.com/journal/metals
Transcript of The Effects of Chemical Etching and Ultra-Fine Grain ...

metals
Article
The Effects of Chemical Etching and Ultra-Fine Grain Structureof Titanium on MG-63 Cells Response
Denis Nazarov 1,2,* , Elena Zemtsova 1, Vladimir Smirnov 1, Ilya Mitrofanov 2 , Maxim Maximov 2 ,Natalia Yudintceva 3 and Maxim Shevtsov 3,4
�����������������
Citation: Nazarov, D.; Zemtsova, E.;
Smirnov, V.; Mitrofanov, I.; Maximov,
M.; Yudintceva, N.; Shevtsov, M. The
Effects of Chemical Etching and
Ultra-Fine Grain Structure of
Titanium on MG-63 Cells Response.
Metals 2021, 11, 510. https://
doi.org/10.3390/met11030510
Academic Editor: Elena Gordo
Received: 17 February 2021
Accepted: 16 March 2021
Published: 19 March 2021
Publisher’s Note: MDPI stays neutral
with regard to jurisdictional claims in
published maps and institutional affil-
iations.
Copyright: © 2021 by the authors.
Licensee MDPI, Basel, Switzerland.
This article is an open access article
distributed under the terms and
conditions of the Creative Commons
Attribution (CC BY) license (https://
creativecommons.org/licenses/by/
4.0/).
1 Saint Petersburg State University, Universitetskaya Nab, 7/9, 199034 Saint Petersburg, Russia;[email protected] (E.Z.); [email protected] (V.S.)
2 Peter the Great Saint Petersburg Polytechnic University, Polytechnicheskaya 29, 195221 Saint Petersburg,Russia; [email protected] (I.M.); [email protected] (M.M.)
3 Institute of Cytology of the Russian Academy of Sciences (RAS), Tikhoretsky Ave. 4, 194064 Saint Petersburg,Russia; [email protected] (N.Y.); [email protected] (M.S.)
4 Radiation Immuno-Oncology Group, Center for Translational Cancer Research Technische UniversitätMünchen (TranslaTUM), Klinikum Rechts der Isar, Einstein Str. 25, 81675 Munich, Germany
* Correspondence: [email protected]; Tel.: +7-812-428-4033
Abstract: In this work, we study the influence of the surface properties of ultrafine grained (UFG)and coarse grained (CG) titanium on the morphology, viability, proliferation and differentiation ofosteoblast-like MG-63 cells. Wet chemical etching in H2SO4/H2O2 and NH4OH/H2O2 solutions wasused for producing surfaces with varying morphology, topography, composition and wettability. Thetopography and morphology have been studied by scanning electron microscopy (SEM) and atomicforce microscopy (AFM). The composition was determined by time of flight mass-spectrometry(TOF-SIMS) and X-ray photoelectron spectroscopy (XPS). The results showed that it is possibleto obtain samples with different compositions, hydrophilicity, topography and nanoscale or/andmicroscale structures by changing the etching time and the type of etching solution. It was foundthat developed topography and morphology can improve spreading and proliferation rate of MG-63cells. A significant advantage of the samples of the UFG series in comparison with CG in adhesion,proliferation at later stages of cultivation (7 days), higher alkaline phosphatase (ALP) activity andfaster achievement of its maximum values was found. However, there is no clear benefit of the UFGseries on osteopontin (OPN) expression. All studied samples showed no cytotoxicity towards MG-63cells and promoted their osteogenic differentiation.
Keywords: titanium; ultrafine grained materials; chemical etching; surface science; osteoblastresponse
1. Introduction
Titanium and its alloys are the most suitable and widely used materials for producingorthopedic and dental implants [1–3]. Success of using these materials is caused by combi-nation of unique mechanical properties and excellent biocompatibility [1,3]. The former arehigh strength, low density, and relatively low modulus of elasticity in comparison to othermetallic biomaterials such as stainless steels and cobalt–chromium alloys [1,4]. The latter isdue to presence of thin film (2–6 nm) of titanium oxide on the titanium surface. This film isbiocompatible, chemically stable and provides strong biocorrosion resistance [3].
The alloys have much more suitable mechanical properties for medical applicationthan pure titanium [5]. However, they are potentially more dangerous due to possiblerelease of allergic, carcinogenic and toxic elements such as nickel, vanadium, niobium,aluminum etc. [4,6,7]. Therefore, pure titanium is still regarded as an indispensable materialfor the production of medical implants. To improve the mechanical properties of titanium,bulk nanostructuring of the material by the methods of severe plastic deformation (SPD) is
Metals 2021, 11, 510. https://doi.org/10.3390/met11030510 https://www.mdpi.com/journal/metals

Metals 2021, 11, 510 2 of 20
very effective [8–10]. The ultrafine-grained (UFG) titanium obtained by SPD has more thantwo-fold increased ultimate tensile and yield strength, fatigue strength, perfect fracturetoughness and is closer to the required value of Young’s modulus [8,11]. In addition, itwas shown that UFG titanium can significantly improve adhesion, spreading, proliferation,differentiation, tissue mineralization in vitro and accelerate the osseointegration of theimplant in vivo [12,13] in comparison with coarse grained (CG) titanium.
However, the improvement in the biomedical characteristics for UFG titanium isusually insufficient or not observed at all. UFG structuring changes mostly the structureand texture of the surface layer, and significantly less affects the composition, topographyand morphology of the surface [12,13]. In this regard, additional methods are used tomodify the relief, composition and morphology of the titanium surface to stimulate thebioactivity of the material. Among the surface modification methods, the most successfulin practice is the SLA technology, which includes sandblasting followed by etching in amixture of strong acids (HCl and H2SO4). SLA leads to formation of developed topographyof surface which increases osseointegration rate [14]. Despite a number of advantages, thistechnology is rather complex and has a number of limitations. For example, to preserve thehydrophilicity of the surface of implants treated with SLA, they must be stored in salinesolutions [15]. Moreover, sandblasting may not be effective for modifying the surface ofporous implants. Liquid-phase chemical etching can be considered as an alternative to SLA.This method allows to form a developed relief and to adjust the composition of the implantsurface by simple immersion in acid or base solutions [16–18]. One of the main advantagesof this method is its simplicity and wide possibilities of regulating the resulting surfacecharacteristics by varying the etchant type, its concentration, etching time and temperature.
Earlier we investigated in detail the etching features of UFG and CG titanium inH2SO4/H2O2 (sulphuric piranha—SP) and NH4OH/H2O2 (ammonia piranha—AP) so-lutions. Namely, changes of topography and morphology of surface during etching werestudied. Results showed, that it is possible to create different nanoscale, microscale andhierarchical nano-microscale structures on the titanium surface by varying compositionof etchant and etching type. In this work we continue the study of chemical compo-sition, wettability of the most promising etched UFG and CG samples and tested theirbiomedical properties in vitro using osteoblast-like (MG-63) cell line. Analysis of the resultsobtained can be very useful for determining the relationship between the physicochemicalcharacteristics of the material and the cytological response.
2. Materials and Methods2.1. Samples Preparation
UFG and CG titanium samples were prepared in Limited Liability Company “Nanomet”,Ufa, Russia, from titanium Grade 4. Titanium rods of 1 m length were subjected to Equal-Channel Angular Pressing by ECAP-Conform processing at 400 ◦C. Five ECAP-Conformpasses resulted in total accumulated true strain that was equal to 3.5. After processing, thebillets drawing at 200 ◦C resulted in the production of UFG rods with a grain size about200–300 nm [19,20].
Then the unprocessed CG (average grain size—25 mkm) and ECAP-processed UFGrods were treated by machining. Firstly, the rods were cut into discs (thickness of 2–3 mm)with the Buehler IsoMet 1000 (Buehler, Lake Bluff, IL, USA). Then, the discs were groundand polished by a semiautomatic Buehler MiniMet 1000 machine (Buehler, Lake Bluff, IL,USA) to mirror-like surface using 600, 800, and 1200 grit sandpapers and silicon dioxidenanoparticles suspension (20 nm). Prior to etching, the samples were cleaned repeatedlywith acetone and deionized water in an ultrasonic bath for 15 min and dried in an Ar.
Finally, the samples were immersed into a Pyrex glass container with NH4OH/H2O2or H2SO4/H2O2 solutions at 20 ◦C. Temperature was maintained by thermostat ElmiTW-2.03. Piranha solutions were prepared from 50% v/v ammonium hydroxide (NH4OH;Vecton, Saint-Petersburg, Russia), 36 N sulfuric acid (H2SO4; Vecton, Saint-Petersburg,Russia), and 30% aqueous hydrogen peroxide (H2O2; Vecton, Saint-Petersburg, Russia). The

Metals 2021, 11, 510 3 of 20
volume ratio of reactants in both types of solutions was 7/3; etching times were 15 min and2 h for NH4OH/H2O2 and 15 min and 24 h for H2SO4/H2O2 solutions. Immediately afteretching, the samples were taken out of the etchant and thoroughly washed in deionizedwater using an ultrasonic bath [19].
2.2. Samples Characterization
The topography of the samples surfaces was studied using a Solver P47 Pro (NT-MDT,Moscow, Russia) probe microscope in the tapping mode via atomic force microscopy (AFM).A total of five random positions on the sample surface were measured. The average meanvalue of surface roughness (Ra), root mean square roughness (RMS), and surface areadifference (the percentage increase of 3D surface area over 2D surface area) were calculatedby the associated Gwyddion 2.37 software. AFM surface parameters were calculated forevery scan and the average values were obtained [19].
Untreated and treated samples were imagined with scanning electron microscopeZeiss Merlin operated at 15 kV. Microscope spatial resolution was around 1 nm andmagnification up to 600,000. SE (secondary electrons) regimes were used. A total of fourrandom positions on each sample surface were scanned.
Chemical composition of the samples surface was studied by X-ray photoelectron spec-troscopy (XPS). X-ray photoelectron spectra were registered with a “Escalab 250Xi” (ThermoFisher Scientific, Waltham, MA, USA). The samples were excited by Al Kα (1486.7 eV)X-rays for measurements. The spectra were automatically charge compensated by settingthe binding energy of C 1s carbon line to 284.8 eV [21].
Wettability was evaluated by measuring the static contact angle (Biolin Scientific ThetaLite, Gothenburg, Sweden). Deionized water (5 µL) was dropped onto each specimen withan auto-pipette at 20 ◦C. The average contact angles were measured from 3 specimens ofeach group at 5–6 surface positions 10 s after the dropping [22].
Elemental depth profiling was also carried out with a time-of-flight secondary ionmass spectrometer (TOF SIMS 5 instrument, ION-TOF GmbH, Münster, Germany). Cs(0.5 keV, area 120× 120 µm2) and O2 (0.5 keV, area 150× 150 µm2) were used for sputtering.The depth profiles were measured by dynamic SIMS mode using the primary ion gun (Bi+
at an energy of 30 keV and a probe measured sample current of 3.1 pA, detection area100 × 100 µm2).
2.3. In Vitro Assessment of the Cellular Interactions2.3.1. Cell Culture
Human osteosarcoma cell line MG-63 (ATCC® CRL-1427TM) were obtained from theRussian Cell Culture Collection at the Institute of Cytology of the Russian Academy ofSciences (RAS) (Saint Petersburg, Russia). MG-63 were harvested in CO2-incubator (37 ◦C,6% CO2) in DMEM medium (Sigma-Aldrich, St. Louis, MO, USA) supplemented with2 mM L-glutamine, 10% fetal bovine serum (FBS) and antibiotics (100 units/mL PenicillinG and 100 µg/mL Streptomycin).
2.3.2. Cell Morphology
MG-63cells were co-incubated on the surface of the samples for 24 h in a CO2-incubator.After incubation, cells were washed with Dulbecco’s Phosphate Buffer Saline (PBS) (Sigma-Aldrich, St. Louis, MO, USA) and fixed in 2.5% glutaraldehyde in 0.1 M cacodylate buffer(Sigma-Aldrich, St. Louis, MO, USA). Evaluation of the cells morphology was performedusing SEM JSM-35.7 (JEOL, Tokyo, Japan).
2.3.3. Cell Viability and Proliferation
MG-63 cells were incubated with PBS (control sample) for 1, 6, 12, 24, and 48 h ina CO2-incubator. After incubation, cells were washed and 0.4% Trypan blue exclusiontest was used for assessment of viability. The 3-(4,5-dimethylthiazol-2-yl)-2,5 diphenyltetrazolium bromide (MTT) assay was used to estimate the cytotoxicity of the samples.

Metals 2021, 11, 510 4 of 20
Additionally, the Vybrant® MTT Cell Proliferation assay (Life Technologies, USA) was usedaccording to the manufacturer’s protocol. Cell proliferation was analyzed following 1, 6,12 h, and 1, 2, 3, and 7 days of co-incubation on the samples.
2.3.4. Cells Osteogenic Differentiation Analysis
For evaluation of the cells osteogenic differentiation, we analyzed early marker al-kaline phosphatase (ALP) and late marker osteopontin (OPN) [23]. The assessment wasperformed after 1 h, 1, 2, 7, 14, and 28 days of cells co-incubation on samples in a CO2-incubator. According to the manufacturer’s protocol we analyzed culture medium for theconcentration of the proteins employing Alkaline Phosphatase Assay Kit (Colorimetric)(Abcam, Cambridge, UK) and Osteopontin N-Half ELISA Kit (Clon tech, Mountain View,CA, USA) [24].
3. Results3.1. Morphology, Topography and Wettability
Based on our recent results [19] of the chemical etching features, we selected etchedUFG and CG titanium samples with the maximal difference in surface morphology andtopography. The SEM images of the samples are depicted in Figure 1. In general, the surfacetopography of UFG titanium is more developed (Table 1) and its nano and microstructuresare more uniform. However, in general surface morphology of the etched CG and UFGsamples coincides. Titanium etched in H2SO4/H2O2 during 15 min (SP-15) has no evidentnano- or microstructures. Prolonged acid etching during 24 h (SP-24) leads to the formationof both microscale and nanoscale structures. However, the microscale relief of the UFG Tiis more developed. Samples etched in NH4OH/H2O2 for 15 min (AP-15), unlike SP-15,have nanostructures on the surface. Nanostructures on the UFG-AP-15 completely coverthe sample surface, but on the CG-AP-15, surface areas without nanostructures are visible.Microstructures on the both samples are almost hidden, with the exception of a smallnumber of microscale pits. The 2-h AP-etched UFG and CG samples (AP-2) have nanoscalestructures and microscale pits. The pits sizes are in the range of several micrometers, butthe shape of the pits in sample CG-AP-2 is more elongated.
Metals 2021, 11, x FOR PEER REVIEW 4 of 20
2.3.3. Cell Viability and Proliferation
MG‐63 cells were incubated with PBS (control sample) for 1, 6, 12, 24, and 48 h in a
CO2‐incubator. After incubation, cells were washed and 0.4% Trypan blue exclusion test
was used for assessment of viability. The 3‐(4,5‐dimethylthiazol‐2‐yl)‐2,5 diphenyl te‐
trazolium bromide (MTT) assay was used to estimate the cytotoxicity of the samples.
Additionally, the Vybrant® MTT Cell Proliferation assay (Life Technologies, USA) was
used according to the manufacturer’s protocol. Cell proliferation was analyzed following
1, 6, 12 h, and 1, 2, 3, and 7 days of co‐incubation on the samples.
2.3.4. Cells Osteogenic Differentiation Analysis
For evaluation of the cells osteogenic differentiation, we analyzed early marker al‐
kaline phosphatase (ALP) and late marker osteopontin (OPN) [23]. The assessment was
performed after 1 h, 1, 2, 7, 14, and 28 days of cells co‐incubation on samples in a
CO2‐incubator. According to the manufacturer’s protocol we analyzed culture medium
for the concentration of the proteins employing Alkaline Phosphatase Assay Kit (Col‐
orimetric) (Abcam, Cambridge, UK) and Osteopontin N‐Half ELISA Kit (Clon tech,
Mountain View, CA, USA) [24].
3. Results
3.1. Morphology, Topography and Wettability
Based on our recent results [19] of the chemical etching features, we selected etched
UFG and CG titanium samples with the maximal difference in surface morphology and
topography. The SEM images of the samples are depicted in Figure 1. In general, the
surface topography of UFG titanium is more developed (Table 1) and its nano and mi‐
crostructures are more uniform. However, in general surface morphology of the etched
CG and UFG samples coincides. Titanium etched in H2SO4/H2O2 during 15 min (SP‐15)
has no evident nano‐ or microstructures. Prolonged acid etching during 24 h (SP‐24)
leads to the formation of both microscale and nanoscale structures. However, the mi‐
croscale relief of the UFG Ti is more developed. Samples etched in NH4OH/H2O2 for 15
min (AP‐15), unlike SP‐15, have nanostructures on the surface. Nanostructures on the
UFG‐AP‐15 completely cover the sample surface, but on the CG‐AP‐15, surface areas
without nanostructures are visible. Microstructures on the both samples are almost hid‐
den, with the exception of a small number of microscale pits. The 2‐h AP‐etched UFG and
CG samples (AP‐2) have nanoscale structures and microscale pits. The pits sizes are in
the range of several micrometers, but the shape of the pits in sample CG‐AP‐2 is more
elongated.
Figure 1. SEM images of chemically etched UFG and CG titanium discs: (a) UFG‐SP‐15; (b) UFG‐SP‐24; (c) UFG‐AP‐15;
(d) UFG‐AP‐2; (e) CG‐SP‐15; (f) CG‐SP‐24; (g) CG‐AP‐15; (h) CG‐AP‐2. Reprinted with adaptation from [19]. Figure 1. SEM images of chemically etched UFG and CG titanium discs: (a) UFG-SP-15; (b) UFG-SP-24; (c) UFG-AP-15;(d) UFG-AP-2; (e) CG-SP-15; (f) CG-SP-24; (g) CG-AP-15; (h) CG-AP-2. Reprinted with adaptation from [19].
The polished UFG and CG titanium surfaces (Table 1) are hydrophilic (wetting—79 ± 3◦ and 78 ± 4◦) and have low roughness (RMS—6–7 nm) and surface area. The shortetching in H2SO4/H2O2 (SP-15 samples) almost does not affect wettability and roughness.Prolonged etching in H2SO4/H2O2 (SP-24) slightly reduces the contact angles (from 79◦

Metals 2021, 11, 510 5 of 20
and 78◦ to 71◦ and 73◦ for UFG and CG, respectively), significantly increases the roughnessand creates a developed surface topography.
Table 1. Wettability and surface topography parameters of the samples.
Sample Wetting Angles ◦ Roughness1 RMS, nm
2 Ssurf Surface Characteristics
UFG-Ti 79 ± 3 6.54 ± 0.79 1.013 ± 0.003 Polished, native oxide, low roughnessCG-Ti 78 ± 4 6.33 ± 0.46 1.009 ± 0.001
UFG-SP-15 75 ± 3 6.18 ± 0.76 1.010 ± 0.002 No micro/nanostructures, low roughnessCG-SP-15 78 ± 2 6.13 ± 0.31 1.008 ± 0.001
UFG-SP-24 71 ± 9 53.1 ± 6.5 1.065 ± 0.006 Nano and microstructures,high roughnessCG-SP-24 73 ± 7 28.4 ± 3.5 1.051 ± 0.005
UFG-AP-15 101 ± 9 52.6 ± 5.2 1.151 ± 0.013 Nanostructures, high roughnessCG-AP-15 112 ± 14 23.9 ± 1.8 1.079 ± 0.005
UFG-AP-2 120 ± 13 80.2 ± 5.2 1.350 ± 0.021 Nano and microstructures,high roughnessCG-AP-2 123 ± 17 95.1 ± 9.9 1.130 ± 0.016
1 RMS—Root mean squared roughness; 2 Ssurf—surface area difference (the increase of 3D surface area over 2D surface area).
The etching in NH4OH/H2O2 greatly increases the roughness and contact angles(101–123◦) for both UFG and CG samples and they become hydrophobic (contact angles>90◦). It should be noted that AP- etching results in a large scatter of contact anglesdue to high inhomogeneity of surface. The etched UFG samples have more developedtopography and greater roughness. The contact angles of the UFG are less than the CG, butthis difference is usually within the measurement error. In general, despite the differencein the topography of the UFG and CG series, their absolute values and the dispersion ofcontact angles almost do not depend on the titanium type, but are greatly determined bythe chemical etching conditions.
3.2. Chemical Composition
The surface chemistry was not influenced by the changes in microstructure and textureinduced by severe plastic deformation with ECAP [19,25]. Therefore we studied chemicalcomposition by XPS and TOF-SIMS predominantly on the surface of polished and etchedUFG titanium.
According to XPS survey spectra, titanium, oxygen, carbon and nitrogen were foundon the surface of the samples. The sulfur from SP etchant was not detected in any of thesamples [16]. High resolution N1s spectra (Figure 2a) showed that the most nitrogen wasfound on the surface of the AP-etched samples (2–3%). On the surface of the SP-etchedsamples, nitrogen content is much lower (<1%). Therefore, we assume that the nitrogensource is not only surface contamination, but also etchant residues and etching productsfor samples AP-15 and AP-2. Most of the nitrogen for AP-etched samples is probablyoriginated from NH4
+ (Figure 2a), but there are also N-C containing compounds.In the C1s spectra (Figure 2b) for all samples single intensive peak at 284.8 eV cor-
responds to the aliphatic hydrocarbons (C-C, C-H) which are originated from surfacecontamination during storage the samples in air. Moreover, a small shoulder at higherbinding energy (286.3 eV) assigned to C-OH. No additional peaks of oxygen-containinggroups (aldehyde, carboxyl or carbonyl) in the range of 287–292 eV were observed.
The Ti2p spectra (Figure 2c) of polished and etched samples showed intensive Ti2p3/2and Ti2p1/2 peaks at 458.7 and 464.4 eV (doublet gap is about 5.7 eV), which correspondedto TiO2 [26]. An asymmetric peak at 453.4 eV for polished titanium and AP-etched titanium(inset Figure 2c) is assigned to metallic Ti [21]. This indicates that the surface oxide layeris very thin (no more than few nanometers). Upon etching in SP, this peak disappears,which indicates an increase in the oxide layer thickness due to surface oxidation. Thedeconvoluted Ti2p spectra (Figure S1) showed that the near-surface layer of the sam-

Metals 2021, 11, 510 6 of 20
ples contains mainly TiO2, but the non-etched sample and the AP-etched samples havesignificant amounts of TiO and Ti2O3 in addition to metallic titanium (Table 2).
Metals 2021, 11, x FOR PEER REVIEW 6 of 20
Figure 2. XPS spectra of polished and chemically etched UFG titanium: (a) N1s; (b) C1s; (c) Ti2p; (d) O1s.
In the C1s spectra (Figure 2b) for all samples single intensive peak at 284.8 eV cor‐
responds to the aliphatic hydrocarbons (C‐C, C‐H) which are originated from surface
contamination during storage the samples in air. Moreover, a small shoulder at higher
binding energy (286.3 eV) assigned to C‐OH. No additional peaks of oxygen‐containing
groups (aldehyde, carboxyl or carbonyl) in the range of 287–292 eV were observed.
The Ti2p spectra (Figure 2c) of polished and etched samples showed intensive
Ti2p3/2 and Ti2p1/2 peaks at 458.7 and 464.4 eV (doublet gap is about 5.7 eV), which cor‐
responded to TiO2 [26]. An asymmetric peak at 453.4 eV for polished titanium and
AP‐etched titanium (inset Figure 2c) is assigned to metallic Ti [21]. This indicates that the
surface oxide layer is very thin (no more than few nanometers). Upon etching in SP, this
peak disappears, which indicates an increase in the oxide layer thickness due to surface
oxidation. The deconvoluted Ti2p spectra (Figure S1) showed that the near‐surface layer
of the samples contains mainly TiO2, but the non‐etched sample and the AP‐etched
samples have significant amounts of TiO and Ti2O3 in addition to metallic titanium (Table
2).
Table 2. Percentage of Ti forms based on Ti2p spectra deconvolution.
Phase UFG‐Ti SP‐15 SP‐24 AP‐15 AP‐2
TiO2 73.2 90.0 91.7 83.7 77.9
Ti2O3 12.8 8.3 8.3 10.8 10.4
TiO 9.3 1.7 ‐ 2.2 6.5
Ti 4.7 ‐ ‐ 3.3 5.2
Figure 2. XPS spectra of polished and chemically etched UFG titanium: (a) N1s; (b) C1s; (c) Ti2p; (d) O1s.
Table 2. Percentage of Ti forms based on Ti2p spectra deconvolution.
Phase UFG-Ti SP-15 SP-24 AP-15 AP-2
TiO2 73.2 90.0 91.7 83.7 77.9
Ti2O3 12.8 8.3 8.3 10.8 10.4
TiO 9.3 1.7 - 2.2 6.5
Ti 4.7 - - 3.3 5.2
In the O1s spectra (Figure 2d), the peak at about 530.1 eV is assigned to TiO2, andthe peak at 531.7 eV can correspond to both hydroxyl—OH [27,28] and TiO/Ti2O3 [29],which are found in the Ti2p spectra. Moreover, a small shoulder in the region of 532–534 eVcan be caused by the presence of the surface water [27,28] as well as organic contaminants(C-O, C=O) [30], which were also recognized in the C1s spectra. Deconvoluted spectra(Figure S2) showed that, for the UFG-Ti and SP-15 samples, the shoulder consists of atleast two components (C-O/H2O and C=O). The AP-etched samples are characterized by asmaller TiO2 amount and a higher amount of OH/TiO/Ti2O3 (Table 3). Unfortunately, it israther difficult to deconvolute these components, because they are very close to each otherand overlap a lot.

Metals 2021, 11, 510 7 of 20
Table 3. Percentage of O forms based on O1s spectra deconvolution.
Phase UFG-Ti SP-15 SP-24 AP-15 AP-2
TiO2 49.3 54.1 59.6 44.0 48.6
-OH, Ti2O3, TiO 30.3 31.1 29.2 42.3 35.5
C-O, H2O 17.8 12.3 11.2 13.7 15.9
C=O 2.6 2.5 - - -
According to the TOF-SIMS results, polished and etched titanium surfaces containboth organic (CO+, C+, CH−, C2H−, etc.) and inorganic (Fe+, K+, Cl−, F−) foreign ions(Figures 3 and S3). These ions disappear after ion sputtering of the surface layer and areprobably caused by surface contamination during samples storage at ambient atmosphere.Sulfur-containing ions were not found, and only CN− is clearly detected as nitrogen-containing ion.
Metals 2021, 11, x FOR PEER REVIEW 7 of 20
In the O1s spectra (Figure 2d), the peak at about 530.1 eV is assigned to TiO2, and the
peak at 531.7 eV can correspond to both hydroxyl—OH [27,28] and TiO/Ti2O3 [29], which
are found in the Ti2p spectra. Moreover, a small shoulder in the region of 532–534 eV can
be caused by the presence of the surface water [27,28] as well as organic contaminants
(C‐O, C=O) [30], which were also recognized in the C1s spectra. Deconvoluted spectra
(Figure S2) showed that, for the UFG‐Ti and SP‐15 samples, the shoulder consists of at
least two components (C‐O/H2O and C=O). The AP‐etched samples are characterized by
a smaller TiO2 amount and a higher amount of OH/TiO/Ti2O3 (Table 3). Unfortunately, it
is rather difficult to deconvolute these components, because they are very close to each
other and overlap a lot.
Table 3. Percentage of O forms based on O1s spectra deconvolution.
Phase UFG‐Ti SP‐15 SP‐24 AP‐15 AP‐2
TiO2 49.3 54.1 59.6 44.0 48.6
‐OH, Ti2O3, TiO 30.3 31.1 29.2 42.3 35.5
C‐O, H2O 17.8 12.3 11.2 13.7 15.9
C=O 2.6 2.5 ‐ ‐ ‐
According to the TOF‐SIMS results, polished and etched titanium surfaces contain
both organic (CO+, C+, CH−, C2H−, etc.) and inorganic (Fe+, K+, Cl−, F−) foreign ions (Figures
3 and S3). These ions disappear after ion sputtering of the surface layer and are probably
caused by surface contamination during samples storage at ambient atmosphere. Sul‐
fur‐containing ions were not found, and only CN− is clearly detected as nitro‐
gen‐containing ion.
Figure 3. TOF‐SIMS spectra of negative ions: (a) UFG‐Ti; (b) UFG‐SP‐24; (c) UFG‐AP‐2.
The quantitative analysis of the TOF‐SIMS spectra is difficult due to the difference in
the nature and ionization degree of chemical groups of various types. Nevertheless, a
comparison of the O−\OH− peaks intensities for different samples allows us to conclude
that the content of hydroxyl groups on the surface increases upon 24 h SP‐etching
(OH−/O− = 0.53) and decrease upon 2 h AP‐etching (OH−/O− = 0.17). The ratio OH−/O− for
polished titanium was 0.26 (Figure 3).
Comparison of the TiOH+ and TiOOH+ ions intensities with respect to TiO+ and TiO2+
(Figures S3 and S4) showed that, during SP‐etching, OH−/O− ratio raised, and upon
AP‐etching, this ratio diminished. Thus, SP‐etching increases the number of the surface
hydroxide ions, while AP‐etching decreases.
3.3. In Vitro Results
3.3.1. Spreading and Morphology of the Cells
After 24 h co‐incubation of the MG‐63 cells onto polished and etched UFG and CG
titanium samples, they were washed with PBS and fixed for the subsequent SEM analy‐
sis (Figure 4). The cells incubated on CG titanium differ significantly from those incu‐
Figure 3. TOF-SIMS spectra of negative ions: (a) UFG-Ti; (b) UFG-SP-24; (c) UFG-AP-2.
The quantitative analysis of the TOF-SIMS spectra is difficult due to the differencein the nature and ionization degree of chemical groups of various types. Nevertheless,a comparison of the O−\OH− peaks intensities for different samples allows us to con-clude that the content of hydroxyl groups on the surface increases upon 24 h SP-etching(OH−/O− = 0.53) and decrease upon 2 h AP-etching (OH−/O− = 0.17). The ratio OH−/O−
for polished titanium was 0.26 (Figure 3).Comparison of the TiOH+ and TiOOH+ ions intensities with respect to TiO+ and TiO2
+
(Figures S3 and S4) showed that, during SP-etching, OH−/O− ratio raised, and uponAP-etching, this ratio diminished. Thus, SP-etching increases the number of the surfacehydroxide ions, while AP-etching decreases.
3.3. In Vitro Results3.3.1. Spreading and Morphology of the Cells
After 24 h co-incubation of the MG-63 cells onto polished and etched UFG and CGtitanium samples, they were washed with PBS and fixed for the subsequent SEM analysis(Figure 4). The cells incubated on CG titanium differ significantly from those incubated onUFG titanium. MG-63 cells cultured on the CG-SP-15 sample had a bipolar elongated shape,which most closely corresponded to the cell morphology on the surface of the polishedCG-Ti sample and control (cultivation on plastic culture plate—Figure S5). On the surfaceof CG-SP-24 and CG-AP-15, along with the bipolar form, we detected strongly spread,rounded cells, as well as cells with long appendages. The peculiarities of cell cultivationon the CG-AP-2 sample include the ability of cells to form aggregates (Figure 4). Themorphology of cells on the surface of the UFG samples has significant differences from theCG samples. The cells were elongated in shape, quickly formed a monolayer and form cellstrands. Morphological differences between the samples were not revealed.

Metals 2021, 11, 510 8 of 20
Metals 2021, 11, x FOR PEER REVIEW 8 of 20
bated on UFG titanium. MG‐63 cells cultured on the CG‐SP‐15 sample had a bipolar
elongated shape, which most closely corresponded to the cell morphology on the surface
of the polished CG‐Ti sample and control (cultivation on plastic culture plate—Figure
S5). On the surface of CG‐SP‐24 and CG‐AP‐15, along with the bipolar form, we detected
strongly spread, rounded cells, as well as cells with long appendages. The peculiarities
of cell cultivation on the CG‐AP‐2 sample include the ability of cells to form aggregates
(Figure 4). The morphology of cells on the surface of the UFG samples has significant
differences from the CG samples. The cells were elongated in shape, quickly formed a
monolayer and form cell strands. Morphological differences between the samples were
not revealed.
Figure 4. The morphology of MG‐63 cells co‐incubated after 24 h of cultivation. Scale bar—100 μm.
3.3.2. Cell Viability and Proliferation
We measured the cytotoxicity after 1, 6 and 12 h, 1 and 2 days co‐incubation of the
MG‐63 cells employing MTT assay. MTT test shows the metabolic activity in cells and is
influenced by proliferation rate. Therefore we used the short periods of cultivation to
study viability of the cells. Results showed that all samples did not cause toxic activity for
the whole 48 h period of observation (Figure 5). The difference between UFG and CG ti‐
tanium (both polished and etched) was minimal. In the early stages (1 h) the CG series
performed slightly better, but later (1–2 days) the UFG samples viabilities were higher.
However, the results for all samples demonstrated no significant differences among the
viability of the samples including control.
Figure 5. MG‐63 cells viability after co‐incubation on UFG and CG titanium. Data are presented as
mean ± S.D. from five independent series of experiments (p < 0.05).
Figure 4. The morphology of MG-63 cells co-incubated after 24 h of cultivation. Scale bar—100 µm.
3.3.2. Cell Viability and Proliferation
We measured the cytotoxicity after 1, 6 and 12 h, 1 and 2 days co-incubation of theMG-63 cells employing MTT assay. MTT test shows the metabolic activity in cells and isinfluenced by proliferation rate. Therefore we used the short periods of cultivation to studyviability of the cells. Results showed that all samples did not cause toxic activity for thewhole 48 h period of observation (Figure 5). The difference between UFG and CG titanium(both polished and etched) was minimal. In the early stages (1 h) the CG series performedslightly better, but later (1–2 days) the UFG samples viabilities were higher. However, theresults for all samples demonstrated no significant differences among the viability of thesamples including control.
Metals 2021, 11, x FOR PEER REVIEW 8 of 20
bated on UFG titanium. MG‐63 cells cultured on the CG‐SP‐15 sample had a bipolar
elongated shape, which most closely corresponded to the cell morphology on the surface
of the polished CG‐Ti sample and control (cultivation on plastic culture plate—Figure
S5). On the surface of CG‐SP‐24 and CG‐AP‐15, along with the bipolar form, we detected
strongly spread, rounded cells, as well as cells with long appendages. The peculiarities
of cell cultivation on the CG‐AP‐2 sample include the ability of cells to form aggregates
(Figure 4). The morphology of cells on the surface of the UFG samples has significant
differences from the CG samples. The cells were elongated in shape, quickly formed a
monolayer and form cell strands. Morphological differences between the samples were
not revealed.
Figure 4. The morphology of MG‐63 cells co‐incubated after 24 h of cultivation. Scale bar—100 μm.
3.3.2. Cell Viability and Proliferation
We measured the cytotoxicity after 1, 6 and 12 h, 1 and 2 days co‐incubation of the
MG‐63 cells employing MTT assay. MTT test shows the metabolic activity in cells and is
influenced by proliferation rate. Therefore we used the short periods of cultivation to
study viability of the cells. Results showed that all samples did not cause toxic activity for
the whole 48 h period of observation (Figure 5). The difference between UFG and CG ti‐
tanium (both polished and etched) was minimal. In the early stages (1 h) the CG series
performed slightly better, but later (1–2 days) the UFG samples viabilities were higher.
However, the results for all samples demonstrated no significant differences among the
viability of the samples including control.
Figure 5. MG‐63 cells viability after co‐incubation on UFG and CG titanium. Data are presented as
mean ± S.D. from five independent series of experiments (p < 0.05).
Figure 5. MG-63 cells viability after co-incubation on UFG and CG titanium. Data are presented asmean ± S.D. from five independent series of experiments (p < 0.05).
The proliferation of osteoblasts has been increased during the entire experiment (upto 7 days) (Figures 6 and S6). With an increase in the cultivation duration, the advantage ofetched samples over non-etched ones gradually appeared and increased. Depending onthe topography and surface morphology, the samples can be divided into 3 groups: thesamples with smooth surface (UFG-Ti, CG-Ti, UFG-SP-15 and CG-SP-15), the samples withonly nanostructures (UFG-AP-15 and CG-AP-15) and the samples with both micro- andnanostructures (UFG-AP-2, CG-AP-2, CG-SP-24, UFG-SP-24).
Metals 2021, 11, 510 9 of 20
Metals 2021, 11, x FOR PEER REVIEW 9 of 20
The proliferation of osteoblasts has been increased during the entire experiment (up
to 7 days) (Figures 6 and S6). With an increase in the cultivation duration, the advantage
of etched samples over non‐etched ones gradually appeared and increased. Depending
on the topography and surface morphology, the samples can be divided into 3 groups:
the samples with smooth surface (UFG‐Ti, CG‐Ti, UFG‐SP‐15 and CG‐SP‐15), the sam‐
ples with only nanostructures (UFG‐AP‐15 and CG‐AP‐15) and the samples with both
micro‐ and nanostructures (UFG‐AP‐2, CG‐AP‐2, CG‐SP‐24, UFG‐SP‐24).
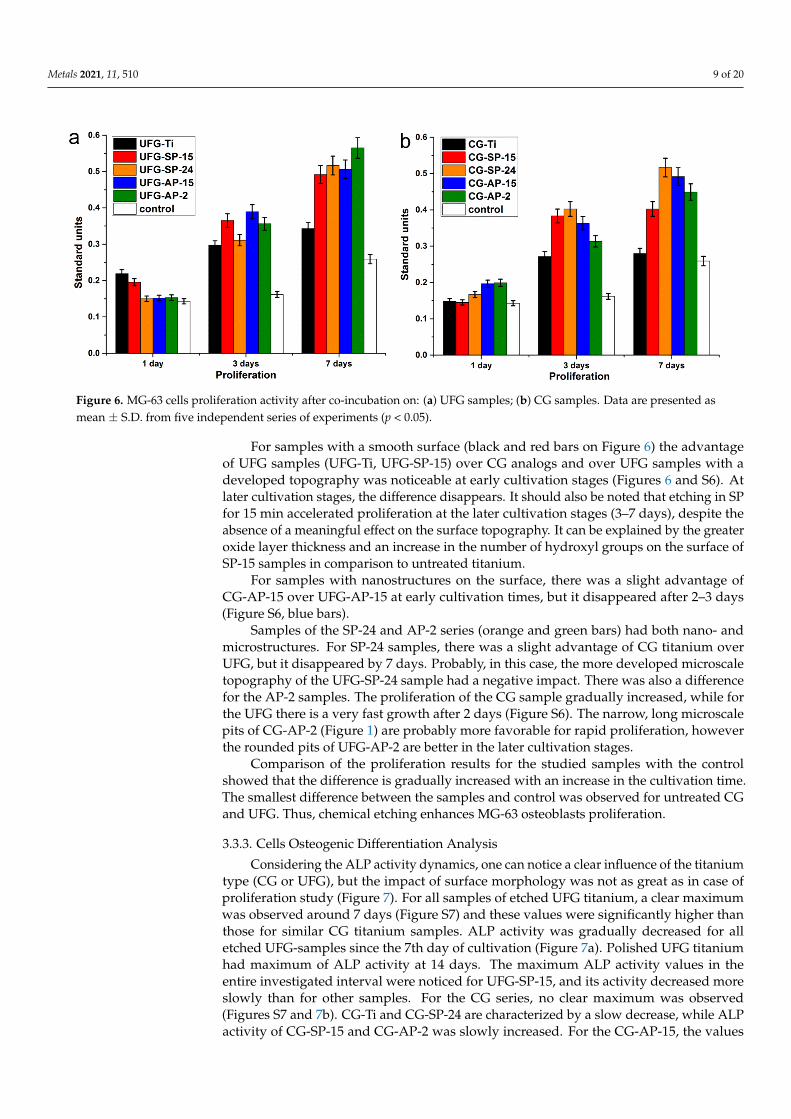
Figure 6. MG‐63 cells proliferation activity after co‐incubation on: (a) UFG samples; (b) CG samples. Data are presented
as mean ± S.D. from five independent series of experiments (p < 0.05).
For samples with a smooth surface (black and red bars on Figure 6) the advantage
of UFG samples (UFG‐Ti, UFG‐SP‐15) over CG analogs and over UFG samples with a
developed topography was noticeable at early cultivation stages (Figures 6 and S6). At
later cultivation stages, the difference disappears. It should also be noted that etching in
SP for 15 min accelerated proliferation at the later cultivation stages (3–7 days), despite
the absence of a meaningful effect on the surface topography. It can be explained by the
greater oxide layer thickness and an increase in the number of hydroxyl groups on the
surface of SP‐15 samples in comparison to untreated titanium.
For samples with nanostructures on the surface, there was a slight advantage of
CG‐AP‐15 over UFG‐AP‐15 at early cultivation times, but it disappeared after 2–3 days
(Figure S6, blue bars).
Samples of the SP‐24 and AP‐2 series (orange and green bars) had both nano‐ and
microstructures. For SP‐24 samples, there was a slight advantage of CG titanium over
UFG, but it disappeared by 7 days. Probably, in this case, the more developed microscale
topography of the UFG‐SP‐24 sample had a negative impact. There was also a difference
for the AP‐2 samples. The proliferation of the CG sample gradually increased, while for
the UFG there is a very fast growth after 2 days (Figure S6). The narrow, long microscale
pits of CG‐AP‐2 (Figure 1) are probably more favorable for rapid proliferation, however
the rounded pits of UFG‐AP‐2 are better in the later cultivation stages.
Comparison of the proliferation results for the studied samples with the control
showed that the difference is gradually increased with an increase in the cultivation time.
The smallest difference between the samples and control was observed for untreated CG
and UFG. Thus, chemical etching enhances MG‐63 osteoblasts proliferation.
3.3.3. Cells Osteogenic Differentiation Analysis
Considering the ALP activity dynamics, one can notice a clear influence of the tita‐
nium type (CG or UFG), but the impact of surface morphology was not as great as in case
of proliferation study (Figure 7). For all samples of etched UFG titanium, a clear maxi‐
Figure 6. MG-63 cells proliferation activity after co-incubation on: (a) UFG samples; (b) CG samples. Data are presented asmean ± S.D. from five independent series of experiments (p < 0.05).
For samples with a smooth surface (black and red bars on Figure 6) the advantageof UFG samples (UFG-Ti, UFG-SP-15) over CG analogs and over UFG samples with adeveloped topography was noticeable at early cultivation stages (Figures 6 and S6). Atlater cultivation stages, the difference disappears. It should also be noted that etching in SPfor 15 min accelerated proliferation at the later cultivation stages (3–7 days), despite theabsence of a meaningful effect on the surface topography. It can be explained by the greateroxide layer thickness and an increase in the number of hydroxyl groups on the surface ofSP-15 samples in comparison to untreated titanium.
For samples with nanostructures on the surface, there was a slight advantage ofCG-AP-15 over UFG-AP-15 at early cultivation times, but it disappeared after 2–3 days(Figure S6, blue bars).
Samples of the SP-24 and AP-2 series (orange and green bars) had both nano- andmicrostructures. For SP-24 samples, there was a slight advantage of CG titanium overUFG, but it disappeared by 7 days. Probably, in this case, the more developed microscaletopography of the UFG-SP-24 sample had a negative impact. There was also a differencefor the AP-2 samples. The proliferation of the CG sample gradually increased, while forthe UFG there is a very fast growth after 2 days (Figure S6). The narrow, long microscalepits of CG-AP-2 (Figure 1) are probably more favorable for rapid proliferation, howeverthe rounded pits of UFG-AP-2 are better in the later cultivation stages.
Comparison of the proliferation results for the studied samples with the controlshowed that the difference is gradually increased with an increase in the cultivation time.The smallest difference between the samples and control was observed for untreated CGand UFG. Thus, chemical etching enhances MG-63 osteoblasts proliferation.
3.3.3. Cells Osteogenic Differentiation Analysis
Considering the ALP activity dynamics, one can notice a clear influence of the titaniumtype (CG or UFG), but the impact of surface morphology was not as great as in case ofproliferation study (Figure 7). For all samples of etched UFG titanium, a clear maximumwas observed around 7 days (Figure S7) and these values were significantly higher thanthose for similar CG titanium samples. ALP activity was gradually decreased for alletched UFG-samples since the 7th day of cultivation (Figure 7a). Polished UFG titaniumhad maximum of ALP activity at 14 days. The maximum ALP activity values in theentire investigated interval were noticed for UFG-SP-15, and its activity decreased moreslowly than for other samples. For the CG series, no clear maximum was observed(Figures S7 and 7b). CG-Ti and CG-SP-24 are characterized by a slow decrease, while ALPactivity of CG-SP-15 and CG-AP-2 was slowly increased. For the CG-AP-15, the values

Metals 2021, 11, 510 10 of 20
were rather constant. It is possible that the maxima for the samples of the CG series shouldappear in the intermediate intervals (7–14 and 14–28 days).
Metals 2021, 11, x FOR PEER REVIEW 10 of 20
mum was observed around 7 days (Figure S7) and these values were significantly higher
than those for similar CG titanium samples. ALP activity was gradually decreased for all
etched UFG‐samples since the 7th day of cultivation (Figure 7a). Polished UFG titanium
had maximum of ALP activity at 14 days. The maximum ALP activity values in the entire
investigated interval were noticed for UFG‐SP‐15, and its activity decreased more slowly
than for other samples. For the CG series, no clear maximum was observed (Figures S7
and 7b). CG‐Ti and CG‐SP‐24 are characterized by a slow decrease, while ALP activity of
CG‐SP‐15 and CG‐AP‐2 was slowly increased. For the CG‐AP‐15, the values were rather
constant. It is possible that the maxima for the samples of the CG series should appear in
the intermediate intervals (7–14 and 14–28 days).
Figure 7. Alkaline phosphatase production by MC3T3‐E1 osteoblasts on UFG series—(a) and CG series—(b). Each value
represents mean ± S.D. from five independent experiments (p < 0.05).
The ALP activity dynamics in the control sample was not clearly expressed, the
ALP activity values almost did not change (Figures 7 and S7), but the ALP activity val‐
ues of the studied samples were generally higher than in the control. This may indicate
the differentiation of MG‐63 cells in the osteogenic direction for all studied samples.
The pattern of change in OPN expression demonstrated the difference between
etched UFG and CG titanium, but it is not as pronounced as for ALP activity (Figures 8
and S8). For the UFG samples, a maximum was observed at 14 days, and the differences
between the types of etching were insignificant. For CG samples, the maximum OPN
expression for SP‐24 and AP‐2 is observed at 14 days, and for SP‐15 and AP‐15 at 7 days.
However, it is likely that the real maximum for these samples was somewhere in the
range of 7–14 days. A similar intermediate maxima are possible for the UFG samples.
Figure 7. Alkaline phosphatase production by MC3T3-E1 osteoblasts on UFG series—(a) and CG series—(b). Each valuerepresents mean ± S.D. from five independent experiments (p < 0.05).
The ALP activity dynamics in the control sample was not clearly expressed, the ALPactivity values almost did not change (Figures 7 and S7), but the ALP activity values ofthe studied samples were generally higher than in the control. This may indicate thedifferentiation of MG-63 cells in the osteogenic direction for all studied samples.
The pattern of change in OPN expression demonstrated the difference between etchedUFG and CG titanium, but it is not as pronounced as for ALP activity (Figures 8 and S8).For the UFG samples, a maximum was observed at 14 days, and the differences betweenthe types of etching were insignificant. For CG samples, the maximum OPN expression forSP-24 and AP-2 is observed at 14 days, and for SP-15 and AP-15 at 7 days. However, it islikely that the real maximum for these samples was somewhere in the range of 7–14 days.A similar intermediate maxima are possible for the UFG samples.
Metals 2021, 11, x FOR PEER REVIEW 11 of 20
Figure 8. Osteopontin production by MC3T3‐E1 osteoblasts on UFG series—(a) and CG series—(b). Each value represents
mean ± S.D. from five independent experiments (p < 0.05).
The maximum absolute values of OPN expression were observed at 14 days of cul‐
tivation for UFG samples etched in H2SO4/H2O2 for 15 min and 24 h, as well as
NH4OH/H2O2 for 15 min.
Polished UFG and CG titanium showed maximum OPN expression at 14 days, and a
significant difference between these samples is observed only at 2 and 28 days, when
UFG‐Ti shows significantly higher OPN expression than CG‐Ti (Figure S8). The OPN
expression dynamics of the control sample, in contrast to the studied samples, was not
pronounced and the values changed insignificantly. Nevertheless, the absolute OPN ex‐
pression values for the studied samples are much higher than in the control. It may in‐
dicate the stimulated differentiation of MG‐63 cells in the osteogenic direction for all
samples.
4. Discussion
The study of cell viability up to 2 days of cultivation times did not reveal any in‐
fluence of either grain structure or etching conditions (Figure 5). Moreover, no signifi‐
cant difference was found between the studied samples and the control, i.e., cells cul‐
tured on the plastic plates. Therefore, all studied samples, regardless of the treatment
conditions, are not cytotoxic to MG‐63 cells.
On the other hand, the results obtained showed that the surface topography, mor‐
phology, wettability, composition, and grain structure of titanium affected significantly
the morphology, proliferation, and differentiation of MG‐63 cells. Unfortunately, it is
rather difficult to distinguish the influence of individual factors, since they are closely
related. For example, wettability depends on both the surface composition and the to‐
pography and morphology. The grain structure of titanium significantly affects the sur‐
face topography and morphology formed as a result of chemical etching [19]. In addi‐
tion, it is rather difficult to change specific surface properties by chemical etching while
maintaining other properties, since etching simultaneously changes both the topogra‐
phy, morphology, and surface composition.
Nevertheless, the results allow us to draw a number of conclusions. There are two
main factors determining in vitro characteristics of our samples: the titanium grain
structure and the surface morphology. Surface composition and wettability also appear
to have a reasonable influence, but not the main and determining factor.
Figure 8. Osteopontin production by MC3T3-E1 osteoblasts on UFG series—(a) and CG series—(b). Each value representsmean ± S.D. from five independent experiments (p < 0.05).

Metals 2021, 11, 510 11 of 20
The maximum absolute values of OPN expression were observed at 14 days of cultiva-tion for UFG samples etched in H2SO4/H2O2 for 15 min and 24 h, as well as NH4OH/H2O2for 15 min.
Polished UFG and CG titanium showed maximum OPN expression at 14 days, and asignificant difference between these samples is observed only at 2 and 28 days, when UFG-Ti shows significantly higher OPN expression than CG-Ti (Figure S8). The OPN expressiondynamics of the control sample, in contrast to the studied samples, was not pronouncedand the values changed insignificantly. Nevertheless, the absolute OPN expression valuesfor the studied samples are much higher than in the control. It may indicate the stimulateddifferentiation of MG-63 cells in the osteogenic direction for all samples.
4. Discussion
The study of cell viability up to 2 days of cultivation times did not reveal any influenceof either grain structure or etching conditions (Figure 5). Moreover, no significant differencewas found between the studied samples and the control, i.e., cells cultured on the plasticplates. Therefore, all studied samples, regardless of the treatment conditions, are notcytotoxic to MG-63 cells.
On the other hand, the results obtained showed that the surface topography, mor-phology, wettability, composition, and grain structure of titanium affected significantly themorphology, proliferation, and differentiation of MG-63 cells. Unfortunately, it is ratherdifficult to distinguish the influence of individual factors, since they are closely related. Forexample, wettability depends on both the surface composition and the topography andmorphology. The grain structure of titanium significantly affects the surface topographyand morphology formed as a result of chemical etching [19]. In addition, it is rather dif-ficult to change specific surface properties by chemical etching while maintaining otherproperties, since etching simultaneously changes both the topography, morphology, andsurface composition.
Nevertheless, the results allow us to draw a number of conclusions. There are twomain factors determining in vitro characteristics of our samples: the titanium grain struc-ture and the surface morphology. Surface composition and wettability also appear to havea reasonable influence, but not the main and determining factor.
4.1. Affect of Grain Structure on Cell Morphology, Proliferation and Differentiation
Considering the differences in the in vitro characteristics of the CG and UFG seriessamples, the morphology of the cells is of particular interest. There is a large differencein morphology of MG-63 cells cultured on UFG and CG titanium (Figure 4). The cellson the etched UFG titanium have round shape, quickly form a monolayer and form cellstrands, which indicates good and fast spreading and the potential for rapid proliferationand osteogenic differentiation. It is important to note that, for UFG series, no noticeableeffect of the type and conditions of etching on cell morphology was found. Thus, theUFG structure of titanium is a sufficient condition for favorable adhesion and spreadingof MG-63 osteoblast-like cells. In turn, the samples of the CG series had change in cellmorphology which was observed under different etching conditions (Figure 4) and the CGstructure is not sufficient for successful adhesion and rapid spreading of MG-63 cells.
In the study of cell proliferation, the difference between the control and studiedsamples is very clear (Figure 7). At the same time, there are also noticeable differencesbetween similar samples of the UFG and CG series. At the maximum cultivation time(7 days), the advantage of most samples of the UFG series over CG ones is also significant.However, at shorter times, the difference was not observed, and the main proliferationdetermining factors were morphology, topography, and surface composition.
MG-63 osteoblast-like cell differentiation was studied using markers of early andlate differentiation: ALP and OPN, respectively. ALP is a dephosphorylation catalystthat promotes the formation of crystallization centers of the inorganic component ofbone tissue—hydroxyapatite [31]. OPN is a protein that plays an important role in bone

Metals 2021, 11, 510 12 of 20
remodeling during osteosynthesis. So the OPN expression characteristics are indicatorsof the late osseointegration stages [31]. Considering an ALP activity and OPN expression,not only absolute values are important, but also their dynamics. In particular, reaching themaximum values of ALP and OPN and their subsequent decrease indicates the completionof certain stages of osteoblast differentiation.
Features of ALP activity and OPN expression changes of various samples indicate asignificant effect of etching conditions on differentiation (Figures 7 and 8). However, theobtained data also reveals the difference between the UFG and CG series. For etched UFGsamples, the maximum ALP activity was observed at 7 days, and the OPN expression wasabout 14. For the samples of the CG series, the dynamics of ALP and OPN was unclear. Aclear maxima or change in the ALP activity and OPN production were not observed at thestudied times and it were probably in the intermediate values of 7–14, 14–28 days. As inthe case of studying the morphology of the cells, the dynamics of APL activity and OPNexpression on the UFG samples were more similar to each other than on the CG samples.
To date, a large number of works have been published where the advantage of UFGtitanium compared to CG analogues is shown based on in vitro tests using osteoblast-likecells (Table 4): In the study of Nie et al. [32] the preferential attachment, viability of MG-63cells and promotion of ALP activity were showed. Zheng et al. [33] also revealed the en-hanced cells adhesion and proliferation of MG-63 cells on UFG-Ti compared to CG-Ti. Muchmore research has been done using MC3T3-E1 preosteoblasts cells. A number of studieshave demonstrated the advantage of UFG titanium in adhesion and spreading [34–36],viability and proliferation [34–38], and also ALP activity and OPN expression [35]. Thepositive effect of the UFG structure was found both for polished samples [32,34,37,38], andfor samples with a rough surface that were obtained either by chemical etching in HCland NaOH [33], SLA technology [36] or grit-blasting using hydroxyapatite particles [35].However, it is worth noting that the above described positive effects of the UFG structureare often observed only at certain time intervals. For example Zheng et al. [33] showedthe advantage of UFG titanium in adhesion only at the early stages (4 h) of MG-63 cellscultivation, and vice versa in proliferation at later ones (9 days). Zhao et al. [39] also notedno difference in proliferation of MC3T3-E1 cells after 7 days of cultivation and ALP activityafter 14 and 21 days. The results of our study also showed a significant advantage ofthe UFG samples in comparison with CG ones in adhesion, proliferation at late stages ofcultivation (7 days), higher ALP activity and faster achievement of its maximum values.However, in terms of OPN expression, the superiority of the UFG series samples cannot beasserted with certainty.
Table 4. Affect an UFG structure on in vitro cellular response.
Treatment
CG-Ti/UFG-TiGrain Size, µmRoughness, nm
Wettability, ◦Cell Type In Vitro Results:
Advantage of UFG Over CG Titanium Ref
No difference in the cell attachment andproliferation on CG and UFG samples up to7 days in culture. Similar ALP activities on
UFG and CG after 14 and 21 days
ECAPAnnealingpolishing
-/0.28 humanosteoblast-like
MG-63[39]120 ± 33/56.9 ± 9.
66.2 ± 4.0/57.9 ± 2.4
ECAPpolishing
-/0.25osteoblast cell lines
MG-63
Preferential attachment and viabilityThe ALP activity was promoted on
UFG samples[32]-/-
-/-
ECAPEtching in HClImmersion in
NaOH
-/0.28hierarchicalporous surface
osteoblast-likeMG-63
Enhanced cells adhesion (4 h) andproliferation (9 days) both for smooth and
surface modified UFG. No affect in adhesionat 24 h and proliferation at 3 and 7 days
[33]

Metals 2021, 11, 510 13 of 20
Table 4. Cont.
Treatment
CG-Ti/UFG-TiGrain Size, µmRoughness, nm
Wettability, ◦Cell Type In Vitro Results:
Advantage of UFG Over CG Titanium Ref
ECAPPolishing
4.5/0.2MC3T3-E1
Enhancement of cell proliferation andviability after 7 and 12 days in culture [37]-/-
-/-
C-ECAPPolishing
10.9/0.24MC3T3-E1
pre-osteoblasticcells
The proliferation of cells on polished UFG-Tiexceeded unpolished CG-Ti 3.04-fold after
72 h[38]
RMS before/afterpolishing:
CG—40.2/0.24 nmUFG—70.2/0.3 nm
HPT (high pressuretorsion)
polishing
-/0.01−0.05 MC3T3 mousepre-osteoblast
Improved cell adhesion and growth rate.Higher density of cells on the surface of
nanograined samples[34]1.9 ± 0.8/1.2 ± 0.4
69.9 ± 5.4/62.0 ± 3.9
ECAP40/0.4 MC3T3
pre-osteoblast cells
The number of attached cells was higher onthe samples having more (0002) plane parallelto the surface regardless of their grain sizes
[40]-/--/-
UFG Ti exhibited better cell adhesion andproliferation after etching than those of theCG. Cells on the rough surface spread well
and developed their fibers widely as adendritic shape
HPT 1
HF etching
118 ± 49/0.1MC3T3-E1
osteoblast cells[41]190 ± 10/279 ± 20
51/40
ECAPgrit-blasting using
HA2 particles
-/0.2–0.3MC3T3-E1 cells
Enhanced cell spreading, attachment, viability.Notably higher ALP and OPN levels in cells [35]1980 ± 290/1910 ± 250
52.5 ± 2.0/45.8 ± 1.6
ECAPSLA
-/0.2–0.3 MC3T3-E1 cellsfrom mouse
calvaria
The adhesion, proliferation and viability ofcells cultured on the UFG-Ti were superior to
that of CG-Ti[36]3.62 ± 0.27/3.85 ± 0.13
106.0 ± 2.9/65.4 ± 2.01 HPT—high pressure torsion; 2 HA—hydroxyapatite.
Despite the large number of studies, the mechanism of the UFG structure influence onthe biomedical properties of titanium is not completely clear. According to most studies,the original polished coarse-grained titanium is hydrophilic. Average values of contactangles for polished CG titanium range within 66.2–74.6◦ [34,39,42–47]. Contact angles ofUFG Ti obtained by the ECAP is in all cases a few degrees less than CG-Ti and varies within69.7–56.2◦ [39,42,43,45,46]. The CG and UFG titanium used in our study had contact anglesof 79 ± 3◦ and 78 ± 4◦ respectively (Table 1). These values were higher than in the moststudies. The contact angles of etched samples of the UFG series are slightly lower than forsimilar CG samples, but the difference is very small. Thus, it is unlikely that the surfacewettability would affect the difference in in vitro results for UFG and CG samples in ourstudy. The chemical composition of the surface is also independent on the grain structure,but is determined by the etching conditions [19]. Thus, significant factors determiningthe difference in the morphology and differentiation of MG-63 cells between the CG andUFG series should be either the grain structure (grain size, structure, size and density ofgrain boundaries), or the features of surface morphology and topography. In our previousstudy [19] it was shown that micro- and nanostructures obtained by etching UFG titaniumwere more uniform and had a more developed surface topography (Table 1) than CGsamples. In addition, depending on the grain structure of titanium, some shape featuresof the resulting structures (Figure 1, samples AP-2) appeared. However, these differenceswere not as large as the differences achieved by changing the etching conditions. At thesame time, the differences in in vitro properties for the CG and UFG series are much greaterthan for samples of the same series, but treated in different etching conditions. Therefore,

Metals 2021, 11, 510 14 of 20
these differences of surface properties arising from etching of UFG and CG titanium canhardly determine the difference in in vitro characteristics of these two series. In addition,in vitro differences were found for the polished UFG and CG titanium samples, which hadvery similar morphology and surface topography.
A more likely reason for the difference in the behavior of osteoblast-like cells maybe the difference in the number and density of intergranular boundaries of UFG and CGtitanium. So recently Lowe et al. [38] found that cell proliferation correlate with the averagegrain boundary length per surface-attached osteoblasts MC3T3-E1. In addition, the surfacetexture can have a great influence on the cellular response. For example Hoseini et al.found that the number of attached MC3T3 pre-osteoblast cells is higher on the sampleshaving more (0002) plane parallel to the surface regardless of their grain sizes [40]. It wasassumed that enhancing the cell substrate interactions arises due to an increase in thenumber of hydroxyl groups, which are more densely packed on basal planes of surface.It was concluded that the texture plays a more important role than the grain size in thebiocompatibility of pure titanium, but the SPD technology that produces UFG Ti has asignificant effect on texture [48]. Surface energy can be an important factor determiningthe adhesion of osteoblasts. Bindu et al. showed in vitro and in vivo that surface stressesand defects of UFG Ti affect wettability and surface energy, which increases fibronectinadsorption and enhances 3T3 fibroblasts attachment [45].
Although most researchers agree that UFG titanium is much better than CG coun-terpart (Table 3), the advantage is not always observed and is often small. The results ofour study do not give an unambiguous answer, but we can confidently state that the useof UFG titanium opens up new opportunities for creating new successful biomaterials incombination with other methods of material modification.
4.2. Affect of Etching Conditions on In Vitro Results
Now a large number of works are based on studies the effect of chemical etching oftitanium in NH4OH/H2O2 and H2SO4/H2O2 on the adhesion, proliferation and differ-entiation of osteoblasts-like cells (Table 5). It should be noted that the physicochemicalcharacteristics of the surface obtained in our work agree with the results of other researchers.Etching in NH4OH/H2O2 leads to the formation of micron/submicron structures [49] anda hydrophobic surface during storage of samples in air [50]. Etching in H2SO4/H2O2 leadsto surface oxidation, an increase in the oxide layer thickness [16] and the formation of ahydrophilic network of nanopores and nanopits [16,51–53].
Nevertheless, despite the similarity of the physicochemical properties of the samples,there is a significant difference in the results of in vitro studies by various researchers.It was shown in [16] that etching in NH4OH/H2O2 did not affect adhesion, but at thesame time has a negative effect on the viability and proliferation of MC3T3-E1 osteoblasts,and also reduces mineralization after 14 days of cultivation. Deterioration of adhesion,proliferation, and differentiation of MC3T3-E1 cell also was shown by us previously forUFG titanium samples etched both in NH4OH/H2O2 and H2SO4/H2O2 [22]. On the otherhand, Yuan et al. [54] showed that etching in NH4OH/H2O2 has a small but still positiveeffect on MG63 preosteoblasts attachment, proliferation and osteogenic differentiation(Table 5). The beneficial effects of NH4OH/H2O2 treatment on MG63 cells attachment area,proliferation rate, ALP activity and OPN production were also showed by Zhang et al. [49].The results of in vitro studies of samples etched in H2SO4/H2O2 [16,52,53,55–57] weremore unambiguous and show that such treatment significantly improves the adhesion,proliferation and differentiation of MG-63 and MC3T3 pre-osteoblasts.

Metals 2021, 11, 510 15 of 20
Table 5. Affect piranha etching on in vitro cellular response.
Treatment Surface Characteristics In Vitro Results Ref
E-ultrasonically etching inNH4OH/H2O2 for 2 h at 45 ◦C
SE—SLA 1 + E
Hierarchical structures withmicro holes of 10–30 µm in
diameter and nano pits of tensnanometers in diameter on E
and SE
Boost of osteoblasts MG63 attachment,proliferation and osteogenic differentiation
on E and especially on SE.[54]
NH4OH/H2O2 (1:3, v/v)—E(plates), EB (bricks)NH4OH/H2O2 +HCl/H2SO4—DE
E, DE: holes of 10–20 µmE, DE, EB are hydrophobic, EB
stayed hydrophilic after 5days’ exposure to air.
Human osteoblast-like MG63 cells culturedon E and EB showed higher proliferation rateand attachment area than on DE and P. E andDE showed higher ALP activity after 7 and14 days, while EB showed the highest OPN
production after 21 days.
[49]
NH4OH/H2O2 (50%/30%)H2SO4/H2O2 (36N/30%)
AP- pits diameter 50–100 nm,raising the percentage ofperoxide resulted in an
increase of the pit diameter,SP—spongelike network of
nanopores
NH4OH/H2O2—No impact on adhesion,but decrease the number of osteoblasts
MC3T3-E1.H2SO4/H2O2 improve adhesion and
spreading, accelerating proliferation anddifferentiation
[16]
NH4OH/H2O2 (50%/30%)H2SO4/H2O2 (36N/30%)
v/v ratios—7/3
microstructures,nanostructures, and
hierarchicalmicro-/nanostructures
Deterioration of adhesion, proliferation, anddifferentiation of MC3T3-E1 osteoblasts cell
for etched samples as compared to thenon-treated ones
[22]
ECAPH2SO4/H2O2 3:1 v/v 2 h
Nanopits, sponge-likestructure, sharp groves
distributed uniformly withhigh surface roughness
Contact angle beforeetching—58.8◦,After—43.2◦
adhesion and proliferation of hFOB 3 cells onECAP and etched ECAP samples was found
to be superior to that of controlunprocessed sample.
the formation of apatite on the piranhatreated samples containing OH− was
improved
[55]
H2SO4/H2O23:1 ratio, 2 h
evenly distributed nanopitlike structures, wettability
after etching ~60◦
Human osteosarcoma cell lines MG-63cultivated on piranha treated Ti showed
higher viability[53]
10N H2SO4 and 30% H2O2 (1:1v/v) for 4 h at RT 4 under agitation network of nanopores
2 BMP-9 increased pre-osteoblasticMC3T3-E1 differentiation irrespective of Ti
surface topography; however, the cells grownon Ti-Nano were more responsible to BMP-9
[52]
10N H2SO4 and 30% H2O2 (1:1v/v) at RT 4 under agitation, 4 h nanotopography nanotopography induces osteoblast
MC3T3-E1 differentiation [56]
concentrated H2SO4 (98% massfraction) and 30% H2O2 (1:1 v/v)
at RT 4 1.5 h
Nanotopographymono-planar nanoporous
surface with a pore diameterof 20 ± 5 nm
Increases in the adhesion formation perMC3T3-E1 cell area, focal adhesion length,and maturity on the nanoporous surface.
Gene expression for various focal adhesionmarkers was significantly increased. More
filopodia on cells grown on the nanoporoussurface
[57]
50:50 mixture of 96% H2SO4 and30% aqueous H2O2 (cooling bath)
(10 mL/disc) and kept for 1.5 hunder agitation
Hydrophilic after etchingHydrophobic after aging
Aging for 4 month leads tocrystallization
No difference in mouse calvaria-derivedMC3T3 osteoblasts adhesion, spreading and
growth on amorphous and crystallinesurfaces. The number of focal adhesions was
similar, cells on the amorphous surfaceexhibited a higher frequency of mature
adhesions
[58]
1 SLA—Sandblasting and acid-etching; 2 BMPs—bone morphogenetic proteins; 3 human fetal osteoblast; 4 RT—room temperature.

Metals 2021, 11, 510 16 of 20
Of particular interest is the work [55], in which an adhesion and viability/proliferationof human fetal osteoblast (hFOB) cells were studied on polished and etched in H2SO4/H2O2UFG titanium. The authors demonstrated a positive effect of the combination of UFGstructure and etching, but that only etching had a significantly smaller effect on adhesionand proliferation than combination of etching and UFG structuring. The results of our studyalso showed that the grain structure of titanium significantly influenced the morphologyand differentiation of osteoblast-like cells, but the conditions of chemical etching turnedout to be an equally important factor influencing proliferation and differentiation.
As mentioned above, no any effect of etching conditions was found on the cell mor-phology for the UFG series; however, for CG titanium, this effect is clearly noticeable.Samples without developed topography (CG-Ti and CG-SP-15) showed low spreading,while samples with nanostructures (CG-AP-15) and hybrid nano/microstructures (CG-SP-24) strongly spread and had rounded cells with long appendages (Figure 5). The CG-AP-2,which has the developed nanotopography and microscale pits, showed the best spread-ing and ability to form aggregates of cells. Thus, morphology and surface topographydetermined the morphology and spreading of MG-63 cells for CG samples. Many re-ports indicate that osteogenic cells tend to attach and migrate significantly better ontohydrophilic surfaces rather than hydrophobic material due to high surface energy [3,41,59].Although there are a number of works showing that the difference is either absent orminimal. For example Contreras et al. found no difference in spreading and adhesion ofosteoblasts MC3T3 on the surface of samples with the same morphology, but different wet-tability and crystal structure [58]. It is noteworthy that in our study, hydrophilic samples(CG-Ti, CG-SP-15, CG-SP-24) showed even worse cell morphology than hydrophobic ones(CG-AP-2 and CG-AP-15). Therefore, we can assume a minimal effect of the wettabilityon the morphology of MG-63 cells, but the morphology and surface topography play themain role.
The proliferation of MG-63 cells is significantly increased for etched samples as com-pared to non-etched ones, which is especially noticeable at maximum study times (Figure 7).It is also clearly noticeable that the more developed the relief and morphology, the fasterproliferation rate. However, it is worth noting a considerable difference between thesamples of polished titanium (UFG-Ti, CG-Ti) and etched in H2SO4/H2O2 for 15 min(UFG-SP-15, CG-SP-15). Despite the absence of any structures and the flat surface of thesesamples, the latter show much more proliferative activity than the former. The differenceis obviously due to the greater thickness of the oxide layer and the number of hydroxylgroups on the etched surface. Thus, surface morphology and topography play a decisiverole in the proliferation of MG-63 cells, but the surface composition and grain structure oftitanium (see Section 4.1.) also significantly affect proliferation.
The nature of osteogenic differentiation, as shown above, is significantly influencedby the grain structure of titanium. The effect of chemical etching is also clearly noticeable,however, it is impossible to conclude unambiguously about the positive or negative effectof formed nano and microstructures on osteogenic differentiation. For the UFG series,etched samples reach maximum ALP activity faster than the original polished titanium, butthe higher ALP level was on the UFG-SP-15 sample, which did not had a developed surfacetopography and morphology. In terms of OPN expression, the difference between thesamples of the UFG series is minimal. For the CG series, it is worth noting the relatively highvalues of ALP activity and OPN expression of the samples without developed morphology(CG-Ti and CG-SP-15).
In the general case, the results obtained by us correlate with the literature data. Thedifference in a number of in vitro tests between the results of this study and the literaturedata may be associated with differences in the topography, morphology, and compositionof the surface of the samples, which occur with the smallest changes in the etching orthe properties of the original titanium. For example, Zhang et al. found that there is adifference in surface morphology and in vitro results for rods and disks etched under the

Metals 2021, 11, 510 17 of 20
same conditions, and the resulting micro/nanostructures are significantly better in ALPactivity and OPN expression than micron/submicron structures [49].
5. Conclusions
1. Varying the etching duration and the type of etching solution (H2SO4/H2O2 orNH4OH/H2O2) allows creating nano and microstructures of various morphology,topography, composition, and wettability on the surface of CG and UFG titanium.Etching of titanium in H2SO4/H2O2 leads to oxidation and an increase in the contentof hydroxyl groups on the surface, which increases its hydrophilicity. Etching inNH4OH/H2O2 does not lead to oxidation and reduces the amount of hydroxylgroups on the surface.
2. The conditions of chemical etching and the grain structure of the initial titaniumhave practically no effect on the viability and have no cytotoxic effect on MG-63osteoblast-like cells.
3. UFG structure of titanium has a positive and decisive effect on the morphology andspreading of MG-63 cells. The cells on the etched UFG Ti have round shape, quicklyform a monolayer and form cell strands, which indicates good and fast spreading andthe potential for rapid proliferation and differentiation in the osteogenic direction.
4. Morphology and spreading MG-63 cells cultured for 24 h on samples of the CG seriesis worse than for the UFG series. However, these characteristics can be significantlyimproved by chemical etching and the creation of micro- and nanostructures onthe surface.
5. UFG structure accelerates the proliferation of MG-63 cells at the later stages of thestudy (7 days); however, the factors of morphology, topography, and surface composi-tion have a much greater influence.
6. Differentiation of MG-63 cells in the osteogenic direction is typical for all studiedsamples. The ALP activity dynamics of etched UFG titanium had a maximum, butfor the CG series it does not appear. Nevertheless, the results of ALP activity andOPN expression studies have shown that the characteristics of differentiation areinfluenced by both grain structure and etching conditions.
Supplementary Materials: The following are available online at https://www.mdpi.com/2075-4701/11/3/510/s1, Figure S1: XPS Ti2p spectra: (a) UFG-Ti; (b) UFG-SP-15; (c) UFG-SP-24; (d) UFG-AP-15; (e) UFG-AP-2, Figure S2: XPS O1s spectra: (a) UFG-Ti; (b) UFG-SP-15; (c) UFG-SP-24; (d)UFG-AP-15; (e) UFG-AP-2, Figure S3: TOF-SIMS spectra of positive ions: (a) UFG-Ti; (b) UFG-SP-24;(c) UFG-AP-2, Figure S4: TOF-SIMS spectra of positive ions: (a) UFG-Ti; (b) UFG-SP-24; (c) UFG-AP-2,Figure S5: The morphology of MG-63 cells co-incubated after 24 h of cultivation on plastic cultureplate. Scale bar—100 µm, Figure S6: MG-63 cells proliferation activity after co-incubation. Data arepresented as mean ± S.D. from five independent series of experiments (p < 0.05), Figure S7: Alkalinephosphatase production by MG-63 cells. Each value represents mean ± S.D. from five independentexperiments (p < 0.05), Figure S8: Osteopontin production by MG-63 cells. Each value representsmean ± S.D. from five independent experiments (p < 0.05).
Author Contributions: Conceptualization, D.N. and E.Z.; methodology, D.N., M.S. and E.Z.; vali-dation, D.N. and V.S.; formal analysis, I.M. and D.N.; investigation, D.N., N.Y., M.S.; resources, E.Z.and M.M.; data curation, D.N. and M.M.; writing—original draft preparation, D.N., N.Y., I.M. andM.S.; writing—review and editing, D.N., E.Z., M.M., V.S. and M.S.; visualization, D.N. and I.M.;supervision, V.S.; project administration, E.Z., V.S. and D.N. All authors have read and agreed to thepublished version of the manuscript.
Funding: The research was conducted under the financial support the Russian Science Foundationgrant (project No. 20-73-00067).
Institutional Review Board Statement: Not applicable.
Informed Consent Statement: Not applicable.

Metals 2021, 11, 510 18 of 20
Data Availability Statement: The main data had been provided in the paper and supplementarymaterial. Any other raw/processed data required to reproduce the findings of this study are availablefrom the corresponding author upon request.
Acknowledgments: This research was conducted using the equipment of the resource centers ofthe Research Park of the St. Petersburg State University “Innovative Technologies of CompositeNanomaterials”, “Center for Physical Methods of Surface Investigation”, and “NanotechnologyInterdisciplinary Center”. The authors are grateful to Ruslan Valiev for the provided samples ofUFG titanium.
Conflicts of Interest: The authors declare no conflict of interest.
References1. Geetha, M.; Singh, A.K.; Asokamani, R.; Gogia, A.K. Ti Based Biomaterials, the Ultimate Choice for Orthopaedic Implants-A
review. Prog. Mater. Sci. 2009, 54, 397–425. [CrossRef]2. Li, Y.; Yang, C.; Zhao, H.; Qu, S.; Li, X.; Li, Y. New Developments of Ti-Based Alloys for Biomedical Applications. Materials 2014,
7, 1709–1800. [CrossRef] [PubMed]3. Brunette, D.M.; Tengvall, P.; Textor, M.; Thomsen, P. Titanium in Medicine; Springer: Berlin/Heidelberg, Germany; New York, NY,
USA, 2001; pp. 1–1019.4. Chen, Q.; Thouas, G.A. Metallic Implant Biomaterials. Mater. Sci. Eng. R Rep. 2015, 87, 1–57. [CrossRef]5. Zhang, L.C.; Chen, L.Y. A Review on Biomedical Titanium Alloys: Recent Progress and Prospect. Adv. Eng. Mater. 2019, 21,
1801215. [CrossRef]6. Matusiewicz, H. Potential Release of in vivo Trace Metals from Metallic Medical Implants in the Human Body: From Ions to
Nanoparticles-A Systematic Analytical Review. Acta Biomater. 2014, 10, 2379–2403. [CrossRef] [PubMed]7. Ortiz, A.J.; Fernandez, E.; Vicente, A.; Calvo, J.L.; Ortiz, C. Metallic Ions Released from Stainless Steel, Nickel-Free, and Titanium
Orthodontic Alloys: Toxicity and DNA Damage. Am. J. Orthod. Dentofac. Orthop. 2011, 140, e115–e122. [CrossRef]8. Valiev, R.Z.; Zhilyaev, A.P.; Langdon, T.G. Bulk Nanostructured Materials: Fundamentals and Applications; John Wiley &. Sons, Inc.:
Hoboken, NJ, USA, 2014; pp. 1–440.9. Mishnaevsky, L.; Levashov, E.; Valiev, R.Z.; Segurado, J.; Sabirov, I.; Enikeev, N.; Prokoshkin, S.; Solov’yov, A.V.; Korotitskiy, A.;
Gutmanas, E.; et al. Nanostructured Titanium-Based Materials for Medical Implants: Modeling and Development. Mater. Sci.Eng. R Rep. 2014, 81, 1–19. [CrossRef]
10. Lowe, T.C.; Valiev, R.Z. Frontiers for Bulk Nanostructured Metals in Biomedical Applications. In Advanced Biomaterials andBiodevices; Tiwari, A., Nordin, A.N., Eds.; JohnWiley & Sons, Inc.: Hoboken, NJ, USA, 2014; pp. 1–52.
11. Semenova, I.P.; Polyakova, V.V.; Dyakonov, G.S.; Polyakov, A.V. Ultrafine-Grained Titanium-Based Alloys: Structure and ServiceProperties for Engineering Applications. Advanced Engineering Materials 2019, 22, 1900651. [CrossRef]
12. Bagherifard, S.; Ghelichi, R.; Khademhosseini, A.; Guagliano, M. Cell Response to Nanocrystallized Metallic Substrates ObtainedThrough Severe Plastic Deformation. ACS Appl. Mater. Interfaces 2014, 6, 7963–7985. [CrossRef]
13. Sotniczuk, A.; Garbacz, H. Nanostructured Bulk Titanium with Enhanced Properties—Strategies and Prospects for DentalApplications. Adv. Eng. Mater. 2021, 202000909, 1–19. [CrossRef]
14. Masrouri, M.; Faraji, G.; Pedram, M.S.; Sadrkhah, M. In-vivo Study of Ultrafine-Grained CP-Ti Dental Implants Surface Modifiedby SLActive with Excellent Wettability. Int. J. Adhes. Adhes. 2020, 102, 102684. [CrossRef]
15. Pippenger, B.E.; Rottmar, M.; Kopf, B.S.; Stubinger, S.; Dalla Torre, F.H.; Berner, S.; Maniura-Weber, K. Surface Modification ofUltrafine-Grained Titanium: Influence on Mechanical Properties, Cytocompatibility, and Osseointegration Potential. Clin. Oral.Implant. Res. 2019, 30, 99–110. [CrossRef]
16. Vetrone, F.; Variola, F.; De Oliveira, P.T.; Zalzal, S.F.; Yi, J.-H.; Sam, J.; Bombonato-Prado, K.F.; Sarkissian, A.; Perepichka, D.F.;Wuest, J.D.; et al. Nanoscale Oxidative Patterning of Metallic Surfaces to Modulate Cell Activity and Fate. Nano Lett. 2009, 9,659–665. [CrossRef]
17. Variola, F.; Brunski, J.B.; Orsini, G.; Tambasco de Oliveira, P.; Wazen, R.; Nanci, A. Nanoscale Surface Modifications of MedicallyRelevant Metals: State-of-the Art and Perspectives. Nanoscale 2011, 3, 335–353. [CrossRef]
18. Richert, L.; Vetrone, F.; Yi, J.-H.; Zalzal, S.F.; Wuest, J.D.; Rosei, F.; Nanci, A. Surface Nanopatterning to Control Cell Growth. Adv.Mater. 2008, 20, 1488–1492. [CrossRef]
19. Nazarov, D.V.; Zemtsova, E.G.; Solokhin, A.Y.; Valiev, R.Z.; Smirnov, V.M. Modification of the Surface Topography and Composi-tion of Ultrafine and Coarse Grained Titanium by Chemical Etching. Nanomaterials 2017, 7, 15. [CrossRef]
20. Nazarov, D.V.; Zemtsova, E.G.; Valiev, R.Z.; Smirnov, V.M. Formation of Micro- and Nanostructures on the Nanotitanium Surfaceby Chemical Etching and Deposition of Titania Films by Atomic Layer Deposition (ALD). Materials 2015, 8, 8366–8377. [CrossRef]
21. Moulder, J.F.; Stickle, W.F.; Sobol, P.E.; Bomben, K.D. Handbook of X-ray Photoelectron Spectroscopy: A Reference Book of StandardSpectra for Identification and Interpretation of XPS Data, 2nd ed.; Physical Electronics, Inc.: Eden Prairie, MN, USA, 1995; pp. 1–261.
22. Nazarov, D.V.; Smirnov, V.M.; Zemtsova, E.G.; Yudintceva, N.M.; Shevtsov, M.A.; Valiev, R.Z. Enhanced OsseointegrativeProperties of Ultra-Fine-Grained Titanium Implants Modified by Chemical Etching and Atomic Layer Deposition. ACS Biomater.Sci. Eng. 2018, 4, 3268–3281. [CrossRef]
Metals 2021, 11, 510 19 of 20
23. Chatakun, P.; Nunez-Toldra, R.; Diaz Lopez, E.J.; Gil-Recio, C.; Martinez-Sarra, E.; Hernandez-Alfaro, F.; Ferres-Padro, E.;Giner-Tarrida, L.; Atari, M. The Effect of Five Proteins on Stem Cells Used for Osteoblast Differentiation and Proliferation: ACurrent Review of the Literature. Cell. Mol. Life Sci. 2014, 71, 113–142. [CrossRef]
24. Zemtsova, E.G.; Yudintceva, N.M.; Morozov, P.E.; Valiev, R.Z.; Smirnov, V.M.; Shevtsov, M.A. Improved OsseointegrationProperties of Hierarchical Microtopographic/Nanotopographic Coatings Fabricated on Titanium Implants. Int. J. Nanomedicine2018, 13, 2175–2188. [CrossRef]
25. Medvedev, A.E.; Neumann, A.; Ng, H.P.; Lapovok, R.; Kasper, C.; Lowe, T.C.; Anumalasetty, V.N.; Estrin, Y. Combined Effect ofGrain Refinement and Surface Modification of Pure Titanium on the Attachment of Mesenchymal Stem Cells and Osteoblast-LikeSaOS-2 Cells. Mater. Sci. Eng. C. 2017, 71, 483–497. [CrossRef] [PubMed]
26. Biesinger, M.C.; Lau, L.W.M.; Gerson, A.R.; Smart, R.S.C. Resolving Surface Chemical States in XPS Analysis of First RowTransition Metals, Oxides and Hydroxides: Sc, Ti, V., Cu and Zn. Appl. Surf. Sci. 2010, 257, 887–898. [CrossRef]
27. Yi, J.-H.; Bernard, C.; Variola, F.; Zalzal, S.F.; Wuest, J.D.; Rosei, F.; Nanci, A. Characterization of a Bioactive Nanotextured SurfaceCreated by Controlled Chemical Oxidation of Titanium. Surf. Sci. 2006, 600, 4613–4621. [CrossRef]
28. Lu, X.; Wang, Y.; Yang, X.; Zhang, Q.; Zhao, Z.; Weng, L.; Leng, Y. Spectroscopic Analysis of Titanium Surface Functionalgroups under Various Surface Modification and Their Behaviors In Vitro and In Vivo. J. Biomed. Mater. Res. A 2007, 84, 523–534.[CrossRef]
29. Kuznetsov, M.V.; Zhuravlev, J.F.; Zhilyaev, V.A.; Gubanov, V.A. XPS Study of the Nitrides, Oxides and Oxynitrides of Titanium. J.Electron Spectrosc. 1992, 58, 1–9. [CrossRef]
30. Martin, H.J.; Schulz, K.H.; Walters, K.B. Piranha Treated Titanium Compared to Passivated Titanium as Characterized by XPS.Surf. Sci. Spectra 2008, 15, 23–30. [CrossRef]
31. Lian, J.B.; Stein, G.S. Concepts of Osteoblast Growth and Differentiation: Basis for Modulation of Bone Cell Development andTissue Formation. Crit. Rev. Oral. Biol. Med. 1992, 3, 269–305. [CrossRef]
32. Nie, F.L.; Zheng, Y.F.; Wei, S.C.; Wang, D.S.; Yu, Z.T.; Salimgareeva, G.K.; Polyakov, A.V.; Valiev, R.Z. In Vitro and In Vivo Studieson Nanocrystalline Ti Fabricated by Equal Channel Angular Pressing with Microcrystalline CP Ti as Control. J. Biomed. Mater.Res. A 2013, 101, 1694–1707. [CrossRef]
33. Zheng, C.Y.; Nie, F.L.; Zheng, Y.F.; Cheng, Y.; Wei, S.C.; Valiev, R.Z. Enhanced In Vitro Biocompatibility of Ultrafine-GrainedTitanium with Hierarchical Porous Surface. Appl. Surf. Sci. 2011, 257, 5634–5640. [CrossRef]
34. Faghihi, S.; Azari, F.; Zhilyaev, A.P.; Szpunar, J.A.; Vali, H.; Tabrizian, M. Cellular and Molecular Interactions between MC3T3-E1Pre-Osteoblasts and Nanostructured Titanium Produced by High-Pressure Torsion. Biomaterials 2007, 28, 3887–3895. [CrossRef]
35. Park, J.W.; Kim, Y.J.; Park, C.H.; Lee, D.H.; Ko, Y.G.; Jang, J.H.; Lee, C.S. Enhanced Osteoblast Response to an Equal ChannelAngular Pressing-Processed Pure Titanium Substrate with Microrough Surface Topography. Acta Biomater. 2009, 5, 3272–3280.[CrossRef]
36. An, B.; Li, Z.; Diao, X.; Xin, H.; Zhang, Q.; Jia, X.; Wu, Y.; Li, K.; Guo, Y. In Vitro and In Vivo Studies of Ultrafine-Grain Ti asDental Implant Material Processed by ECAP. Mater. Sci. Eng. C Mater. Biol. Appl. 2016, 67, 34–41. [CrossRef]
37. Estrin, Y.; Kasper, C.; Diederichs, S.; Lapovok, R. Accelerated Growth of Preosteoblastic Cells on Ultrafine Grained Titanium. J.Biomed. Mater. Res. A 2009, 90, 1239–1242. [CrossRef]
38. Lowe, T.C.; Reiss, R.A.; Illescas, P.E.; Davis, C.F.; Connick, M.C.; Sena, J.A. Effect of Surface Grain Boundary Density onPreosteoblast Proliferation on Titanium. Mater. Res. Lett. 2020, 8, 239–246. [CrossRef]
39. Zhao, M.; Wang, Q.; Lai, W.; Zhao, X.; Shen, H.; Nie, F.; Zheng, Y.; Wei, S.; Ji, J. In Vitro Bioactivity and BiocompatibilityEvaluation of Bulk Nanostructured Titanium in Osteoblast-Like Cells by Quantitative Proteomic Analysis. J. Mater. Chem. B 2013,1, 1926–1938. [CrossRef]
40. Hoseini, M.; Bocher, P.; Shahryari, A.; Azari, F.; Szpunar, J.A.; Vali, H. On the Importance of Crystallographic Texture in theBiocompatibility of Titanium Based Substrate. J. Biomed. Mater. Res. A 2014, 102, 3631–3638. [CrossRef]
41. Baek, S.M.; Shin, M.H.; Moon, J.; Jung, H.S.; Lee, S.A.; Hwang, W.; Yeom, J.T.; Hahn, S.K.; Kim, H.S. Superior Pre-OsteoblastCell Response of Etched Ultrafine-Grained Titanium with a Controlled Crystallographic Orientation. Sci. Rep. 2017, 7, 44213.[CrossRef]
42. Kim, T.N.; Balakrishnan, A.; Lee, B.C.; Kim, W.S.; Smetana, K.; Park, J.K.; Panigrahi, B.B. In Vitro Biocompatibility of EqualChannel Angular Processed (ECAP) Titanium. Biomed. Mater. 2007, 2, S117–S120. [CrossRef]
43. Estrin, Y.; Ivanova, E.P.; Michalska, A.; Truong, V.K.; Lapovok, R.; Boyd, R. Accelerated Stem Cell Attachment to Ultrafine GrainedTitanium. Acta Biomater. 2011, 7, 900–906. [CrossRef]
44. Lai, M.; Cai, K.; Hu, Y.; Yang, X.; Liu, Q. Regulation of the Behaviors of Mesenchymal Stem Cells by Surface NanostructuredTitanium. Colloids Surf. B Biointerfaces 2012, 97, 211–220. [CrossRef]
45. Bindu, S.; Sanosh, K.P.; Smetana, K.; Balakrishnan, A.; Kim, T.N. An In Vivo Evaluation of Ultra-Fine Grained Titanium Implants.J. Mater. Sci. Technol. 2009, 25, 556–560.
46. Attarilar, S.; Salehi, M.T.; Al-Fadhalah, K.J.; Djavanroodi, F.; Mozafari, M. Functionally Graded Titanium Implants: CharacteristicEnhancement Induced by Combined Severe Plastic Deformation. PLoS ONE 2019, 14, e0221491. [CrossRef]
47. Kubacka, D.; Yamamoto, A.; Wiecinski, P.; Garbacz, H. Biological Behavior of Titanium Processed by Severe Plastic Deformation.Appl. Surf. Sci. 2019, 472, 54–63. [CrossRef]
Metals 2021, 11, 510 20 of 20
48. Kowalczyk-Gajewska, K.; Sztwiertnia, K.; Kawałko, J.; Wierzbanowski, K.; Wronski, M.; Frydrych, K.; Stupkiewicz, S.; Petryk, H.Texture Evolution in Titanium on Complex Deformation Paths: Experiment and Modelling. Mater. Sci. Eng. A 2015, 637, 251–263.[CrossRef]
49. Zhang, J.; Xi, Y.; Zuo, J.; Li, J.; Wei, Q.; Yu, Z.; Tang, Z. Cell Responses to Titanium Treated by a Sandblast-Free Method for ImplantApplications. Mater. Sci. Eng. C 2017, 78, 1187–1194. [CrossRef]
50. Kang, Y.; Ren, X.; Yuan, X.; Ma, L.; Xie, Y.; Bian, Z.; Zuo, J.; Wang, X.; Yu, Z.; Zhou, K.; et al. The Effects of Combined Micron-scaleSurface and Different Nanoscale Features on Cell Response. Adv. Mater. Sci. Eng. 2018, 2018, 1–9. [CrossRef]
51. Rosa, A.L.; Kato, R.B.; Castro Raucci, L.M.; Teixeira, L.N.; de Oliveira, F.S.; Bellesini, L.S.; de Oliveira, P.T.; Hassan, M.Q.;Beloti, M.M. Nanotopography Drives Stem Cell Fate Toward Osteoblast Differentiation Through Alpha1beta1 Integrin SignalingPathway. J. Cell. Biochem. 2014, 115, 540–548. [CrossRef] [PubMed]
52. Souza, A.T.P.; Bezerra, B.L.S.; Oliveira, F.S.; Freitas, G.P.; Bighetti Trevisan, R.L.; Oliveira, P.T.; Rosa, A.L.; Beloti, M.M. Effect ofBone Morphogenetic Protein 9 on Osteoblast Differentiation of Cells Grown on Titanium with Nanotopography. J. Cell. Biochem.2018, 119, 8441–8449. [CrossRef] [PubMed]
53. Kiran, A.S.K.; Sampath Kumar, T.S.; Perumal, G.; Sanghavi, R.; Doble, M.; Ramakrishna, S. Dual Nanofibrous Bioactive Coatingand Antimicrobial Surface Treatment for Infection Resistant Titanium Implants. Prog. Org. Coat. 2018, 121, 112–119. [CrossRef]
54. Yuan, X.; Kang, Y.; Zuo, J.; Xie, Y.; Ma, L.; Ren, X.; Bian, Z.; Wei, Q.; Zhou, K.; Wang, X.; et al. Micro/Nano Hierarchical StructuredTitanium Treated by NH4OH/H2O2 for Enhancing Cell Response. PLoS ONE 2018, 13, e0196366. [CrossRef]
55. Sandeep Kranthi Kiran, A.; Sireesha, M.; Ramalingam, R.; Kizhakeyil, A.; Verma, N.K.; Lakshminarayanan, R.; Sampath Kumar,T.S.; Doble, M.; Ramakrishna, S. Modulation of Biological Properties by Grain Refinement and Surface Modification on TitaniumSurfaces for Implant-Related Infections. J. Mater. Sci. 2019, 54, 13265–13282. [CrossRef]
56. Castro-Raucci, L.M.S.; Francischini, M.S.; Teixeira, L.N.; Ferraz, E.P.; Lopes, H.B.; de Oliveira, P.T.; Hassan, M.Q.; Rosa, A.L.;Beloti, M.M. Titanium With Nanotopography Induces Osteoblast Differentiation by Regulating Endogenous Bone MorphogeneticProtein Expression and Signaling Pathway. J. Cell. Biochem. 2016, 117, 1718–1726. [CrossRef]
57. Bello, G.D.; Fouillen, A.; Badia, A.; Nanci, A. A Nanoporous Titanium Surface Promotes the Maturation of Focal Adhesions andFormation of Filopodia with Distinctive Nanoscale Protrusions by Osteogenic Cells. Acta Biomater. 2017, 60, 339–349. [CrossRef]
58. Rodriguez-Contreras, A.; Bello, G.D.; Nanci, A. Surface Nanoporosity has a Greater Influence on Osteogenic and Bacterial CellAdhesion than Crystallinity and Wettability. Appl. Surf. Sci. 2018, 445, 255–261. [CrossRef]
59. Arima, Y.; Iwata, H. Effect of Wettability and Surface Functional Groups on Protein Adsorption and Cell Adhesion usingWell-Defined Mixed Self-Assembled Monolayers. Biomaterials 2007, 28, 3074–3082. [CrossRef]