The Effects of Accommodations on the Assessment of LEP Students ...
122
NATIONAL CENTER FOR EDUCATION STATISTICS Working Paper Series The Working Paper Series was initiated to promote the sharing of the valuable work experience and knowledge reflected in these preliminary reports. These reports are viewed as works in progress, and have not undergone a rigorous review for consistency with NCES Statistical Standards prior to inclusion in the Working Paper Series. U. S. Department of Education Office of Educational Research and Improvement
Transcript of The Effects of Accommodations on the Assessment of LEP Students ...
NATIONAL CENTER FOR EDUCATION STATISTICS
Working Paper Series
The Working Paper Series was initiated to promote the sharing of the valuable work experience and knowledge reflected in these preliminary reports. These reports are viewed as works in progress, and have not undergone a rigorous review for consistency with NCES Statistical Standards prior to inclusion in the Working Paper Series.
U. S. Department of Education Office of Educational Research and Improvement

NATIONAL CENTER FOR EDUCATION STATISTICS
Working Paper Series
The Effects of Accommodations on the Assessment of LEP Students in NAEP
Working Paper No. 2001–13 September 2001
Contact: Arnold Goldstein Assessment Division
E-mail: [email protected]
U. S. Department of Education Office of Educational Research and Improvement

U.S. Department of Education Rod Paige Secretary Office of Educational Research and Improvement Grover J. Whitehurst Assistant Secretary National Center for Education Statistics Gary W. Phillips Acting Commissioner The National Center for Education Statistics (NCES) is the primary federal entity for collecting, analyzing, and reporting data related to education in the United States and other nations. It fulfills a congressional mandate to collect, collate, analyze, and report full and complete statistics on the condition of education in the United States; conduct and publish reports and specialized analyses of the meaning and significance of such statistics; assist state and local education agencies in improving their statistical systems; and review and report on education activities in foreign countries. NCES activities are designed to address high priority education data needs; provide consistent, reliable, complete, and accurate indicators of education status and trends; and report timely, useful, and high quality data to the U.S. Department of Education, the Congress, the states, other education policymakers, practitioners, data users, and the general public. We strive to make our products available in a variety of formats and in language that is appropriate to a variety of audiences. You, as our customer, are the best judge of our success in communicating information effectively. If you have any comments or suggestions about this or any other NCES product or report, we would like to hear from you. Please direct your comments to: National Center for Education Statistics Office of Educational Research and Improvement U.S. Department of Education 1990 K Street NW Washington, DC 20006 September 2001 The NCES World Wide Web Home Page is http://nces.ed.gov Suggested Citation U.S. Department of Education, National Center for Education Statistics. The Effects of Accommodations on the Assessment of LEP Students in NAEP, NCES 2001-13, by Jamal Abedi, Carol Lord, Christy Kim, and Judy Miyoshi. Arnold A. Goldstein, project officer. Washington, DC: 2001.

iii
Foreword In addition to official NCES publications, NCES staff and individuals commissioned by NCES produce preliminary research reports that include analyses of survey results, and presentations of technical, methodological, and statistical evaluation issues. The Working Paper Series was initiated to promote the sharing of the valuable work experience and knowledge reflected in these preliminary reports. These reports are viewed as works in progress, and have not undergone a rigorous review for consistency with NCES Statistical Standards prior to inclusion in the Working Paper Series. Copies of Working Papers can be downloaded as pdf files from the NCES Electronic Catalog (http://nces.ed.gov/pubsearch/), or contact Sheilah Jupiter at (202) 502–7444, e-mail: [email protected], or mail: U.S. Department of Education, Office of Educational Research and Improvement, National Center for Education Statistics, 1990 K Street NW, Room 9048, Washington, DC 20006. Marilyn M. Seastrom Ralph Lee Chief Mathematical Statistician Mathematical Statistician Statistical Standards Program Statistical Standards Program

This page intentionally left blank .

The Effects of Accommodations on the
Assessment of LEP Students in NAEP
Prepared by:
Jamal Abedi, University of California Los Angeles/CRESST Carol Lord Christy Kim Judy Miyoshi
Prepared for:
U.S. Department of Education Office of Educational Research and Improvement
National Center for Education Statistics
September 2001

LEP Accommodations on NAEP v
Table of Contents
Executive Summary............................................................................................................................................................7Introduction ....................................................................................................................................................................7Methodology...................................................................................................................................................................8Results............................................................................................................................................................................10
Limitations ...............................................................................................................................................................12Implications and Recommendations...................................................................................................................12
Introduction .......................................................................................................................................................................15Research Question/Hypothesis ................................................................................................................................17
Literature Review .............................................................................................................................................................19Content-Based Performance and Limited English Proficient Students.............................................................19Linguistic Variables and Science Performance ......................................................................................................21Accommodations .........................................................................................................................................................22
State Policies for Accommodations .....................................................................................................................24Problems with Direct Translation........................................................................................................................25Glossary and Dictionary Usage............................................................................................................................26Extended Time ........................................................................................................................................................27
Recommendation for Validity Testing.....................................................................................................................27Methodology......................................................................................................................................................................29
Subjects ..........................................................................................................................................................................29Instruments ...................................................................................................................................................................31
Science Test ..............................................................................................................................................................31Follow-Up Questionnaire......................................................................................................................................34Science Background Questionnaire.....................................................................................................................35Demographic Form ................................................................................................................................................36Science Teacher Questionnaire.............................................................................................................................36Script for Science Test Administrator .................................................................................................................36Test Administrator Feedback Form.....................................................................................................................36
Procedure ......................................................................................................................................................................36Human Subjects Approval....................................................................................................................................36Test Administrators................................................................................................................................................36Site Selection ............................................................................................................................................................37Testing Procedures .................................................................................................................................................37Analysis ....................................................................................................................................................................38
Results.................................................................................................................................................................................39Accommodation Results.............................................................................................................................................39
Classroom Effects....................................................................................................................................................42Findings ....................................................................................................................................................................44
Follow-Up Questionnaires.........................................................................................................................................45Follow-Up Questions, Original Booklet .............................................................................................................46Follow-Up Questions, Dictionary Booklet .........................................................................................................49Follow-Up Questions, Glossary Booklet ............................................................................................................50
Background Questionnaire ........................................................................................................................................54Results of Analyses of Background Questions..................................................................................................54Analyses by Demographic Questions.................................................................................................................54A Language Other than English ..........................................................................................................................55Self-Reported English Proficiency .......................................................................................................................57
Discussion ..........................................................................................................................................................................59Research Hypothesis and Findings .....................................................................................................................59Follow-Up Questions .............................................................................................................................................61Background Questions...........................................................................................................................................61Limitations ...............................................................................................................................................................62Implications and Recommendations...................................................................................................................63
References...........................................................................................................................................................................65

CRESST Draft Deliverablevi
Appendix A........................................................................................................................................................................70Appendix B ........................................................................................................................................................................75Appendix C........................................................................................................................................................................81Appendix D........................................................................................................................................................................85Appendix E ........................................................................................................................................................................89Appendix F ........................................................................................................................................................................95Appendix G........................................................................................................................................................................99Appendix H .....................................................................................................................................................................103
LEP Accommodations on NAEP 7
THE EFFECTS OF ACCOMMODATIONS ON THE ASSESSMENT OF LEP
STUDENTS IN NAEP
Jamal Abedi, Carol Lord, Christy Kim, and Judy Miyoshi
CRESST/University of California, Los Angeles
Executive Summary
Introduction
Recent federal and state legislation, including Goals 2000 and the ImprovingAmerica’s Schools Act (IASA), call for inclusion of all students in large-scaleassessments such as the National Assessment for Educational Progress (NAEP). Thisincludes students with limited English proficiency (LEP). However, we have clearevidence from recent research that students’ language background factors impact theirperformance on content area assessments. For students with limited Englishproficiency, the language of the test item can be a barrier, preventing them fromdemonstrating their knowledge of the content area.
Various forms of testing accommodations have been proposed for LEP students.Empirical studies demonstrate that accommodations can increase test scores for bothLEP and non-LEP students; furthermore, the provision of accommodations has helpedto increase the rate of inclusion for LEP students in the NAEP and other large-scaleassessments. There are, however, some major concerns regarding the use ofaccommodations for LEP students. Among the most important issues are thoseconcerning the validity and feasibility of accommodation strategies.
• Validity: The goal of accommodations is to level the playing field for LEP students,not to alter the construct under measurement. Consequently, if an accommodationsignificantly affects the performance of non-LEP students, the validity of theaccommodation could be questioned.
• Feasibility: For an accommodation strategy to be useful, it must be implementablein large-scale assessments. Strategies that are expensive, impractical, or logisticallycomplicated are unlikely to be widely accepted.

CRESST Draft Deliverable8
The focus of this study was on the validity and feasibility of accommodationstrategies on small-scale level. In order to test for validity, both LEP and non-LEPstudents were tested under accommodated and non-accommodated conditions, andtheir performance was compared. Feasibility was a key consideration; we selectedaccommodation strategies for which implementation would be practical in large-scaleassessments. Since previous studies have identified the non-technical vocabulary of testitems as a source of difficulty for LEP students (Abedi, Lord, and Plummer, 1995;Abedi, Hofstetter, and Lord, 1998), we chose two forms of accommodation targetingthis issue.
Methodology
This pilot study was conducted between November 1999 and February 2000, intwo southern California school districts and at one private school site. The purpose ofthis pilot study was to test the instruments, shed light on the issues concerning theadministration of accommodations, explore the feasibility problems that we mayencounter in the main study and, ultimately, provide data to help us modify the mainstudy design. A total of 422 students and eight teachers, from six school sites (14eighth-grade science classes), participated in this pilot study.
A science test with twenty NAEP items was administered in three forms: onewith the original items (no accommodation), and two with accommodations focusingon potentially difficult English vocabulary. One form of accommodation consisted of acustomized English language dictionary at the end of the test booklet. The other form ofaccommodation consisted of English glosses1 and Spanish translations in the margins ofthe test booklet.
The customized dictionary - used in this study for the first time as anaccommodation for LEP students - contained only words that are included in the testitems. The customized English dictionary is grade appropriate and was compiled byCRESST researchers. Providing full-length English dictionaries to test subjects has twomajor drawbacks: they are difficult to transport and they provide too much informationon the content material being tested. For these reasons, the entries for non-technicalwords contained in the test have been excerpted (with permission from publisher) tocreate customized dictionaries that do not burden administrators and students with the
1 A gloss is an individual definition or paraphrase (plural glosses). According to Webster, a gloss is "a note ofcomment or explanation accompanying a text, as in a footnote or margin." A glossary is a collection of glosses;Webster: a list of difficult, technical, or foreign terms with definitions or translations...." The glosses included briefdefinitions, paraphrases, or translations.

LEP Accommodations on NAEP 9
bulk of a published dictionaries. Unlike the classroom and/or general dictionaries,these customized dictionaries do not contain words that assist the student with testcontent, thereby ensuring the validity of accommodations using a dictionary. Thepronunciation guide, font and type size are identical to that used in the originalreference.
For each test booklet form, a follow-up questionnaire was developed to elicitstudent feedback. The Follow-up questionnaire was placed in the test bookletimmediately after the science test. The questions were tailored to the type of sciencetest the student completed. For example, students who received an accommodationwere asked whether that accommodation helped them answer the science test items.Students’ responses to these questions will be particularly helpful in designing the mainstudy.
Included in the test booklet was also the Science Background Questionnaire whichincluded items selected from both the 1996 NAEP Grade 8 Bilingual Mathematicsbooklet and an earlier CRESST language background study. The questionnaireincluded queries regarding the student’s country of origin, ethnicity, languagebackground, language of instruction in science classes, and native language and Englishproficiency.
In their responses to the Science Background Questionnaire, most of the LEPstudents self-reported their ethnicity as Hispanic, followed by White, Asian, AmericanIndian, and other. Most of the non-LEP students self-reported their ethnicity as White,followed by Hispanic, Asian, Black, American Indian, and other.
A science teacher questionnaire was also introduced midway through the pilotstudy. This form was used at sites 4 through 6 to obtain information from each scienceteacher about each class, including type of science class, language of instruction; sciencetopics covered so far this year, and students’ English proficiency.
Test administrators received a science test administration script and were asked tocomplete a feedback questionnaire after each test administration. Test administratorsdistributed the six test booklets (three accommodation conditions by two forms)randomly within each classroom. The test directions were read aloud to the students.To address the different treatments, general directions were read aloud to the wholeclass, but specific directions were targeted to each treatment group. Students weregiven 25 minutes to complete the 20-item science test, three minutes to complete the

CRESST Draft Deliverable10
Follow-Up Questionnaire, and eight minutes to complete the Science BackgroundQuestionnaire.
Approval to conduct the study was received from the Office for Protection ofResearch Subjects (OPRS) at the University of California, Los Angeles (UCLA). Testadministrators included CRESST research staff, retired teachers, and schooladministrators, who had prior experience with test administration. A letter was sent tothe principal describing the study.
Results
This study examined the effectiveness of accommodations by addressing thedifficulty of English vocabulary within test items in a NAEP science assessment. Wecompared LEP and non-LEP students’ scores on 20 science items under three differentconditions: standard NAEP condition (no accommodation), customized dictionary, andglossary. The analyses provided clear results with respect to the performance levels ofLEP/non-LEP students, the effectiveness of the accommodations for LEP students, andthe validity of the accommodated assessment.
• Performance gap: LEP students performed lower than non-LEP students. For LEPstudents, the mean score was 8.97 (SD = 4.40, n=183) and for non-LEP students themean was 11.66 (SD = 3.68, n=236). The difference between performance of LEP andnon-LEP students is relatively large and is statistically significant (t = 6.83, df = 417,p = .000).
• Effectiveness of accommodations: LEP students performed substantially higherunder the accommodated conditions than under the standard condition. The meanfor the LEP students under the customized dictionary was 10.18 (SD=5.26, n=55);under the glossary condition, the mean was 8.51 (SD=4.72, n=70); and under thestandard condition the mean was 8.36 (SD=4.40, n=58). As the data suggest, LEPstudents did particularly well under the customized dictionary condition. Theresults of an analysis of variance (ANOVA) indicated that the difference betweenmeans for LEP students under the three accommodation conditions was significant(F=3.08, df=2,180, p=.048).
• Validity: The accommodations had no significant effect on the scores of the non-LEPstudents. For non-LEP students, the mean science score for the dictionaryaccommodation was 11.37 (SD=3.79, n=82); for the glossary the mean was 11.96(SD=3.86, n=75); and for the standard condition the mean was 11.71 (SD=3.40, n=79).The results of analysis of variance showed no significant difference between theperformance of non-LEP students under the three conditions (F=.495, df=2, 233,p=.610).

LEP Accommodations on NAEP 11
These results suggest that, first, the customized dictionary enabled LEP students toperform at a significantly higher level. Second, the accommodation strategies used inthis study did not impact the construct, and the validity of the assessment was notcompromised. These results are particularly encouraging, given the ease ofadministration of the accommodations that were used.
In student responses to the Follow-Up Questionnaires, LEP students reportedgreater difficulty with the language of the test items. (Follow-up questionnaires weresimilar but not identical for the three forms of the test.)
• More LEP than non-LEP students indicated there were words that they did notunderstand in the science test.
• LEP students, more than non-LEP students, wanted explanation of some of thedifficult words.
• More LEP than non-LEP students expressed interest in using a dictionaryduring the test.
• LEP students, more than non-LEP students, indicated that it would havehelped them if the test had explained words in another language.
• More LEP than non-LEP students expressed a preference for a dictionaryduring the test.
Analyses based on the background variables showed no significant genderdifferences. However, a significant difference was found between the performance ofstudents who speak only English in the home and those who speak a language otherthan English in the home. Students who speak a language other than Englishperformed significantly lower than the other group. This finding is consistent with theliterature and with the main findings of this study.
Analyses of self-reported data showed that students who speak a language otherthan English in the home indicated that they speak that language more with theirparents and less with their brothers, sisters, and friends. These findings, reflecting ageneration gap, are consistent with the existing literature.
The results of analyses of self-reported data on English proficiency were alsoconsistent with the literature and with the earlier findings of this study. As expected,LEP students reported significantly lower proficiency in English than their non-LEPcounterparts.

CRESST Draft Deliverable12
Limitations
Since this was a pilot study and was planned to test the instruments and logisticsfor the main study, the generalizability of findings of this study is extremely limited.The generalizability of this study is further limited to grade level (Grade 8), content area(science), LEP language background (primarily Spanish), and accommodation type(dictionary and glossary).
It should also be noted that an accommodation for one grade level may notnecessarily be appropriate, or even considered an accommodation, for another gradelevel. Students in lower elementary grades may not know how to use a dictionary ormay be in the process of learning to use a dictionary, whereas students in higherelementary grade levels and above may be accustomed to regularly using a dictionary.For older students, dictionary use during a testing situation is considered anaccommodation while for younger students dictionary use during a testing situationmay not be considered an effective form of accommodation since they may not knowhow to use it.
In an effort to find classrooms with an equal number of LEP and non-LEPstudents, site selection was based on state demographic information at the school sitelevel. However, state demographic information does not necessarily reflect the LEP andnon-LEP distribution for individual classes at a school site. Therefore, site selection inthe main study should be based on demographic information collected at the classroomlevel.
A large proportion of the LEP population in southern California is native Spanishspeaking. Accordingly, for the glossary accommodation we included English glossesand Spanish translations. In our sample, 88% of the LEP students were Hispanic and26% of the non-LEP students were Hispanic. LEP students with first languages otherthan Spanish may have benefited from the English glosses, but the accommodation tellsus little about the potential impact of translations in their first languages.
Implications and Recommendations
This study addresses several major issues concerning accommodations for LEPstudents in NAEP. Although these analyses report on the pilot phase of the study, thereare nevertheless several implications for future NAEP assessments.

LEP Accommodations on NAEP 13
Since NAEP is a large-scale assessment, feasibility considerations are important.NAEP assessments involve a large number of LEP students, so ease of administrationmay be a determining factor. Any element that reduces the burden on states, schools,and students will potentially have a positive impact on future NAEP administrations.Educators are developing accommodation strategies that may reduce the gap betweenLEP and non-LEP scores in large-scale assessments. Not all of these strategies may turnout to be easily administered. One-on-one testing, for example, may be a highlyeffective form of accommodation, but it may not be feasible in large-scale assessmentssuch as the NAEP.
Providing a customized dictionary is a viable alternative to providing traditionaldictionaries. Dictionaries are, in fact, already widely used as instructional aids for LEPstudents, so the concept is not an unfamiliar one for students. Including a customizeddictionary as part of the test booklet can minimize the economic and administrativeburden and may help to overcome shortcomings on the validity of accommodationsusing dictionaries. However, the economic and technical feasibility of providing acustomized dictionary as a potential form of accommodation should be evaluatedthrough cost-benefit analyses.
Gathering additional information about the academic performance and thelanguage proficiency levels of students may help to clarify issues associated withinconsistency in the definition of LEP and the inclusion criteria for standardizedassessments. The reading achievement data from Stanford 9, supplied by the schools,provided valuable information on the language proficiency levels of students, beyondthe LEP designations. Given the inconsistency in the LEP designation criteria,collecting additional information about a student’s academic and language performancewould provide a more comprehensive picture of the student’s academic knowledge.More accurate conclusions would be possible from analyses of contextual data, such asstudents’ performance on other content areas and information on family and languagebackground.
Critical steps to follow: Necessity for the main study
The results of experimentally controlled accommodation studies may provideassistance to NAEP in its future assessments. This study is designed to address two ofthe major issues of concern for NAEP, the validity and feasibility issues. Regardingvalidity, it is important to understand how accommodations impact assessment inNAEP. Any systematic effect of accommodation would impact both the trend and the

CRESST Draft Deliverable14
reporting of NAEP. Regarding feasibility, even a minor modification in the design ofaccommodations - to make accommodation more implementable and logistically easier- would enhance the design for inclusion of students with limited English proficiency.
As indicated earlier, this pilot study was conducted to help in designing the mainstudy. The generalizability of the findings is limited for the following reasons:
• The number of subjects in this pilot study is small; therefore, there may not beenough statistical power to ascertain and estimate effects.
• Due to the nature of a pilot study, instruments and logistics were often modifiedthroughout this pilot study, based on what we learned from the previous stages ofthis study.
• Since this was a pilot study, we did not aim to select a truly representative sample ofstudents.
• Because of time and resource limitations, we included students in grade 8th only. Tobroaden the level of generalizability, other grade levels as well as otheraccommodation strategies should be included.
• We also recommend that we add another language (for example: Chinese) to have amore representational sample.
The main study will greatly increase the generalizability of the findings.

LEP Accommodations on NAEP 15
Introduction
We now have clear evidence that students’ language backgrounds and thelanguage of assessment impact student performance on content area tests (see forexample, Abedi et al., 1995; Abedi et al., 1998; Aiken, 1971; Aiken, 1972; Cocking andChipman, 1988; De Corte, Verschaffel, and DeWin, 1985; Jerman and Rees, 1972; Kintschand Greeno, 1985; Larsen, Parker, and Trenholme, 1978; Lepik, 1990; Mestre, 1988;Munro, 1979; Noonan, 1990; Orr, 1987; Rothman and Cohen, 1989; Spanos, Rhodes,Dale, and Crandall, 1988). Language is therefore a crucial issue in the assessment ofstudents with limited English proficiency2 (LEP).
Based on the wealth of evidence concerning the impact of language on content-based assessment, it can be argued that since most state and national assessment toolsare constructed and normed for native English speakers, using such assessment toolsfor LEP students may not be fair. It would follow that until more valid and fairassessment tools are provided, LEP students should not be included in suchassessments.
On the other hand, recent federal and state legislation, including Goals 2000 andthe Improving America’s Schools Act (IASA), call for inclusion of all students inassessments. This includes LEP students. However, if LEP students are to be included,the issue of the impact of students’ language background on their content-basedperformance must be addressed.
2 Limited English Proficient (LEP) is the official term found in federal legislation and is the term used todefine students whose first language is not English and whose proficiency in English is currently at alevel where they are not able to fully participate in an English-only instructional environment (Olson andGoldstein, 1997).
ELL is a term that is used in some citations found in this report and warrants a definition in this footnote.English Language Learner (ELL), as defined by La-Celle-Peterson and Rivera (1994), broadly refers tostudents whose first language is not mainstream English. ELLs include students who may have verylittle ability with the English language (frequently referred to as LEP) to those who have a high level ofproficiency.
The term LEP will be used in this report because accommodations are specifically intended for use withthis population of ELLs. The term ELL appears in some citations in this report. In those citations, theauthors are usually referring to the LEP population.
The authors of this report would, however, like to acknowledge La-Celle-Peterson and Rivera’sperspective that ELL is viewed as a positive term because it implies that the student, in addition tohaving mastered a first language is now in the process of mastering a second language. LEP, on the otherhand, conveys that the student has a deficit or a "limiting" condition.
CRESST Draft Deliverable16
Previous studies have shown that utilizing some forms of accommodation canincrease test scores for both LEP and non-LEP students. For example, in anexperimentally controlled study, Abedi, Hofstetter, Lord, and Baker (1998) found that acombination of glossary use and extra time increased LEP students’ performance byover half a standard deviation. Other forms of accommodation, such as linguisticmodification, may narrow the performance gap between LEP and non-LEP students(Abedi et al., 1995; Abedi, Hofstetter, Lord, and Baker, 1998).
Provision of accommodations has helped to increase the rate of inclusion for LEPstudents (Mazzeo, 1997). Based on the promising results, from using accommodationsin the 1996 National Assessment for Educational Progress (NAEP) main assessment,accommodations were provided in the 1997 assessment in art and in the 1998assessment in reading, writing, and civics.
There are, however, some major concerns regarding the use of accommodationsfor LEP students. Among the most important issues are those concerning the validityand feasibility of accommodation strategies. As indicated earlier, providingaccommodations has increased LEP students’ performance, but at the same time non-LEP students have also benefited. This may be problematic, since the purpose of usingaccommodations is to reduce the gap between LEP and non-LEP students, not to alterthe construct under measurement. The use of accommodation strategies that affect theconstruct is questionable. Feasibility is another major issue in the provision ofaccommodations. Valid accommodation strategies may not be useful if they cannot beeasily implemented in large-scale assessments.
This study focuses on the validity and feasibility issues of accommodationstrategies. In this study, both LEP and non-LEP students were tested underaccommodated and non-accommodated conditions; this provided the basis for testingthe validity of accommodation. Further, in this study, we selected accommodationstrategies, for which implementation was feasible in large-scale assessments. Forexample, dictionaries have been suggested as a form of accommodation (Kopriva, 2000).There are, however, caveats concerning the use of dictionaries as a form ofaccommodation.
First, there are validity issues. The accommodation strategy should not impact theconstruct. Accordingly, the accommodation should not provide content-relatedinformation. However, a standard dictionary would provide access to both content andnon-content terms. Further, there are various types of dictionaries, differing in purpose,
LEP Accommodations on NAEP 17
content, form, and scope. Different dictionaries may results in different levels ofperformance.
A second issue is feasibility. Providing the same edition of a dictionary, to allparticipants, may be difficult. It would be unrealistic to require all students to bring thesame version of a dictionary. Furthermore, providing students an opportunity to bringoutside materials to the test would pose difficult issues of screening. On the otherhand, requiring the administrator to provide dictionaries for all students could poselogistical problems.
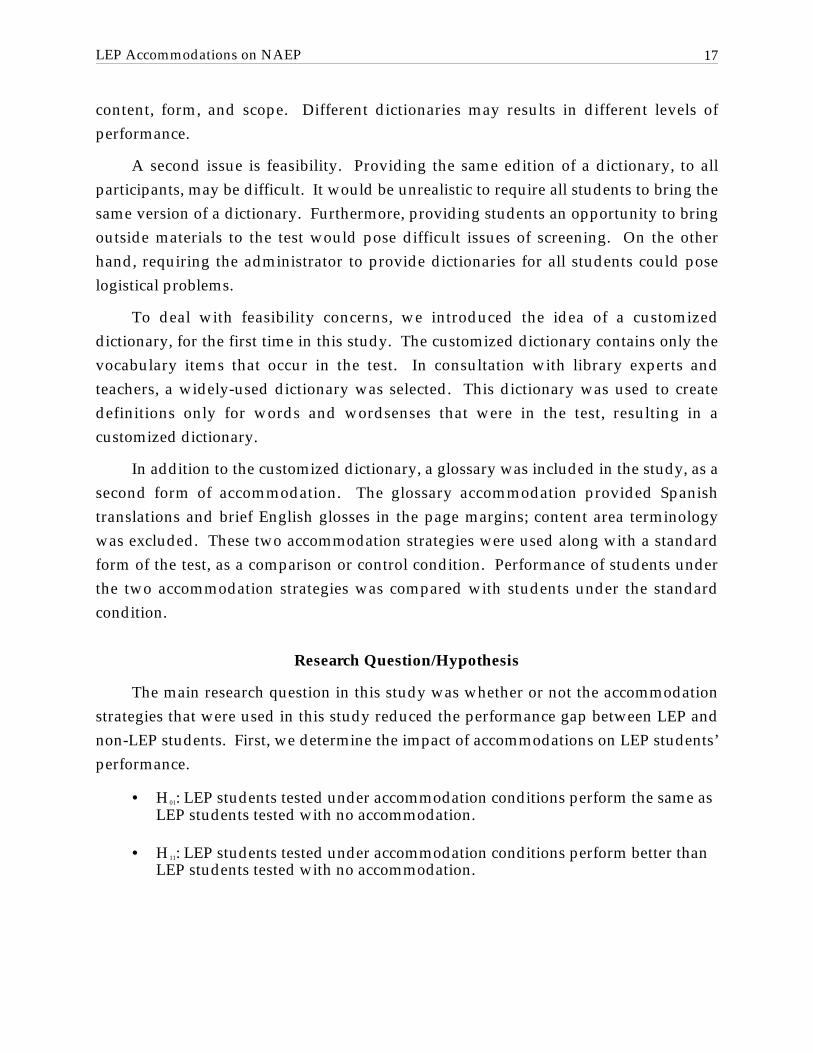
To deal with feasibility concerns, we introduced the idea of a customizeddictionary, for the first time in this study. The customized dictionary contains only thevocabulary items that occur in the test. In consultation with library experts andteachers, a widely-used dictionary was selected. This dictionary was used to createdefinitions only for words and wordsenses that were in the test, resulting in acustomized dictionary.
In addition to the customized dictionary, a glossary was included in the study, as asecond form of accommodation. The glossary accommodation provided Spanishtranslations and brief English glosses in the page margins; content area terminologywas excluded. These two accommodation strategies were used along with a standardform of the test, as a comparison or control condition. Performance of students underthe two accommodation strategies was compared with students under the standardcondition.
Research Question/Hypothesis
The main research question in this study was whether or not the accommodationstrategies that were used in this study reduced the performance gap between LEP andnon-LEP students. First, we determine the impact of accommodations on LEP students’performance.
• H01: LEP students tested under accommodation conditions perform the same asLEP students tested with no accommodation.
• H11: LEP students tested under accommodation conditions perform better thanLEP students tested with no accommodation.

CRESST Draft Deliverable18
The research question/hypothesis concerning the validity of accommodation is ofparticular importance in any accommodation study. The following research hypothesesaddress the validity of accommodation.
• H01: Non-LEP students tested under accommodation conditions perform thesame as non-LEP students tested with no accommodation.
• H11: Non-LEP students tested under accommodation conditions perform betterthan non-LEP students tested with no accommodation.
We address the question of effectiveness of these accommodations as a strategy forincreasing test validity for LEP students.
• H02: The performance gap between accommodated and non-accommodatedperformance is the same for LEP and non-LEP students.
• H02: Accommodation strategies that are used in this study reduce the gapbetween accommodated and non-accommodated performance more for LEPthan for non-LEP students.

LEP Accommodations on NAEP 19
Literature Review
Based on a nationally representative sample of school districts in 1991, the numberof LEP students in grades K-12 was estimated to be more than 2.3 million (Olson andGoldstein, 1997). In recent efforts to increase participation of language minoritystudents in large-scale assessments, accommodations and adaptations have beenproposed as strategies for including these students. About 55% of U.S. states are nowproviding various accommodations to comply with the mandated inclusion criteria.
Recent studies have examined the impact of language proficiency among bothnative and non-native English speakers on content-based performance. Differentialperformances between Limited English Proficient (LEP) students and native Englishspeakers in subject areas, such as mathematics and science, have been attributed todifferences in English language proficiency levels. Difficulties in the language ofcontent-based test items have been identified as a significant factor in overall content-based performance. This literature review provides a brief overview of issues related tothe inclusion of LEP students in large-scale assessments, in the following areas:
1. Differences in performance between LEP and non-LEP students acrosscontent areas.
2. Linguistic factors related to science performance.
3. The effects of accommodations.
Content-Based Performance and Limited English Proficient Students
Previous studies have shown that the differences between achievement levels ofLEP students and native speakers are significant (Cocking and Chipman, 1988).Specifically, in mathematics, studies have shown that English proficiency levels areassociated with performance on solving word problems (Carpenter, Corbitt, Kepner,Linquist, and Rey, 1980; Mestre, 1988). A study by Butler and Castellon-Wellington(2000) found that native English speakers outperformed both the fluent Englishproficient (non-native English speakers) and limited English proficient students instandardized mathematics assessments. However, Abedi and Leon (1999) in a studyusing data from several different school districts nationally demonstrated that theperformance gap between LEP and non-LEP decreases as the level of language demandof test items decreases. For example, they showed that the performance gap betweenLEP and non-LEP is greatest in reading, decreases substantially in science and becomes

CRESST Draft Deliverable20
non-existence in math items particularly with those involving mainly computations (seealso Abedi, Leon, and Moracha, 2000).
As Mestre (1998) suggested, language deficiencies may contribute to themisinterpretation of word problems. Cocking and Chipman (1988) concluded thatSpanish-dominant students scored higher on the Spanish version of a math placementtest than on the same test in English. A six-year longitudinal study by Moss, Marc,Puma and Michael (1995) found that LEP students, who attend public schools, areparticularly disadvantaged.
The positive relationship between language proficiency and academic performancehas been established by several studies. A study by De Avila, Cervantes, and Duncanin 1978 demonstrated that oral language proficiency was a significant predictor ofacademic performance (De Avila, 1997). De Avila et al. found that there was a linearrelationship between the five levels of a widely used oral language proficiencyassessment and performance on a standardized test; the CTBS-U (De Avila, 1997). Areplication of this study in 1988 (De Avila, Duncan, and Navarrete, 1988) found thatacademic performance was directly associated with literacy skills.
A study conducted by the Minnesota Assessment Project found that more LEPstudents passed the math tests than the reading tests (Thurlow, Elliot, and Ysseldyke,1998). Thurlow et al. suggested that the overall poor performance of LEP students maybe a result of low reading and comprehension skills, due to unfamiliarity withAmerican English idioms and vocabulary. Previous research has suggested that thetypes of language or discourses required in an academic setting may be very differentfrom the home practices and experiences of many language minority students (Heath,1983).
As suggested by many researchers, the level of language proficiency is one of thecontributing factors to differences in achievement levels (Abedi et al., 1995; Cocking andChipman, 1988). To ensure the validity of these content area assessments, the effects oflanguage proficiency on performance in content areas such as mathematics and sciencecan be minimized. By reducing the difficulties associated with English languageproficiency level, we can establish more valid inferences about LEP students’ contentarea knowledge.
As pointed out in Standards for Educational Psychological Testing (AmericanEducational Research Association, 1985), “for a non-native English speaker, and for aspeaker of some dialects of English, every test given in English becomes, in part, a

LEP Accommodations on NAEP 21
language or literacy test” (p. 75). For accurate assessment of students’ contentknowledge, accommodations are considered an alternative strategy to ensure validityand reliability of content assessments in mathematics and science. One of thechallenges for inclusion of all students in large-scale assessments is that standardizedtest developers usually assume that the test takers have no language difficulties thatwould interfere with test performance (Lam and Gordon, 1992; Zehler, 1994).
Linguistic Variables and Science Performance
Previous studies have suggested that linguistic modifications of math wordproblems are associated with increased math test performance. Certain linguisticfeatures, such as unfamiliar lexical items and passive voice verb constructions, havebeen implicated as potential contributors to the difficulty of text interpretation (Abedi etal., 1995).
Studies have suggested that cognitive development in science is greatly dependentupon the linguistic development of a student (Kessler, et. Al., 1992; Anstrom, 1997).The acquisition of certain linguistic skills, such as interpreting logical connectors andspecialized vocabulary, is considered a prerequisite for demonstrating the advancedreasoning skills used in scientific communication (Anstrom, 1997). The discoursepatterns common in scientific texts, such as compare/contrast, cause/effect, andproblem/solution, require a high level of linguistic functioning that may be problematicfor language minority students (Anstrom, 1997). Scientific language frequently containscomplex sentences using passive voice constructions, which may pose greaterchallenges to language minority students trying to comprehend scientific texts than tostudents whose first language is English.
Scientific texts often use jargon that may pose challenges for understanding.According to Halliday and Martin (1993), “scientific texts are found to be difficult toread; and this is said to be because they are written in ‘scientific language’, a ‘jargon’which has the effect of making the learner feel excluded and alienated from the subject-matter” (p.69).
A study by Cassels and Johnstone (1984) concluded that using simpler wordsbrought about an improvement in students’ performance on chemistry multiple-choicetests. Replacing a question, such as “Which is the least stable sulfide among thefollowing?” with a simplified question such as “Which one of the following sulfides iseasiest to break down to its elements?” increased percent correct from 40 to 49.

CRESST Draft Deliverable22
According to Abedi, Hofstetter, and Lord (1998), clarifying the language of mathitems, by modifying the linguistic structures and non-technical vocabulary, enabledLEP students to achieve higher scores and narrowed the score gap between LEP andnon-LEP students.
Language demands in standardized content assessments often exceed thelanguage proficiency levels of LEP students. An evaluation of eleventh gradestandardized math and science assessments by Butler and Castellon-Wellington (2000)concluded that “approximately two-thirds to three-quarters of the test items on themathematics and science subsections, respectively, had general vocabulary rated asuncommon or used in an atypical manner” (p. 98). Butler and Castellon-Wellingtonalso found that the majority of the test items in both standardized mathematics andscience assessments contained challenging syntax and vocabulary. As suggested byGesinger and Carlson (1992), “testing procedures must be sensitive to the needs of LEPstudents and those from cultural minorities” (p. 2).
Accommodations
The purpose of accommodations is to help remove any irrelevant variancesassociated with the construct so that the assessment of students’ content knowledge canbe accurately measured (McDonnell, McLaughlin, and Morrison, 1997). Behind testingaccommodations is the theoretical assumption that the elimination of language barriersin testing formats will give students the optimal opportunity to show their true abilityin the subject area. Previous studies have shown that students who are being instructedin their native language demonstrate their knowledge in content areas much better inthat language or in a combination of the first and second languages (Zehler, 1994).
The availability of testing accommodations can provide an environment conduciveto greater participation of LEP students in large-scale testing. August and McArthur(1996) report that the National Center for Education Statistics (NCES) has found thatteachers included more of the LEP students in NAEP tests when more accommodationswere available. An evaluation of the NAEP inclusion criteria found that increases in thepercentage of LEP students included will be possible if the list of accommodations andadaptations can be expanded (Mazzeo, Carlson, Voelkl, and Lutkus, 2000). Withadditional accommodations, other than translated or interpreted versions of the tests,more students may be encouraged to take the tests in English (August, Hakuta, andPompa, 1994).

LEP Accommodations on NAEP 23
In a survey of types of accommodations, Butler and Stevens (1997) categorizedapproaches as modifications of the test or of the test procedure (see Figure 1).

CRESST Draft Deliverable24
Two Categories of Accommodations for English Language Learners
Modifications of the test• Assessment in the native language• Text changes in vocabulary• Modifications of linguistic complexity• Addition of visual supports• Use of glossaries in English• Use of glossaries in native language• Linguistic modifications of test directions• Additional example items
Modifications of the test procedure• Extra assessment time• Breaks during testing• Administration in several sessions• Oral directions in the native language• Small-group administration• Separate room administration• Use of dictionaries• Questions read aloud in English• Answers written directly in test booklet• Directions read aloud or explained
Figure 1. Potential Accommodation Strategies for English-Language Learners (Butler and Stevens, 1997).
State Policies for Accommodations
Shepard, Taylor, and Betebener (1998) found that accommodations consistentlyraised the relative position of LEP students on performance-based assessments. InFlorida, for example, accommodations for LEP students include flexible scheduling,additional time, clarification of a word or phrase for general directions, and use ofdictionaries (Abedi, Boscardin, and Larson, 2000). A study conducted by the NorthCentral Regional Educational Laboratory (NCREL) in 1996, however, found that sevenout of fifty states assessed LEP students with no accommodations and only half of thestates allowed testing accommodations for LEP students. The recommendations of apanel from a symposium, sponsored by the U.S. Department of Education Office ofBilingual Education and Minority Language Affairs (National Clearinghouse forBilingual Education, 1997), included the use of native language assessments, bilingualversions of the assessment, alternative modes of response, and portfolios of studentwork.
Some of the most widely used forms of accommodation in state assessments areidentified as flexible scheduling, extra time, simplified instructions, and dictionary andglossary usage. In New York, the mathematics assessments are currently translated intofive languages: Chinese, Haitian, Creole, Russian, and Spanish (Abedi et al., 2000).Additionally, Rhode Island offers native language test versions in grades 4, 8, and 10,which include Spanish, Portuguese, Laotian, and Cambodian (Stansfield, 1998). In

LEP Accommodations on NAEP 25
Massachusetts, all state assessments are offered in Spanish and use a specialized scoringsystem involving bilingual and content area teachers (Stansfield, 1998).
Problems with Direct Translation
Previous studies have indicated that there are several linguistic and culturalproblems associated with direct translation of tests into native language (see, forexample, Abedi, Hofstetter, and Lord, 1998; Olmedo, 1981). For example, there arenumerous dialects within Spanish that may differ across countries and regions of theworld. Given the cultural context of a word, a direct translation may not provide thesame meaning across dialects and cultures. As pointed out in a report prepared by theCouncil of Chief State School Officers (CCSSO, 2000), “confusion can result from rulesof syntax or word order that differ in a student’s home language. Yet another commonsource of student confusion comes from words that mean something different inEnglish than in the student’s home language” (p. 42).
Item analysis revealed that a large percentage of Spanish items used in NAEPmath assessments had item statistics that were dissimilar to those of the same items inEnglish (Anderson, Jenkin, and Miller, 1996). Abedi, Hostetter, and Lord (1998) foundthat eighth grade Hispanic students designated as LEP scored higher on NAEP mathitems in English compared to their peers who received the same items administered inSpanish. However, those students receiving instruction in Spanish performed higheron the math items in Spanish than on either modified or standard English items.
In addition, technical difficulties associated with direct translation of tests havebeen pointed out by many researchers (Figueroa, 1990). One of the most seriousdifficulties is trying to establish the reliability and the validity of translated tests. AsOlmedo (1981) pointed out, translated items may exhibit psychometric propertiessubstantially different from those of the original English items. Since direct translationis not possible, the slight modifications in the translated version to conform to the rulesand patterns of the new language may significantly change the psychometric propertiesof the item. Consequently, the reliability and validity of translated tests need to befirmly established for limited English proficient students before inferences about theirtest performance are made.
A study by Valencia and Rankin (1985) reported that the McCarthy Scales ofChildren’s Abilities translated into Spanish showed bias against Mexican-AmericanSpanish speaking children in the verbal and numerical memory sub-tests. Valencia and

CRESST Draft Deliverable26
Rankin concluded that the effect of word length and acoustic similarity on information-processing load might have contributed to the content biases.
According to Liu, Thurlow, Erickson, Spicuzza, and Heinze (1997), directtranslation of tests is thought to be beneficial for only two types of LEP students: 1)students who received grade appropriate instruction or educational experience in theirfirst language or in a bilingual program, and 2) students who are more fluent in theirfirst language than their second, even though they have not been instructed in their firstlanguage, and who choose to take a translated version (August, et al., 1994, cited in Liuet al.). A study by Thurlow et al. (1998) indicated that students found idiomaticexpressions in English difficult to understand and that the Spanish translations werenot very helpful.
A report prepared by CCSSO (2000) also suggested that “while many LEP studentsare orally proficient, at least conversationally, in their home language, we should notassume they will be literate in their home language unless they have had steady,consistent, and in-depth instruction in these specific skills” (p. 52). Solano-Flores andNelson-Barber (2000) pointed out that a simplistic belief that adapting a test (e.g., bytranslating it into another language or by providing accommodations) is enough toproperly serve diverse populations can have the catastrophic effect of contributing toperpetuating inequalities in the assessment of these groups” (p. 4).
Glossary and Dictionary Usage
The use of a glossary is a potential form of accommodation for LEP students inlarge-scale assessments. For the 1995 NAEP mathematics assessments, glossaries inboth Spanish and English were used as accommodations for LEP students. A study byAbedi, Hofstetter, and Lord (1998) found that students with limited English proficiency,as well as English-proficient students, benefited from an English glossary along withextended time in mathematics assessments.
One of the positive aspects of using glossaries or dictionaries as accommodationsis that these materials are widely used as part of instruction (CCSSO, 2000). Based onan accommodation study evaluating the effect of Spanish translation on performance,Thurlow et al. (1998) concluded “it seems that the students would have preferred somesort of glossary to explain the vocabulary word” (p. 5). According to Thurlow et al., thestudents found the Spanish translation did not always help them understand the wordbecause they often did not know the word in Spanish either.

LEP Accommodations on NAEP 27
Extended Time
A meta-analysis conducted by Chiu and Pearson (1999) found that extended timewas the most frequently investigated accommodation. Of 30 research studies that theyreviewed, almost half (47%) of the accommodations provided extended time orunlimited time. A recent study by Ofiesh (1997) found differential timing effects forlearning disabled (LD) and non-learning disabled (NLD) students when the NelsonDenny Reading Test was administered to students in post-secondary schools. Ofieshfound that the target populations benefited from the accommodation while the NLDstudents were at neither an advantage nor a disadvantage with the extra time. Inanother study, Montani (1995) found that providing unlimited time increased the scoresof both the LD and NLD students in mathematics tests. Abedi, Hofstetter and Lord(1998) found that the provision of extra time increased performance of non-LEPstudents slightly but extra time with the glossary, did have a significant impact on mathperformance for both LEP and non-LEP students.
According to a meta-analysis by Chiu and Pearson (1999), the extended orunlimited time accommodations benefited both the target population and the controlgroups. The study found the comparative advantage for the target population to beonly modest. However, some studies (Braun, Ragosta, and Kaplan, 1988; Willingham etal., 1988) have found that providing extra time appeared to give too much of anadvantage to students with LD. Since the results of providing extra time do not appearto be consistent across studies, it may be that the effect depends in part on other factorssuch as the nature of the content or item type, or the background of a particular groupof students.
Recommendations For Testing
As previous studies have cautioned, in order to derive valid inferences about testresults, test developers need to take into consideration the effect of the linguistic andcultural characteristics of the test takers (Gonzales, Castellano, Bauerle, and Duran,1996). To be valid for LEP students, assessments have to be linguistically and culturallyappropriate. Accommodations may provide a systematic way to minimize linguisticand cultural differences. According to a recent report by Shepard et al. (1998), “veryfew LEP students received accommodations specific to their language needs” (p. 53).
For construct validity purposes, accommodations need to be validated with theintended test takers in mind. According to Gonzales et al. (1996), “it is ethically

CRESST Draft Deliverable28
inappropriate for an evaluator to use a standardized assessment procedure when thereis no evidence of construct validity to its practical application for making diagnosticand placement decisions” (p. 452).

LEP Accommodations on NAEP 29
Methodology
This investigation was a pilot study to examine the use of accommodations by LEPstudents on a test comprised of NAEP science questions. The study took place betweenNovember 1999 and February 2000 in two southern California school districts and atone private school site. A total of 422 students and eight teachers, from six school sites(14 eighth-grade science classes), participated in the study.
A science test with 20 NAEP items was administered in three forms: one withoriginal items and two with accommodations focusing on potentially difficult Englishlanguage vocabulary. One form of accommodation included a customized Englishlanguage dictionary at the end of the test booklet. The other form of accommodationincluded English and Spanish language glossaries in the margins of the test booklet. Inaddition, a follow-up questionnaire and a science background questionnaire wereadministered. Student scores on the unaccommodated tests were compared with scoreson the accommodated tests. Participants, instruments, and procedure are describedbelow.
Subjects
A total of 422 Grade 8 science students, age 13-14, from six school sites,participated in the study. Of the 422 students, 199 were female and 222 were male(information was incomplete for one student).
Teachers provided the English proficiency levels of students from their schools’records. Of the 422 students, 183 students were identified as being limited Englishproficient (LEP) while 236 were identified as proficient English speakers (Non-LEP).See Table 1.

CRESST Draft Deliverable30
Table 1
LEP and Non-LEP Students (N = 422)
LEP Non-LEP Total
Site 1 64 (15.2%) 0 64 (15.3%)
Site 2 61 (14.5%) 0 61 (14.6%)
Site 3 0 37 (8.8%) 37 (8.8%)
Site 4 32 (7.6%) 28 (6.6%) 60 (14.6%)
Site 5 6 (1.4%) 139 (32.9%) 145 (34.6%)
Site 6 20 (4.7%) 32 (7.6%) 52 (12.4%)
Totalstudents
183 236 419 (100.0%)
Note. Data not available for 3 (or .7%) students.
The method used to determine English language proficiency and to monitor theacademic progress of students in language programs varies across states and evenwithin school districts. In general, any combination of information, such as registrationand enrollment records, home language surveys, interviews, observations, referrals,classroom grades and academic performance, and test results, are used to determine astudent’s proficiency level and to monitor academic progress (Olson and Goldstein,1997).
Given the myriad methods and combination of methods that school districts canuse to identify, place, and teach LEP students, it is extremely difficult to makecomparisons across districts and institutions. This study, comprised of school sitesfrom two different school districts and one private school site, used LEP and non-LEPdesignations from school-site records, information obtained from a science backgroundquestionnaire, and state testing results as criteria for analyses and comparison of theLEP and non-LEP groups. However, we realize that some discrepancies across sitesmay still exist over LEP and non-LEP status of students (i.e., a LEP student from oneschool district may not be considered a LEP student in another school district) and thatthe results should be interpreted accordingly.
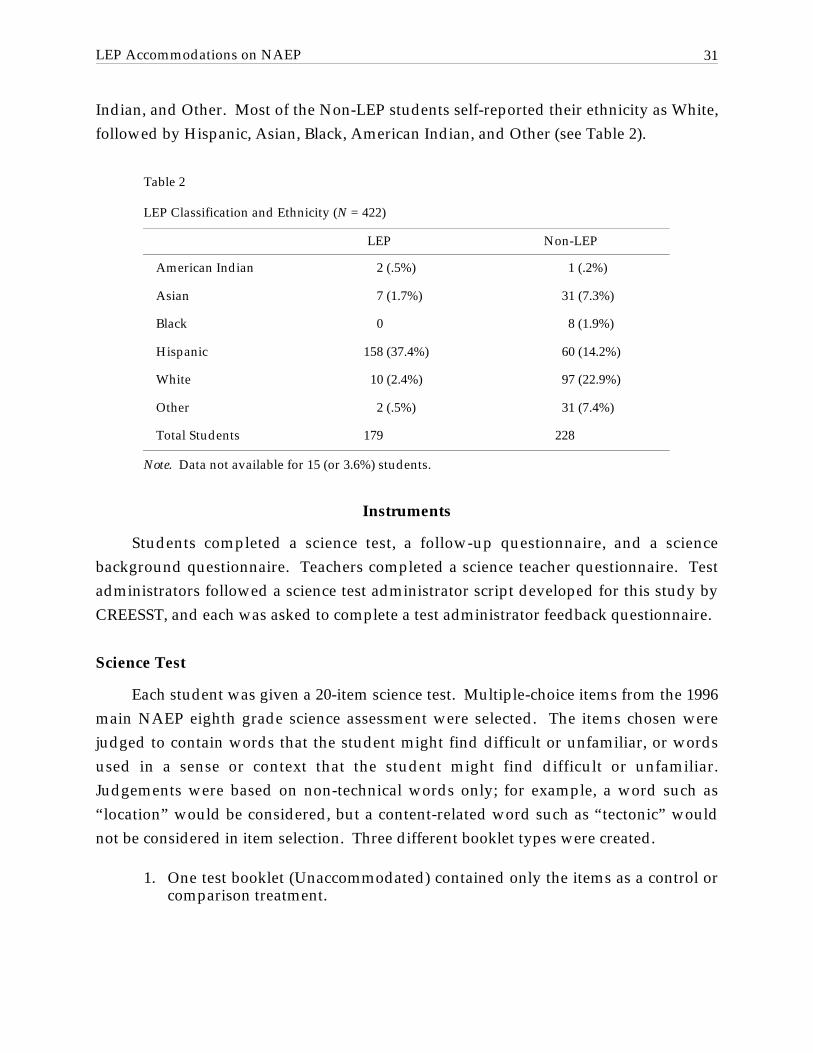
In their responses to the Science Background Questionnaire, most of the LEPstudents self-reported their ethnicity as Hispanic, followed by White, Asian, American
LEP Accommodations on NAEP 31
Indian, and Other. Most of the Non-LEP students self-reported their ethnicity as White,followed by Hispanic, Asian, Black, American Indian, and Other (see Table 2).
Table 2
LEP Classification and Ethnicity (N = 422)
LEP Non-LEP
American Indian 2 (.5%) 1 (.2%)
Asian 7 (1.7%) 31 (7.3%)
Black 0 8 (1.9%)
Hispanic 158 (37.4%) 60 (14.2%)
White 10 (2.4%) 97 (22.9%)
Other 2 (.5%) 31 (7.4%)
Total Students 179 228
Note. Data not available for 15 (or 3.6%) students.
Instruments
Students completed a science test, a follow-up questionnaire, and a sciencebackground questionnaire. Teachers completed a science teacher questionnaire. Testadministrators followed a science test administrator script developed for this study byCREESST, and each was asked to complete a test administrator feedback questionnaire.
Science Test
Each student was given a 20-item science test. Multiple-choice items from the 1996main NAEP eighth grade science assessment were selected. The items chosen werejudged to contain words that the student might find difficult or unfamiliar, or wordsused in a sense or context that the student might find difficult or unfamiliar.Judgements were based on non-technical words only; for example, a word such as“location” would be considered, but a content-related word such as “tectonic” wouldnot be considered in item selection. Three different booklet types were created.
1. One test booklet (Unaccommodated) contained only the items as a control orcomparison treatment.

CRESST Draft Deliverable32
2. One test booklet (Dictionary) included a customized English languagedictionary containing all the words in the test, including the content-relatedwords. The Dictionary was printed on paper in a contrasting color and wasstapled at the end of the test booklet.
3. One test booklet (Glossary) contained glossary entries for non-science words.Potentially difficult words were explained in the margins of each test page.In the left margin of the page were Spanish translations; in the right marginwere short definitions or explanations in English.
For each of the three booklet types, two counterbalanced forms were created. The itemsin the first half of form A occurred in the second half of form B; items in the second halfof form A occurred in the first half of form B. Thus, there were a total of six differentforms of the Science Test:
• Unaccommodated-A
• Unaccommodated-B
• Dictionary-A
• Dictionary-B
• Glossary-A
• Glossary-B
Since the items were from secured NAEP tests, actual items are not provided here.However, Figure 2 is a comparable item, included here for illustrative purposes. In thecontrol booklet (unaccommodated) the item would have appeared as it does in Figure 2.

LEP Accommodations on NAEP 33
The locations of earthquakes in the past ten years are marked on a world map.What can we learn from this map?
A. Earthquakes happen with the same frequency everywhere on the Earth.
B. Earthquakes usually happen along the edges of tectonic plates.
C. Earthquakes most often happen near the middle of continents.
D. Earthquakes do not seem to happen in any regular pattern.
Figure 2. Illustrative Comparable Test Item.
In the Dictionary booklet, the item would appear as in the control booklet (noglosses in the margins), but the Dictionary appended to the test booklet would containall words from the item. Nouns, verbs, and adjectives were included in the Dictionary,but high-frequency words such as articles, pronouns, and some prepositions were notincluded. It was assumed that students who did not know these words would not behelped by dictionary definitions of them.
Word definitions were based on those in the Longman Dictionary of American
English (1997), and included those wordsenses occurring in the test items. For the itemrepresented by Figure 2, the Dictionary would contain words and phrases such as:“location,” “earthquakes,” “past,” “years,” “marked,” “world,” “map,” “learn,”“happen,” “same,” “frequency,” “everywhere,” “Earth,” “usually,” “along,” “edges,”“tectonic plates,” “near,” “middle,” “continents,” “seem,” and “regular pattern.” Atypical Dictionary entry might be, e.g.:
location: a particular place or position
Since the Dictionary included all words from the item, it included definitions ofcontent-related vocabulary, such as “tectonic plates” and “continents” (unlike theGlossary). The choice to include all words was made so that the results of this study

CRESST Draft Deliverable34
could be more meaningfully compared to the results of other studies, in which studentswere provided actual dictionaries as an accommodation.
In the Glossary booklet, the same item would appear, but the left margin of thepage would contain Spanish translations of non-scientific vocabulary words or phrasesjudged to be potentially difficult. Examples of these would be (for Figure 2) “location,”“earthquake,” “frequency,” “edges,” and “regular pattern.” A typical Spanish glossmight be, e.g.:
location: lugar
Glosses were drafted for each test item, by a bilingual Spanish/English researchassistant, with experience in middle school classrooms. The glosses were reviewed andedited by a bilingual teacher/translator, originally from Chile, with teaching experiencein California junior colleges.
The right margin of the page would contain the same potentially difficult wordsfrom the item, each followed by a brief gloss in English, based on the appropriatewordsense from the Longman Dictionary of American English (1997), e.g.:
location: place or position
Note that “tectonic plates” and “continents” would not be glossed, because theywould be considered content-related vocabulary. Knowledge of their meaning could bewhat the item is intended to test.
Follow-Up Questionnaire
For each test booklet type, a follow-up questionnaire was developed to elicitstudent feedback. The Follow-Up Questionnaire was placed in the test bookletimmediately after the Science Test. Questions were tailored to the type of science testthe student completed. The different forms contained from six to nine questions; forexample:

LEP Accommodations on NAEP 35
Unaccommodated Science Test:
• Would it help if the test explained words in anotherlanguage?
Science Test with Dictionary:
• Did the dictionary help you understand the questions?
Science Test with Glossary:
• Did you read the explanations in the margins inEnglish (on the right side of the page)?
For the three forms of the Follow-Up Questionnaire, see Appendix A.
Science Background Questionnaire
Included in the test booklet was a science background questionnaire with 35questions selected from both the 1996 NAEP Grade 8 Bilingual Mathematics bookletand an earlier language background study (Abedi et al., 1995). See Appendix B.
The questionnaire included inquiries about the student’s country of origin,ethnicity, language background, language of instruction in science classes, and Englishproficiency; e.g.:
1. What country do you come from?
2. How long have you lived in the United States?
3. Do you speak a language besides English?
4. Have you ever studied science in a language other than English?
5. How long have you studied science in English?
6. Does your family often get a newspaper written in English?
7. Do you read English well?

CRESST Draft Deliverable36
Demographic Form
Teachers were asked to complete a demographic form for each class thatparticipated in the study. It included student gender, ethnicity, free lunch programparticipation status, LEP or non-LEP status, SAT-9 scores, and language spoken athome. See Appendix C.
Science Teacher Questionnaire
A questionnaire was introduced midway through the pilot study and used at sites4 through 6 to obtain information from each science teacher about each class, includingtype of science class, language of instruction, topics covered so far this year, and teacherjudgment of students’ English proficiency. See Appendix D.
Script for Science Test Administrator
A script was prepared for the test administrator, to ensure consistent testingprocedures across classrooms and across school sites. See Appendix E.
Test Administrator Feedback Form
Each test administrator was asked to provide feedback and comments on eachadministration. This information was mainly gathered to improve or address testadministration procedures thus resulting in modification of the script. See Appendix F.
Procedure
Human Subjects Approval
Approval to conduct the study was received from the Office for Protection ofResearch Subjects (OPRS) at the University of California, Los Angeles (UCLA). Studentconsent forms were not used for this study in order to keep the testing procedures thesame as for they are for NAEP testing. The OPRS’s Human Subjects ProtectionCommittee at UCLA approved this request.
Test Administrators
Test administrators included CRESST research staff, retired teachers, and schooladministrators who had prior experience with test administration.
LEP Accommodations on NAEP 37
Site Selection
The initial goal for site selection was to use eighth-grade science classrooms withan equal distribution of LEP and non-LEP students. A demographic form wasdeveloped by CRESST and sent to teachers to elicit language background informationabout the students in the classroom. See Appendix C for the Demographic Form.
Based on feedback from the teachers, it became clear that it would be extremelydifficult to locate sites with an equal balance of LEP and Non-LEP students in the sameclassroom. Of the more than 30 sites contacted, six were confirmed for participation. Aletter to the principal described the study (see Appendix G). Both the school site andthe teacher participant received $125.
Testing Procedures
Test administrators distributed the six test booklet forms randomly within eachclassroom. The test directions were read aloud to the students. Students wereinformed that their score on the test would not be a part of their grade for the class. Toaddress the different treatments, the directions were read aloud to the whole class, butspecific directions were targeted to each treatment group. For example, if a studentreceived a Glossary-A or Glossary-B test booklet, their directions were as follows:
If the bottom line on your test booklet says “Glossary-A” or “Glossary-B,” please raise yourhand. These directions are for you. In the margins of the pages in your test booklet, certainwords are explained. If the meaning of a word is not clear, you may look at the explanationin the margin. On the right side of the page, you will find explanations in English [assistanttest administrator hold up a “Glossary” test booklet, open to page 3, and point to the Englishglosses]. On the left side of the page, you will find explanations in Spanish [assistant testadministrator point to the Spanish glosses].
All test booklets contained a sample question. The test administrator askedstudents to read the sample question silently and to circle the correct answer. Thesample question, not related to science, was used so that students were clear on thecorrect response format (i.e., circling as opposed to darkening or “X-ing” in the correctresponse). For the complete Script for Science Test Administrator, see Appendix E.
Students were given 25 minutes to complete the 20-item science test, three minutesto complete the Follow-Up Questionnaire, and eight minutes to complete the 25-itemScience Background Questionnaire.

CRESST Draft Deliverable38
Each teacher was asked to complete the Science Teacher Questionnaire (seeAppendix D), and the test administrator completed a Test Administrator Feedbackquestionnaire (see Appendix F).
Analysis
Student science test scores were compared to investigate (a) the validity of theaccommodations and (b) the possible differential impact of accommodations on groupsof students with different language backgrounds.

LEP Accommodations on NAEP 39
Results
Accommodation Results
The main research question in this study was whether or not accommodationsaddressing the difficulty of English vocabulary in test items reduce the performancegap between Limited English Proficient students and proficient speakers of English incontent-based areas such as science. A sample of 422 students was tested under theaccommodated and non-accommodated conditions. To examine the validity ofaccommodated assessments, proficient speakers of English (non-LEP) who do notnormally receive any forms of accommodations were also included in this study. Thenon-LEP students were tested under both accommodated and unaccommodatedconditions.
Twenty science test items were selected from the 1996 NAEP released science mainassessment items. Two counterbalanced booklets were formed, using the same itemsbut in different order (form A and form B; see description in Instruments sectionabove). The two forms were randomly assigned to students under differentaccommodation conditions. Fifty five percent received form A and 45% received formB. Students’ performance under the two forms was compared for any significant formeffect. No significant difference was found between the scores of the two forms (t = -1.38, df=420, p=.169); therefore, scores from the two forms were treated equally.
We now turn to the findings concerning the performance gap between LEP andnon-LEP students. We compared the performance of LEP and non-LEP students underthe three accommodation conditions (dictionary, glossary, and standard condition).Table 3 presents means, standard deviations and number of students for each group ofLEP/non-LEP students by accommodation conditions.

CRESST Draft Deliverable40
Table 3
Means, Standard Deviations, and Number of Students by LEP Status andAccommodation Conditions
LEP Status/AccoCondition
Original Dictionary Glossary Total
LEP M = 8.36
SD = 4.40
N = 58
M = 10.18
SD = 5.26
N = 55
M = 8.51
SD = 4.72
N = 70
M = 8.97
SD = 4.40
N = 183
Non-LEP M = 11.71
SD = 3.39
N = 79
M = 11.37
SD = 3.79
N = 82
M = 11.97
SD = 3.86
N = 75
M = 11.67
SD = 3.68
N = 236
Total M = 10.29
SD = 3.48
N = 137
M = 10.86
SD = 4.46
N = 138
M = 10.34
SD = 4.61
N = 147
M = 10.50
SD = 4.22
N = 422
There was a large performance gap between LEP and non-LEP students.Consistent with the literature, LEP students performed substantially lower than non-LEP students. For LEP students, the mean score was 8.97 (SD = 4.40, n=183) and fornon-LEP students the mean was 11.66 (SD = 3.68, n=236), a difference of about a twothird of a standard deviation.
We tested the level of significance of the differences between the means reportedin Table 3. A two-factor ANOVA model was applied. Factor A was students’ LEPstatus (LEP versus non-LEP) and Factor B was assessment conditions (dictionary versusglossary versus standard condition). Factor A main effect (difference betweenperformance of LEP and non-LEP) was significant (F = 46.40, df = 1, 413, p = .000),suggesting that LEP students in general performed lower than non-LEP, a finding thatwas discussed earlier. Factor B main effect (performance under different testingconditions) was not significant for the overall group (F = 0.66, df = 2, 413, p = .515). Theinteraction between A (LEP status) and B (testing condition), however, was significant(F = 3.43, df = 2, 413, p = .033). This significant interaction suggests that LEP and non-LEP students performed differently under different testing conditions.
However, the main hypothesis in this study dealt with the effectiveness ofaccommodation in reducing the performance gap between LEP and non-LEP students.

LEP Accommodations on NAEP 41
To test this hypothesis, we compared performance of LEP students under the threetesting conditions.
To test the hypothesis of effectiveness of accommodation in reducing theperformance gap between LEP and non-LEP students, we compared LEP students’scores on science items under three accommodation conditions: customized dictionary,glossary, and standard NAEP conditions. LEP students performed higher under theaccommodated conditions than under the standard condition. The mean for the LEPstudents under the customized dictionary was 10.18 (SD=5.26, n=55); under the glossarycondition, the mean was 8.51 (SD=4.72, n=70); and under the standard condition themean was 8.36 (SD=4.40, n=58). As the data suggest, LEP students did particularly wellunder the customized dictionary condition. The results of an analysis of variance(ANOVA) indicated that the difference between means for LEP students under thethree accommodation conditions was significant (F=3.08, df=2,180, p=.048). The resultsof multiple comparison tests suggested that the performance of LEP students underdictionary condition is significantly higher than the performance of LEP students underthe standard condition. However, when the performance of LEP students underglossary was compared with the performance of LEP students under the standardcondition, the difference did not reach to the significance level.
Abedi et al. (1998) demonstrated that the translation of assessment tools instudents’ native language may not help if the language of instruction is English. To testthe hypothesis of effectiveness of a Spanish glossary in reducing the gap between LEPstudents with Hispanic language background, we compared a mean science score ofHispanic students across the three accommodation levels (dictionary, glossary, andoriginal). The mean science score for Hispanic LEP students, utilizing the originalbooklet, is 8.21 (SD=4.27, n=53). The mean for LEP students utilizing the dictionary, is10.28 (SD=5.25, n=46). Under glossary, the LEP student mean is 8.03, (SD=4.41, n=59).
The results of an analysis of variance indicated that the difference between themean scores, under the three accommodation conditions, is significant (F=4.40,df=2,155, p=.01). This difference is mainly between the usage of dictionary categoryand others since the mean performance utilizing the glossary is almost identical withthe mean of the standard condition. These results confirmed the earlier findings byAbedi et al. (1998) that translating instrument or providing a glossary in students’native language may not help if the language of instruction is English. However, anEnglish dictionary may be more effective in reducing the science performance gapbetween LEP and non-LEP, since it may help with the language factors in assessment.

CRESST Draft Deliverable42
Validity of accommodation in this study was tested by comparing the performanceof non-LEP students across the accommodation conditions. Accommodations shouldnot affect the performance of non-LEP students. That is, there should not be anysignificant differences between the performance of non-LEP students tested under theaccommodated condition with the non-LEP students tested under the standardcondition with no accommodation. The results of analyses suggested that theaccommodations had no significant effect on the scores of the non-LEP students. Fornon-LEP students, the mean science score for the dictionary accommodation was 11.37(SD=3.79, n=82); for the glossary the mean was 11.96 (SD=3.86, n=75); and for thestandard condition the mean was 11.71 (SD=3.39, n=79). The results of analysis ofvariance showed no significant difference between the performance of non-LEPstudents under the three accommodation conditions (F=.495, df=2, 233, p=.610).
The non-significant results indicate that the accommodation strategies that wereused in this study did not affect the outcome of measurement. Thus, concerns over thevalidity of accommodations may not be warranted.
Classroom Effects
To examine the effects of multilevel structure of data (students nested inclassrooms), a two-level hierarchical model was used in the analysis. The sources ofeducational influence on students occur in the context of classrooms which evidentlygive rise to multilevel data (Burstein, 1993). Using hierarchical linear models, the effectsof different accommodations for LEP and non-LEP students were examined in detail.The two-level model includes the student level variables in level 1, represented byFigure 1. Figure 2 represents the differences across classrooms examined in level 2.
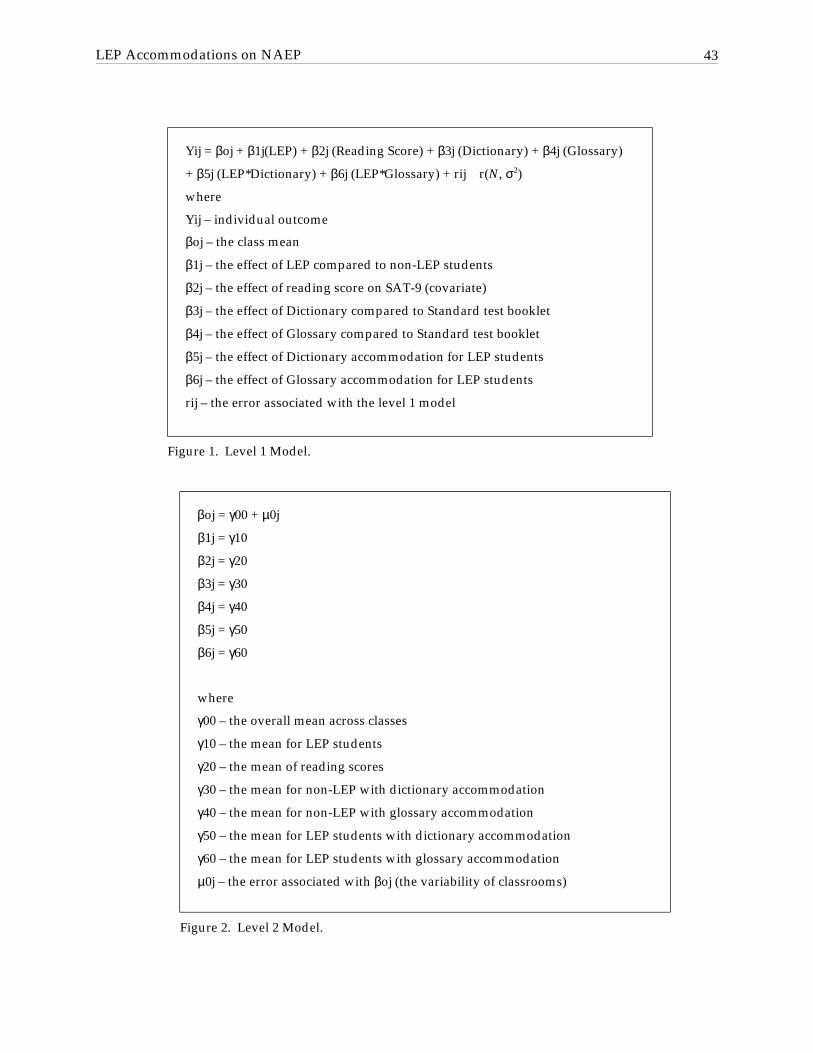
LEP Accommodations on NAEP 43
Yij = βoj + β1j(LEP) + β2j (Reading Score) + β3j (Dictionary) + β4j (Glossary)
+ β5j (LEP*Dictionary) + β6j (LEP*Glossary) + rij r(N, σ2)
where
Yij – individual outcome
βoj – the class mean
β1j – the effect of LEP compared to non-LEP students
β2j – the effect of reading score on SAT-9 (covariate)
β3j – the effect of Dictionary compared to Standard test booklet
β4j – the effect of Glossary compared to Standard test booklet
β5j – the effect of Dictionary accommodation for LEP students
β6j – the effect of Glossary accommodation for LEP students
rij – the error associated with the level 1 model
Figure 1. Level 1 Model.
βoj = γ00 + µ0j
β1j = γ10
β2j = γ20
β3j = γ30
β4j = γ40
β5j = γ50
β6j = γ60
where
γ00 – the overall mean across classes
γ10 – the mean for LEP students
γ20 – the mean of reading scores
γ30 – the mean for non-LEP with dictionary accommodation
γ40 – the mean for non-LEP with glossary accommodation
γ50 – the mean for LEP students with dictionary accommodation
γ60 – the mean for LEP students with glossary accommodation
µ0j – the error associated with βoj (the variability of classrooms)
Figure 2. Level 2 Model.

CRESST Draft Deliverable44
Findings
The preliminary results of the analysis are presented in Table 4. As Table 4 shows,the differences in the science performance mean across classes are statisticallysignificant (p = .000). However, as discussed in the Methodology section of this report,to control for teacher and class effects, test booklets were randomly assigned to studentswithin a classroom. The significance of classroom effect may be a result of small n inthis pilot study. Randomization may not be effective when n size is small. Given thesignificance of the variance, the classroom differences are an important factor toconsider in the model.
With the estimation of classroom differences in the model, the LEP status and thereading achievement score on SAT-9 are determined as strong predictors of scienceperformance. The results indicate that the LEP students on average performed aboutthree points higher than the non-LEP students, after controlling for differences inreading performance.
The dictionary and the glossary accommodations have no significant effect on theperformance of non-LEP students. However, the result suggests that the use of adictionary may help LEP students. Even though the p-value does not hold anystatistical significance, there is some evidence for positive accommodation effect for LEPstudents. This finding is consistent with our results derived using analysis of variance.This preliminary analysis suggests that the use of a customized dictionary as anaccommodation contribute to validity for LEP students in large-scale assessments.

LEP Accommodations on NAEP 45
Table 4
Examination of Science Performance Using a Hierarchical Linear Model
Fixed Effects Coefficient Se T ratio
Mean across classes 6.699 1.151 5.821
Mean of reading scores 3.295 0.734 4.487
Mean with dictionary accommodation 0.049 0.007 6.506
Mean with glossary accommodation -0.132 0.510 -0.259
Mean for LEP students with dictionaryaccommodation
-0.082 0.517 -0.159
Mean for LEP students with glossaryaccommodation
1.149 0.799 1.438
Mean for LEP students on reading -0.94 0.776 -0.122
Random EffectsVariance
Component Df χ2 P value
Mean across classes 10.332 9 368.342 0.000
Level-1 error 9.914
Follow-Up Questionnaires
As indicated earlier, we used three different test booklets:
1. A booklet with a customized dictionary attached.
1. A booklet with glossary of non-technical terms (Spanish translations and briefEnglish glosses in the page margins).
2 . A booklet with original versions of the test items, with no dictionary orglossary.
For each of these booklets, a follow-up questionnaire was developed to receivefeedback from students on the language of the test items and level of utilization andusefulness of the accommodations they received (dictionary and glossary). Differentbooklets had different sets of follow-up questions. For example, the questionnaire inboth the non-accommodated and the dictionary-accommodated test booklets consisted
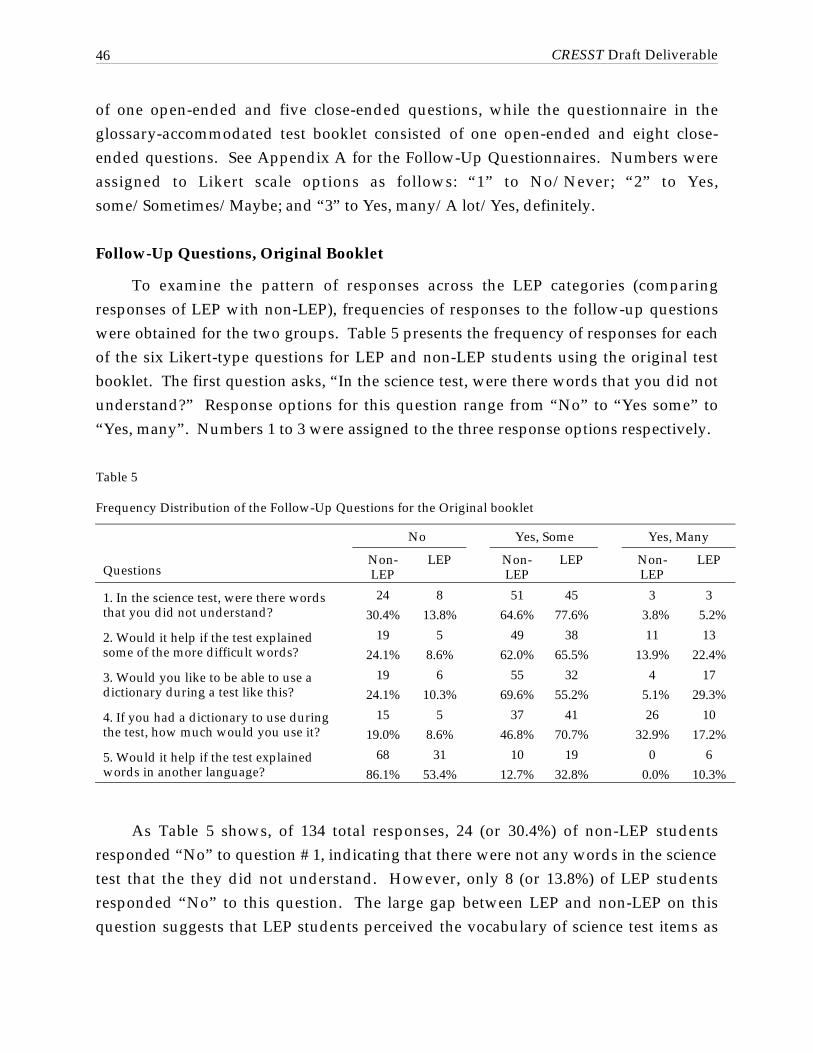
CRESST Draft Deliverable46
of one open-ended and five close-ended questions, while the questionnaire in theglossary-accommodated test booklet consisted of one open-ended and eight close-ended questions. See Appendix A for the Follow-Up Questionnaires. Numbers wereassigned to Likert scale options as follows: “1” to No/Never; “2” to Yes,some/Sometimes/Maybe; and “3” to Yes, many/A lot/Yes, definitely.
Follow-Up Questions, Original Booklet
To examine the pattern of responses across the LEP categories (comparingresponses of LEP with non-LEP), frequencies of responses to the follow-up questionswere obtained for the two groups. Table 5 presents the frequency of responses for eachof the six Likert-type questions for LEP and non-LEP students using the original testbooklet. The first question asks, “In the science test, were there words that you did notunderstand?” Response options for this question range from “No” to “Yes some” to“Yes, many”. Numbers 1 to 3 were assigned to the three response options respectively.
Table 5
Frequency Distribution of the Follow-Up Questions for the Original booklet
No Yes, Some Yes, Many
QuestionsNon-LEP
LEP Non-LEP
LEP Non-LEP
LEP
1. In the science test, were there wordsthat you did not understand?
2430.4%
813.8%
5164.6%
4577.6%
3 3.8%
3 5.2%
2. Would it help if the test explainedsome of the more difficult words?
1924.1%
58.6%
4962.0%
3865.5%
1113.9%
1322.4%
3. Would you like to be able to use adictionary during a test like this?
1924.1%
610.3%
5569.6%
3255.2%
4 5.1%
1729.3%
4. If you had a dictionary to use duringthe test, how much would you use it?
1519.0%
58.6%
3746.8%
4170.7%
2632.9%
1017.2%
5. Would it help if the test explainedwords in another language?
6886.1%
3153.4%
1012.7%
1932.8%
0 0.0%
610.3%
As Table 5 shows, of 134 total responses, 24 (or 30.4%) of non-LEP studentsresponded “No” to question # 1, indicating that there were not any words in the sciencetest that the they did not understand. However, only 8 (or 13.8%) of LEP studentsresponded “No” to this question. The large gap between LEP and non-LEP on thisquestion suggests that LEP students perceived the vocabulary of science test items as

LEP Accommodations on NAEP 47
more difficult than the non-LEP group did. A larger percentage of LEP students(77.6%) also indicated that they had some difficulty understanding the science questionsthan non-LEP (64.6%). Also, as expected, a smaller percentage of non-LEP studentsindicated that they found many words in the science test that they did not understand.For non-LEP, the percent of students who selected this option was 3.8% as comparedwith 5.2% for LEP students.
Follow-up question #2 asks whether it would help if the test explained some of themore difficult words. A higher percentage of LEP students indicated that it would. Ofthe total 134 respondents, 24 indicated that explanation of difficult words would not behelpful. Of this 24, 19 respondents were non-LEP (21.1% of non-LEP), and only 5 wereLEP (8.6% of LEP). However, there was an opposite trend of response in the highestcategory “Yes, many”. More LEP students indicated that it would help if the testexplained some of the more difficult words. (22.4% for LEP as compared with 13.9% fornon-LEP.)
The same trend can be seen for the follow-up questions #3 and #4 which ask aboutuse of a dictionary. More LEP students indicated that they would like to be able to usea dictionary and they would use it if they had one. Similarly, more LEP studentsindicated that it would help if the test explained words in another language.
To compare the response patterns of LEP and non-LEP on these follow-upquestions, we created an average rating for each question by assigning numbers (rank)to the responses (1 to “No/Never”, 2 to “Yes, some/Maybe”, and 3 to “Yes, many/Yes,a lot”).
Table 6 presents mean and standard deviation for the ranks by LEP and non-LEPgroups for the original booklet. As the data in Table 6 show, mean ranks for LEPstudents are higher for all questions, except #4, suggesting that LEP students in generalwould prefer more assistance. Mean rating for question 1, “In the science test, were there
words that you did not understand?” for non-LEP students is 1.73 (SD=.53) as comparedwith a mean of 1.91 (SD=.44) for LEP students. For question 2, “Would it help if the test
explained some of the more difficult words?” the mean for non-LEP is 1.90 (SD=.61) ascompared with a mean of 2.14 (SD=.55) for LEP students.

CRESST Draft Deliverable48
Table 6
Mean and Standard Deviation of Ranks for the Follow-Up Questions, Original Booklet
Non-LEP LEP
Questions Mean SD N Mean SD N
1. In the science test, were there words thatyou did not understand?
1.73 .53 78 1.91 .44 56
2. Would it help if the test explained some ofthe more difficult words?
1.90 .61 79 2.14 .55 56
3. Would you like to be able to use adictionary during a test like this?
1.81 .51 78 2.20 .62 55
4. If you had a dictionary to use during thetest, how much would you use it?
2.14 .72 78 2.09 .51 56
5. Would it help if the test explained wordsin another language?
1.13 .34 78 1.55 .68 56
We compared the response patterns of LEP and non-LEP on all five follow-upquestions in the original booklet using multivariate analysis of variance (MANOVA).In this MANOVA model, the Likert-type scores of the five follow-up questions wereused as the dependent variable and students’ LEP status (LEP/non-LEP) as theindependent variable. Table 7 summarizes the results of this multivariate analysis. AsTable 7 shows, the multivariate test was significant (Wilks λ = .75, F=8.22, P <.01)
indicating that LEP and non-LEP responded differently to the set of follow-upquestions. The univariate F-test however, suggested that of the five questions, fourelicited different responses from the two groups, but question #4 had the same responsepattern across the two groups (LEP/non-LEP). The responses to question #4 indicatethat many of the non-LEP students, as well as LEP students, said they would use adictionary.

LEP Accommodations on NAEP 49
Table 7
Multivariate ANOVA Results for Follow-Up Questions, Original Booklet
SS MS
Variable Hypo. Error Hypo. Error F P
Question 1 1.09 31.74 1.10 .25 4.46 .037
Question 2 2.01 43.99 2.01 .34 5.88 .017
Question 3 4.39 39.57 4.39 .31 14.32 .000
Question 4 .053 53.23 .053 .41 .128 .721
Question 5 5.96 34.21 5.96 .27 22.46 .000
*Note: SS= Sum of Squares, MS= Mean Squares
Follow-Up Questions, Dictionary Booklet
The purpose of follow-up questions in the dictionary booklet was to find out ifstudents used the customized dictionary. However, questions similar to those in theoriginal booklet were also asked of students taking the dictionary booklet. Table 8presents the summary results of analyses on the dictionary follow-up questions.
Table 8
Frequency Distribution of the Follow-Up Questions for the Dictionary Booklet
No Yes, Some Yes, Many
QuestionsNon-LEP
LEP Non-LEP
LEP Non-LEP
LEP
In the science test, were there words thatyou did not understand?
27
32.9%
11
20.0%
52
63.4%
40
72.7%
1
1.2%
3
5.5%
Did you look up words in the dictionary?34
41.5%
23
41.8%
43
52.4%
30
54.5%
3
3.7%
1
1.8%
Did the dictionary help you understandthe questions?
32
39.0%
22
40.0%
23
28.0%
14
25.5%
24
29.3%
17
30.9%
Would it help if the test explained wordsin another language?
64
78.0%
23
41.8%
12
14.6%
26
47.3%
2
2.4%
5
9.1%
Would it help if the test used easierwords?
24
29.3%
2
3.6%
39
47.6%
19
34.5%
16
19.5%
18
32.7%

CRESST Draft Deliverable50
The trend of frequency distributions in Table 8 for the dictionary is similar to thosereported in Table 5 for the original version. LEP students indicated that there weremore words in the science test that they did not understand, in comparison to the non-LEP students. LEP students, more than non-LEP counterparts, thought that it wouldhelp if the test explained words in another language and it would help if the test usedeasier words. However, both LEP and non-LEP gave similar responses when they wereasked if they looked up words in the dictionary. Both groups also found the dictionaryhelpful in understanding the questions.
Table 9 reports mean, standard deviation, and number of students responding tothe dictionary questions. Mean Likert-scale score for question 2 and 3 (concerningusing the dictionary and whether or not the dictionary was not helpful) was the samefor LEP and non-LEP but for questions 1, 4, and 5, the means are very different. Theresults of multivariate analysis of variance comparing LEP and non-LEP on the fivedictionary follow-up questions confirms our earlier statement that LEP and non-LEPresponded differently on questions 1, 4, and 5.
Table 9
Mean and Standard Deviation of Ranks for the Follow-Up Questions, Dictionary Booklet
Non-LEP LEP
Questions Mean SD N Mean SD N
In the science test, were there words that youdid not understand?
1.68 .50 80 1.85 .49 54
Did you look up words in the dictionary? 1.61 .56 80 1.59 .53 54
Did the dictionary help you understand thequestions?
1.90 .84 79 1.90 .86 53
Would it help if the test explained words inanother language?
1.21 .47 78 1.67 .64 54
Would it help if the test used easier words? 1.90 .71 79 2.41 .59 39
Follow-Up Questions, Glossary Booklet
The glossary follow-up questionnaire contained 8 Likert-type items and one open-ended question. In addition to the questions that were asked in the original and

LEP Accommodations on NAEP 51
dictionary questionnaires, such as “Were there words that you did not understand?”and “Would it help if the test used easier words?” there were questions specificallyrelated to the use of the glossary. Table 10 presents frequencies and percentages ofstudents’ responses to the glossary follow-up questions.
As the data in Table 10 suggest, the trend of responses in this table is similar to thetrend reported in Table 5 and Table 8 for the original and dictionary booklets. LEPstudents, more than their non-LEP counterparts, indicated that there were words thatthey did not understand. The LEP group also indicated (more than non-LEP) that itwould help if the test used easier words.
Table 10
Frequency Distribution of the Follow-Up Questions for the Glossary Booklet
No Yes, Some Yes, Many
QuestionsNon-LEP LEP Non-
LEP LEP Non-LEP LEP
In the science test, were there words thatyou did not understand?
3547.7%
1014.3%
3648.0%
5172.9%
3 4.0%
710.0%
Did you read the explanation in the marginsin English (on the right side of the page)?
1824.0%
912.9%
5269.0
3752.0%
4 5.3%
2028.6%
Did the English explanations help youunderstand the questions?
1824.0%
5 7.1%
4053.3%
3144.3%
1621.3%
3245.7%
Did you read the explanation in the marginsin Spanish (on the left side of the page)?
6789.3%
4361.4%
6 8.0%
1825.7%
1 1.3%
5 7.1%
Did the Spanish explanations help youunderstand the questions?
7093.3%
3448.6%
4 5.3%
2332.9%
0 0.0%
1 1.4%
Would you like to be able to use adictionary during a test like this?
2229.3%
811.4%
3546.7%
2738.6%
1520.0%
3245.7%
If you had a dictionary to use during thetest, how much would you use it?
1925.3%
1 1.4%
4661.3%
4767.1%
7 9.3%
1927.1%
Would it help if the test used easier words?20
26.7%3
4.3%36
48.0%18
25.7%17
22.7%18
25.7%
What else would make it easier for you tounderstand the questions on the test?
Responses given by LEP students were different than those by non-LEP students.LEP students (more than non-LEP) indicated that they read the explanation in themargin (the glossary). More LEP students responded that the English and Spanish

CRESST Draft Deliverable52
explanations helped them understand the questions (see Table 10). In response to thequestion “Would you like to be able to use a dictionary during a test like this?”, 29.3%of non-LEP students said “No,” they would not like to use a dictionary as comparedwith 11.4% of LEP students who said that they would not. On the other hand, 20% ofnon-LEP students said “yes,” they would like to use a dictionary, as compared with45.7% of LEP students.
Table 11 presents mean, standard deviation and number of students responding tothe glossary follow-up questions. Similar to the means reported in Table 6 and Table 9,the trend of higher means for LEP students is evident from the data in Table 11.
Table 11
Mean and Standard Deviation of Ranks for the Follow-Up Questions, Glossary Booklet
Non-LEP LEP
Questions Mean SD N Mean SD N
In the science test, were there words that youdid not understand?
1.57 .58 74 1.96 .50 68
Did you read the explanation in the marginsin English (on the right side of the page)?
1.81 .51 74 2.17 .65 66
Did the English explanations help youunderstand the questions?
1.97 .68 74 2.40 .63 68
Did you read the explanation in the marginsin Spanish (on the left side of the page)?
1.11 .36 74 1.42 .63 66
Did the Spanish explanations help youunderstand the questions?
1.05 .23 74 1.66 .74 68
Would you like to be able to use a dictionaryduring a test like this?
1.90 .72 72 2.36 .69 67
If you had a dictionary to use during the test,how much would you use it?
1.83 .58 72 2.27 .48 67
Would it help if the test used easier words? 1.96 .72 73 2.38 .63 39
Table 12 reports the results of multivariate ANOVA for the eight questions in theglossary follow-up questionnaire, comparing mean Likert scores of LEP and non-LEPstudents. As the data in Table 12 suggest, in all 8 questions the differences in meanbetween LEP and non-LEP were significant.

LEP Accommodations on NAEP 53
Table 12
Multivariate ANOVA Results for Follow-Up Questions, Glossary Booklet
SS MS
Variable Hypo. Error Hypo. Error F P
Question 1 4.70 39.91 4.70 .29 16.00 .000
Question 2 3.73 45.09 3.73 .33 11.26 .001
Question 3 5.55 58.94 5.55 .43 12.80 .000
Question 4 3.38 34.74 3.38 .26 13.22 .000
Question 5 11.81 38.52 11.81 .28 41.69 .000
Question 6 3.03 54.04 3.03 .39 7.62 .007
Question 7 5.39 22.00 5.39 .16 33.32 .000
Question 8 4.57 23.66 4.57 .17 26.26 .000
Different follow-up questionnaires were used for the three testing groups, theoriginal, the dictionary, and the glossary groups. However, some of the questions wereidentical across the three groups and other questions were similar. The similarity of thefollow-up questions across the three testing groups may warrant the following generalconclusion. However, the follow-up questions were not significantly related to thescience test scores.
In general, the responses provided by LEP students imply that they had moredifficulty with the language of test items than the non-LEP students had. For example:
1. More LEP than non-LEP students indicated that, in the science test, there werewords that they did not understand.
2. LEP students, more than non-LEP, wanted explanation of some of the difficultwords.
3 . More LEP than non-LEP students expressed interest in using a dictionaryduring the test.
4. LEP students, more than non-LEP, indicated that it would help them if the testexplained words in another language.
5 . More LEP than non-LEP students expressed a preference for a dictionaryduring the test.

CRESST Draft Deliverable54
Background Questionnaire
As indicated in our methodology section, along with the science test and theFollow-Up Questionnaire, a background questionnaire was also included in the testbooklet. The background questionnaire consists of 35 questions. These questions canbe categorized as follows:
1. Demographic questions: Questions 1–5 are demographic questions aboutcountry of origin, length of time in the U.S., gender, zip code, and ethnicity.
2. A language other than English: Questions 6–14 ask students if they use alanguage other than English at home and with relatives and if they do, howproficient they are with that language.
3. Studied a subject in other languages: Questions 15–18 ask students if theystudied science or any other subjects in a language other than English.
4. Self-reported English proficiency: Questions 19–22 ask students to self-reporttheir level of English proficiency (understanding, speaking, reading, andwriting).
5. Home environment: Questions 23–27 ask about home environment; forexample, are there newspapers, books, and encyclopedias in English in thehome, and number of hours of television viewing.
6. School and interest: Questions 28–29 ask about school changes and plans forfuture schooling, and questions 30-31 ask about students’ interest in science.
7. Self-reported grades: Questions 32–34 ask students to self-report their grades inschool.
Results of Analyses of Background Questions
Some of the background questions may not be directly related to the mainhypotheses of this study discussed earlier; however, they provide useful information.We will report the results of analyses of the background questionnaire using thecategories of questions discussed above.
Analyses by Demographic Questions
The findings of previous studies suggest that length of time in the U.S. is one of thestrong predictors of school achievement for LEP students. To examine replicability of

LEP Accommodations on NAEP 55
this finding in our study, we computed a correlation between students’ performance inscience and the length of time that students have been in the U.S. This correlation was.0865 (p>.05), which was not statistically significant.
The gender effect on scores was another interesting research question that wecould address using the background questions. Performance of male and femalestudents in science was compared. Mean science score for the male students is 10.61(SD=4.25, n=222) and for females, the mean is 10.40 (SD=4.18,n=199). A t-test of .50(df=419, p=.617) indicates that the difference between mean scores of male and femalestudents is not statistically significant.
A Language Other than English
Students were asked whether or not they speak a language besides English. Wecompared the performance of students who responded “Yes” to this question withthose who responded “No”. Mean science scores for those responding “Yes” is 9.99(SD=4.20, n=307). The mean for those responding “No” is 12.54 (Sd=3.50, n=94); adifference of about 2/3 of a standard deviation. This difference between theperformance of students who speak a language other than English with those whospeak only English at home is statistically significant (t=5.34, df=399, p=0.00).
Questions 7 to 10 ask students how much they speak that language with others(parents, brothers and sisters, friends at school and outside). Since these questions areall about the use of the other language, we created a composite variable of all fourquestions that ask about “How much do you speak that language with….” Thesequestions have three response categories, “Always or most of the time,” “Sometimes,” and“Never or hardly ever.” We assigned 1 to “Always or most of the time,” 2 to “Sometimes, and3 to “Never or hardly ever”. Thus, the composite variable ranges from 4 (always or mostof the time speaks the language with others) to 12 (never or hardly ever).
Table 13 shows means and standard deviations for the four questions on the use ofa language other than English.

CRESST Draft Deliverable56
Table 13
Mean, Standard Deviation, and Number of Respondents for the FourQuestions About the Use of a Language Other Than English
Variable Mean S.D. N
Question 7 1.55 .66 317
Question 8 2.05 .73 313
Question 9 2.30 .78 315
Question 10 2.27 .77 315
Composite 8.04 2.34 320
Since “Always or most of the time” was coded as 1 and “Never” as 3, the larger themean for the four questions, the less the language is spoken with others. As Table 13shows, mean for question 7 (M=1.55, Sd=.66) is smaller that the mean for otherquestions. This question asks students how much they speak that language with theirparents. The small mean for this question (as compared with the mean for otherquestions) suggests that students speak that language more with their parents than withbrothers/sisters or friends.
These four questions (Q7 to Q10) were answered mainly by the non-native Englishspeakers; therefore, comparisons across LEP groups (LEP versus non-LEP) was notmeaningful. However, we examined the relationship between this composite variable(use of a language other than English) with students’ performance in science. A P.M.correlation of .238 significant beyond .01 nominal level suggested that there isrelationship between speaking a language other than English with performance inscience. Since this composite variable is a proxy of students’ LEP status, this finding isconsistent with our earlier finding that LEP students perform significantly lower inscience than non-LEP students.
Questions 11 to 14 ask students to self-report their proficiency level in thelanguage other than English that they use. The format (response options) of thesequestions is similar to the format of questions on the use of the other language that wasdiscussed earlier. Number 1 was assigned to “Very well,” 2 to “Fairly well,” and 3 to“Not very well.”

LEP Accommodations on NAEP 57
Table 14 presents mean, standard deviation, and number of respondents to thesequestions. As data in Table 14 suggest, students have more difficulty with writing(M=2.00, SD=.78) and reading (M=1.97, SD=.80) and less difficulty with understanding(M=1.43, SD=.61) and speaking (M=1.59, SD=.63).
Table 14
Mean, Standard Deviation, and Number of Respondents for the FiveQuestions About the Level of Proficiency of the Language Other ThanEnglish
Variable Mean S.D. N
Q11, Speak 1.59 .63 311
Q12, Understand 1.43 .61 309
Q13, Read 1.97 .80 311
Q14, Write 2.00 .78 310
Composite 6.91 2.34 314.
A composite variable consisting of all self-reported first language proficiency wascreated. Mean for this variable (as reported in Table 14) is 6.91 (SD=2.34) which ishigher than the midpoint of 6.00 (maximum score is 12; 4 questions by 3-points eachquestion). This higher-than-midpoint mean suggests that students believed that theyhad difficulty in the language that they spoke mainly with their parents and sometimeswith their other family members and friends. A P.M. correlation coefficient of .189,significant beyond the .01 nominal level, suggests that a relationship exists between theproficiency in the first language and students’ performance in science. Thisrelationship, although not very strong (only 3.6% of the variance of joint distribution), isin the opposite direction. That is, the more proficient the student claimed to be inhis/her first language, the lower the level of science performance he/she demonstrated.
Self-Reported English Proficiency
Questions 19-22 ask students to self-report their level of English languageproficiency. The format (response options) of these questions is similar to the format ofquestions on self-reported proficiency on the first language, that was discussed earlier.Number 1 was assigned to “Very well,” 2 to “Fairly well,” and 3 to “Not very well.”

CRESST Draft Deliverable58
Table 15
Mean, Standard Deviation, and Number of Respondents for the FiveQuestions About the Level of English Language Proficiency
Variable Mean S.D. N
Q19, Understand 1.20 .44 405
Q20, Speak 1.23 .45 412
Q21, Read 1.31 .50 408
Q22, Write 1.38 .54 408
Composite 5.07 1.56 412
Table 15 reports mean, standard deviation, and number of respondents toquestions 10-22. As Table 15 shows, students self-reported relatively high levels ofEnglish proficiency, higher than the level of proficiency for the first language (by thosewho speak a language other than English). However, compared with the mean of self-reported proficiency in understanding (M=1.20, SD=.44) and speaking English (M=1.23,SD=.45), the mean for reading (M=1.31, SD=.50) and writing (M=1.38, SD=.54) washigher, suggesting more difficulty in these two areas of language.
A P.M. correlation coefficient of -.255 (6.5% of the variance), significant beyond the.01 nominal level, suggests that a relationship exists between students’ level of languageproficiency and their score in the science test. Unlike the correlation reported earlier forthe self-reported proficiency in a language other than English, the direction ofrelationship is in the expected direction. That is, the higher the level of languageproficiency, the higher a students’ performance in science.

LEP Accommodations on NAEP 59
Discussion
Research Hypothesis and Findings
The main hypothesis of this study is the effectiveness issue of accommodations.That is, how effective were the accommodation strategies that were used in this study?As reported in the results section of this report, overall, the provision of accommodationdid not impact students' performance. For non-LEP students, a mean score of 10.29 forthe original version of the test, 10.86 for the dictionary, and 10.34 for the glossary,suggest that accommodations did not have any sizable impact on students’performance in general. As reported in the Results section of this report, the provisionof accommodation did not impact the performance of non-LEP students. A mean scoreof 11.71 for the unaccommodated test, 11.37 for the test plus dictionary, and 11.95 forthe test plus glossary indicate that accommodations did not have a sizable impact ontheir performance. However, when performance of students under accommodated andnon-accommodated assessments were compared across the students’ LEP status,interesting trends were apparent.
Comparing the performance of LEP students on the tests with an accommodationwith their performance on the unaccommodated test reveals that the accommodationsactually contributed to improved performance of LEP students. LEP students whowere provided the customized dictionary performed significantly better than thoseassessed under the standard NAEP condition. Providing the definitions of non-technical words (glossary) also helped LEP students, but the effect did not reach a levelof statistical significance.
Addendum
Both accommodations focused on potentially difficult vocabulary. However, onlythe dictionary accommodation resulted in significantly higher scores for LEP students.An interesting question is why the glossary accommodation did not show similarresults. There are a number of possible reasons, which we are currently exploring:
• Did students find it easier to use the dictionary than the glossary? Did they usethe dictionary more?

CRESST Draft Deliverable60
• In the glossary version of the test booklet, inclusion of Spanish translations andEnglish glosses made the pages rather busy visually; did this divert thestudent’s attention from the science question?
• Did the glossary leave out important words? The dictionary included morewords per item than the glossary version, and the words for the glossary thatwere selected by researchers may not have been the words that the studentsactually looked up in the dictionary.
• Was the dictionary more informative than the glossary? The dictionarydefinitions were longer than the corresponding glosses; students may havefound them more helpful.
A dictionary is, in a sense, a mini-encyclopedia. Since the dictionary included allcontent words, both technical and non-technical, an important question is whether thedictionary provided content-area information that helped the student answer thescience question. We are reviewing items and definitions to determine this. However,the fact that the dictionary definitions did not help non-LEP students is strong evidencethat the accommodation did not provide content information.
The second hypothesis, a major concern in any accommodation study, questionedthe validity of accommodation. The results of this study clearly indicate that acustomized dictionary helped LEP students. The question remaining is whether theaccommodation:
A) reduced the performance gap between LEP and non-LEP.
B) increased the performance gap between LEP and non-LEP.
C) increased the performance of all students.
To address this validity concern, we compared the accommodatedunaccommodated performance of non-LEP students. If a given accommodationstrategy affects the construct under measurement, then the accommodated non-LEPstudents should have performed significantly better than the non-accommodated non-LEP. The results of our analyses indicate that the accommodation did not affect theperformance of non-LEP. The means of non-LEP student groups across the threeaccommodation conditions (Original, Dictionary, and Glossary) are not significantlydifferent.
The results of this study suggest that, among the two accommodation strategiesthat were used in this study, the customized dictionary was effective in reducing thegap between LEP and non-LEP scores. The accommodation did not affect the validityof the assessment. The results also show that, once the variability of reading

LEP Accommodations on NAEP 61
performance was taken into account, the LEP students outperformed the non-LEPstudents in science. This is consistent with previous findings, which show a strongcorrelation between language proficiency and academic performance.
Follow-Up Questions
As discussed in the methodology and results sections of this report, students wereasked to respond to a set of follow-up questions and a set of background questions. Thepurpose of the follow-up questions was to see if students who receivedaccommodations found them useful and how much they actually used theaccommodations (for example, how often they referred to the dictionary and how muchthey used the glossary). The analyses of the follow-up questions show that more LEPthan non-LEP students reported that they actually utilized the accommodations andthat the dictionary and glossary were useful.
Background Questions
Student background information includes factors such as community, school,home, and individual characteristics that impact students in academic settings (Butlerand Stevens, 1997). It is well documented that, some components found in the ScienceBackground Questionnaire of this study play an important role in academicperformance (DeAvila, Cervantes and Duncan, 1978; Heath, 1983; and Thurlow, Elliot,and Ysseldyke, 1998). Gonzales et al. (1996) emphasizes the importance of factoring inlinguistic and cultural characteristics for assessments in order for them to be valid. Thisstudy analyzed the relationship between those background characteristics and the useof accommodations in an evaluation.
The background questionnaire used for this study included 35 questions,categorized as follows, for analyses:
1. demographic questions
2. a language other than English
3. studied a subject in other languages
4. self-reported English proficiency
5. home environment
6. school and interest
7. self-reported grade points

CRESST Draft Deliverable62
Students’ responses to the background questions provided data for testing ofadditional hypotheses concerning the impact of students’ background variables,including their language background variables in relation to their performance. Ouranalyses showed no significant gender differences. However, a large significantdifference was found between the performance of students who speak only English inthe home and those who speak a language other than English in the home. Studentswho speak a language other than English performed significantly lower than the othergroup. This finding is consistent with the literature and the findings that are reportedearlier in this paper. Since students who speak a language other than English aremainly LEP students, their performance was lower than the monolingual English-speaking students (non-LEP.) Of the total number of LEP students participating in thisstudy, 96% spoke a language other than English.
Self-reported data on the level of first and second language proficiency alsoprovided useful information. Students who speak a language other than English in thehome indicated that they speak that language more with their parents and less withtheir brothers, sisters, and friends. These findings, consistent with the existingliterature, reflect a generation gap and suggest that older family members may not havesufficient English language facility to communicate comfortably with their children inEnglish. The children, therefore, find it necessary to use their native language whencommunicating with their parents and grandparents.
The results of analyses on the self-reported data about English proficiency werealso consistent with the literature and with the earlier findings of this study. LEPstudents reported significantly lower proficiency in English than their non-LEPcounterparts.
Limitations
This study focuses on a particular population and utilizes specific testingmaterials. Therefore, the generalizability of this study is limited. Its analyses arelimited by the following parameters:
1. Grade level - Grade 8
2. Sample size, it is a pilot study
3. Content area – science

LEP Accommodations on NAEP 63
4. LEP language background – primarily Spanish
5. Accommodation type - dictionary and glossary
It should be noted that an accommodation for one grade level may not necessarilybe appropriate, or even considered an accommodation, for another grade level.Students in lower elementary grade levels may not know how to use a dictionary, ormay be in the process of learning to use a dictionary, whereas students in higherelementary grade levels and beyond may be using a dictionary to learn. For this lattergroup, dictionary use during a testing situation is considered an accommodation. Forexample, for students in Grade 3 and beyond, the use of a dictionary has already beentaught.
In an effort to find classrooms with an equal number of LEP and non-LEPstudents, site selection was based on state demographic information at the school sitelevel. However, state demographic information does not necessarily reflect the LEP andnon-LEP distribution for all classes at a school site. Therefore, future site selectionshould be based on demographic information collected at the classroom level.
A large proportion of the LEP population in southern California is native Spanishspeaking. Accordingly, for the glossary accommodation we included English glossesand Spanish translations. In our sample, 88% of the LEP students were Hispanic, and26% of the non-LEP students were Hispanic. LEP students with first languages otherthan Spanish may have benefited from the English glosses, but the accommodation tellsus nothing about the potential impact of translations in their first languages.
Implications and Recommendations
This study addresses several major issues concerning accommodations for LEPstudents. Although these analyses report on the pilot phase of the study, there arenevertheless several implications for future NAEP assessments.
Since the NAEP is a large-scale assessment, feasibility considerations areimportant. NAEP assessments involve a large number of LEP students, and ease ofadministration is a factor. Any element that reduces the burden on states, schools, andstudents will have a potential positive impact on future NAEP administrations.
Educators are developing accommodation strategies that may reduce the gapbetween LEP and non-LEP scores in large-scale evaluations. Not all of these strategiesmay turn out to be easily administered. One-on-one testing, for example, may be a

CRESST Draft Deliverable64
highly effective form of accommodation, but it may not be feasible in large-scaleassessments such as the NAEP.
In this study we included only accommodation strategies that we considered easyto implement. A major innovation of this study was the use of a customized dictionary,as an accommodation, in the assessment of students with limited English proficiency.As this study demonstrates, providing a customized dictionary is a viable alternative toproviding traditional dictionaries.
Dictionaries are, in fact, already widely used as instructional aids for LEP students,so the concept was not an unfamiliar one for the students. Providing students withactual dictionaries in a testing situation requires extra logistical arrangements andadditional cost. In contrast, the customized dictionary’s limited number of pagesallowed it to be attached directly to the test booklet, minimizing the economic andadministrative burden. However, the economic and technical feasibility of providing acustomized dictionary as a potential form of accommodation must be evaluatedthrough cost-benefit analysis before a decision can be made concerning its advisability.
Another area of consideration is the inclusion of additional background queries infuture studies. Collecting additional information about the academic performance andthe language proficiency level of students may help to clarify issues associated withinconsistency in the definition of LEP and the inclusion criteria for standardizedassessments. The inclusion of reading achievement data from SAT-9, supplied by theschools, provided valuable information on the language proficiency levels of studentsbeyond the LEP designations.
Given the inconsistency in the LEP designation criteria, gathering additionalinformation about a student’s academic and language performance would provide amore comprehensive picture of the student’s academic knowledge. More accurateconclusions would be possible from analyses of contextual data, such as student’sperformance on other content areas and information on family and languagebackground.
LEP Accommodations on NAEP 65
References
Abedi, J., Boscardin, C.K., & Larson, H. (2000). AERA Special Interest Group. Summaries ofResearch on Inclusion of Students with Disabilities & Limited English ProficientStudents in Large-Scale Assessments. Los Angeles, CA: National Center forResearch on Evaluation, Standards, and Student Testing.
Abedi, J., Hofstetter, C. & Lord, C. (1998). Impact of Selected Background variables onStudents’ NAEP Math Performance: NAEP TRP Task 3D: Language background study.Los Angeles: UCLA Center for the Study of Evaluation/National Center forResearch on Evaluation, Standards, and Student Testing (CRESST).
Abedi, J., Hofstetter, C., Lord, C. & Baker, E. (1998). NAEP math performance and testaccommodations: Interactions with student language background, Draft Report. LosAngeles: University of California, Los Angeles, National Center for Research onEvaluation, Standards, and Student Testing(CRESST).
Abedi, J., Lord, C. & Plummer, J. (1995). Language background as a variable in NAEPmathematics performance: NAEP TRP Task 3D: Language background study. LosAngeles: UCLA Center for the Study of Evaluation/National Center for Researchon Evaluation, Standards, and Student Testing.
Aiken, L. R. (1971). Verbal factors and mathematics learning: A review of research.Journal for Research in Mathematics Education, 2, 304-13.
Aiken, L. R. (1972). Language factors in learning mathematics. Review of EducationResearch, 42(3), 359-85.
Anderson, N.E., Jenkins, F. F., & Miller, K.E. (1996). NAEP Inclusion criteria and testingaccommodations: Findings from the NAEP 1995 field test in mathematics. Washington,D.C.: Educational Testing Service.
Anstrom, K. (1997). Academic Achievement for Secondary Language Minority Students:Standards, Measures and Promising Practices. Washington, DC.: NationalClearinghouse for Bilingual Education.
August, D., Hakuta, K., & Pompa, D. (1994). For all students: Limited English ProficientStudents and Goals 2000. Washington, DC: National Clearinghouse for BilingualEducation.
August, D. & McArthur, E. (1996). U.S. Department of Education. National Center forEducation Statistics. Proceedings of the Conference on Inclusion Guidelines andAccommodations for Limited English Proficient Students in National Assessment ofEducational Progress. NCES 96-861. Washington, D.C.: National Center forEducation Statistics.

CRESST Draft Deliverable66
Braun, H., Ragosta, M., & Kaplan., B. (1988). Predictive validity. In W.W. Willingham,M. Ragosta,R.E. Bennett, H. Braun, D.A. Rock, & D.E. Powers (Eds.), Testinghandicapped people. Boston, MA: Allyn and Bacon.
Burstein, L. (1993, July). TRP investigations of validity of NAEP measures. Paperpresented at the TRP/NCES meeting, Washington, DC.
Butler, F.A. & Castellon-Wellington, M. (2000). Students’ concurrent performance on tests ofEnglish language proficiency and academic achievement. (Draft Deliverable toOBEMLA. Los Angeles: UCLA Center for the Study of Evaluation/NationalCenter for Research on Evaluation, Standards, and Student Testing (CRESST).
Butler, F.A. & Stevens, R. (1997). Accommodation strategies for English Language Learnerson large-scale assessments: Student characteristics and other considerations. (CSE Tech.Report). Los Angeles: University of California, Center for the Study ofEvaluation/National Center for Research on Evaluation, Standards, and StudentTesting.
Carpenter, T.P., Corbitt, M.K., Kepner, H.S., Jr., Linquist, M.M., & Reys, R. E. (1980).Solving verbal problems: Results and implications from national assessments.Arithmetic Teacher, September 28, 8-12.
Cassels, J. R. T. & Johnstone, A.H. (1984). The effect of Language on StudentPerformance on Multiple Choice Tests in Chemistry. Journal of ChemicalEducation, v61 613-615.
Chiu, C.W.T., & Pearson, D., (1999, June). Synthesizing the Effects of Test Accommodationsfor Special Education and Limited English Proficient Students. Paper presented at theNational Conference on Large Scale Assessment, Snowbird, UT.
Cocking, R.R. & Chipman, S. (1988). Conceptual Issues Related to MathematicsAchievement in Language Minority Children. In R.R. Cocking & J.P. Mestre(Eds.), Linguistic and Cultural Influences on Learning Mathematics, (pp. 17-46).Hillsdale, NJ: Erlbaum Associates.
De Avila, E. (1997). Setting Expected Gains for Non and Limited English ProficientStudents. NCBE Resource Collection. (Series No. 8).
De Avila, E.A., Duncan, S.E., & Navarrete, C.J. (1988). Finding out/Descubrimiento(Teacher's Resource Guide). Northvale, NJ: Santillana.
De Corte, E., Verschaffel, L., & De Win, L. (1985). Influence of rewording verbalproblems on children’s problem representations and solutions. Journal ofEducational Psychology, 77(4), 460-470.
Figueroa, R.A. (1990). Best practices in the assessment of bilingual children. In A.Thomas & J. Grimes (Eds.), Best practices in school psychology (pp. 93-106).Washington, DC: National Association of School Psychologist.

LEP Accommodations on NAEP 67
Gesinger, K.F. & Carlson, J.F. (1992). Assessing Language-Minority Students.Assessment, Research and Evaluation, 3(2), 1-4.
Gonzales, V., Castellano, J.A., Bauerle, P., & Duran, R. (1996). Attitudes and Behaviorstoward testing-the-limits when assessing LEP students: results of a NABE-Sponsored National Survey. The bilingual Research Journal, 20, 3, 433-463.
Heath, S. B. (1983). Ways with words language, life, and work in communities and classrooms.(pp. 421). Cambridge Cambridgeshire, New York: Cambridge University Press;xiii,
Jerman, M., & Rees, R. (1972). Predicting the relative difficulty of verbal arithmeticproblems. Educational Studies in Mathematics, 4, 306-323.
Kessler, C.., Quinn, M.E. & Fathman, A.K. (1992). Science and cooperative learning forLEP students. In C. Kessler (Ed.), Cooperative langauge learning: A teacher's resourcebook. (pp. 65-84). Englewood Cliffs, NJ: Prentice Hall Regents.
Kintsch, W., & Greeno, J. G. (1985). Understanding and solving word arithmeticproblems. Psychological Review, 92(1), 109-129.
Kopriva, R. (2000). Ensuring Accuracy in Testing for English Language Learners,Washington, DC: Council of Chief State School Officers.
Liu, K., Thurlow, M., Erickson, R., Spicuzza, R., & Heinze, K. (1997). A Review of theLiterature on Students with Limited English Proficiency and Assessment. (MinnesotaReport 11). Minneapolis: University of Minnesota, National Center onEducational Outcomes.
Lam, T.C., & Gordon, W.I. (1992). State Policies for Standardized Achievement Testingof Limited English Proficient Students. Educational Measurement: Issues andPractice, 11, 4,18-20.
Larsen, S. C., Parker, R. M., & Trenholme, B. (1978). The effects of syntactic complexityupon arithmetic performance. Educational Studies in Mathematics, 21, 83-90.
Lepik, M. (1990). Algebraic word problems: Role of linguistic and structural variables.Educational Studies in Mathematics, 21, 83-90.
Longman Dictionary of American English (2nd ed.). (1997). White Plains, NY: Longman.
Mazzeo, J. (1997, March). Toward a more inclusive NAEP. Paper presented at the annualmeeting of the American Educational Research Association, Chicago, IL.
Mazzeo, J.E. Carlson, K.E. Voelkl, & Lutkus, A.D. (2000). Increasing the Participation ofSpecial Needs Students in NAEP: A Report on 1996 NAEP Research Activities (NCES2000-473), Washington, DC.: U.S. Department of Education. Office of EducationalResearch and Improvement. National Center for Education Statistics.

CRESST Draft Deliverable68
McDonnell, L., McLaughlin, & Morrison. (1997). Educating One & All: Students withDisabilities and Standards-Based Reform. Washington DC: National ResearchCouncil, National Academy Press.
Mestre, J.P. (1988). The Role of Language Comprehension in Mathematics and ProblemSolving. In R.R. Cocking & J.P. Mestre (Eds.), Linguistic and Cultural Influences onLearning Mathematics, (pp. 200-220). Hillsdale, NJ: Erlbaum Associates.
Montani, T.O. (1995). Calculation Skills of Third-Grade Children with Mathematics andReading Difficulties. Unpublished Ed.d., Rutgers the State University of NewJersey, New Brunswick.
Moss, Marc; Puma, Michael J, (1995). Prosects, the congressionally mandated study ofeducational growth and opportunity first year report on language minority and LimitedEnglish Proficient students. Washington, DC: U.S. Dept. of Education, Office of theUnder Secretary. Office of Educational Research and Improvement, EducationalResources Information Center, 1 v microform.
Munro, J. (1979). Language abilities and math performance. Reading Teacher, 32(8), 900-915.
National Clearinghouse for Bilingual Education. (1997). High Stakes Assessment: Aresearch agenda for English language learners. Symposium Summary.Washington, DC.
Noonan, J. (1990). Readability problems presented by mathematics text. Early ChildDevelopment and Care, 54, 57-81.
North Central Regional Educational Laboratory. (1996). Part 1: Assessment of studentswith disabilities and LEP students. The status report of the assessment programs in theU.S. State student assessment program database. Oakbrook, IL: NCREL andCCSSO.
O’Connor, M & Michaels, S. (1993). Aligning Academic Task and Participation Statusthrough Revoicing: Analysis of a Classroom Discourse Strategy. Anthropology andEducation Quarterly, v24 n4, 318-35.
Ofiesh, N.S. (1997). Using Processing Speed Tests to Predict the Benefit of Extended Test Timefor University Students with Learning Disabilities. Unpublished Ph.D. dissertation,The Pennsylvania State University.
Olmedo, Esteban L. (1981). Testing linguistic minorities. American Psychologist, Oct. 36(10), 1078-1085.
Olson, J.F., & Goldstein, A. A. (1997). The inclusion of students with disabilities and limitedEnglish Proficiency students in large-scale assessments: A summary of recent progress.(NCES 97-482). Washington DC: U.S. Department of Education, National Centerfor Education Statistics.

LEP Accommodations on NAEP 69
Orr, E. W. (1987). Twice as less: Black English and the performance of Black students inmathematics and science. New York: W. W. Norton.
Rothman, R. W., & Cohen, J. (1989). The language of math needs to be taught. AcademicTherapy, 25(2), 133-42.
Shepard, L., Taylor, G., & Betebenner, D. (1998). Inclusion of Limited-English-ProficientStudents in Rhode Island's Grade 4 Mathematics Performance Assessment (CSE Tech.Rep. No. 486) Los Angeles: University of California, National Center for Researchon Evaluation, Standards, and Student Testing (CRESST).
Solano-Flores, W. & Nelson-Barber, S. (2000). Cultural Validity of Assessments andAssessment Development Procedures. Paper presented at the American EducationalResearch Association Annual Meeting, New Orleans, LA.
Spanos, G., Rhodes, N. C., Dale, T. C., & Crandall, J. (1988). Linguistic features ofmathematical problem solving: Insights and applications. In R. R. Cocking & J. P.Mestre (Eds.), Linguistic and Cultural Influences on Learning Mathematics (pp. 221-240). Hillsdale, NJ: Erlbaum Associates.
Standards for educational and psychological testing. American Educational ResearchAssn, Washington, DC, USA; American Psychological Assn, Washington, DC,USA; National Council on Measurement in Education, USA . AmericanPsychological Association: Washington, DC, USA, 1985.
Stansfield, C. (1998). English Language Learners and State Assessments. Paper presented atthe annual meeting of the Massachusetts Association of Bilingual Educators,Leominster, MA.
Thurlow, M.L., Elliott, J.L., and Ysseldyke, J.E. (1998). Testing students with disabilities.Thousand Oaks, CA: Corvin Press, Inc.
Valencia, Richard R. & Rankin, Richard J. (1985). Evidence of content bias on theMcCarthy Scales with Mexican American children: Implications for testtranslation and nonbiased assessment. Journal of Educational Psychology. Apr;77(2). 197-207.
Willingham, Ragosta, M., Bennett, R.E., Braun, H., Rock, D.A. & Powers, D.E. (Eds.)(1988). Testing handicapped people. Boston, MA: Allyn and Bacon.
Zehler, A. (1994). An examination of assessment of limited English proficient students.Arlington, VA: Development Associates, Special Issues Analysis Center.

Appendix A
Follow-up Questionnaires for three groups:
ControlDictionaryGlossary
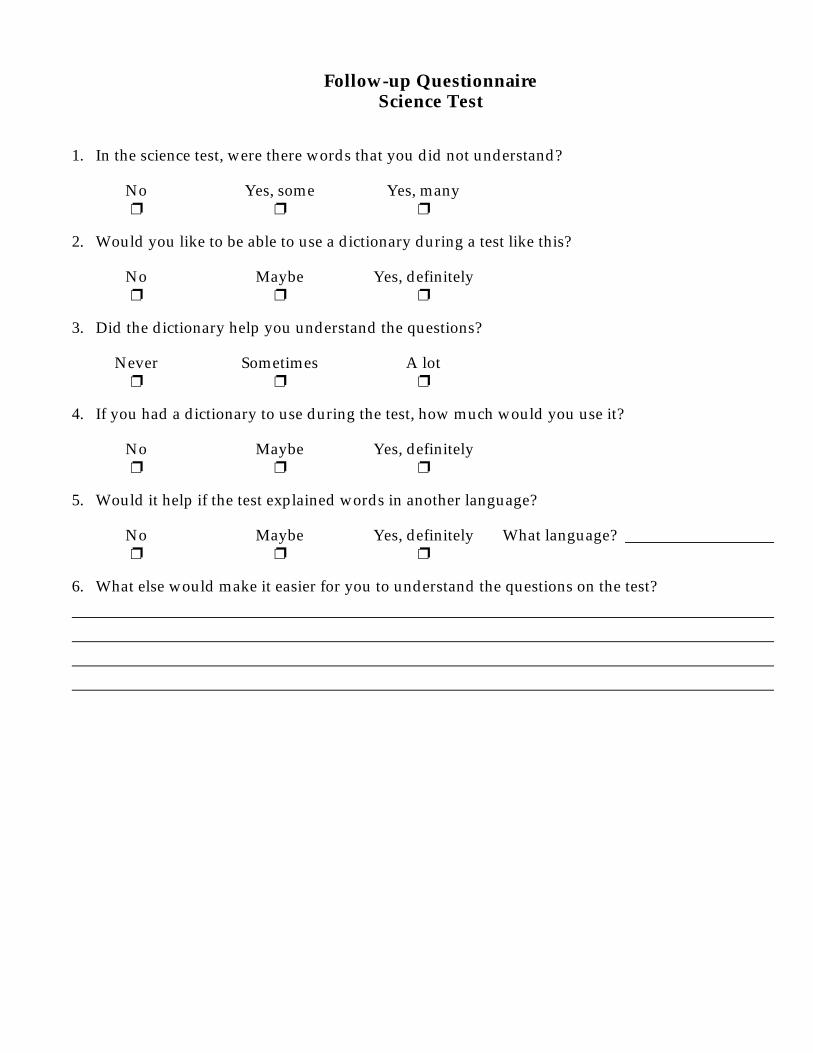
Follow-up QuestionnaireScience Test
1. In the science test, were there words that you did not understand?
No❐
Yes, some❐
Yes, many❐
2. Would you like to be able to use a dictionary during a test like this?
No❐
Maybe❐
Yes, definitely❐
3. Did the dictionary help you understand the questions?
Never❐
Sometimes❐
A lot❐
4. If you had a dictionary to use during the test, how much would you use it?
No❐
Maybe❐
Yes, definitely❐
5. Would it help if the test explained words in another language?
No❐
Maybe❐
Yes, definitely❐
What language?
6. What else would make it easier for you to understand the questions on the test?

Follow-up QuestionnaireScience Test with Dictionary
1. In the science test, were there words that you did not understand?
No❐
Yes, some❐
Yes, many❐
2. Did you use the dictionary attached at the end of your test booklet to look up words?
No❐
Yes, some❐
Yes, a lot❐
3. Did the dictionary help you understand the questions?
No❐
Yes, some❐
Yes, a lot❐
4. Would it help if the test explained words in another language?
No❐
Maybe❐
Yes, definitely❐
What language?
5. Would it help if the test used easier words?
No❐
Maybe❐
Yes, definitely❐
6. What else would make it easier for you to understand the questions on the test?

Follow-up QuestionnaireScience Test with Glossary
1. In the science test, were there words that you did notunderstand?
5. Did the Spanish explanations helpquestions?
No❐
Yes, some❐
Yes, many❐
No❐
Yes, some❐
2. Did you read the explanations in the margins in English(on the right side of the page)?
6. Would you like to be able to use a test like this?
No❐
Yes, some❐
Yes, a lot❐
No❐
Maybe❐
3. Did the English explanations help you understand thequestions?
7. If you had a dictionary to use duriwould you use it?
No❐
Yes, some❐
Yes, a lot❐
Never❐
Sometimes❐
4. Did you read the explanations in the margins in Spanish(on the left side of the page)?
8. Would it help if the test used easie
No❐
Yes, some❐
Yes, a lot❐
No❐
Maybe❐
9. What else would make it easier for you to understand the questions on the test?

Appendix B
Science Background Questionnaire


Science Background Questionnaire
1. What country do you come from?_____________________________
2. How long have you lived in the United States? ____________ years
3. Are you a male or a female? Male ❒ Female ❒
4. What is your zipcode? ______________
5. Which best describes you (check one)?
❒ White (not Hispanic)❒ Black (not Hispanic)❒ Hispanic❒ Asian or Pacific Islander❒ American Indian or Alaskan Native
❒ Other ________________________
6. Do you speak a language besides English (check one)? Yes ❒ No ❒
If yes, what is that language? _______________________
If no, skip down to question #15.
7. How much do you speak that language with your parents?
Always or Never ormost of the time Sometimes hardly ever
❒ ❒ ❒8. How much do you speak that language with your brothers and sisters?
Always or Never ormost of the time Sometimes hardly ever
❒ ❒ ❒
9. How much do you speak that language with your friends at school?
Always or Never ormost of the time Sometimes hardly ever
❒ ❒ ❒10. How much do you speak that language with your friends outside school?
Always or Never ormost of the time Sometimes hardly ever
❒ ❒ ❒11. Do you speak that language well?
Very well Fairly well Not very well❒ ❒ ❒
12. Do you understand that language well ?

Very well Fairly well Not very well❒ ❒ ❒
13. Do you read that language well ?
Very well Fairly well Not very well❒ ❒ ❒
14. Do you write that language well ?
Very well Fairly well Not very well❒ ❒ ❒
15. Have you ever studied science in a language other than English?
❒ Yes ❒ No (if No, skip to #17)
16. If so, how long were you taught science in a language other than
English (choose one)?
❒ Less than one year❒ More than one year❒ All my life
17. Have you studied any subjects at school in a language other than English?❒ No❒ Yes (what subjects?) ________________________
18. How long have you studied science in English?
❒ All my life❒ Less than one year❒ More than one year
19. Do you understand spoken English well?
Very well Fairly well Not very well❒ ❒ ❒
20. Do you speak English well?
Very well Fairly well Not very well❒ ❒ ❒
21. Do you read English well?
Very well Fairly well Not very well

❒ ❒ ❒
22. Do you write English well?
Very well Fairly well Not very well❒ ❒ ❒
23. Does your family get a newspaper which is written in English regularly?
Yes No I don't know❒ ❒ ❒
24. Is there an encyclopedia which is written in English in your home?
Yes No I don't know❒ ❒ ❒
25. Are there more than 25 books in English in your home?
Yes No I don't know❒ ❒ ❒
26. Does your family get any English language magazines?
Yes No I don't know❒ ❒ ❒
27. How much television do you watch in a day?
❒ None❒ 1 hour or less❒ 2 hours❒ 3 hours❒ 4 hours❒ 5 hours❒ 6 hours or more
28. In the last two years, how many times have you changed schoolsbecause you moved?
❒ None❒ 1❒ 2❒ 3 or more

29. How far do you think you will go in school?
❒ I will not finish high school.❒ I will graduate from high school.❒ I will have some education after high school.❒ I will graduate from college.❒ I will go to graduate school.❒ I don't know.
30. I like science.
Strongly StronglyAgree Agree Undecided Disagree Disagree
❒ ❒ ❒ ❒ ❒
31. I am good at science.
Strongly StronglyAgree Agree Undecided Disagree Disagree
❒ ❒ ❒ ❒ ❒32. What are your grades in science since sixth grade?
❒ Mostly A's❒ Mostly C's❒ Mostly D's❒ Mostly below D❒ Classes not graded
33. What are your grades in English since sixth grade?
❒ Mostly A's❒ Mostly B's❒ Mostly C's❒ Mostly D's❒ Mostly below D❒ Classes not graded
34. What are your grades as a whole since sixth grade?
❒ Mostly A's❒ Mostly B's❒ Mostly C's❒ Mostly D's❒ Mostly below D❒ Classes not graded

Appendix C
Demographic Form


University of California, Los AngelesCenter for the Study of Evaluation
National Center for Research on Evaluation, Standards, and Student Testing301 GSE & IS
Los Angeles, CA 90095-1522
LEP Test Accommodation StudyDemographic Form
School Name: Test Date: Class Subject:
Teacher Name: Class Grade:
StudentName Gender Ethnicity
Does studentparticipate inschool Free
Lunch Program
Is StudentLEP or
Non-LEP
SAT-9Reading
ScoreSAT-9
Math ScoreLanguage
Art rate 1-5
Languagespoken at
home
1.
2.
3.
4.
5.
5.
6.
7.
8.
9.
10.
11.
12.
13.
14.
15.
16.
17.
18.
19.
20.
21.
22.
23.
24.
25.

LEP Test Accommodation StudyDemographic Form
(continued)
StudentName Gender Ethnicity
Does studentparticipate inschool Free
Lunch Program
Is StudentLEP or
Non-LEP
SAT-9Reading
ScoreSAT-9
Math ScoreLanguage
Art rate 1-5
Languagespoken at
home
26.
27.
28.
29.
30.
31.
32.
33.
34.
35.
Teacher: After completing this form, please return it to the test administrators on the day of thetest. You may also fax it to XXX at XXX within seven days after the test date. If you have anyquestions, please call XXX at XXX.

Appendix D
Science Teacher Questionnaire


Science Teacher Questionnaire
School Name: Teacher Name:
Date: Class Period: Class Time:
Type of Science Class: Integrated Science(check one) General Science
Life Science Earth Science Other
Language of Instruction: English Only(check one) Spanish Only
English Sheltered SDAIE Other
Topics covered so farthis year: contour maps(check all that apply) energy transformations
energy sources evolution biomes soil erosion the human body phases of matter physics of motion climate properties of water air pressure interpreting graphs
1. How many months have you been teaching this classroom of students? months.
2. How many students are in your class (present at time of testing)? students.
3. Approximately how many of the students in your class are:a. Limited English Proficient (LEP) – non-native English speakers b. Fluent English Proficient (FEP) - originally LEP, transitioned to FEP c. Initially Fluent in English (IFE) – native English speakers
4. In terms of ethnic background, approximately how many of your students are:a. Latino/Hispanic d. Asian/Pacific Islander b. Caucasian e. Other c. African-American f. Other
5. In terms of native language, approximately how many of your students speak:a. English d. Other b. Spanish e. Other c. Vietnamese f. Other
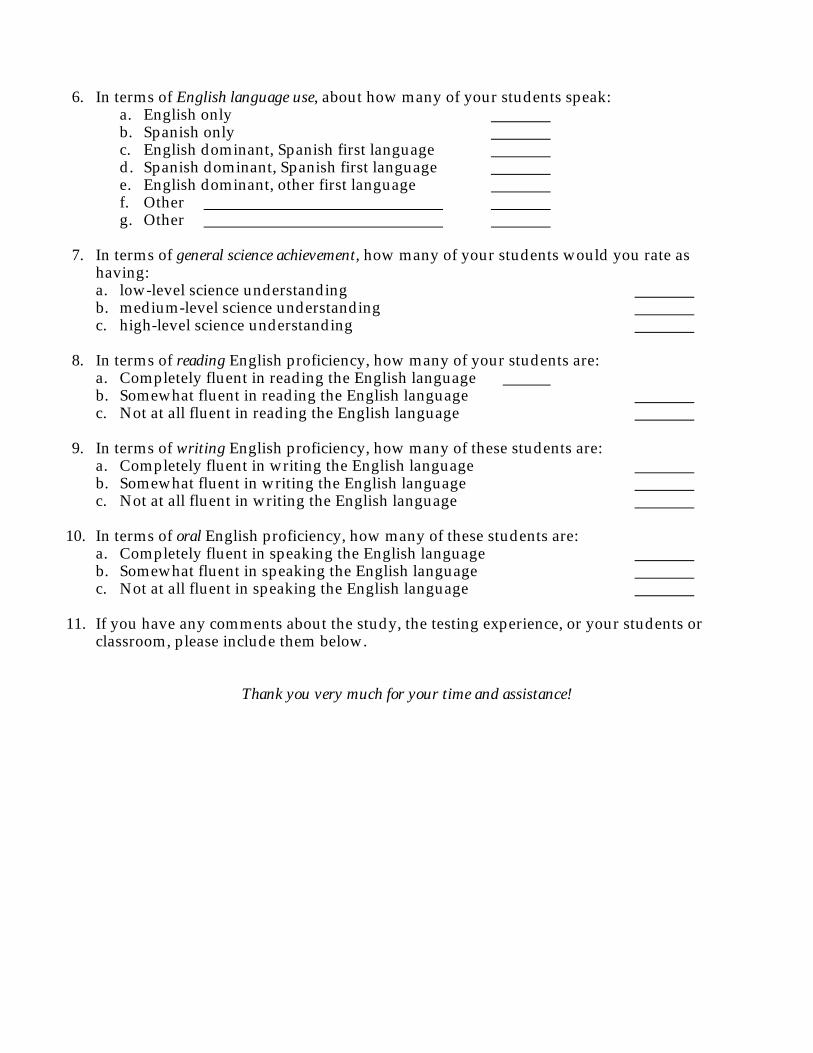
6. In terms of English language use, about how many of your students speak:a. English only b. Spanish only c. English dominant, Spanish first language d. Spanish dominant, Spanish first language e. English dominant, other first language f. Other g. Other
7. In terms of general science achievement, how many of your students would you rate ashaving:a. low-level science understanding b. medium-level science understanding c. high-level science understanding
8. In terms of reading English proficiency, how many of your students are:a. Completely fluent in reading the English language b. Somewhat fluent in reading the English language c. Not at all fluent in reading the English language
9. In terms of writing English proficiency, how many of these students are:a. Completely fluent in writing the English language b. Somewhat fluent in writing the English language c. Not at all fluent in writing the English language
10. In terms of oral English proficiency, how many of these students are:a. Completely fluent in speaking the English language b. Somewhat fluent in speaking the English language c. Not at all fluent in speaking the English language
11. If you have any comments about the study, the testing experience, or your students orclassroom, please include them below.
Thank you very much for your time and assistance!

Appendix E
Test Administrator Script


ADMINISTRATION SCRIPT
LEP STUDY
February 2000
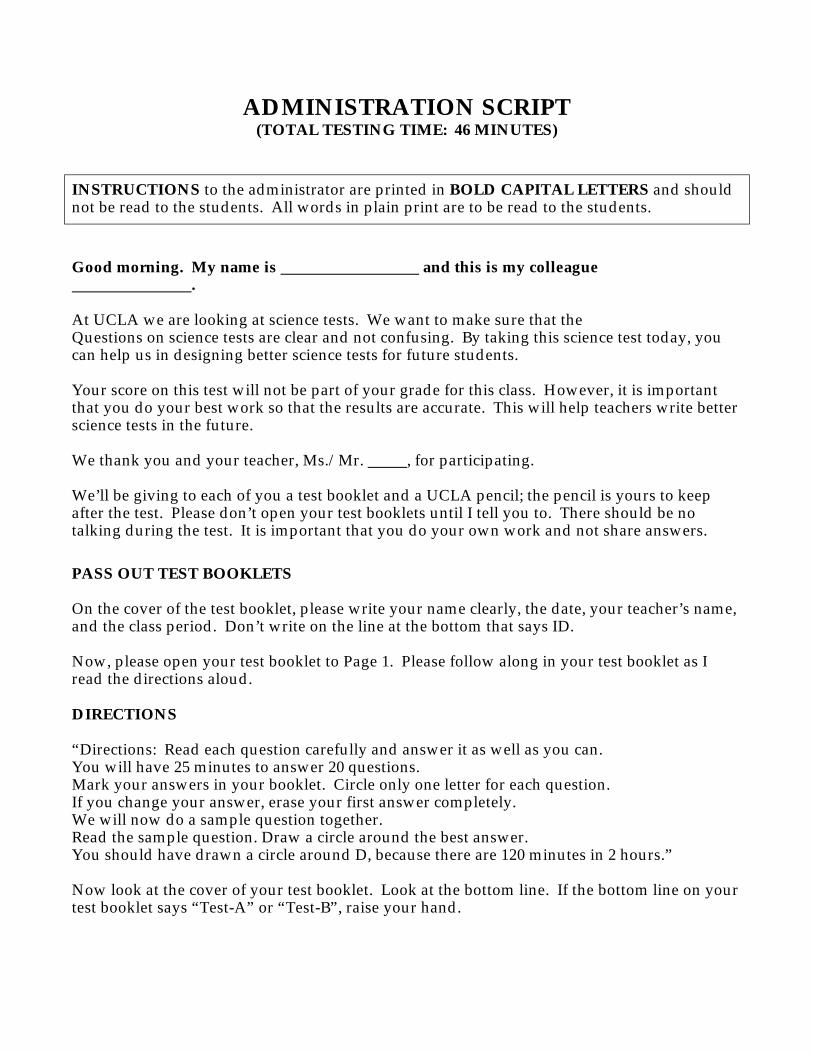
ADMINISTRATION SCRIPT(TOTAL TESTING TIME: 46 MINUTES)
INSTRUCTIONS to the administrator are printed in BOLD CAPITAL LETTERS and shouldnot be read to the students. All words in plain print are to be read to the students.
Good morning. My name is and this is my colleague .
At UCLA we are looking at science tests. We want to make sure that theQuestions on science tests are clear and not confusing. By taking this science test today, youcan help us in designing better science tests for future students.
Your score on this test will not be part of your grade for this class. However, it is importantthat you do your best work so that the results are accurate. This will help teachers write betterscience tests in the future.
We thank you and your teacher, Ms./Mr. , for participating.
We’ll be giving to each of you a test booklet and a UCLA pencil; the pencil is yours to keepafter the test. Please don’t open your test booklets until I tell you to. There should be notalking during the test. It is important that you do your own work and not share answers.
PASS OUT TEST BOOKLETS
On the cover of the test booklet, please write your name clearly, the date, your teacher’s name,and the class period. Don’t write on the line at the bottom that says ID.
Now, please open your test booklet to Page 1. Please follow along in your test booklet as Iread the directions aloud.
DIRECTIONS
“Directions: Read each question carefully and answer it as well as you can.You will have 25 minutes to answer 20 questions.Mark your answers in your booklet. Circle only one letter for each question.If you change your answer, erase your first answer completely.We will now do a sample question together.Read the sample question. Draw a circle around the best answer.You should have drawn a circle around D, because there are 120 minutes in 2 hours.”
Now look at the cover of your test booklet. Look at the bottom line. If the bottom line on yourtest booklet says “Test-A” or “Test-B”, raise your hand.
CHECK
Good. Your test booklet has not additional directions. However, some test booklets haveadditional directions.
If the bottom line on your test booklet says “Dictionary-A” or “Dictionary-B”, raise your hand.
CHECK
Note that there are dictionary pages at the end of your test booklet. The dictionary pages areyellow.
ASSISTANT TEST ADMINISTRATOR: HOLD UP A “DICTIONARY” TEST BOOKLETAND TURN TO THE FIRST YELLOW PAGE.
Please find them now, beginning with Page D-1. On page D-1, look at the first words under“A.” That is the word “above.”
CHECK TO MAKE SURE STUDENTS FOUND DICTIONARY PAGE D-1.
Please follow along as I read the definition: “above: in or to a higher position than somethingelse.” In the Science Test, if the meaning of a word is not clear, you may look up the word inthese dictionary pages at any time during the test.
If the bottom line on your test booklet says “Glossary-A” or “Glossary-B,” raise your hand.
CHECK
In the margins of the pages in your test booklet, certain words are explained. If the meaning ofa word is not clear, you may look at the explanation in the margin. On the right side of thepage, you will find explanations in English.
ASSISTANT TEST ADMINISTRATOR: HOLD UP A “GLOSSARY” TEST BOOKLET,OPEN TO PAGE 3, AND POINT TO ENGLISH GLOSSES.
On the left side of the page, you will find explanations in Spanish.
ASSISTANT TEST ADMINISTRATOR: HOLD UP A “GLOSSARY” TEST BOOKLET,OPEN TO PAGE 3, AND POINT TO ENGLISH GLOSSES.
CHECK FOR STUDENT UNDERSTANDING.
You will have 25 minutes to answer 20 science questions. The last science question is on page19 of your test booklet. When you come to the stop sign on Page 19, stop.
SHOW STOP SIGN.
If you finish early, you may go back and check your work.

ASSISTANT TEST ADMINISTRATOR: NOTE TIME AND WRITE START AND STOPTIME ON BOARD:
START:STOP:
Now turn to Page 3 and begin.
ALLOW 25 MINUTES.
AFTER 25 MINUTES.
STOP. Now please turn to Page A-1, just after page 19. At the top of this page it says,“Follow-up Questionnaire.” We would like your opinion on the questions in this test. Pleaseanswer the questions on Page A-1 now.
ALLOW 3 MINUTES OR UNTIL ALL STUDENTS HAVE FINISHED.
Now please turn to the next page, Page B-1. At the top of this page it says, “ScienceBackground Questionnaire.” This section asks for some information about you. Please answerthe questions on page B-1 to B-5 now.
ALLOW ABOUT 8 MINUTES OR UNTIL ALL STUDENTS HAVE FINISHED.
We will now collect your test booklets; you may keep the pencil. Thank you very much forbeing a part of this testing program. We hope that the results and your comments will helpteachers to write tests that are fairer and easier to understand.

Appendix F
Administrator Feedback Form


Test Administrator Feedback Form
TEST ADMINISTRATOR: Please take a moment to give us your feedback andcomments.
Date of test:Teacher:Class period:Name(s) of Administrator(s):
1. Were all 6 forms of the test distributed randomly?
2. Did students appear to understand that some of the tests contained dictionary pagesat the back, and some had glossary entries in the page margins? Did students withthose test forms appear to use the dictionary? The glossary?
3. Was 25 minutes enough time for students to finish the Science Test?
4. Were the students confused at any point?
5. Did students comment about the difficulty of the Science Test?
6. Did you observe any negative impact due to simultaneous administering differentaccommodations (i.e., dictionary and glossary)?
7. Additional comments?

Appendix G
Letter to the Principal


Center for the Study of Evaluation
National Center for Research on Evaluation, Standards, and Student TestingUCLA Graduate School of Education & Information Studies
405 Hilgard Avenue, 301 GSEIS BuildingLos Angeles, CA 90095-1522
(310) 206-1532Fax (310) 825-3883
Date
XXXXXXXXXXXX
Dear Principal XXX,
The National Center for Research on Evaluation, Standards, and Student Testing (CRESST) at UCLA iscurrently conducting a study on the validity, feasibility, and differential impact of accommodations for8th-grade LEP students in science classes.
In this study, we selected a set of science test questions from the 1996 NAEP assessment foradministration to 8th grade students who represent various language backgrounds. We have selectedfour test treatments, including the control treatment. In addition, a language backgroundquestionnaire and a student accommodation follow-up questionnaire complete the assessmentprocedure, which will take one class period.
We will need one to four Grade 8 classes containing BOTH English speaking and English LanguageLearner (ELL) students who are currently enrolled in science. We need to know the number of Englishspeaking and ELL students in each science class to ensure that all classes meet our study design. Wewould like to get out to school sites in January 2000.
We will pay each teacher $125.00 and each school site $125.00 for participating in the study.
If you have any questions or concerns, please call XXX at XXX or me, XXX, at XXX. We will becontacting the science department teachers to follow up on your school site’s interest in participating inthis study. Thank you for your consideration.
Sincerely,
XXXXXX


Appendix H


Table A1
Multivariate ANOVA Results for Follow-Up Questions, Dictionary Booklet
SS MS
Variable Hypo. Error Hypo. Error F P
Question 1 1.38 27.28 1.38 .24 5.71 .019
Question 2 .002 34.92 .002 .31 .006 .941
Question 3 .037 80.26 .038 .71 .052 .819
Question 4 6.43 34.49 6.43 .31 21.07 .000
Question 5 6.67 51.63 6.67 .46 14.60 .000

Listing of NCES Working Papers to Date
Working papers can be downloaded as pdf files from the NCES Electronic Catalog (http://nces.ed.gov/pubsearch/). You can also contact Sheilah Jupiter at (202) 502–7444
([email protected]) if you are interested in any of the following papers.
Listing of NCES Working Papers by Program Area No. Title NCES contact
Baccalaureate and Beyond (B&B)
98–15 Development of a Prototype System for Accessing Linked NCES Data Steven Kaufman Beginning Postsecondary Students (BPS) Longitudinal Study
98–11 Beginning Postsecondary Students Longitudinal Study First Follow-up (BPS:96–98) Field Test Report
Aurora D’Amico
98–15 Development of a Prototype System for Accessing Linked NCES Data Steven Kaufman 1999–15 Projected Postsecondary Outcomes of 1992 High School Graduates Aurora D’Amico 2001–04 Beginning Postsecondary Students Longitudinal Study: 1996–2001 (BPS:1996/2001)
Field Test Methodology Report Paula Knepper
Common Core of Data (CCD)
95–12 Rural Education Data User’s Guide Samuel Peng 96–19 Assessment and Analysis of School-Level Expenditures William J. Fowler, Jr. 97–15 Customer Service Survey: Common Core of Data Coordinators Lee Hoffman 97–43 Measuring Inflation in Public School Costs William J. Fowler, Jr. 98–15 Development of a Prototype System for Accessing Linked NCES Data Steven Kaufman
1999–03 Evaluation of the 1996–97 Nonfiscal Common Core of Data Surveys Data Collection, Processing, and Editing Cycle
Beth Young
2000–12 Coverage Evaluation of the 1994–95 Common Core of Data: Public Elementary/Secondary School Universe Survey
Beth Young
2000–13 Non-professional Staff in the Schools and Staffing Survey (SASS) and Common Core of Data (CCD)
Kerry Gruber
2001–09 An Assessment of the Accuracy of CCD Data: A Comparison of 1988, 1989, and 1990 CCD Data with 1990–91 SASS Data
John Sietsema
Data Development
2000–16a Lifelong Learning NCES Task Force: Final Report Volume I Lisa Hudson 2000–16b Lifelong Learning NCES Task Force: Final Report Volume II Lisa Hudson Decennial Census School District Project
95–12 Rural Education Data User’s Guide Samuel Peng 96–04 Census Mapping Project/School District Data Book Tai Phan 98–07 Decennial Census School District Project Planning Report Tai Phan
2001–12 Customer Feedback on the 1990 Census Mapping Project Dan Kasprzyk Early Childhood Longitudinal Study (ECLS)
96–08 How Accurate are Teacher Judgments of Students’ Academic Performance? Jerry West 96–18 Assessment of Social Competence, Adaptive Behaviors, and Approaches to Learning with
Young Children Jerry West
97–24 Formulating a Design for the ECLS: A Review of Longitudinal Studies Jerry West 97–36 Measuring the Quality of Program Environments in Head Start and Other Early Childhood
Programs: A Review and Recommendations for Future Research Jerry West
1999–01 A Birth Cohort Study: Conceptual and Design Considerations and Rationale Jerry West 2000–04 Selected Papers on Education Surveys: Papers Presented at the 1998 and 1999 ASA and
1999 AAPOR Meetings Dan Kasprzyk
2001–02 Measuring Father Involvement in Young Children's Lives: Recommendations for a Fatherhood Module for the ECLS-B
Jerry West

No. Title NCES contact 2001–03 Measures of Socio-Emotional Development in Middle Childhood Elvira Hausken 2001–06 Papers from the Early Childhood Longitudinal Studies Program: Presented at the 2001
AERA and SRCD Meetings Jerry West
Education Finance Statistics Center (EDFIN)
94–05 Cost-of-Education Differentials Across the States William J. Fowler, Jr. 96–19 Assessment and Analysis of School-Level Expenditures William J. Fowler, Jr. 97–43 Measuring Inflation in Public School Costs William J. Fowler, Jr. 98–04 Geographic Variations in Public Schools’ Costs William J. Fowler, Jr.
1999–16 Measuring Resources in Education: From Accounting to the Resource Cost Model Approach
William J. Fowler, Jr.
High School and Beyond (HS&B)
95–12 Rural Education Data User’s Guide Samuel Peng 1999–05 Procedures Guide for Transcript Studies Dawn Nelson 1999–06 1998 Revision of the Secondary School Taxonomy Dawn Nelson
HS Transcript Studies
1999–05 Procedures Guide for Transcript Studies Dawn Nelson 1999–06 1998 Revision of the Secondary School Taxonomy Dawn Nelson
International Adult Literacy Survey (IALS)
97–33 Adult Literacy: An International Perspective Marilyn Binkley Integrated Postsecondary Education Data System (IPEDS)
97–27 Pilot Test of IPEDS Finance Survey Peter Stowe 98–15 Development of a Prototype System for Accessing Linked NCES Data Steven Kaufman
2000–14 IPEDS Finance Data Comparisons Under the 1997 Financial Accounting Standards for Private, Not-for-Profit Institutes: A Concept Paper
Peter Stowe
National Assessment of Adult Literacy (NAAL)
98–17 Developing the National Assessment of Adult Literacy: Recommendations from Stakeholders
Sheida White
1999–09a 1992 National Adult Literacy Survey: An Overview Alex Sedlacek 1999–09b 1992 National Adult Literacy Survey: Sample Design Alex Sedlacek 1999–09c 1992 National Adult Literacy Survey: Weighting and Population Estimates Alex Sedlacek 1999–09d 1992 National Adult Literacy Survey: Development of the Survey Instruments Alex Sedlacek 1999–09e 1992 National Adult Literacy Survey: Scaling and Proficiency Estimates Alex Sedlacek 1999–09f 1992 National Adult Literacy Survey: Interpreting the Adult Literacy Scales and Literacy
Levels Alex Sedlacek
1999–09g 1992 National Adult Literacy Survey: Literacy Levels and the Response Probability Convention
Alex Sedlacek
2000–05 Secondary Statistical Modeling With the National Assessment of Adult Literacy: Implications for the Design of the Background Questionnaire
Sheida White
2000–06 Using Telephone and Mail Surveys as a Supplement or Alternative to Door-to-Door Surveys in the Assessment of Adult Literacy
Sheida White
2000–07 “How Much Literacy is Enough?” Issues in Defining and Reporting Performance Standards for the National Assessment of Adult Literacy
Sheida White
2000–08 Evaluation of the 1992 NALS Background Survey Questionnaire: An Analysis of Uses with Recommendations for Revisions
Sheida White
2000–09 Demographic Changes and Literacy Development in a Decade Sheida White 2001–08 Assessing the Lexile Framework: Results of a Panel Meeting Sheida White
National Assessment of Educational Progress (NAEP)
95–12 Rural Education Data User’s Guide Samuel Peng 97–29 Can State Assessment Data be Used to Reduce State NAEP Sample Sizes? Steven Gorman 97–30 ACT’s NAEP Redesign Project: Assessment Design is the Key to Useful and Stable
Assessment Results Steven Gorman

No. Title NCES contact 97–31 NAEP Reconfigured: An Integrated Redesign of the National Assessment of Educational
Progress Steven Gorman
97–32 Innovative Solutions to Intractable Large Scale Assessment (Problem 2: Background Questionnaires)
Steven Gorman
97–37 Optimal Rating Procedures and Methodology for NAEP Open-ended Items Steven Gorman 97–44 Development of a SASS 1993–94 School-Level Student Achievement Subfile: Using
State Assessments and State NAEP, Feasibility Study Michael Ross
98–15 Development of a Prototype System for Accessing Linked NCES Data Steven Kaufman 1999–05 Procedures Guide for Transcript Studies Dawn Nelson 1999–06 1998 Revision of the Secondary School Taxonomy Dawn Nelson 2001–07 A Comparison of the National Assessment of Educational Progress (NAEP), the Third
International Mathematics and Science Study Repeat (TIMSS-R), and the Programme for International Student Assessment (PISA)
Arnold Goldstein
2001–08 Assessing the Lexile Framework: Results of a Panel Meeting Sheida White 2001–11 Impact of Selected Background Variables on Students’ NAEP Math Performance Arnold Goldstein 2001–13 The Effects of Accommodations on the Assessment of LEP Students in NAEP Arnold Goldstein
National Education Longitudinal Study of 1988 (NELS:88)
95–04 National Education Longitudinal Study of 1988: Second Follow-up Questionnaire Content Areas and Research Issues
Jeffrey Owings
95–05 National Education Longitudinal Study of 1988: Conducting Trend Analyses of NLS-72, HS&B, and NELS:88 Seniors
Jeffrey Owings
95–06 National Education Longitudinal Study of 1988: Conducting Cross-Cohort Comparisons Using HS&B, NAEP, and NELS:88 Academic Transcript Data
Jeffrey Owings
95–07 National Education Longitudinal Study of 1988: Conducting Trend Analyses HS&B and NELS:88 Sophomore Cohort Dropouts
Jeffrey Owings
95–12 Rural Education Data User’s Guide Samuel Peng 95–14 Empirical Evaluation of Social, Psychological, & Educational Construct Variables Used
in NCES Surveys Samuel Peng
96–03 National Education Longitudinal Study of 1988 (NELS:88) Research Framework and Issues
Jeffrey Owings
98–06 National Education Longitudinal Study of 1988 (NELS:88) Base Year through Second Follow-Up: Final Methodology Report
Ralph Lee
98–09 High School Curriculum Structure: Effects on Coursetaking and Achievement in Mathematics for High School Graduates—An Examination of Data from the National Education Longitudinal Study of 1988
Jeffrey Owings
98–15 Development of a Prototype System for Accessing Linked NCES Data Steven Kaufman 1999–05 Procedures Guide for Transcript Studies Dawn Nelson 1999–06 1998 Revision of the Secondary School Taxonomy Dawn Nelson 1999–15 Projected Postsecondary Outcomes of 1992 High School Graduates Aurora D’Amico
National Household Education Survey (NHES)
95–12 Rural Education Data User’s Guide Samuel Peng 96–13 Estimation of Response Bias in the NHES:95 Adult Education Survey Steven Kaufman 96–14 The 1995 National Household Education Survey: Reinterview Results for the Adult
Education Component Steven Kaufman
96–20 1991 National Household Education Survey (NHES:91) Questionnaires: Screener, Early Childhood Education, and Adult Education
Kathryn Chandler
96–21 1993 National Household Education Survey (NHES:93) Questionnaires: Screener, School Readiness, and School Safety and Discipline
Kathryn Chandler
96–22 1995 National Household Education Survey (NHES:95) Questionnaires: Screener, Early Childhood Program Participation, and Adult Education
Kathryn Chandler
96–29 Undercoverage Bias in Estimates of Characteristics of Adults and 0- to 2-Year-Olds in the 1995 National Household Education Survey (NHES:95)
Kathryn Chandler
96–30 Comparison of Estimates from the 1995 National Household Education Survey (NHES:95)
Kathryn Chandler
97–02 Telephone Coverage Bias and Recorded Interviews in the 1993 National Household Education Survey (NHES:93)
Kathryn Chandler
97–03 1991 and 1995 National Household Education Survey Questionnaires: NHES:91 Screener, NHES:91 Adult Education, NHES:95 Basic Screener, and NHES:95 Adult Education
Kathryn Chandler

No. Title NCES contact 97–04 Design, Data Collection, Monitoring, Interview Administration Time, and Data Editing in
the 1993 National Household Education Survey (NHES:93) Kathryn Chandler
97–05 Unit and Item Response, Weighting, and Imputation Procedures in the 1993 National Household Education Survey (NHES:93)
Kathryn Chandler
97–06 Unit and Item Response, Weighting, and Imputation Procedures in the 1995 National Household Education Survey (NHES:95)
Kathryn Chandler
97–08 Design, Data Collection, Interview Timing, and Data Editing in the 1995 National Household Education Survey
Kathryn Chandler
97–19 National Household Education Survey of 1995: Adult Education Course Coding Manual Peter Stowe 97–20 National Household Education Survey of 1995: Adult Education Course Code Merge
Files User’s Guide Peter Stowe
97–25 1996 National Household Education Survey (NHES:96) Questionnaires: Screener/Household and Library, Parent and Family Involvement in Education and Civic Involvement, Youth Civic Involvement, and Adult Civic Involvement
Kathryn Chandler
97–28 Comparison of Estimates in the 1996 National Household Education Survey Kathryn Chandler 97–34 Comparison of Estimates from the 1993 National Household Education Survey Kathryn Chandler 97–35 Design, Data Collection, Interview Administration Time, and Data Editing in the 1996
National Household Education Survey Kathryn Chandler
97–38 Reinterview Results for the Parent and Youth Components of the 1996 National Household Education Survey
Kathryn Chandler
97–39 Undercoverage Bias in Estimates of Characteristics of Households and Adults in the 1996 National Household Education Survey
Kathryn Chandler
97–40 Unit and Item Response Rates, Weighting, and Imputation Procedures in the 1996 National Household Education Survey
Kathryn Chandler
98–03 Adult Education in the 1990s: A Report on the 1991 National Household Education Survey
Peter Stowe
98–10 Adult Education Participation Decisions and Barriers: Review of Conceptual Frameworks and Empirical Studies
Peter Stowe
National Longitudinal Study of the High School Class of 1972 (NLS-72)
95–12 Rural Education Data User’s Guide Samuel Peng National Postsecondary Student Aid Study (NPSAS)
96–17 National Postsecondary Student Aid Study: 1996 Field Test Methodology Report Andrew G. Malizio 2000–17 National Postsecondary Student Aid Study:2000 Field Test Methodology Report Andrew G. Malizio
National Study of Postsecondary Faculty (NSOPF)
97–26 Strategies for Improving Accuracy of Postsecondary Faculty Lists Linda Zimbler 98–15 Development of a Prototype System for Accessing Linked NCES Data Steven Kaufman
2000–01 1999 National Study of Postsecondary Faculty (NSOPF:99) Field Test Report Linda Zimbler Postsecondary Education Descriptive Analysis Reports (PEDAR)
2000–11 Financial Aid Profile of Graduate Students in Science and Engineering Aurora D’Amico Private School Universe Survey (PSS)
95–16 IntersurveyConsistency in NCES Private School Surveys Steven Kaufman 95–17 Estimates of Expenditures for Private K–12 Schools Stephen Broughman 96–16 Strategies for Collecting Finance Data from Private Schools Stephen Broughman 96–26 Improving the Coverage of Private Elementary-Secondary Schools Steven Kaufman 96–27 Intersurvey Consistency in NCES Private School Surveys for 1993–94 Steven Kaufman 97–07 The Determinants of Per-Pupil Expenditures in Private Elementary and Secondary
Schools: An Exploratory Analysis Stephen Broughman
97–22 Collection of Private School Finance Data: Development of a Questionnaire Stephen Broughman 98–15 Development of a Prototype System for Accessing Linked NCES Data Steven Kaufman
2000–04 Selected Papers on Education Surveys: Papers Presented at the 1998 and 1999 ASA and 1999 AAPOR Meetings
Dan Kasprzyk
2000–15 Feasibility Report: School-Level Finance Pretest, Private School Questionnaire Stephen Broughman
No. Title NCES contact Recent College Graduates (RCG)
98–15 Development of a Prototype System for Accessing Linked NCES Data Steven Kaufman Schools and Staffing Survey (SASS)
94–01 Schools and Staffing Survey (SASS) Papers Presented at Meetings of the American Statistical Association
Dan Kasprzyk
94–02 Generalized Variance Estimate for Schools and Staffing Survey (SASS) Dan Kasprzyk 94–03 1991 Schools and Staffing Survey (SASS) Reinterview Response Variance Report Dan Kasprzyk 94–04 The Accuracy of Teachers’ Self-reports on their Postsecondary Education: Teacher
Transcript Study, Schools and Staffing Survey Dan Kasprzyk
94–06 Six Papers on Teachers from the 1990–91 Schools and Staffing Survey and Other Related Surveys
Dan Kasprzyk
95–01 Schools and Staffing Survey: 1994 Papers Presented at the 1994 Meeting of the American Statistical Association
Dan Kasprzyk
95–02 QED Estimates of the 1990–91 Schools and Staffing Survey: Deriving and Comparing QED School Estimates with CCD Estimates
Dan Kasprzyk
95–03 Schools and Staffing Survey: 1990–91 SASS Cross-Questionnaire Analysis Dan Kasprzyk 95–08 CCD Adjustment to the 1990–91 SASS: A Comparison of Estimates Dan Kasprzyk 95–09 The Results of the 1993 Teacher List Validation Study (TLVS) Dan Kasprzyk 95–10 The Results of the 1991–92 Teacher Follow-up Survey (TFS) Reinterview and Extensive
Reconciliation Dan Kasprzyk
95–11 Measuring Instruction, Curriculum Content, and Instructional Resources: The Status of Recent Work
Sharon Bobbitt & John Ralph
95–12 Rural Education Data User’s Guide Samuel Peng 95–14 Empirical Evaluation of Social, Psychological, & Educational Construct Variables Used
in NCES Surveys Samuel Peng
95–15 Classroom Instructional Processes: A Review of Existing Measurement Approaches and Their Applicability for the Teacher Follow-up Survey
Sharon Bobbitt
95–16 Intersurvey Consistency in NCES Private School Surveys Steven Kaufman 95–18 An Agenda for Research on Teachers and Schools: Revisiting NCES’ Schools and
Staffing Survey Dan Kasprzyk
96–01 Methodological Issues in the Study of Teachers’ Careers: Critical Features of a Truly Longitudinal Study
Dan Kasprzyk
96–02 Schools and Staffing Survey (SASS): 1995 Selected papers presented at the 1995 Meeting of the American Statistical Association
Dan Kasprzyk
96–05 Cognitive Research on the Teacher Listing Form for the Schools and Staffing Survey Dan Kasprzyk 96–06 The Schools and Staffing Survey (SASS) for 1998–99: Design Recommendations to
Inform Broad Education Policy Dan Kasprzyk
96–07 Should SASS Measure Instructional Processes and Teacher Effectiveness? Dan Kasprzyk 96–09 Making Data Relevant for Policy Discussions: Redesigning the School Administrator
Questionnaire for the 1998–99 SASS Dan Kasprzyk
96–10 1998–99 Schools and Staffing Survey: Issues Related to Survey Depth Dan Kasprzyk 96–11 Towards an Organizational Database on America’s Schools: A Proposal for the Future of
SASS, with comments on School Reform, Governance, and Finance Dan Kasprzyk
96–12 Predictors of Retention, Transfer, and Attrition of Special and General Education Teachers: Data from the 1989 Teacher Followup Survey
Dan Kasprzyk
96–15 Nested Structures: District-Level Data in the Schools and Staffing Survey Dan Kasprzyk 96–23 Linking Student Data to SASS: Why, When, How Dan Kasprzyk 96–24 National Assessments of Teacher Quality Dan Kasprzyk 96–25 Measures of Inservice Professional Development: Suggested Items for the 1998–1999
Schools and Staffing Survey Dan Kasprzyk
96–28 Student Learning, Teaching Quality, and Professional Development: Theoretical Linkages, Current Measurement, and Recommendations for Future Data Collection
Mary Rollefson
97–01 Selected Papers on Education Surveys: Papers Presented at the 1996 Meeting of the American Statistical Association
Dan Kasprzyk
97–07 The Determinants of Per-Pupil Expenditures in Private Elementary and Secondary Schools: An Exploratory Analysis
Stephen Broughman
97–09 Status of Data on Crime and Violence in Schools: Final Report Lee Hoffman 97–10 Report of Cognitive Research on the Public and Private School Teacher Questionnaires
for the Schools and Staffing Survey 1993–94 School Year Dan Kasprzyk
No. Title NCES contact 97–11 International Comparisons of Inservice Professional Development Dan Kasprzyk 97–12 Measuring School Reform: Recommendations for Future SASS Data Collection Mary Rollefson 97–14 Optimal Choice of Periodicities for the Schools and Staffing Survey: Modeling and
Analysis Steven Kaufman
97–18 Improving the Mail Return Rates of SASS Surveys: A Review of the Literature Steven Kaufman 97–22 Collection of Private School Finance Data: Development of a Questionnaire Stephen Broughman 97–23 Further Cognitive Research on the Schools and Staffing Survey (SASS) Teacher Listing
Form Dan Kasprzyk
97–41 Selected Papers on the Schools and Staffing Survey: Papers Presented at the 1997 Meeting of the American Statistical Association
Steve Kaufman
97–42 Improving the Measurement of Staffing Resources at the School Level: The Development of Recommendations for NCES for the Schools and Staffing Survey (SASS)
Mary Rollefson
97–44 Development of a SASS 1993–94 School-Level Student Achievement Subfile: Using State Assessments and State NAEP, Feasibility Study
Michael Ross
98–01 Collection of Public School Expenditure Data: Development of a Questionnaire Stephen Broughman 98–02 Response Variance in the 1993–94 Schools and Staffing Survey: A Reinterview Report Steven Kaufman 98–04 Geographic Variations in Public Schools’ Costs William J. Fowler, Jr. 98–05 SASS Documentation: 1993–94 SASS Student Sampling Problems; Solutions for
Determining the Numerators for the SASS Private School (3B) Second-Stage Factors Steven Kaufman
98–08 The Redesign of the Schools and Staffing Survey for 1999–2000: A Position Paper Dan Kasprzyk 98–12 A Bootstrap Variance Estimator for Systematic PPS Sampling Steven Kaufman 98–13 Response Variance in the 1994–95 Teacher Follow-up Survey Steven Kaufman 98–14 Variance Estimation of Imputed Survey Data Steven Kaufman 98–15 Development of a Prototype System for Accessing Linked NCES Data Steven Kaufman 98–16 A Feasibility Study of Longitudinal Design for Schools and Staffing Survey Stephen Broughman
1999–02 Tracking Secondary Use of the Schools and Staffing Survey Data: Preliminary Results Dan Kasprzyk 1999–04 Measuring Teacher Qualifications Dan Kasprzyk 1999–07 Collection of Resource and Expenditure Data on the Schools and Staffing Survey Stephen Broughman 1999–08 Measuring Classroom Instructional Processes: Using Survey and Case Study Fieldtest
Results to Improve Item Construction Dan Kasprzyk
1999–10 What Users Say About Schools and Staffing Survey Publications Dan Kasprzyk 1999–12 1993–94 Schools and Staffing Survey: Data File User’s Manual, Volume III: Public-Use
Codebook Kerry Gruber
1999–13 1993–94 Schools and Staffing Survey: Data File User’s Manual, Volume IV: Bureau of Indian Affairs (BIA) Restricted-Use Codebook
Kerry Gruber
1999–14 1994–95 Teacher Followup Survey: Data File User’s Manual, Restricted-Use Codebook Kerry Gruber 1999–17 Secondary Use of the Schools and Staffing Survey Data Susan Wiley 2000–04 Selected Papers on Education Surveys: Papers Presented at the 1998 and 1999 ASA and
1999 AAPOR Meetings Dan Kasprzyk
2000–10 A Research Agenda for the 1999–2000 Schools and Staffing Survey Dan Kasprzyk 2000–13 Non-professional Staff in the Schools and Staffing Survey (SASS) and Common Core of
Data (CCD) Kerry Gruber
2000–18 Feasibility Report: School-Level Finance Pretest, Public School District Questionnaire Stephen Broughman Third International Mathematics and Science Study (TIMSS)
2001–01 Cross-National Variation in Educational Preparation for Adulthood: From Early Adolescence to Young Adulthood
Elvira Hausken
2001–05 Using TIMSS to Analyze Correlates of Performance Variation in Mathematics Patrick Gonzales 2001–07 A Comparison of the National Assessment of Educational Progress (NAEP), the Third
International Mathematics and Science Study Repeat (TIMSS-R), and the Programme for International Student Assessment (PISA)
Arnold Goldstein

Listing of NCES Working Papers by Subject
No. Title NCES contact Achievement (student) - mathematics
2001–05 Using TIMSS to Analyze Correlates of Performance Variation in Mathematics Patrick Gonzales Adult education
96–14 The 1995 National Household Education Survey: Reinterview Results for the Adult Education Component
Steven Kaufman
96–20 1991 National Household Education Survey (NHES:91) Questionnaires: Screener, Early Childhood Education, and Adult Education
Kathryn Chandler
96–22 1995 National Household Education Survey (NHES:95) Questionnaires: Screener, Early Childhood Program Participation, and Adult Education
Kathryn Chandler
98–03 Adult Education in the 1990s: A Report on the 1991 National Household Education Survey
Peter Stowe
98–10 Adult Education Participation Decisions and Barriers: Review of Conceptual Frameworks and Empirical Studies
Peter Stowe
1999–11 Data Sources on Lifelong Learning Available from the National Center for Education Statistics
Lisa Hudson
2000–16a Lifelong Learning NCES Task Force: Final Report Volume I Lisa Hudson 2000–16b Lifelong Learning NCES Task Force: Final Report Volume II Lisa Hudson Adult literacy—see Literacy of adults
American Indian – education
1999–13 1993–94 Schools and Staffing Survey: Data File User’s Manual, Volume IV: Bureau of Indian Affairs (BIA) Restricted-Use Codebook
Kerry Gruber
Assessment/achievement
95–12 Rural Education Data User’s Guide Samuel Peng 95–13 Assessing Students with Disabilities and Limited English Proficiency James Houser 97–29 Can State Assessment Data be Used to Reduce State NAEP Sample Sizes? Larry Ogle 97–30 ACT’s NAEP Redesign Project: Assessment Design is the Key to Useful and Stable
Assessment Results Larry Ogle
97–31 NAEP Reconfigured: An Integrated Redesign of the National Assessment of Educational Progress
Larry Ogle
97–32 Innovative Solutions to Intractable Large Scale Assessment (Problem 2: Background Questions)
Larry Ogle
97–37 Optimal Rating Procedures and Methodology for NAEP Open-ended Items Larry Ogle 97–44 Development of a SASS 1993–94 School-Level Student Achievement Subfile: Using
State Assessments and State NAEP, Feasibility Study Michael Ross
98–09 High School Curriculum Structure: Effects on Coursetaking and Achievement in Mathematics for High School Graduates—An Examination of Data from the National Education Longitudinal Study of 1988
Jeffrey Owings
2001–07 A Comparison of the National Assessment of Educational Progress (NAEP), the Third International Mathematics and Science Study Repeat (TIMSS-R), and the Programme for International Student Assessment (PISA)
Arnold Goldstein
2001–11 Impact of Selected Background Variables on Students’ NAEP Math Performance Arnold Goldstein 2001–13 The Effects of Accommodations on the Assessment of LEP Students in NAEP Arnold Goldstein
Beginning students in postsecondary education
98–11 Beginning Postsecondary Students Longitudinal Study First Follow-up (BPS:96–98) Field Test Report
Aurora D’Amico
2001–04 Beginning Postsecondary Students Longitudinal Study: 1996–2001 (BPS:1996/2001) Field Test Methodology Report
Paula Knepper

No. Title NCES contact Civic participation
97–25 1996 National Household Education Survey (NHES:96) Questionnaires: Screener/Household and Library, Parent and Family Involvement in Education and Civic Involvement, Youth Civic Involvement, and Adult Civic Involvement
Kathryn Chandler
Climate of schools
95–14 Empirical Evaluation of Social, Psychological, & Educational Construct Variables Used in NCES Surveys
Samuel Peng
Cost of education indices
94–05 Cost-of-Education Differentials Across the States William J. Fowler, Jr. Course-taking
95–12 Rural Education Data User’s Guide Samuel Peng 98–09 High School Curriculum Structure: Effects on Coursetaking and Achievement in
Mathematics for High School Graduates—An Examination of Data from the National Education Longitudinal Study of 1988
Jeffrey Owings
1999–05 Procedures Guide for Transcript Studies Dawn Nelson 1999–06 1998 Revision of the Secondary School Taxonomy Dawn Nelson
Crime
97–09 Status of Data on Crime and Violence in Schools: Final Report Lee Hoffman Curriculum
95–11 Measuring Instruction, Curriculum Content, and Instructional Resources: The Status of Recent Work
Sharon Bobbitt & John Ralph
98–09 High School Curriculum Structure: Effects on Coursetaking and Achievement in Mathematics for High School Graduates—An Examination of Data from the National Education Longitudinal Study of 1988
Jeffrey Owings
Customer service
1999–10 What Users Say About Schools and Staffing Survey Publications Dan Kasprzyk 2000–02 Coordinating NCES Surveys: Options, Issues, Challenges, and Next Steps Valena Plisko 2000–04 Selected Papers on Education Surveys: Papers Presented at the 1998 and 1999 ASA and
1999 AAPOR Meetings Dan Kasprzyk
2001–12 Customer Feedback on the 1990 Census Mapping Project Dan Kasprzyk Data quality
97–13 Improving Data Quality in NCES: Database-to-Report Process Susan Ahmed 2001–11 Impact of Selected Background Variables on Students’ NAEP Math Performance Arnold Goldstein 2001–13 The Effects of Accommodations on the Assessment of LEP Students in NAEP Arnold Goldstein
Data warehouse
2000–04 Selected Papers on Education Surveys: Papers Presented at the 1998 and 1999 ASA and 1999 AAPOR Meetings
Dan Kasprzyk
Design effects
2000–03 Strengths and Limitations of Using SUDAAN, Stata, and WesVarPC for Computing Variances from NCES Data Sets
Ralph Lee
Dropout rates, high school
95–07 National Education Longitudinal Study of 1988: Conducting Trend Analyses HS&B and NELS:88 Sophomore Cohort Dropouts
Jeffrey Owings
Early childhood education
96–20 1991 National Household Education Survey (NHES:91) Questionnaires: Screener, Early Childhood Education, and Adult Education
Kathryn Chandler

No. Title NCES contact 96–22 1995 National Household Education Survey (NHES:95) Questionnaires: Screener, Early
Childhood Program Participation, and Adult Education Kathryn Chandler
97–24 Formulating a Design for the ECLS: A Review of Longitudinal Studies Jerry West 97–36 Measuring the Quality of Program Environments in Head Start and Other Early Childhood
Programs: A Review and Recommendations for Future Research Jerry West
1999–01 A Birth Cohort Study: Conceptual and Design Considerations and Rationale Jerry West 2001–02 Measuring Father Involvement in Young Children's Lives: Recommendations for a
Fatherhood Module for the ECLS-B Jerry West
2001–03 Measures of Socio-Emotional Development in Middle School Elvira Hausken 2001–06 Papers from the Early Childhood Longitudinal Studies Program: Presented at the 2001
AERA and SRCD Meetings Jerry West
Educational attainment
98–11 Beginning Postsecondary Students Longitudinal Study First Follow-up (BPS:96–98) Field Test Report
Aurora D’Amico
Educational research
2000–02 Coordinating NCES Surveys: Options, Issues, Challenges, and Next Steps Valena Plisko Eighth-graders
2001–05 Using TIMSS to Analyze Correlates of Performance Variation in Mathematics Patrick Gonzales Employment
96–03 National Education Longitudinal Study of 1988 (NELS:88) Research Framework and Issues
Jeffrey Owings
98–11 Beginning Postsecondary Students Longitudinal Study First Follow-up (BPS:96–98) Field Test Report
Aurora D’Amico
2000–16a Lifelong Learning NCES Task Force: Final Report Volume I Lisa Hudson 2000–16b Lifelong Learning NCES Task Force: Final Report Volume II Lisa Hudson 2001–01 Cross-National Variation in Educational Preparation for Adulthood: From Early
Adolescence to Young Adulthood Elvira Hausken
Engineering
2000–11 Financial Aid Profile of Graduate Students in Science and Engineering Aurora D’Amico Faculty – higher education
97–26 Strategies for Improving Accuracy of Postsecondary Faculty Lists Linda Zimbler 2000–01 1999 National Study of Postsecondary Faculty (NSOPF:99) Field Test Report Linda Zimbler
Fathers – role in education
2001–02 Measuring Father Involvement in Young Children's Lives: Recommendations for a Fatherhood Module for the ECLS-B
Jerry West
Finance – elementary and secondary schools
94–05 Cost-of-Education Differentials Across the States William J. Fowler, Jr. 96–19 Assessment and Analysis of School-Level Expenditures William J. Fowler, Jr. 98–01 Collection of Public School Expenditure Data: Development of a Questionnaire Stephen Broughman
1999–07 Collection of Resource and Expenditure Data on the Schools and Staffing Survey Stephen Broughman 1999–16 Measuring Resources in Education: From Accounting to the Resource Cost Model
Approach William J. Fowler, Jr.
2000–18 Feasibility Report: School-Level Finance Pretest, Public School District Questionnaire Stephen Broughman Finance – postsecondary
97–27 Pilot Test of IPEDS Finance Survey Peter Stowe 2000–14 IPEDS Finance Data Comparisons Under the 1997 Financial Accounting Standards for
Private, Not-for-Profit Institutes: A Concept Paper Peter Stowe
Finance – private schools
95–17 Estimates of Expenditures for Private K–12 Schools Stephen Broughman

No. Title NCES contact 96–16 Strategies for Collecting Finance Data from Private Schools Stephen Broughman 97–07 The Determinants of Per-Pupil Expenditures in Private Elementary and Secondary
Schools: An Exploratory Analysis Stephen Broughman
97–22 Collection of Private School Finance Data: Development of a Questionnaire Stephen Broughman 1999–07 Collection of Resource and Expenditure Data on the Schools and Staffing Survey Stephen Broughman 2000–15 Feasibility Report: School-Level Finance Pretest, Private School Questionnaire Stephen Broughman
Geography
98–04 Geographic Variations in Public Schools’ Costs William J. Fowler, Jr. Graduate students
2000–11 Financial Aid Profile of Graduate Students in Science and Engineering Aurora D’Amico
Imputation
2000–04 Selected Papers on Education Surveys: Papers Presented at the 1998 and 1999 ASA and 1999 AAPOR Meeting
Dan Kasprzyk
2001–10 Comparison of Proc Impute and Schafer’s Multiple Imputation Software Sam Peng Inflation
97–43 Measuring Inflation in Public School Costs William J. Fowler, Jr. Institution data
2000–01 1999 National Study of Postsecondary Faculty (NSOPF:99) Field Test Report Linda Zimbler Instructional resources and practices
95–11 Measuring Instruction, Curriculum Content, and Instructional Resources: The Status of Recent Work
Sharon Bobbitt & John Ralph
1999–08 Measuring Classroom Instructional Processes: Using Survey and Case Study Field Test Results to Improve Item Construction
Dan Kasprzyk
International comparisons
97–11 International Comparisons of Inservice Professional Development Dan Kasprzyk 97–16 International Education Expenditure Comparability Study: Final Report, Volume I Shelley Burns 97–17 International Education Expenditure Comparability Study: Final Report, Volume II,
Quantitative Analysis of Expenditure Comparability Shelley Burns
2001–01 Cross-National Variation in Educational Preparation for Adulthood: From Early Adolescence to Young Adulthood
Elvira Hausken
2001–07 A Comparison of the National Assessment of Educational Progress (NAEP), the Third International Mathematics and Science Study Repeat (TIMSS-R), and the Programme for International Student Assessment (PISA)
Arnold Goldstein
International comparisons – math and science achievement
2001–05 Using TIMSS to Analyze Correlates of Performance Variation in Mathematics Patrick Gonzales Libraries
94–07 Data Comparability and Public Policy: New Interest in Public Library Data Papers Presented at Meetings of the American Statistical Association
Carrol Kindel
97–25 1996 National Household Education Survey (NHES:96) Questionnaires: Screener/Household and Library, Parent and Family Involvement in Education and Civic Involvement, Youth Civic Involvement, and Adult Civic Involvement
Kathryn Chandler
Limited English Proficiency
95–13 Assessing Students with Disabilities and Limited English Proficiency James Houser 2001–11 Impact of Selected Background Variables on Students’ NAEP Math Performance Arnold Goldstein 2001–13 The Effects of Accommodations on the Assessment of LEP Students in NAEP Arnold Goldstein

No. Title NCES contact Literacy of adults
98–17 Developing the National Assessment of Adult Literacy: Recommendations from Stakeholders
Sheida White
1999–09a 1992 National Adult Literacy Survey: An Overview Alex Sedlacek 1999–09b 1992 National Adult Literacy Survey: Sample Design Alex Sedlacek 1999–09c 1992 National Adult Literacy Survey: Weighting and Population Estimates Alex Sedlacek 1999–09d 1992 National Adult Literacy Survey: Development of the Survey Instruments Alex Sedlacek 1999–09e 1992 National Adult Literacy Survey: Scaling and Proficiency Estimates Alex Sedlacek 1999–09f 1992 National Adult Literacy Survey: Interpreting the Adult Literacy Scales and Literacy
Levels Alex Sedlacek
1999–09g 1992 National Adult Literacy Survey: Literacy Levels and the Response Probability Convention
Alex Sedlacek
1999–11 Data Sources on Lifelong Learning Available from the National Center for Education Statistics
Lisa Hudson
2000–05 Secondary Statistical Modeling With the National Assessment of Adult Literacy: Implications for the Design of the Background Questionnaire
Sheida White
2000–06 Using Telephone and Mail Surveys as a Supplement or Alternative to Door-to-Door Surveys in the Assessment of Adult Literacy
Sheida White
2000–07 “How Much Literacy is Enough?” Issues in Defining and Reporting Performance Standards for the National Assessment of Adult Literacy
Sheida White
2000–08 Evaluation of the 1992 NALS Background Survey Questionnaire: An Analysis of Uses with Recommendations for Revisions
Sheida White
2000–09 Demographic Changes and Literacy Development in a Decade Sheida White 2001–08 Assessing the Lexile Framework: Results of a Panel Meeting Sheida White
Literacy of adults – international
97–33 Adult Literacy: An International Perspective Marilyn Binkley Mathematics
98–09 High School Curriculum Structure: Effects on Coursetaking and Achievement in Mathematics for High School Graduates—An Examination of Data from the National Education Longitudinal Study of 1988
Jeffrey Owings
1999–08 Measuring Classroom Instructional Processes: Using Survey and Case Study Field Test Results to Improve Item Construction
Dan Kasprzyk
2001–05 Using TIMSS to Analyze Correlates of Performance Variation in Mathematics Patrick Gonzales 2001–07 A Comparison of the National Assessment of Educational Progress (NAEP), the Third
International Mathematics and Science Study Repeat (TIMSS-R), and the Programme for International Student Assessment (PISA)
Arnold Goldstein
2001–11 Impact of Selected Background Variables on Students’ NAEP Math Performance Arnold Goldstein Parental involvement in education
96–03 National Education Longitudinal Study of 1988 (NELS:88) Research Framework and Issues
Jeffrey Owings
97–25 1996 National Household Education Survey (NHES:96) Questionnaires: Screener/Household and Library, Parent and Family Involvement in Education and Civic Involvement, Youth Civic Involvement, and Adult Civic Involvement
Kathryn Chandler
1999–01 A Birth Cohort Study: Conceptual and Design Considerations and Rationale Jerry West 2001–06 Papers from the Early Childhood Longitudinal Studies Program: Presented at the 2001
AERA and SRCD Meetings Jerry West
Participation rates
98–10 Adult Education Participation Decisions and Barriers: Review of Conceptual Frameworks and Empirical Studies
Peter Stowe
Postsecondary education
1999–11 Data Sources on Lifelong Learning Available from the National Center for Education Statistics
Lisa Hudson
2000–16a Lifelong Learning NCES Task Force: Final Report Volume I Lisa Hudson 2000–16b Lifelong Learning NCES Task Force: Final Report Volume II Lisa Hudson

No. Title NCES contact Postsecondary education – persistence and attainment
98–11 Beginning Postsecondary Students Longitudinal Study First Follow-up (BPS:96–98) Field Test Report
Aurora D’Amico
1999–15 Projected Postsecondary Outcomes of 1992 High School Graduates Aurora D’Amico Postsecondary education – staff
97–26 Strategies for Improving Accuracy of Postsecondary Faculty Lists Linda Zimbler 2000–01 1999 National Study of Postsecondary Faculty (NSOPF:99) Field Test Report Linda Zimbler
Principals
2000–10 A Research Agenda for the 1999–2000 Schools and Staffing Survey Dan Kasprzyk Private schools
96–16 Strategies for Collecting Finance Data from Private Schools Stephen Broughman 97–07 The Determinants of Per-Pupil Expenditures in Private Elementary and Secondary
Schools: An Exploratory Analysis Stephen Broughman
97–22 Collection of Private School Finance Data: Development of a Questionnaire Stephen Broughman 2000–13 Non-professional Staff in the Schools and Staffing Survey (SASS) and Common Core of
Data (CCD) Kerry Gruber
2000–15 Feasibility Report: School-Level Finance Pretest, Private School Questionnaire Stephen Broughman Projections of education statistics
1999–15 Projected Postsecondary Outcomes of 1992 High School Graduates Aurora D’Amico Public school finance
1999–16 Measuring Resources in Education: From Accounting to the Resource Cost Model Approach
William J. Fowler, Jr.
2000–18 Feasibility Report: School-Level Finance Pretest, Public School District Questionnaire Stephen Broughman Public schools
97–43 Measuring Inflation in Public School Costs William J. Fowler, Jr. 98–01 Collection of Public School Expenditure Data: Development of a Questionnaire Stephen Broughman 98–04 Geographic Variations in Public Schools’ Costs William J. Fowler, Jr.
1999–02 Tracking Secondary Use of the Schools and Staffing Survey Data: Preliminary Results Dan Kasprzyk 2000–12 Coverage Evaluation of the 1994–95 Public Elementary/Secondary School Universe
Survey Beth Young
2000–13 Non-professional Staff in the Schools and Staffing Survey (SASS) and Common Core of Data (CCD)
Kerry Gruber
Public schools – secondary
98–09 High School Curriculum Structure: Effects on Coursetaking and Achievement in Mathematics for High School Graduates—An Examination of Data from the National Education Longitudinal Study of 1988
Jeffrey Owings
Reform, educational
96–03 National Education Longitudinal Study of 1988 (NELS:88) Research Framework and Issues
Jeffrey Owings
Response rates
98–02 Response Variance in the 1993–94 Schools and Staffing Survey: A Reinterview Report Steven Kaufman School districts
2000–10 A Research Agenda for the 1999–2000 Schools and Staffing Survey Dan Kasprzyk School districts, public
98–07 Decennial Census School District Project Planning Report Tai Phan

No. Title NCES contact 1999–03 Evaluation of the 1996–97 Nonfiscal Common Core of Data Surveys Data Collection,
Processing, and Editing Cycle Beth Young
School districts, public – demographics of
96–04 Census Mapping Project/School District Data Book Tai Phan Schools
97–42 Improving the Measurement of Staffing Resources at the School Level: The Development of Recommendations for NCES for the Schools and Staffing Survey (SASS)
Mary Rollefson
98–08 The Redesign of the Schools and Staffing Survey for 1999–2000: A Position Paper Dan Kasprzyk 1999–03 Evaluation of the 1996–97 Nonfiscal Common Core of Data Surveys Data Collection,
Processing, and Editing Cycle Beth Young
2000–10 A Research Agenda for the 1999–2000 Schools and Staffing Survey Dan Kasprzyk Schools – safety and discipline
97–09 Status of Data on Crime and Violence in Schools: Final Report Lee Hoffman Science
2000–11 Financial Aid Profile of Graduate Students in Science and Engineering Aurora D’Amico 2001–07 A Comparison of the National Assessment of Educational Progress (NAEP), the Third
International Mathematics and Science Study Repeat (TIMSS-R), and the Programme for International Student Assessment (PISA)
Arnold Goldstein
Software evaluation
2000–03 Strengths and Limitations of Using SUDAAN, Stata, and WesVarPC for Computing Variances from NCES Data Sets
Ralph Lee
Staff
97–42 Improving the Measurement of Staffing Resources at the School Level: The Development of Recommendations for NCES for the Schools and Staffing Survey (SASS)
Mary Rollefson
98–08 The Redesign of the Schools and Staffing Survey for 1999–2000: A Position Paper Dan Kasprzyk Staff – higher education institutions
97–26 Strategies for Improving Accuracy of Postsecondary Faculty Lists Linda Zimbler Staff – nonprofessional
2000–13 Non-professional Staff in the Schools and Staffing Survey (SASS) and Common Core of Data (CCD)
Kerry Gruber
State
1999–03 Evaluation of the 1996–97 Nonfiscal Common Core of Data Surveys Data Collection, Processing, and Editing Cycle
Beth Young
Statistical methodology
97–21 Statistics for Policymakers or Everything You Wanted to Know About Statistics But Thought You Could Never Understand
Susan Ahmed
Statistical standards and methodology
2001–05 Using TIMSS to Analyze Correlates of Performance Variation in Mathematics Patrick Gonzales Students with disabilities
95–13 Assessing Students with Disabilities and Limited English Proficiency James Houser 2001–13 The Effects of Accommodations on the Assessment of LEP Students in NAEP Arnold Goldstein
Survey methodology
96–17 National Postsecondary Student Aid Study: 1996 Field Test Methodology Report Andrew G. Malizio 97–15 Customer Service Survey: Common Core of Data Coordinators Lee Hoffman
No. Title NCES contact 97–35 Design, Data Collection, Interview Administration Time, and Data Editing in the 1996
National Household Education Survey Kathryn Chandler
98–06 National Education Longitudinal Study of 1988 (NELS:88) Base Year through Second Follow-Up: Final Methodology Report
Ralph Lee
98–11 Beginning Postsecondary Students Longitudinal Study First Follow-up (BPS:96–98) Field Test Report
Aurora D’Amico
98–16 A Feasibility Study of Longitudinal Design for Schools and Staffing Survey Stephen Broughman 1999–07 Collection of Resource and Expenditure Data on the Schools and Staffing Survey Stephen Broughman 1999–17 Secondary Use of the Schools and Staffing Survey Data Susan Wiley 2000–01 1999 National Study of Postsecondary Faculty (NSOPF:99) Field Test Report Linda Zimbler 2000–02 Coordinating NCES Surveys: Options, Issues, Challenges, and Next Steps Valena Plisko 2000–04 Selected Papers on Education Surveys: Papers Presented at the 1998 and 1999 ASA and
1999 AAPOR Meetings Dan Kasprzyk
2000–12 Coverage Evaluation of the 1994–95 Public Elementary/Secondary School Universe Survey
Beth Young
2000–17 National Postsecondary Student Aid Study:2000 Field Test Methodology Report Andrew G. Malizio 2001–04 Beginning Postsecondary Students Longitudinal Study: 1996–2001 (BPS:1996/2001)
Field Test Methodology Report Paula Knepper
2001–07 A Comparison of the National Assessment of Educational Progress (NAEP), the Third International Mathematics and Science Study Repeat (TIMSS-R), and the Programme for International Student Assessment (PISA)
Arnold Goldstein
2001–09 An Assessment of the Accuracy of CCD Data: A Comparison of 1988, 1989, and 1990 CCD Data with 1990–91 SASS Data
John Sietsema
2001–11 Impact of Selected Background Variables on Students’ NAEP Math Performance Arnold Goldstein 2001–13 The Effects of Accommodations on the Assessment of LEP Students in NAEP Arnold Goldstein
Teachers
98–13 Response Variance in the 1994–95 Teacher Follow-up Survey Steven Kaufman 1999–14 1994–95 Teacher Followup Survey: Data File User’s Manual, Restricted-Use Codebook Kerry Gruber 2000–10 A Research Agenda for the 1999–2000 Schools and Staffing Survey Dan Kasprzyk
Teachers – instructional practices of
98–08 The Redesign of the Schools and Staffing Survey for 1999–2000: A Position Paper Dan Kasprzyk Teachers – opinions regarding safety
98–08 The Redesign of the Schools and Staffing Survey for 1999–2000: A Position Paper Dan Kasprzyk Teachers – performance evaluations
1999–04 Measuring Teacher Qualifications Dan Kasprzyk Teachers – qualifications of
1999–04 Measuring Teacher Qualifications Dan Kasprzyk Teachers – salaries of
94–05 Cost-of-Education Differentials Across the States William J. Fowler, Jr. Training
2000–16a Lifelong Learning NCES Task Force: Final Report Volume I Lisa Hudson 2000–16b Lifelong Learning NCES Task Force: Final Report Volume II Lisa Hudson Variance estimation
2000–03 Strengths and Limitations of Using SUDAAN, Stata, and WesVarPC for Computing Variances from NCES Data Sets
Ralph Lee
2000–04 Selected Papers on Education Surveys: Papers Presented at the 1998 and 1999 ASA and 1999 AAPOR Meetings
Dan Kasprzyk
Violence
97–09 Status of Data on Crime and Violence in Schools: Final Report Lee Hoffman

No. Title NCES contact Vocational education
95–12 Rural Education Data User’s Guide Samuel Peng 1999–05 Procedures Guide for Transcript Studies Dawn Nelson 1999–06 1998 Revision of the Secondary School Taxonomy Dawn Nelson