
Openness, Wage Gaps and Unions in Chile: A Micro-Econometric ...

The Effects of a Decline of Unions on the Rise in Wage Inequality:
A New Perspective
Cheng Zhan Chua Mathematical Methods in the Social Sciences
Northwestern University Advisor: Prof. Christopher Taber
June 2005

1
Acknowledgements
First and foremost, I would like to thank my advisor, Prof. Christopher Taber, without
whom none of this would have been possible. His insights, advice and encouragements have been
tremendous in keeping me going and pushing me to my limits. It has been my pleasure working
with him and I have benefited tremendously from this experience.
Next, I would like to offer thanks to Ambarish Chandra for his guidance and advice
regarding the data manipulation and statistical analysis.
My special thanks to Sarah Muir and our previous MMSS assistant, Michelle Pendleton,
for their constant smiles and friendly chats. They have been so patient and tireless in devoting
themselves to helping me whenever I needed something.
A special vote of thanks goes out to my roommate and harshest critic, Aaron, for his help
in proofreading and constant encouragement (and barbs). He has been the greatest friend I’ve had,
standing by me through everything. Thank you Aaron.
Last but not least, I would like to thank all the friends I’ve made through MMSS,
particularly Mary, Ahn-Tuan, Cary, Rahul, Matt Kane, Titus, Jackie, Lauren, Paul Maa, Eddie,
Craig, Francesca, Tom Pichert, Joe Rooney, Ben Woo, Krystle, Rosa, Veronica, Mira, Raina and
Martin. It has been such a joy being with them these three years. It is them who have made
MMSS so special to me and enriched my academic experience at NU. This piece of work is
dedicated to them.

2
Abstract
Past studies on the effects of unions on wage inequality have confounded the actual union effect
and the industrial composition shift effect. In this paper, I distinguish between the two and give a
more accurate measure of the effects of unions on wage inequality between 1983 and 2001.
Decomposing the decline of unions, I find that the demise of traditionally-unionized industries
can account for about 20% of the decline in male unionization and none of the decline in female
unionization. After decomposing the variance of wages into several components, I find that the
decline of unions can account for about 25% of the increase in male wage inequality and none of
the increase in female wage inequality. This difference stems from unions having an equalizing
effect on male wages but having an inequality-increasing effect on female wages.

3
Contents
I. Introduction ............................................................................................................................4 II. Unions and Dispersion of Wages...........................................................................................7
Basic Framework .........................................................................................................................7 Notation ........................................................................................................................................9 Estimating the effects of unionization on wage inequality at time t.............................................9
Basic Two-Sector Model ........................................................................................................10 Model incorporating shifts in industrial composition............................................................13
III. Literature Review.................................................................................................................21 IV. Estimating the Effect of Unions on Wage Inequality........................................................24
Data ............................................................................................................................................24 Trends in Unionization...............................................................................................................27 Industrial Composition Unionization Trends.............................................................................29 Decomposing the Decline of Unions ..........................................................................................32 Trends in Wage Dispersion ........................................................................................................35 Effects of Unions on Wage Inequality – Two Sector Model.......................................................39 Effects of Unions on Wage Inequality – Industrial Composition Model....................................42
V. Concluding Remarks............................................................................................................49 Summary of Findings .................................................................................................................49 Policy Applications ....................................................................................................................51 Possible Extensions ....................................................................................................................53 Closing .......................................................................................................................................54
VI. References .............................................................................................................................56 VII. Notes ......................................................................................................................................59

4
I. Introduction
Unions and its relative wage effect is a highly popular subject in the labor economics field.
According to Lewis (1986), many studies have been done measuring the union/non-union wage
gap. These have been conducted using different samples, different cross-sections and at various
times. Without a doubt, one trend is consistent – union membership impacts workers’
compensations and work lives. According to the Economic Policy Institute (1993), unions raise
wages of unionized workers by roughly 20% and raise compensation, including both wages and
benefits by about 28%. This view is supported by the American Federated Labor – Congress of
Industrial Organizations (AFL-CIO, 2005), the largest form of unionized labor in the country,
which states on its website that in “every occupational group, unionized workers earn more than
their non-unionized counterparts.”
While there is little debate over the ability of unions to raise the wages of its workers, the
effect of unions on the distribution of income has long been a bone of contention among social
scientists. Prior to the publication of Freeman’s watershed What Do Unions Do? and other
related papers (1980, 1982, 1984), the dominant view had been that unions increased wage
inequality (Johnson, 1975). Freeman argued and proved that unions actually concentrated union
wages towards a “standard wage,” (Reynolds and Taft, 1956) thus exerting an equalizing effect
on wage distribution and reducing the amount of wage inequality present in the union sector and
consequently, in the economy as a whole. This equalizing effect stems from the fact that unions
raise the wages of less-skilled and lower-wage workers more than they raise the wages of higher-
skilled and higher-wage workers, thus concentrating union wages and reducing wage dispersion..
Following Freeman’s logic, an increase in unionization would reduce wage dispersion.
Conversely, as unions decline in strength, it is predicted that they will have less collective

5
bargaining power and become less able to standardize the wages of their workers. Therefore,
unions are less able to raise the wages of less-skilled and lower-wage workers. Resultantly, an
increase in wage dispersion and inequality will be observed. This is exactly what has been
observed over the past 30 years – a dramatic decline in the unionization rate in the U.S. (Farber,
1990) coupled with increases in the level of wage dispersion (Katz and Autor, 1999).
Many studies (see for example, Card 2001, Freeman 1993, DiNardo, Fortin and Lemiuex
1996) have been done trying to figure out how much of the increase in wage dispersion over the
past 30 years can be attributed to a decline of unions. However, studies up till now have assumed
the fall in unionization rate to be an exogenous factor. An outstanding issue is the extent to which
union density changes are endogenous responses to other labor market forces (Katz and Autor,
1999). In particular, no study up till now has considered the shift of workers out of “traditionally-
unionized” industries as an endogenous source of the decline of unions. This is where I try to
break new ground with my study.
Over the past 20 years, many industries which once were known as being “traditionally-
unionized” have lost workers to “traditionally-less-unionized” industries. As workers leave these
“traditionally-unionized” industries, they move out of the union sector as an outcome.
Resultantly, in these traditionally-unionized industries, there would be two distinct sources of a
decline of unions – a decline of unions at a rate comparable to the national average, which I shall
term as a “direct” decline, and a further decline of unions due to workers leaving these industries
and therefore leaving unions (Freeman 1988), which I shall term as an “indirect” decline.
Consequently, when we look at the economy as a whole, the demise of unions can also be
decomposed into two distinct components: a direct decline of unions, and an additional indirect
decline of unions stemming purely from a decline of “traditionally-unionized” industries. While

6
there is no consensus on the amount of the decline in unions that can be attributed to industrial
composition shifts with estimates ranging from 20 percent to as high as 70 percent (see for
example, Farber 1987, Dickens and Leonard 1985, Freeman 1988, Baldwin 2003), there is no
doubt that shifts in industrial composition away from highly-unionized industries towards
comparatively less unionized industries did play a part in bringing about the overall decline of
unions in the country.
Current studies of union decline and wage inequality however have failed to explicitly
consider this factor; they have conveniently lumped the two distinct components of the decline of
unions into one “decline of unions” component. Resultantly, when linking the decline of unions
to the rise in wage inequality, the increase that should be attributed to the indirect decline of
unions is “concealed” within the increase that is attributed to the direct decline of unions. A more
accurate model would be one that separates the two factors for the decline of unions and when
considering the effect of the decline of unions on the increase in wage inequality, only consider
the direct decline of unions and not the indirect decline of unions which stems from shifts in
industrial composition.
This paper seeks to do just that – present new estimates of the effect of changing
unionization, incorporating shifts in industrial composition of the labor force, on wage inequality
for male and female workers over the period form 1983 to 2001. More specifically, this paper
seeks to find out how much of the increase in wage inequality can be attributed to a direct decline
of unions. I begin by presenting a review of the current literature in this field of study: unions and
wage inequality, followed by a simple analysis of unionization rates in different industries over
the past 20 years. Using the basic Freeman (1980) two-sector model which does not separate the
two sources of the decline of unions apart, I examine the wage inequality over this time period

7
and determine how much of this change in wage dispersion over the past 20 years can be
attributed to the decline of unionization. Attention is then devoted to the relationship between
shifts in industrial composition and the declining unionization rates, and how this affects wage
dispersion and inequality. For the purposes of this study, I will categorize the economy into 47
industries, based on the 2-digit Detailed Industry Classification Code created by the National
Bureau of Economic Research for use in the Current Population Survey (CPS). Building on the
Freeman model, I develop a more complicated model which separates the decline of unions into
two components: industrial composition shifts leading to an indirect decline of unions, and a
direct decline of unions. Using this model, I decompose the rise in wage inequality over time and
determine how much of it can be attributed to a true direct decline in unions.
II. Unions and Dispersion of Wages
Basic Framework
This paper starts by developing a framework that can be used to study the effects of
unions on dispersion of wages in the economy. Let WU represent the average potential wage in
the unionized sector across all industries, with variance 2Uσ , and let WN represent the average
potential wage in the non-unionized sector across all industries, with variance 2Nσ . Next, let W
and 2σ represent the average and variance of observed wages in the economy as a whole.
Since variance can be used as a measure of wage dispersion and inequality1, 2Nσ can be
used to measure of the wage dispersion observed if all workers in the economy were paid a non-
union wage, while 2σ can be used to measure the amount of wage dispersion observed in the
entire economy composed of both the union and non-union sectors. Resultantly, the difference

8
between the two variances can be used as a measure of the change in wage dispersion observed
due to the presence of unions; 2σ – 2Nσ is the effect of unions on wage dispersion.
However, a problem exists with obtaining this measure, 2σ – 2Nσ . Lewis (1986) points out
that any observations of WU and WN, as well as their corresponding residual variances, 2Uσ and
2Nσ , are actually functions of the currently observed unionization rate, meaning that what is
actually being observed is 2Uσ (u) and 2
Nσ (u), where u is the currently observed unionization rate
and 0 1u≤ ≤ . Resultantly, when measuring 2σ – 2Nσ , what is actually being obtained is 2σ –
2Nσ (u), a measure of the difference in variance in the economy and the variance of non-union
sector wages that are observed given the current levels of unionization, while the true measure of
the effect of unions on wage inequality is 2σ – 2Nσ (0), the difference between the variance
actually observed in an economy with both union and non-union sectors and the variance that
would be observed in non-union wages, in the absence of any unionization.
Herein lies the problem. The threat of workers joining unions forces employers to try to
act like one (Lewis 1986), raising wages and narrowing the gap between the lowly-paid and the
highly-paid workers. As a result, 2Nσ (u) is not a robust measure for the variance of non-union
wages in a scenario where unions did not exist, 2Nσ (0); 2
Nσ (u) is not expected to equal 2Nσ (0).
However, since 2Nσ (u) is the best available measure of 2
Nσ (0) and furthermore, since what
I am doing is fundamentally descriptive and I am not trying to prove an exact causal relationship,
2Nσ (u) would suffice as a credible measure of 2
Nσ (0). Thus, acknowledging the potential bias in
2Nσ (u), I will but continue to utilize 2σ – 2
Nσ (u), the difference between the variance observed in
the entire economy and the variance that would be observed if everyone were paid according to

9
the current non-union wage structure at the current levels of unionism observed in the economy,
to measure 2σ – 2Nσ (0), the true effect of unions on wage dispersion in an economy.
Notation
A fairly large amount of notation will be used in this section. Before I proceed, I would
like to apologize to the reader for any agony caused. I have tried my best to simplify matters and
what is left is merely the bare bones needed. As an aid to readers, the following table presents a
list of notation and their corresponding definitions, where I is the industry variable, T is the time
variable and U is the union status variable.
Notation Definition Notation Definition
WUit E(W | I=i, T=t, U=1) WNit E(W | I=i, T=t, U=0)
2Uitσ Var (W | I=i, T=t, U=1) 2
Nitσ Var (W | I=i, T=t, U=0)
itµ ( )Pr 1| ,U I i T t= = = tµ ( )Pr 1|U T t= =
WUt E(W | T=t, U=1) WNt E(W | T=t, U=0)
2Utσ Var (W | T=t, U=1) 2
Ntσ Var (W | T=t, U=0)
tW E(W | T=t) 2tσ Var (W | T=t)
Pit ( )Pr |I i T t= = Estimating the effects of unionization on wage inequality at time t
To illustrate the potential effects of unions on wage inequality at time t, we begin by
assuming that workers are randomly assigned into each of the 47 industries being studied.
Effectively, we are saying that there is no correlation between factors such as location, education,
sex, skills and industry assigned. Clearly, this assumption may be far-fetched. But when we look
at job allocation on a macro skill, it would make sense. No industry would be merely employing

10
low-skill workers. Neither would an industry just have highly-educated workers. While the
distribution might not be exactly balanced, such an assumption would suffice for now.
Let the industry i average potential log wage at time t in the union and non-union sectors
be denoted by WUit and WNit respectively. Let 2Uitσ and 2
Nitσ represent the variances of potential
log wage for individuals in industry i at time t in the union and non-union sectors respectively.
Let itµ denote the proportion of workers in industry i at time t belonging to unions and let
tµ represent the overall unionization rate in the economy at time t. Let UtW and NtW represent the
overall means of wages in the economy in the union and non-union sector respectively at time t.
Finally, let tW represent the overall mean wage in the economy at time t where:
(1 )t t Ut t NtW W Wµ µ= + −
Letting Pit represent the fraction of the population that is in industry i at time t the
variance of log wages in the economy at time t, 2tσ , can be expressed as2:
2 2 2 2 2(1 ) ( ) (1 )( )Uit t Nit tt it it Uit it it Nit it it it iti i i i
P P P W W P W Wσ µ σ µ σ µ µ= + − + − + − −∑ ∑ ∑ ∑
Basic Two-Sector Model
In a case where the economy is merely divided into the union and non-union sectors, the
model developed by Freeman (1980) which does not separate the two distinct components
leading to a decline of unions is obtained. In this model, since industry divisions do not exist, the
unionization rate – itµ , the variance of potential wages in industry i in the union and non-union
sector – 2Uitσ and 2
Nitσ respectively, the mean union and non-union wages in industry i – UitW and
NitW respectively, are identical across all industries i. Since there is effectively only one industry,
there is no longer any need for weighted sums.

11
Acknowledging the earlier-discussed potential bias in measures of 2Nσ , the effect of
unions on wage dispersion, which is the difference between variance of observed wages in the
economy at time t and the variance of that would be observed if all workers were paid their
potential wage in the non-union sector, can be expressed as3:
( ) ( )22 2 2 2 (1 ) ,t Nt t Ut Nt t t Ut NtW Wσ σ µ σ σ µ µ− = − + − − (1)
where 2Utσ and 2
Ntσ represent the variances of wages in the union and non-union sectors
respectively at time t. This expression makes intuitive sense at first glance – it is a function of
characteristics of both the union and non-union sectors. Clearly, any measure of wage inequality
cannot be looking at one of the sectors by itself; it must be a comparison of wages in both sectors.
This aggregate effect of unions on wage dispersion can be broken down into two
components – the within-sector and the between-sector effect. The first term reflects the “within-
sector” effect – the extent of wage dispersion present among workers with union coverage, as
compared to among workers without union coverage. This is measured by the product of the
unionization rate and the variance gap between union and non-union wages. Since unions are
known to “compress” wages across the board, this effect is expected to be negative as the amount
of wage dispersion within the union sector is expected to be less than that in the non-union sector.
This “within-sector” effect term reflects the inequality-reducing effect of unions.
The second term reflects the “between-sector” effect created by unions. This is the
difference in average wage between identical workers in the unionized and non-unionized sectors
and can be measured by a product of the unionization rate, the non-unionization rate and the
square of the union-nonunion average log wage gap. This effect is expected to be positive as
12
unions create a gap between union and non-union wages. The greater the gap, the larger this
effect. This “between-sector” effect term reflects the inequality-increasing effect of unions.
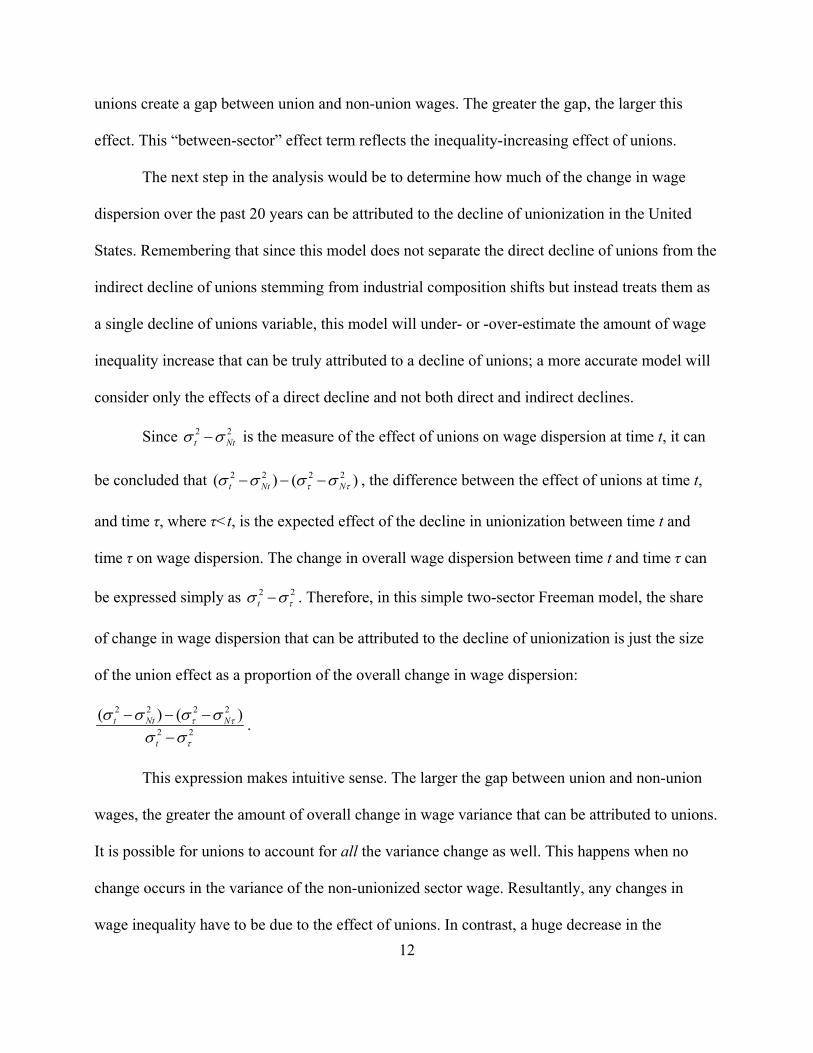
The next step in the analysis would be to determine how much of the change in wage
dispersion over the past 20 years can be attributed to the decline of unionization in the United
States. Remembering that since this model does not separate the direct decline of unions from the
indirect decline of unions stemming from industrial composition shifts but instead treats them as
a single decline of unions variable, this model will under- or -over-estimate the amount of wage
inequality increase that can be truly attributed to a decline of unions; a more accurate model will
consider only the effects of a direct decline and not both direct and indirect declines.
Since 2 2t Ntσ σ− is the measure of the effect of unions on wage dispersion at time t, it can
be concluded that 2 2 2 2( ) ( )t Nt Nτ τσ σ σ σ− − − , the difference between the effect of unions at time t,
and time τ, where τ<t, is the expected effect of the decline in unionization between time t and
time τ on wage dispersion. The change in overall wage dispersion between time t and time τ can
be expressed simply as 2 2t τσ σ− . Therefore, in this simple two-sector Freeman model, the share
of change in wage dispersion that can be attributed to the decline of unionization is just the size
of the union effect as a proportion of the overall change in wage dispersion:
2 2 2 2
2 2
( ) ( )t Nt N
t
τ τ
τ
σ σ σ σσ σ
− − −−
.
This expression makes intuitive sense. The larger the gap between union and non-union
wages, the greater the amount of overall change in wage variance that can be attributed to unions.
It is possible for unions to account for all the variance change as well. This happens when no
change occurs in the variance of the non-unionized sector wage. Resultantly, any changes in
wage inequality have to be due to the effect of unions. In contrast, a huge decrease in the

13
unionization rate, ceteris paribus, would mean that a large amount of the increase in overall wage
dispersion can be attributed to unions.
Model incorporating shifts in industrial composition
The simplistic model developed by Freeman (1980) is inadequate in determining the exact
role played by unions in the increase of wage inequality observed over the past 20 years. In
particular, this approach assumes the decline of unions to be an exogenous factor. As Freeman
(1988) observed, shifts in industrial composition are a key factor in the decline of unionization in
the United States. However, Freeman (1980) did not factor this into his model.
Resultantly, the single “direct” effect of the decline in unions on wage inequality that
Freeman (1980) found is actually two separate effects – the effect of a direct decline in unions
and the effect of an indirect decline in unions caused by a shift away from the traditionally-
unionized industries – aggregated into one. Consequently, what Freeman thought to be the effect
of a direct decline in unions on wage inequality is actually an under- or over-estimation of the
true effect.
To get a better measure of the true effect of a direct decline of unions on wage inequality,
industrial shifts should be integrated into the model. Combining the frameworks developed by
Card (2001), Freeman (1980), and Juhn, Murphy and Pierce (1993), this paper seeks to build
such a model which will decompose the effect of the decline of unions on wage dispersion and
determine how much of the increase in wage dispersion can be attributed to a direct decline of
unions.
Since 2tσ , can be expressed as:
2 2 2 2 2(1 ) ( ) (1 )( )Uit t Nit tt it it Uit it it Nit it it it iti i i i
P P P W W P W Wσ µ σ µ σ µ µ= + − + − + − −∑ ∑ ∑ ∑

14
The change in variance between time t and τ, where τ <t, can be decomposed into factors
which involve changing union rates and shifts in industrial composition (i.e., a shift in Pit)4:
( ) ( )
( ) ( )
2 2 2 2
2 2 2 2
2 2
2 2
( ) (1 )
+ ( ) (1 )( )
( ) (1 )( )
( ) ( ) (1 )
t it i it Uit it i it Niti i
i it Uit Ui i it Nit Nii i
Uit t Nit tit i it it i iti i
Uit t Uii it i iti i
P P P P
P P
P P W W P P W W
P W W W W P
τ τ τ
τ τ τ τ
τ τ
τ ττ τ
σ σ µ σ µ σ
µ σ σ µ σ σ
µ µ
µ µ
− = − + − −
− + − −
+ − − + − − −
+ − − − + −
∑ ∑
∑ ∑
∑ ∑
∑ ∑
( ) ( )
2 2
2 2 2 2
( ) ( )
( ) ( ) ( )
Nit t Ni
Ui Niit i i Ui Ni it i ii i
W W W W
P P W W W W
τ τ
τ τ τ ττ τ τ τ τ τµ µ σ σ µ µ
− − −
+ − − + − − − − ∑ ∑(2)
The change in variance between time t and time τ can be broken up into ten terms, a group of
eight terms and a set of two terms. The first eight terms pertain to the effect of unions on wage
inequality if no change in union activity within the sector is observed between the two time
periods; there are only changes in industrial composition and wage. In contrast, the last two terms
measure the effect of unionization on inequality when the union rate changes, holding industrial
composition and wage constant; these two terms measure the effects of a direct decline of unions
on the rise in wage inequality.
The group of eight terms can be further broken down into two groups of four terms. The
first four terms deal with “within-industry” effects while the next four terms deal with “between-
industry” effects.
The first four terms are basically variations of the weighted sum of industry union and
non-union wage dispersions. In these terms, changes that occur in an industry’s wage variance or
industrial composition are multiplied and summed by other characteristics of the same industry to

15
give the effect on change in wage inequality. The math of the terms also reflect this intuition. In
these four terms, taking union wage as an example, we see that:
( )( )22 | , , 1 | , , 1 ,Uit E W E W I i T t U I i T t Uσ = − = = = = = =
a function composed merely of observations of W | I=i, T=t, U=1. Therefore, in each of the four
terms, for each industry i, we are comparing observed W | I=i, T=t, U=1 with the mean of W |
I=i, T=t, U=1 to find the dispersion of wages within this industry, its corresponding changes and
how this affects changes in wage inequality. Unmistakably, we are interested only in this industry
and are not concerned with how this industry compares with other industries or the overall
economy mean wage, justifying the naming of these terms as “within-industry” effects.
In contrast, the latter four terms deal with how a particular industry compares with the
economy average; a comparison is made between the industry and the overall economy. Changes
that occur in an industry are multiplied by the gap between that industry’s mean wages and the
overall mean wage in the economy to yield the effects on change in wage inequality.
Furthermore, while the formula for Var(X) cannot be directly applied to the following
four terms, we see a resemblance. Taking union wages as an example and using X = WUit = E(W |
I=i, T=t, U=1), we see that
( ) ( )( )W | I=i, T=t, U=1 E(W | T=t)tE X E E W= ≠ = .
While the fit into the variance formula is not exact, we do see how ( )2tUitW W− looks similar to a
variance. Resultantly, ( )2tUitW W− can be loosely (and inexactly) defined as the between-
industry variance of union (non-union) wage and overall economy mean wage, as compared to

16
the first four terms’ variance within industry i, another reason for the latter four terms to named
“between-industry” effects and the first four terms to be named “within-industry” effects.
Turning to the interpretation of the terms, the first two terms, ( ) 2( )it i it Uiti
P Pτ µ σ−∑ and
( ) 2(1 )it i it Niti
P Pτ µ σ− −∑ , represent the effects on wage dispersion of a change in industrial
composition when respectively, unionized and non-unionized workers shift industries but stay
within their respective sectors. These terms are called the “within-industry composition effects.”
The effect is measured by the weighted sum of the difference in industrial composition multiplied
by the unionization (non-unionization) rate and the union (non-union) wage variance. In
particular, as workers shift towards industries with greater wage variances, union status
remaining constant, thus causing a greater concentration of workers in industries with high wage
variance and a lower concentration of workers in industries with low wage variance, the size of
these two terms would rise, reflecting the increase in overall wage dispersion in the economy due
to these shifts in industrial composition.
The next two terms, 2 2( )i it Uit Uii
Pτ τµ σ σ−∑ and 2 2(1 )( )i it Nit Nii
Pτ τµ σ σ− −∑ , are called the
“within-industry variance change effects” and they reflect the effects on wage dispersion caused
by the union and the non-union sector when respectively, variance of the union and non-union
log wage within industries change over time. The effect is measured by the weighted sum of the
unionization (non-unionization) rate and the change in union (non-union) wage variances over
time. Holding industrial composition, unionization and non-unionization rates constant, an
exogenous increase or decrease in union and non-union wage variances would lead to a
respective increase or decrease in wage dispersion between the two time periods. Since these two
terms do not measure the effect of unions on wage dispersion, they are of less interest to us.

17
The fifth and sixth terms, ( ) 2( )Uit tit i iti
P P W Wτ µ− −∑ and ( ) 2(1 )( )Nit tit i iti
P P W Wτ µ− − −∑ ,
represent the effects caused respectively by the union and non-union sectors when composition
between industries change, and there is a gap between mean union wages, mean non-union wages
and resultantly, average overall wage. Intuitively, these two terms make perfect sense. Following
the above-used loose definitions of ( )2tUitW W− and ( )2
tNitW W− as the between-industry
variance of union (and non-union) wage and overall economy mean wage, a weighted sum over
change in industrial composition of each of these industry variances gives the “between-industry
composition effect” on change in wage inequality. In a case of industrial composition shifts
where workers move away from median-wage industries, with industry union and non-union
wage closely aligned to economy mean wage, toward high and low-wage industries, with
industry union and non-union wage varying greatly from economy mean wage, these two effects
would lead to an increase in wage inequality. The intuition behind this being that there is a
greater concentration of workers in industries with high “between-industry variance” as
compared to before, resulting in an increase in wage dispersion.
The next two terms, 2 2( ) ( )Uit t Uii iti
P W W W Wτ ττ µ − − − ∑ and
2 2(1 ) ( ) ( )Nit t Nii iti
P W W W Wτ ττ µ − − − − ∑ , reflect the effects of the union and non-union sector
on wage dispersion when respectively, industry-level union and non-union wages change across
time and a gap is observed between union, non-union and average overall wages. We call these
terms the “between-industry wage change effects.” This effect is measured by the weighted sums
of the union (non-union) rate and the change in the square of the gap between mean industry

18
union wage and overall mean wage. Again, loosely defining ( )2tUitW W− and ( )2
tNitW W− as the
between-industry variance of union (and non-union) wage and overall economy mean wage,
these two terms are measures of exogenous industry wage changes and the resultant effects on
wage inequality. Once more, these two terms do not reflect a change in wage dispersion caused
by a decline of unions nor a shift in industrial composition. Therefore, they are of limited interest
to this paper.
These above eight terms represent the effect of unions on earnings inequality if no change
in union activity within the sector is observed between the two time periods; there are only
changes in industrial composition and wage. These eight terms are an expansion of the model
developed by Jhun, Murphy and Pierce [JMP] (1993) in their attempts to measure the effect of
industrial composition changes and skill price changes on wage inequality. However, in their
model, JMP did not divide industries into the union and non-union sectors. Thus, they have only
four terms, while I have eight.
According to JMP, the within-industry variance increases and the between-industry wage
increases are manifestations of differences in skill prices and are signs of increased inequality.
The same analysis would apply for my model – the key difference being that since these effects
are unrelated to industrial composition shifts and the decline of unions, they are of little interest.
The other key distinction between the two models is that my model takes a fresh approach to the
JMP model and splits industries up into the union and the non-union sector, incorporating
industry unionization rates, industry mean union wages and industry mean non-union wages.
The final two terms are the terms we are most interested in – the effects caused by
changes due to union activity within the sector; these are the effects of a direct decline of unions

19
on the increase in wage inequality. The first of these terms, ( ) 2 2( )it i i Ui Nii
Pτ τ τ τµ µ σ σ− −∑ , reflects
the inequality-increasing effect of a decline of unions – a decline of unions leads to an increase in
wage dispersion. This effect is measured by the weighted sum of the variance gap between
industry union and non-union wages multiplied by the change in industry unionization rate. A
simplified version of this term without the industrial divisions and just an economy-wide measure
is the change over time in what Freeman named the “within-sector” effect – a measure of the
amount of wage dispersion within the union sector, as compared to within the non-union sector.
This effect is expected to be positive because a fall in union rate means that over time, whatever
the inequality-reducing effects of unions, this effect becomes less pronounced and less significant,
leading to an increase in wage inequality.
The final term, ( ) 2 2( ) ( )Ui Niit i ii
P W W W Wτ τ τ ττ τµ µ − − − − ∑ , is the effect of unions on
wage dispersion caused by changing unionization rates in industries where union wages are
different from non-union wages. This effect is measured by the weighted sum of the change in
union rate multiplied by the industrial composition and the gap between the squares of the
difference of mean industry union wage and overall mean wage, and the difference of mean
industry non-union wage and overall mean wage. Again, loosely defining ( )2tUitW W− and
( )2tNitW W− as the between-industry variance of union (and non-union) wage and overall
economy mean wage, this final term is a weighted sum of changing unionization rates, holding
industrial composition and variance gaps constant. In an industry where the gap between union
wage and economy mean wage is greater than the gap between non-union wage and economy
mean wage, a decline in unionization would lead to a fall in wage inequality, while an increase in

20
unionization would lead to an increase in wage dispersion. Intuitively, this happens because the
greater the unionization rate, the more this variance gap is emphasized, while a smaller
unionization rate would mean that the variance gap becomes less important in contributing to
overall wage dispersion, resulting in a corresponding fall in wage inequality.
Though this model seems removed from the basic Freeman two-sector model, they are
actually highly related. In the case where the economy is not divided into industries, and the
variance and mean of union, non-union and overall wages at time t is equal to that at time τ, these
last two terms of the decomposition can be simplified to become 2 2 2 2( ) ( )t Nt Nτ τσ σ σ σ− − − , the
difference between the effect of unions at time t and time τ in the simple Freeman two-sector
model.
There are several key differences between the Freeman variance decomposition model
and the model I have proposed. The first, and most obvious, being that my model incorporates
industry divisions and the all-important industrial composition shift component. Resultantly,
while the Freeman model is only able to measure the effects of a decline of unions on wage
inequality, this model is able to separate the decline of unions into a direct and indirect decline
and consider only the effects of a direct decline of unions on wage inequality increases. The other
difference being that my model breaks down the overall change in wage inequality into terms
consisting of changes in unionization, changes in industrial composition, and exogenous changes
in wages. In comparison, the Freeman model reports only changes due to unionization, not
specifying the sources of the rest of the change in wage dispersion.
Building off current models linking unions and wage inequality, I have developed a more
sophisticated model to assess the effects of a decline of unions on the increase in wage inequality.
This new model integrates union changes, changes in unionization due to industrial composition

21
shifts, and exogenous wage changes to specifically tackle the effect of industrial composition
shifts on the decline of unions and the resultant rise in wage inequality, a vast improvement over
previous models which have assumed the decline of unions to be a purely exogenous variable.
III. Literature Review
Early on in the study of unions, it was believed that unions actually increased inequality.
In Lewis’ definitive and careful study of unions and wages, Unionism and Relative Wages in the
United States: An Empirical Inquiry (1963), he concluded that because union membership was
concentrated among comparatively higher-paid workers, unionism worked towards raising wage
inequality. Lewis also contented that because unions created differentials between otherwise
comparable workers, unionism increased inequality. This view was supported by Friedman (1962)
who argued that the presence of unions created a gap between union and non-union sector wages
for otherwise similar workers.
The first studies done on the topic of unions and wage inequality were highly micro in
nature and could not be extrapolated to the economy as a whole. An example was a 1962 study
by Ozanne focusing on unions in McCormick Deering. He concluded that unions had no “general
tendency” to either increase or decrease intra-company wage inequality.
It was not long before evidence of the equalizing effects of unions started appearing.
Rosen (1970) and Johnson and Youmans (1971) found that unions had an equalizing effect
within the union sector as the wages of the “unskilled laborers” were raised to a greater extent
than the wages of the “skilled craftsmen.” However, Rosen was apprehensive in declaring that
unions had a definitive inequality-reducing effect. In fact, Rosen speculated that the overall effect
of unionism was “most likely” an increase in wage dispersion.

22
It was not until studies were conducted based on individual-level micro data that the
inequality-reducing effects of unions in the economy were ascertained. Freeman’s ground-
breaking 1980 study argued that unions actually exerted an equalizing effect on wage distribution,
reducing the amount of wage dispersion present. He found that union wage policies worked to
concentrate wages towards a “standard wage” (Reynolds and Taft, 1956) within and across
establishments resulting in a significant reduction of wage dispersion among unionized workers,
as well as a narrowing of the wage gap between white-collar and blue-collar workers within the
organized sector. According to Freeman and Medoff (1984), these inequality-reducing within-
sector effects were quantitatively larger than the inequality-increasing effects of the union-
nonunion gap. As a result, Freeman concluded that unions played an inequality-reducing role in
the United States..
Similar studies done by Freeman in 1982, 1984 and 1993 with different sets of data
reached the same conclusions. In addition, Freeman concluded in his 1993 study that declining
unionization accounted for about 20 percent of the increase in standard deviation of male wages
in the US between 1978 and 1988.
While these studies by Freeman made a valid point, they were incomplete. Card, Lemieux
and Riddell (2003) argue that these studies essentially treated all workers to be part of a single
huge group, ignoring variations in the unionization rate and the union wage effect that existed
across differing types of workers. Studies done after 1995, termed by Card, Lemieux and Riddell
as “Second Generation Studies,” tried specifically to address these problems.
The first of these, done by DiNardo, Fortin and Lemieux (1996) found a rise in wage
inequality between 1979 and 1988. Taking a fresh econometric approach to the question via the
use of kernel density methods applied to reweighted samples, their paper suggests that the decline

23
in unionization can account for almost 11 percent of the overall rise in male wage dispersion and
almost none of the rise in female wage dispersion. A related study by DiNardo and Lemieux
(1997) estimated that unions reduced the variance of male wages by 6 percent in 1981 and 3
percent in 1988. They also came to the same conclusion that changing unionization patterns had
contributed to the rise in US wage inequality.
The next study in this series was done by Card in 20015. Card begins by estimating the
effect of unions on inequality using the simple two-sector Freeman formula, expression (4).
Interestingly, he finds that while unions have an inequality-reducing effect on male wages, unions
do not actually reduce wage inequality among females. Dividing the sample into 10 equally-sized
skill groups, Card predicts the wages in the non-union sector and uses a variation of expression (3)
to measure the effect of unions on wage dispersion. He finds that among men, union rates have
declined most significantly among the lowest-wage workers while among women, unionization
has decreased for low-wage workers but has increased for high-wage workers. Resultantly,
shifting union patterns have had little effect on the rise in female inequality while being able to
explain almost 30 percent of the rise in male inequality between 1973 and 2001. A study by
Gosling and Lemieux (2001) using the reweighting method of DiNardo, Fortin and Lemieux
(1996) reported findings robust with that of Card.
In the most recent study of this field, Card, Lemieux and Riddell (2003) extend the model
above to include up to 343 skill groups. This change reduces the sizes of the “within-sector” and
“between-sector” effects and introduces additional terms that reflect the differing rates of union
coverage and union wage effects across skill groups. Though the magnitudes of the union effects
are now smaller, the same conclusions regarding the effect of the decline of unionization on wage
inequality are reached.

24
The last set of studies in this field deal with the problem of unobserved skill differences
and the resultant non-random selection of workers into the union sector. Since this is not directly
relevant to this paper, I shall dispense with reviewing the literature.
As can be observed, the study of unions and wage inequality is a field that has yet to be
fully studied; only selected sub-fields and explanations have been explored in the search for the
association between the fall in unionization rates and the increase in wage inequality. In
particular, all of the studies have assumed the decline of unionism as an exogenous variable; the
only corrections that have been made are those pertaining to workforce characteristics. With this
paper, I intend to decompose the decline of unions into a direct decline, and an indirect decline
caused by shifts in industrial composition (Farber, 1987; Dickens and Leonard, Freeman 1988,
Baldwin 2003) and study the effects of a direct decline of unions on the increase in wage
inequality.
IV. Estimating the Effect of Unions on Wage Inequality
Data
I use a single source of data for my analysis – the Current Population Survey (CPS)
monthly earnings supplement files, also known as the “Merged Outgoing Rotation Group”
(ORG). Since 1983, these files have been issued once a year and contain information about an
individual’s wage and union status, pertaining to the individual’s main job as of the survey week.
I have chosen to merge sets of three-year data to obtain a single dataset for each of these
years. The first set of merged data is for 1983, 1984 and 1985 (henceforth referred to as 1985).
The second set of merged data is for 1991, 1992 and 1993 (henceforth referred to as 1993). The
final set of merged data is for 1999, 2000 and 2001 (henceforth referred to as 2001). There are

25
two reasons I chose such a configuration. The first being that because of the division of
observations by industry, there was a need to pool data together in order to ensure that there was
an adequate sample size for each industry being studied. The second reason was that the most
recent data I had access to was the 2001 dataset, and I wanted to make use of both the first and
last data samples available. The eventual choice of data configuration was the best possible fit for
these constraints.
Since each household entering the CPS is interviewed for 4 months, then ignored for 8
months, then interviewed again for 4 more months, they would appear in the outgoing rotation
groups twice – once at the end of the first 4 months and again at the end of the second 4 months.
To ensure that each individual is not represented twice, I have dropped from the data the second
observation of individuals who appear more than once. The potential problem with this would be
that individuals who have industry, wage or union status changes between the two years would
not have this change reflected.
The ORG contains information about union status and for those who are not union
members, union coverage. Since having union coverage would place an individual under union
wage contracts, individuals who are not union members but who have union coverage have been
considered as “union members” for the purposes and intents of this study.
In the ORG supplement of the CPS, workers paid by the hour are asked their hourly rate
of pay. I use this variable as the measure of hourly wage for these workers. For workers not paid
by the hour, I use average hourly earnings (weekly earnings divided by usual weekly hours) as a
measure of the hourly wage rate. While the former measure has been collected in a consistent
manner over time, the latter measure has not been so. Prior to 1993, this variable was collected by
asking individuals directly about their earnings on a weekly basis. Since then, respondents have

26
had the option of reporting their earnings on a base period of their choice (weekly, bi-weekly,
monthly or annually). Weekly earnings are then obtained by normalizing the reported earnings to
a weekly basis. While this change in the collection of earnings data will have an inevitable impact
on the distribution of wages, Card and DiNardo (2002) report that this impact is insignificant.
Another potential problem is that weekly earnings, and the corresponding hourly wage
values, have been top-coded at different values throughout the sample period. Prior to 1988, the
top-code stood at $999. It was later increased to $1923 in 1988 and $2884 in 1998. To keep the
wage samples relatively comparable over time, I trim observations with hourly wages above $75
($2001). This corresponds to about 1% of the sample size in each year. I also trim observations
with wages less than $2.50 ($2001) as this typically corresponds to about half of the minimum
wage. The wage deflator used is the Consumer Price Index.
In the ORG supplements of the CPS, respondents who did not answer questions regarding
their wages had their wages or earnings allocated to them using an imputation procedure. Since
union status was not one of the characteristics used to match observations with missing earnings
to observations with non-missing earnings in the imputation procedure (Card, Lemieux and
Riddel, 2003) estimates of union wage effects obtained from a sample with allocation
observations included could be severely biased downward (Hirsch and Schumacher, 2004).
Therefore, I have chosen to exclude such observations with allocated wages.
For the industry divisions, I have chosen to make use of the 2-digit Detailed Industry
Classification Code created by the National Bureau of Economic Research for use in the Current
Population Survey (CPS). This divides the observations into 47 industries, giving each industry a
sample size averaging 7800 each. Though this coding was not in the original CPS, I have chosen

27
to utilize it as it has remained fixed in my data through the years being studied while the CPS
codings have changed many times over the years.
For the division of the states, I have employed the Regional Division definitions currently
utilized by the US Census Bureau, in which the states are divided into the West, the Midwest, the
South and the Northeast6.
Finally, I have included in the sample only adults between the ages of 16 and 64.
Trends in Unionization
Table 1 presents a descriptive overview of the changes in union membership between the
early 80s and the turn of the century for male and female workers. Specifically, the periods being
studied are: 1983-1985 (henceforth referred to as 1985), 1991-1993 (henceforth referred to as
1993) and 1999-2001 (henceforth referred to as 2001).
The first row of Table 1 shows the well-documented decline in union membership over
the years in consideration. It can be observed that this decline has not happened at the same pace
for males and females. In particular, female union membership falls at a slower speed, as
compared to male union membership. Card (2001) attributes this relative stability in female union
membership to a shift in unionization from the private sector to the public sector.
Looking across the ratios in the different groupings, we can see a similar wide-spread fall
in unionization rates across the board. Once again, it can be observed that unionization rates for
male workers fell more sharply than for female workers over the period being studied.
Row 7 of Table 1 illustrates another well-known fact about union membership. In general, there
is a higher unionization rate among the more highly-paid workers. Making a reasonable
assumption that increased years of education and years of work experience lead to higher wages,
Rows 3 and 6 of Table 1 add credibility to this observation – unionization rates are highest

28
Table 1: Union Membership Rates for Men and Women: 1983-1985 vs 1991-1993 vs 1999-2001
1983-1985 1991-1993 1999-2001
Ratio 1999-2001/1983-1985/
Group male female male female male female male female
1. All 25.78% 16.77% 20.51% 14.82% 16.73% 13.49% 0.65 0.80
2. By Race: White 25.14% 15.57% 19.99% 13.78% 16.30% 12.91% 0.65 0.83 Black 33.30% 26.29% 27.05% 22.30% 22.52% 18.29% 0.68 0.70 Others 25.52% 19.60% 18.75% 16.98% 15.88% 13.61% 0.62 0.69
3. By Age: 16-30 16.27% 11.04% 11.72% 8.28% 9.51% 7.38% 0.58 0.67 31-45 31.10% 20.50% 23.48% 17.58% 18.00% 14.17% 0.58 0.69 46-64 35.21% 22.25% 28.70% 19.71% 23.40% 19.33% 0.66 0.87
4. By State Region: West 26.07% 18.69% 20.48% 16.57% 16.97% 14.94% 0.65 0.80 Midwest 30.33% 16.99% 24.24% 15.53% 19.90% 13.73% 0.66 0.81 South 17.31% 11.29% 12.61% 9.08% 10.38% 8.43% 0.60 0.75 Northeast 31.73% 21.93% 26.37% 19.64% 21.77% 18.81% 0.69 0.86
5. By Metropolitan, Non-Metropolitan Status: Metropolitan 27.31% 17.80% 21.22% 15.49% 17.09% 14.12% 0.63 0.79 Non Metro. 23.06% 14.86% 18.62% 12.92% 15.46% 11.32% 0.67 0.76
6. By Education: < High School 25.95% 14.90% 15.74% 10.32% 9.66% 7.04% 0.37 0.47 High School 30.97% 14.99% 25.42% 13.07% 20.38% 11.14% 0.66 0.74 Some college 24.42% 12.88% 21.40% 11.56% 19.11% 10.54% 0.78 0.82 College or more 18.62% 26.27% 15.58% 23.48% 14.07% 22.08% 0.76 0.84
7. By Wage Deciles: bottom 20% 4.10% 4.28% 4.49% 4.46% 3.99% 4.38% 0.97 1.02 20% - 40% 10.42% 12.04% 10.37% 10.11% 8.00% 8.62% 0.77 0.72 40% - 60% 22.45% 20.80% 20.44% 17.71% 16.67% 15.97% 0.74 0.77 60% - 80% 38.86% 30.38% 31.35% 24.54% 25.75% 22.05% 0.66 0.73 top 20% 36.46% 32.42% 28.15% 26.25% 22.58% 23.34% 0.62 0.72
8. Sample Size 194,248 175,000 188,693 180,826 121,143 120,766

29
among the more educated workers (more so for females than for males), and the workers with the
greatest work experience. This observation is in line with what Lewis (1963) observed – that
union membership is concentrated among comparatively higher-paid workers7.
An interesting observation that has yet to be fully explained is the differing unionization
trends, when sorted by levels of education. For females, unionization rates appear to increase
with levels of education. For male workers however, unionization is highest among workers with
high school and “some college” qualification. A possible reason for this is the relatively high
rates of unionization for teachers, nurses and other public sector workers, industries which are
overwhelmingly female and hire from the upper-end of the educational spectrum.
Industrial Composition Unionization Trends
Table 2 presents a summary of the shifts in industrial composition and the changes in
industry unionization trends for each of the 47 industries being studied. In the first two columns,
we see the ratio of the proportion of workers in each industry. In the last two columns, we see the
ratio of unionization rates. Note that this table merely summarizes the changes that have occurred
over the period being studied. While two industries may have the same ratios, the underlying
percentages may be vastly different. For example, in 1985, “Furniture and Fixtures” employed
0.89% of male workers in the economy. In 2001, this number had fallen to 0.88%, yielding a
ratio of 0.99. In contrast, “Other Professional Services” had 6.01% of male workers in the
economy in 1985. In 2001, this number had fallen to 5.94%, also yielding a ratio of 0.99. In both
cases, the same ratios are obtained for two sets of percentages very different in value.
The fall in unionization rates is prevalent across almost every industry, with declines
ranging from as small as 1% to as high as 75%. In fact, out of the 47 industries being studied, 43
of them exhibit a decline in both male and female unionization rates.

30
Table 2. Ratios: 1999-2001/1983-1985
Pit (Proportion of
workers in industry) Unionization Rates Industry Male Female Male Female \
1 Motor vehicles and equipment 0.83 1.39 0.60 0.59 2 Primary metals 0.69 0.65 0.63 0.52 3 Paper and allied products 0.68 0.37 0.60 0.58 4 Transportation 1.00 1.15 0.69 0.89 5 Utilities and Sanitary Services 0.79 0.99 0.76 0.79 6 Communications 1.10 0.98 0.51 0.47 7 Educational Services 0.99 0.78 0.88 0.97 8 Aircrafts and parts 0.67 0.98 0.71 0.71 9 Public Administration 0.92 0.83 1.00 1.01
10 Petroleum and coal products 0.65 1.00 0.66 0.78 11 Food and kindred products 0.76 0.74 0.64 0.70 12 Stone clay ,glass and concrete product 0.85 0.58 0.66 0.46 13 Other transportation equipment 0.60 1.13 0.63 0.43 14 Fabricated metal 0.86 0.72 0.53 0.42 15 Rubber and miscellaneous plastics products 0.99 0.66 0.51 0.52
*16 Tobacco manufactures 0.58 0.81 0.94 0.48 17 Construction 1.07 0.72 0.76 0.97 18 Mining 0.54 0.86 0.58 0.40
19 Electrical Machinery, equipment ,and supplies 0.80 0.78 0.43 0.48
20 Chemicals and allied products 0.83 0.57 0.56 0.54 21 Machinery, except electrical 0.77 0.41 0.51 0.48 22 Hospitals 0.96 0.34 0.70 0.75 23 Apparel and other finished textile prod 0.76 0.79 0.28 0.33
*24 Leather and leather products 0.32 0.85 0.98 0.34 25 Printing ,publishing and allied industries 0.83 0.90 0.53 0.62 26 Lumber and wood products , except furniture 0.80 0.75 0.48 0.82 27 Furniture and fixtures 0.93 0.84 0.50 0.47 28 Health Services , Except Hospitals 1.83 0.22 0.49 0.71 29 Toys, amusements ,and sporting goods 1.16 1.18 0.18 0.31 30 Personal Services , Except Private Household 1.07 0.85 0.71 0.78
31 Miscellaneous and not specified manufacturing industries 1.20 0.95 0.61 0.44
32 Social Services 1.60 1.01 0.65 0.67 33 Entertainment and Recreation Services 1.61 0.91 0.77 0.71 34 Textile mill products 0.51 0.94 0.54 0.29
*35 Forestry and Fisheries 2.49 1.04 1.36 2.47 36 Wholesale Trade 0.99 0.46 0.59 0.64

31
37 Professional and photographic equipment 0.87 1.36 0.51 0.29 *38 Not specified metal industries 0.96 1.02 1.67 0.00 39 Retail Trade 1.08 0.98 0.57 0.69 40 Business Services 1.77 1.67 0.42 0.57 41 Insurance and Real Estate 1.01 0.86 0.65 0.72 42 Agriculture Service 1.27 1.38 0.47 0.21 43 Other professional Services 1.51 1.13 0.59 0.68 44 Repair Services 1.06 1.62 0.52 0.22 45 Banking and Other Finance 1.23 1.35 0.54 0.55 46 Other Agriculture 0.60 5.87 0.89 1.00
*47 Private Household Services 0.20 1.00 1.98 4.69 * = sample size less than 100 in at least one period of observation
Another observation that can be gleamed from the table is that many of the industries with
the greatest decline in union rates are primary industries which exhibited the highest union
presence in 1985. An example is the Primary Metals industry. In 1985, this industry had a male
union rate of 57.95%. By 2001, this had fallen by almost 40% to 36.25%. In 1985, male workers
in this industry made up 1.93% of workers in the economy. By 2001, this had fallen by 40% to
1.15%, reflecting the migration of workers away from this industry towards other industries. A
study into the industrial unionization trends would reveal that this pattern of a decline in unions
along with a shift of workers out of the industry is a common story in many of the 47 industries.
Table 3 summarizes these findings into a concise manner.
Table 3. Summary of Industrial Composition and Union Rate Changes: 1983-1985 vs 1999-2001
No. of industries - Union ratio < 1
No. of industries - Union ratio > 1
Male Female Male Female No. of industries - Proportion ratio < 1 28 31 2 2 No. of industries - Proportion ratio > 1 16 13 1 1
As can be seen, the decline of unions is a common occurrence in many of the industries
being studied. What is not so uniform is the changes in industrial compositions of these industries.
Out of the 44 industries which exhibit a decline in male union rates, 28 of them have had workers

32
moving out of the industry, while the remaining 16 have had workers moving into the industry.
For females, the numbers are 44, 31 and 13 respectively.
Given such an observation, the claim that “workers are moving out of traditionally
unionized industries towards traditionally non-unionized industries” may be too strong a
statement. However, if we arbitrarily define an industry with a union rate greater than 30% in
1985 as an indicator this is a “traditionally unionized industry,” the statement reveals its validity.
Out of the 16 industries which fit such a label (they have been italicized in table 2), up to 14 of
them reflect a movement of workers out of the industry. Furthermore, among the “traditionally
non-unionized industries,” up to half of them reflect a movement of workers into the industry.
Resultantly, the statement that “workers are moving out of traditionally unionized industries
towards traditionally non-unionized industries” still maintains its validity for both males and
females and we have grounds to believe that the postulated indirect decline of unions stemming
from such movements of workers away from “traditionally-unionized” industries may be true.
Decomposing the Decline of Unions
As pointed out in the first section, up till now, models of union decline leading to wage
inequality increase have ignored the trends in industrial composition shifts over the last 20 years
– that is that workers have been moving out of traditionally unionized industries towards
traditionally non-unionized industries. Consequently, what has formerly always been treated as a
“direct” decline of unions actually encompasses two effects – the true direct decline of unions,
and the indirect decline of unions arising from industrial composition movements.
Using the following expression, where tµ represents the overall unionization rate in the
economy at time t, the decline of unionization between time t and time τ, where τ< t, can be
formally decomposed as:

33
( ) ( )t i i it i it iti i
P P Pµ µ µ µ µτ τ τ τ− = − + −∑ ∑ .
In the first term, industrial composition is kept constant and there are only changes in the
unionization rates of each of the industries. This term, a weighted sum of industrial compositions
and changes in unionization rates, measures the direct decline of unions – that which stems from
factors outside of the model. This direct decline of unions term is what we are concerned with
when we measure the effects of a decline of unions on the rise in wage inequality.
In contrast, the second term measures the indirect decline of unions – that which stems
from shifts in industrial composition. This term, a weighted sum of unionization rates and
changes in industrial composition, measures what happens when workers move across industries
with different historical unionization rates. In particular, as workers move from traditionally-
unionized industries towards traditionally-less-unionized industries resulting in a decline of
unions, this term is expected to be positive.
Table 4 shows the decomposition of the decline of unions into these two effects. Once
again, I have arbitrarily defined an industry with a union rate greater than 30% in 1985 as an
indicator that an industry is a “traditionally-unionized industry.”
Looking at the overall decline of unions for males between 1983 and 2001, we can see
that union coverage fell by 9.04% during this time period. Of this 9.04% decline, 7.54% of it was
due to a direct decline of unions while 1.50% of it was due to an indirect decline of unions – a
decline of unions stemming purely from industrial composition shifts. This means that for male
workers, industrial composition shifts can account for about 17% of the decline of unions.
In contrast, industrial composition shifts seemed to have played no role in causing an a
decline of unions among females; all of the decline seems to stem from a direct decline of unions.
This observation is consistent across all the time periods being studied.

34
For male workers, the movement of workers out of the traditionally-unionized industries
towards traditionally-less-unionized industries contributed to a decline of unions (1.66% in the
entire period). But for females, this industrial composition shift actually led to a slight increase in
unionization. This implies that the statement that “workers are moving out of traditionally
unionized industries towards traditionally non-unionized industries and leading to a resultant
decline of unions” is true for males, but not for females.
Much of these above findings regarding the decline of unions stemming from industrial
composition shifts, and the male-female differences in the decline of unions are new and ground-
breaking, and are worthy of studies on its own. But since I am interested in these decompositions
only for the sake of the direct decline of unions, I will skip any further discussion on these
important findings but merely suggest further studies into them.
Table 4. Decomposition of Decline of Unions
1983-1985 to
1991-1993 1991-1993 to
1999-2001 1983-1985 to
1999-2001 male female male female male female
Overall decline of unions 5.26% 1.95% 3.78% 1.33% 9.04% 3.28%
Direct decline of unions “Traditionally-Unionized” 2.19% 0.44% 1.53% 0.71% 3.55% 1.12% “Traditionally-Less-Unionized” 2.33% 1.35% 1.63% 0.88% 3.99% 2.12% Total 4.52% 1.79% 3.16% 1.60% 7.54% 3.24%
Indirect decline of unions arising from industrial composition changes “Traditionally-Unionized” 0.58% -0.01% 0.91% -0.49% 1.66% -0.47% “Traditionally-Less-Unionized” 0.16% 0.17% -0.30% 0.23% -0.16% 0.51% Total 0.74% 0.16% 0.62% -0.27% 1.50% 0.04% Note: positive indicates a decline of unions while negative indicates an increase in unionization
Three important facts can be gleamed from this table. First, it is clear that for both males
and females, the direct decline of unions is a more significant contributor to the decline of unions
than an indirect decline of unions arising from industrial composition changes. Second, very
interestingly, the direct decline of unions is greater in “traditionally-less-unionized” industries.

35
This is to say that if there had been no industrial composition shifts, these “traditionally-
unionized” industries would still have a higher unionization rate than “traditionally-less
unionized” industries and would still be worthy of the title of “traditionally-unionized” industries.
Finally, and what is most relevant to this study, it is evident that for males, the shift of
workers away from “traditionally-unionized industries” has contributed significantly to the
decline of unions. For the entire period being studied, this shift led to a 1.66% decline in unions.
Resultantly, separating the decline of unions into two effects – the direct decline of unions, and
the indirect decline of unions arising from industrial composition movements – is non-trivial and
is expected to change the amount of male wage inequality increase that can be attributed to a
direct decline of unions.
In contrast, for females, the indirect decline of unions stemming from industrial
composition shifts is negligible; most of the decline of unions comes from a direct decline of
unions. Resultantly, both models are expected to attribute about the same amount of the rise in
wage inequality to the decline of unions.
Trends in Wage Dispersion
Table 5 presents a summary of the changes in wage dispersion between the three periods
being studied. Log wage, rather then monetary wage, has been used8.
Comparisons of mean wage and wage dispersions between sectors and over time illustrate
three important facts. First, the gap between union and nonunion wages, for both males and
females, has been shrinking since 1985. This is a result of the hypothesized fall in unionization
leading to a decline in union bargaining power and ability to raise wages. Resultantly, union
wages exhibit less of an increase over nonunion wages over time. Second, as documented by
Freeman (1980), the dispersion of wages is always smaller in the union than in the nonunion

36
sector. This is the equalizing effect of unions – the reduction of the spread of wages across
workers in the workforce. Interestingly though, wages of unionized females have a higher
dispersion than that of males, while wages of non-unionized females have a lower dispersion than
that of males. Consequently, the gap in variance is larger for men than for women. Third, wage
dispersion for both males and females in both sectors rose substantially between 1985 and 2001.
These findings are consistent with studies by Lemieux (1993), Card (2001) and Freeman (1980).
Table 5. Summary of Characteristics: 1983-1985 vs 1991-1993 vs 1999-2001 1983-1985 1991-1993 1999-2001
Variable male female male female male female
1. Unionization Rate 25.78% 16.77% 20.51% 14.82% 16.73% 13.49%
2. Mean Log Wages (2001$): Union 2.320 2.051 2.588 2.415 2.856 2.698 Nonunion 2.012 1.714 2.318 2.097 2.607 2.389 Union Gap 0.308 0.338 0.270 0.318 0.249 0.309
3. Variance Log Wages: Overall Variance 0.2966 0.2278 0.3218 0.2608 0.3332 0.2792 Union 0.1473 0.1719 0.1768 0.2063 0.1870 0.2205 Nonunion 0.3239 0.2199 0.3443 0.2553 0.3522 0.2755 Union Gap -0.1766 -0.0480 -0.1674 -0.0490 -0.1652 -0.0550
Figures 1 and 2 provide some evidence of the assertion that unions raise wages more for
lower-wage workers then for higher-wage workers. Each point represents the mean wage for
unionized workers in an industry plotted against the corresponding mean for non-union workers
in the same industry. The linear fit lines are best fit lines for each of the three time periods being
studied. Note that if union and nonunion workers in an industry have the same average wage, the
point will lie on the 45-degree line. On the other hand, if the union wage is above the nonunion
wage and a positive gap exists, the point will lie above the 45-degree line. Moreover, if the union
wage gap is greater for lower-wage workers, than for higher-wage workers, the points will tend to

37
be further above the 45-degree line for lower-wage workers (on the left side of the graph) than for
higher-wage workers (on the right).
Figure 3 . Union Wage Effect (Male), 1983-1985, 1991-1993, 1999-2001
1991-1993 Linear Fit
1999-2001 Linear Fit
1983-1985 Linear Fit
1.500
1.700
1.900
2.100
2.300
2.500
2.700
2.900
3.100
1.500 1.700 1.900 2.100 2.300 2.500 2.700 2.900 3.100Mean Non-Union Wage
Mea
n U
nion
Wag
e
1983-19851991-19931999-2001
Solid Line - 45 degreesDotted Lines - linear fits
In the case of male workers, four trends are clear. First, wage has increased over time.
Second, unions raise wages for lower-wage workers more than for higher-wage workers. This is
most clearly reflected in the best-fit line being above the 45-degree on the left of the graph, and
getting closer to the 45-degree line as wage increases. This is exactly in line with what Lewis
(1986) concluded. Third, unions may not actually be effective in raising wages for higher-wage
workers. As can be seen, the best-fit lines actually end beneath the 45-degree in all three periods.
Figure 1.
1991-1993 Linear Fit

38
Finally, if we superimpose the three linear fit lines over one another, we observe that the linear fit
lines increase in gradient across time. This is in line with the prediction that as unionization falls,
bargaining power declines and unions are less able to raise the wages of lower-wage workers, as
compared to raising the wages of higher-wage workers.
Figure 4. Union Wage Effect (Female), 1983-1985, 1991-1993, 1999-2001
1991-1993 Linear Fit
1999-2001 Linear Fit
1983-1985 Linear Fit
1.200
1.400
1.600
1.800
2.000
2.200
2.400
2.600
2.800
3.000
1.200 1.400 1.600 1.800 2.000 2.200 2.400 2.600 2.800 3.000Mean Non-Union Wage
Mea
n U
nion
Wag
e
1983-19851991-19931999-2001
Solid Line - 45 degreesDotted Lines - linear fits
For female workers, interestingly, only the first and fourth of the above-mentioned trends
are clear. However, another trend can be observed – that is that unions consistently raise union
wages above nonunion wages, even for higher-wage workers. In fact, for the two latter periods,
the best-fit lines are almost parallel to the 45-degree implying that unions raise wages for lower-
Figure 2.

39
wage female workers as much as unions raise wages for higher-wage female workers. Coupled
with the tendency of unionization rates of women to rise across the wage distribution, the absence
of a “flattening” effect of unions on female wages implies that the union wage gain is either zero
or positive, limiting the potential equalizing effect of unions on female wage inequality.
Effects of Unions on Wage Inequality – Two Sector Model
With this background knowledge in general unionization and wage dispersion trends, I
turn my analysis to the effect of unions on wage inequality in the U.S. labor market over the last
20 years. Applying equation (1), the Freeman two-sector variance decomposition model, to the
summary statistics from Table 5, the results presented in Table 6 are obtained. Earlier in the
paper, I have already explained each of these terms, thus I will dispense with it here.
Table 6. Freeman Two Sector Variance Decomposition 1983-1985 1991-1993 1999-2001
male female male female male femaleFreeman Two Sector Model Within-Sector Effect -0.0455 -0.0080 -0.0344 -0.0073 -0.0276 -0.0074 Between-Sector Effect 0.0182 0.0159 0.0119 0.0128 0.0087 0.0112 Total Effect -0.0274 0.0079 -0.0225 0.0055 -0.0190 0.0037
As hypothesized, unions have both an inequality-increasing (between-sector effect) and
an inequality-reducing effect (within-sector effect). However, it must be noted that this effect is
not of the same magnitude for males and females. For males, the within-sector effect is
substantially larger (in absolute value) than the between-sector effect, implying that unions, as a
whole, reduce wage dispersion. In contrast, unions have a slight disequalizing effect on female
wage inequality. This is consistent with the findings of Card (2001) and Lemieux (1993) that
unions tend to increase the variance of wages among women.
According to Card, Lemieux and Riddell (2003), this difference can be explained by two
complementary factors. First, the female unionization rate is lower than the male unionization

40
rate. This means that whatever the effects of unions, it will be less emphasized in females, as
compared to males, because of this lack of penetration. Second, the gap in overall wage
dispersion between union and nonunion workers is much smaller for women than for men, as
observed in Table 5. Intuitively, a lower unionization rate coupled with this lack of an
“inequality-reducing” effect of unions on female wages means that consequently, unions have
less ability to reduce female wage dispersion – the female within-sector effect is smaller than that
for males. While there is little difference in the between-sector effect between males and females,
the overall effect, the sum of the between-sector and within-sector effects, reflects the differences
in within-sector effects. Resultantly, unions lead to an increase in the variance of wages among
women while reducing the dispersion of wages among men.
Since unions respectively decrease and increase wage inequality for males and females, a
decline in unions over time is expected to correspond to a rise in male wage inequality and a fall
in female wage inequality. The results in Table 7 show exactly this.
Table 7. Estimates of the Effects of Unions on Wage Inequality – Freeman Two Sector Model
1983-1985 to
1991-1993 1991-1993 to
1999-2001 1983-1985 to
1999-2001 male female male female male female
Overall change in Variance of Wages 0.0252 0.0331 0.0115 0.0184 0.0367 0.0515
Freeman Two Sector Model Change in Within-Sector Effect 0.0112 0.0008 0.0067 -0.0002 0.0179 0.0006 Change in Between-Sector Effect -0.0063 -0.0031 -0.0032 -0.0016 -0.0095 -0.0047 Change in Total Effect of Unions 0.0049 -0.0024 0.0035 -0.0017 0.0084 -0.0041 Share Attributable to Unions 19.34% -7.16% 30.52% -9.47% 22.84% -7.99%
According to the Freeman basic two sector model that does not separate the two distinct
components leading to a decline of unions – the direct decline, and the indirect decline stemming
from industrial composition shifts – but instead just combines the two as a single decline of

41
unions variable, the decline in unionism between 1983-1985 and 1999-2001 is expected to cause
the variance of male wages to rise by 0.0084 and the variance of female wages to fall by -0.0041.
This change in variance can be broken down into two changes – the change in the within-
sector effect, and the change in the between-sector effect. The first change, expressed as
( ) ( )2 2 2 2it Ut Nt i U Nµ σ σ µ σ στ τ τ− − − ,
is the rise in wage dispersion expected due to the decline of unionization. This term, similar to
Term 9 of the model involving industrial compositions, is expected to be positive because a fall
in unionization means that, whatever the inequality-reducing effects of unions, this effect
becomes less pronounced and less significant. The second change, expressed mathematically as
( )( ) ( )( )2 21 1it it Ut Nt i i U NW W W Wµ µ µ µτ τ τ τ− − − − − ,
reflects the change that would occur in the gap between union and nonunion wages when unions
decline. This change is expected to be negative as a decline of unions means that the gap between
union and nonunion wages would decrease over time and the inequality-increasing effect of
unions is reduced. The sum of these two changes would give rise to the overall change in wage
dispersion that is caused by a decline of unions.
As can be observed in Table 7, the changes in both within-sector and between-sector
effects are substantially larger for males (in absolute value). There are two complementary
reasons for this. The first is that whilst there is a higher unionization rate amongst males, the
decline of unionization is also more rapid amongst the males. Resultantly, any effect of a decline
in unionization would be more pronounced among the male workers than among the female
workers. Secondly, as can be gleamed from Figures 1 and 2, unions seem to have a greater effect

42
among male workers. Consequently, any effect stemming from a decline in unions would again
affect the males more so than the females.
The last line of Table 7 is what this paper set to find out – the effects of the decline of
unions on the increase in wage inequality in a model that does not separate the two components
in the decline of unions. As can be seen in the comparisons between 1983-1985 and 1999-2001,
the decline in unionism between the two periods is expected to cause the variance of male and
female wages to increase by 0.0084 and -0.0041 respectively. However, the actual rise in
variance of wages between the two periods is 0.0367 for men and 0.0515 for women. Therefore,
it can be concluded that falling unionism can explain about 22.84% (0.0084/0.0367) of the rise in
male wage inequality, but none of the rise in female wage inequality. In other words, if the effect
of unions on the dispersion of wages had remained constant over time, overall wage inequality
would have grown by 22.84% less than it actually did.
Effects of Unions on Wage Inequality – Industrial Composition Model
As argued earlier, a study that does not separate the two distinct components in a decline
of unions would lead to an under-or-over-estimation of the amount of wage inequality increase
that can be attributed to unions. A more accurate estimation would be one from a model that
separates the direct and indirect decline of unions, and when considering the effects of unions on
wage inequality, only consider the effects of a direct decline of unions and not the effects of an
indirect decline of unions stemming from industrial composition shifts. This is what the industrial
composition model I propose seeks to do.
Applying equation (2) to the three time period gaps being studied: from 1983-1985 to
1991-1993, from 1991-1993 to 1999-2001, and the overarching 1983-1985 to 1999-2001, the
results presented in Table 8 are obtained.

43
Table 8. Variance Decomposition model accounting for industrial composition changes
1983-1985 to
1991-1993 1991-1993 to
1999-2001 1983-1985 to
1999-2001 male female male female male female
Model Incorporating Industrial Composition
Union Sector Within-Industry Composition Effects (Term 1) -0.0003 0.0003 -0.0003 0.0010 -0.0006 0.0014
Nonunion Sector Within-Industry Composition Effects (Term 2) 0.0050 0.0021 0.0048 0.0008 0.0101 0.0023
Union Sector Within-Industry Variance Change Effects (Term 3) 0.0051 0.0037 0.0003 0.0016 0.0047 0.0049
Nonunion Sector Within-Industry Variance Change Effects (Term 4) 0.0176 0.0297 0.0052 0.0208 0.0230 0.0514
Union Sector Between-Industry Composition Effects (Term 5) -0.0006 0.0002 -0.0003 0.0003 -0.0007 0.0003
Nonunion Sector Between-Industry Composition Effects (Term 6) -0.0007 -0.0035 -0.0014 -0.0033 -0.0014 -0.0061
Union Sector Between-Industry Variance Change Effects (Term 7) -0.0014 -0.0013 -0.0002 -0.0010 -0.0012 -0.0018
Nonunion Sector Between-Industry Variance Change Effects (Term 8) -0.0046 0.0013 -0.0003 -0.0022 -0.0059 -0.0018
Within-Sector Change Effects (Term 9) 0.0058 0.0009 0.0041 0.0009 0.0101 0.0018
Between-Sector Change Effects (Term 10) -0.0007 -0.0004 -0.0003 -0.0005 -0.0013 -0.0011
\
Contrasting the findings of Terms 1 and 2 for males and females, we see an interesting
difference. Term 1, the union sector within-industry composition effect, shows that over time,
male union workers have been moving into industries with less wage dispersion, while their
female counterparts have been moving into industries with increased wage dispersion. Term 2,
the non-union sector within-industry composition effect, shows the same trend for females, but
the inverse for males.
The natural question to ask would be: why? Why have these differing trends in male and
female union and nonunion workers emerged? Is there something about the differences in male
and female skill levels and their process of self-selection into unions that causes this difference?
Or are differences in the types of industries male and female workers choose to unionize in

44
causing these variations? These questions will not and cannot be adequately answered in this
study, but make interesting material for a whole study in itself as an extension of this paper.
Looking at Terms 3 and 4, the union and nonunion sector within-industry variance change
effects, we again observe differing trends between males and females. While wage variance has
invariably grown over time for both the union and nonunion sectors, female wage variance has
increased twice as fast as male wage variance in the nonunion sector, despite the increases being
equal in the union sector. Since it is not in the scope of this paper to focus on industries, and its
respective wage and variance changes, I shall not delve further into this issue, but shall leave it as
material for a possible extension of this study.
The values for Term 5 and 6, respectively the union and nonunion sector between-
industry composition effects, present a very interesting observation. Except for female union
workers, there has been a general shift of workers towards median-wage industries, with industry
union and non-union wage closely aligned to economy mean wage, and away from high and low-
wage industries, with industry union and non-union wage varying greatly from economy mean
wage, leading to a decrease in wage inequality. Referring to Figures 1 and 2, this can be
represented graphically as a movement of workers towards the industries with points clustered
around the middle and away from the industries with points viewed as outliers.
Terms 7 and 8, the union and nonunion sector between-industry variance change effects,
have some explanation for this finding. The negative signs on these values indicate that over
time, the differences between union wage and mean economy wage, and nonunion wage and
mean economy wage have been decreasing. It can therefore possible to conclude that industries
are setting wages closer to the economy mean wage and are becoming “median-wage industries”
moving away from their former statuses as “high-wage industries” and “low-wage industries.”

45
Resultantly, no matter how workers shift industries, they will be moving to industries with wages
very close to mean economy wage, whether in the union or nonunion sector. Therefore, terms 5
and 6 are expected to be negative, rather than positive.
Terms 9 and 10, the within sector and between sector change effects, are terms that
measure the effects caused purely by changes due to union activity within the sector and are of
the most interest to us. Term 9 is positive as expected because a direct decline in unionization
means that, whatever the inequality-reducing effects of unions, this effect becomes less
pronounced and less significant. Resultantly, a direct decline of unions leads to an increase in
wage dispersion. On the contrary, term 10 is negative as predicted because a decline of unions
means that the gap between union and mean economy wages, and nonunion and mean economy
wages is less emphasized over time and the inequality-increasing effect of unions is reduced.
Having now decomposed the changes in wage inequality between two periods into ten
distinct terms, the next step of the analysis would be to attribute shares of the increase in wage
inequality to each of the three factors involved – shifts in industrial composition, exogenous
changes to wages and wage variance, and changes in unionization rates stemming from a direct
decline of unions, paying particular attention to the last factor. Table 9 provides this breakdown.
Note that though the decline of unions has been decomposed into a direct and indirect
decline, only the effects of the direct decline on wage inequality can be observed. The effects of
the indirect decline stemming from industrial composition shifts are subsumed into the effects of
industrial composition shifts as a whole and cannot be observed directly.
Note also that the Freeman model had attributed none of the female wage inequality
increase to a decline of unions. Furthermore, as seen in table 4, the decline of unions arising from
industrial composition shifts for females is close to zero. Resultantly, separating the decline of

46
unions into the two effects is trivia because all the weight would be on the first factor – a direct
decline of unions – and none of it would be on the indirect decline of unions factor. Therefore,
this industrial composition model is not expected to attribute any more or less of the female wage
inequality increase to a direct decline of unions than the Freeman model did.
Table 9. Estimates of the Effects of Unions on Wage Inequality
1983-1985 to
1991-1993 1991-1993 to
1999-2001 1983-1985 to
1999-2001 male female male female male female
Overall change 0.0252 0.0331 0.0115 0.0184 0.0367 0.0515Model Incorporating Industrial Composition Shifts in Industrial Composition
Effect (Terms 1 + 2 + 5 + 6 ) 0.0034 -0.0010 0.0028 -0.0012 0.0074 -0.0020
Share of Wage Inequality Increase 13.68% -2.91% 24.10% -6.36% 20.08% -3.88%
Exogenous Changes to Wages Effect (Terms 3 + 4 + 7 +8) 0.0167 0.0334 0.0050 0.0192 0.0206 0.0527
Share of Wage Inequality Increase 66.33% 101.1% 43.93% 104.3% 56.24% 102.4%
Direct Union Effect (Term 9 + 10) 0.0051 0.0005 0.0037 0.0004 0.0088 0.0007 Share of Wage Inequality Increase 20.06% 1.49% 32.51% 2.38% 23.89% 1.36%
As predicted, shifts in industrial composition and the decline of unions accounted for
none of the increase in female wage inequality over time with exogenous changes to wages
accounting for all of the increase. In contrast, for the period from 1983-1985 to 1999-2001, the
direct decline of unions was expected to cause a male wage dispersion increase of 0.0088 points
while the actual male wage inequality increase was 0.0367. Resultantly, the decline of unions can
account for only 24% of the increase in male wage inequality, with the huge bulk of the increase
being attributable to exogenous changes in wages.
Comparing the results of the two different models, one would notice that both models
attribute essentially the same amount of the rise in wage inequality to the decline of unions – the
decline of unions contributed to none of the increase in female wage inequality but contributed to
about a quarter of the rise in male wage dispersion over the time period spanning 1983 and 2001.

47
Though industrial composition shifts with workers moving away from “traditionally-
unionized” industries towards “traditionally-less-unionized” industries did lead to a decline of
unions over and above the general decline of unions that was observed throughout the economy,
we can conclude that this indirect decline, ceteris paribus, did not lead to any rise in wage
inequality. When the decline of unions is separated into two distinct components – the direct
decline of unions and the indirect decline of unions stemming from industrial composition shifts,
we find that the share of wage inequality increase that can be attributed to the direct decline of
unions is as much as that which is attributed to the decline of unions in the Freeman model which
does not separate these two components apart. Counting back, we can conclude that the indirect
decline of unions did not contribute significantly to the increase in wage inequality.
Summarizing the results, we can see that the indirect decline of unions stemming from
industrial composition shifts did not lead to any increase in male or female wage inequality. In
contrast, the direct decline of unions contributed to 20% - 30% of the rise in male wage
inequality but none of the rise in female wage inequality between 1983 and 2001.
The reason for the indirect decline of unions stemming from industrial composition shifts
not leading to any increase in male or female wage inequality is because there is little correlation
between the magnitude of indirect decline and the inequality-reducing effect of unions in each of
the 47 industries. In contrast, there is a strong correlation between the magnitude of direct decline
and the inequality-reducing effect of unions for male workers in each of the 47 industries.
These correlations are shown in table 10.
Table 10. Correlation between inequality-reducing effect of unions and union decline
1983-1985 to 1991-1993 1991-1993 to 1999-2001 1983-1985 to 1999-2001 Decline male female male female male female Direct 0.5460 -0.1298 0.6351 0.5568 0.5946 -0.1003 Indirect 0.0962 -0.2548 -0.0338 -0.6368 0.1084 -0.3357
48
Note that here we are interested only in the male observations because for female, unions
increase wage inequality. Consequently, a decline of unions should not cause any increase in
wage inequality and therefore, the correlation between female wage inequality increase and
female union decline is trivial.
The intuition behind these correlations is simple. Theory predicts that since unions have
an inequality-reducing effect, the decline of unions is expected to lead to an increase in wage
inequality. However, the effect of unions on wage inequality is different in each industry. In
particular, the stronger the inequality-reducing effect of unions on a particular industry, the
greater the increase in wage inequality that is expected when unions decline in this industry. In
contrast, if unions do little to reduce wage inequality in a particular industry, the decline of
unions is not expected to cause any increase in wage inequality in this industry.
For males, I find that the industries which exhibit the greatest direct decline of unions are
the same industries in which unions had the greatest inequality-reducing effect. Therefore, as
unions experience a direct decline in these industries, a significant increase in wage inequality is
predicted, and subsequently observed. Resultantly, a direct decline of unions leads to an increase
in wage inequality.
In contrast, there is no such link between the inequality-reducing effect of unions and
indirect decline. Industries with the greatest indirect decline were actually industries in which the
effect of unions on inequality was insignificant. Therefore, though there is a significant amount
of indirect decline of unions, this does not lead to any increase in wage inequality.
Resultantly, while the direct decline of unions can account for 20%-30% of the increase in
wage inequality, the indirect decline of unions can account for none of the increase in wage
inequality.

49
V. Concluding Remarks
Summary of Findings
The primary objective of this paper has been to reassess the connections between unions
and wage dispersion, in particular the effect of a decline of unions on the rise in wage inequality.
Using variance as a measure of wage dispersion, I compare the structure of wages for workers
covered by union contracts with those who are not covered, and infer the effect of unions on
overall wage inequality. I argue that when past studies examined the effects of the decline of
unions on wage inequality, they failed to separate the two distinct components in a decline of
unions – a direct decline of unions and an indirect decline of unions stemming from industrial
composition shifts. Resultantly, the amount of wage inequality increase that is attributed to the
decline of unions may be inaccurate.
This paper makes several important findings. First, I find that unionization has been on a
decline for both male and female workers over the past 20 years and that it has fallen more
sharply for males than for females. In particular, the movement of male and female workers out
of traditionally-unionized industries towards traditionally-less-unionized industries, ceteris
paribus, has led to an indirect decline of unions among males but not among female workers; for
female workers, all the decline of unions stem from a direct decline.
Second, I examine the effects of unions on wage dispersion and find that over time, the
difference between union and non-union wages has been shrinking. I find also, as predicted, that
union wages display less variance than non-union wages. I discover that, interestingly, unions
have different effects on male and female workers – unions raise wages for lower-paid males
more than for higher-paid males, whereas for females, the effect is constant across the wage
distribution. Resultantly, for males, the inequality-reducing “within-sector” effect outweighs the

50
inequality-increasing “between-sector” effect, causing unions to reduce wage inequality for
males. For females, the reverse happens, resulting in unions increasing female wage inequality.
Using an extension of the Freeman (1980) basic two sector model to examine the impact
of the decline of unions on the rise in wage inequality, I find that over the past two decades,
because the fraction of women belonging to unions has remained relatively stable, changes in
unionization can explain none of the rise in overall female wage inequality. In contrast, the
decline in union membership among men can explain for 20% – 30% of the rise in overall male
wage inequality between 1983 and 2001.
Next, I develop a model incorporating industrial composition shifts that separates the two
distinct components in the decline of unions – the direct decline and the indirect decline
stemming from industrial composition shifts. Through this model, I observe that though workers
have been shifting towards median-wage industries, male union workers have been moving into
industries with less wage dispersion while female workers have been moving into industries with
increased wage dispersion. Examining the effects of the decline of unions on wage inequality
increases, I conclude that for both males and females, the indirect decline of unions did not lead
to any increase in wage inequality. In contrast, the direct decline of unions contributed to 20%-
30% of the rise in male wage inequality but none of the rise in female wage inequality, figures
not significantly different from those obtained through the Freeman model which did not separate
the two parts of the decline of unions apart. The reason for the indirect decline of unions not
leading to any increase in wage inequality is because there is little correlation between the
magnitude of indirect decline and the inequality-reducing effect of unions in each of the 47
industries.

51
Policy Applications
Fortin and Lemieux (1997) argue that since no explicit changes were made in the 1980s to
the National Labor Relations Act governing unions, it is possible to attribute both the decline of
unions and the rise in wage inequality to increased world-wide competition and lower trade
barriers. If this was true, policy applications dealing with organized labor and collective
bargaining would be ineffective in combating the observed rise in wage inequality. Instead,
policies would have to be aimed at protecting the domestic industry from outside influences.
However, if this argument that lower trade barriers have been responsible for the decline
of unions and the rise in wage inequality cannot be proven conclusively, policies encouraging the
expansion of unions might be able to reduce the growth in wage inequality and have an
equalizing effect on wage distribution in the country. In fact, Fortin and Lemieux (1997) stress
that institutional forces cannot be overlooked in attempts to understand and solve the recent rise
in wage inequality in the U.S. labor market.
One particular action that might be useful would be the consolidation of industries under
the supervision of the government. According to Card (1986), the deregulation of the airline
industry in 1978 had led to a well-publicized reduction of wages of unionized airline mechanics.
Since unions became less able to raise workers’ wages, they became obsolete and languished.
Given the current proliferation of bankruptcy among the airline companies, an act of
consolidation and forced mergers might be able to reverse this and increase the power of unions.
Resultantly, the growth in wage inequality may be slowed down.
Another step the federal government could engage itself in is in setting the wages of the
private sector. While this might raise huge outcries about the powers of the government, such a
move has been historically proven (Goldin and Margo, 1992). Between 1942 and 1945, the

52
National War Labor Board engaged itself in setting private sector wages. The results were clear –
“great compressions” of the wage distribution. In these modern times, what the government could
engage in is a tripartite bargaining system where unions and firms are regulated by law to set
wages within certain boundaries set by the federal government. Any disputes would be referred to
the government which would have the final say.
Prior to 1962, public-sector workers were specifically prohibited from forming unions.
The Executive Order No. 10988 signed by President John F. Kennedy in 1962 changed this and
gave federal workers the rights to organize. Since then, unions have been on the rise in the public
sector. In the 1960s, only 20% of public-sector workers were unionized. By 2002, this fraction
had risen to almost 40% (Hirsch and Macpherson, 2003) despite the continued general decline of
unions throughout the country. Policies could be designed to specifically further encourage this
upswing and stimulate the growth of public-sector unionism. Media campaigns could also be held
to encourage workers to join unions. Hopefully, a higher unionization rate within the public
sector could slow down the overall decline of unions and retard the growth of wage inequality.
Since some of the rise in wage inequality can be attributed to the decline of unions, any
steps to curb the decline of unionization might be able to reduce the growth in wage inequality.
To increase the attractiveness of unions, the unions themselves would have to play a part.
According to the AFL-CIO (2005), “improv(ing) the ability of state labor federations and local
labor councils to carry out organizing and political mobilization” would strengthen unions and
increase their membership. A loosening of legislation to aid such efforts would therefore be
helpful to unions in their bid to recruit more members and slow down the decline of unions.
Additional promotions and media coverage of the benefits of joining unions would also of course
be useful in boosting union membership.

53
Despite the appeal of all of these policies, it must be noted that the key policy that led to
the growth of unions in the 1950s, The National Labor Relations Act of 1935, is still in place
today and has never been repealed. Resultantly, it can be argued that the decline of unions
occurred despite such pro-union legislation and unless a policy is revolutionary, it may have little
effect on stimulating the growth of unions. Therefore, there might actually be little that can be
done to reduce the effects of the decline of unions on the growth in wage inequality.
Possible Extensions
Given that both models yielded approximately the same amount of the wage inequality
increase to unions, it may seem futile trying to separate the two components of the decline of
unions and then finding out specifically how much of the wage inequality increase can be
attributed to the direct decline of unions. Nonetheless, I wish to argue otherwise. A possible
extension of this paper would be one that repeats the entire exercise for a wider time period. In
this study, I used 1983 as the starting point. However, that is considerably late in the history of
the decline of unions. Given that unions have been declining since 1970 (Dickens and Leonard,
1985), a better study would be one that starts in the early 70s and ends at the turn of the century.
Another possible extension would be to incorporate observed and unobserved skill sets
and differences into the model like what Card (2001) does. Such additions might be useful in
explaining how workers choose industries to work in and how they self-select themselves into
unions. It might also shed some light on industrial composition shifts and how this affects male
and female unionization differently.
Yet another possible extension to this study would be to repeat the study for different
countries which have experienced the same decline of unions. Card, Lemieux and Riddell (2003)
chose to compare the U.S. with Canada and the U.K. because these three countries have very

54
similarly-structured unions, and have all observed declines in unions over the past 30 years. Such
a study could aim to compare the results of the two models, yielded across different countries.
Finally, as I have pointed out time and again throughout the study, the effects of unions
on males and females seem to be vastly dissimilar; the male union sector appears to be entirely
separate from the female union sector with divergent unionization trends and wage effects. While
many studies have been done addressing the self-selection of males and females into different
industries in the economy, no study has been done examining the male-female divide within the
union sector; this is an issue that has been largely ignored and is worthy of a much more in-depth
study in itself. In particular, such a study could deal with the different effects of unions on male
and female workers and the reasons behind this.
Closing
More than 20 years ago, in a ground-breaking study, Freeman (1980) found that unions
actually exerted an equalizing effect on wages, concentrating union wages towards a “standard
wage” (Reynolds and Taft, 1956) and reducing the amount of wage dispersion present in the
economy. Since then, unions have been on a decline in the country while wage inequality has
been increasing continuously. Separating the direct decline of unions from the indirect decline of
unions stemming from a demise of traditionally-unionized industries, I find that the decline of
unions can account for up to 30% of the male wage inequality increase and none of the female
wage inequality increase.
Throughout this paper, I have assumed increased wage equality to be socially desirable.
Therefore, I have painted the decline of unions and the resultant rise in wage inequality in a
negative light. However, as Freeman and Medoff (1984) cleverly point out in What Do Unions
Do?, there is no consensus on the social benefits of the equalizing effects of unions on the
55
distribution of income. If the reader believes that increased inequality is socially undesirable, he
might be disheartened to learn that the decline of unions has played a crucial role in increasing
wage inequality. However, “for readers to whom greater equalization of income is undesirable,”
the decline of unions can be viewed as a positive sign. All said, what this paper has done is
merely to objectively re-evaluate the effects of unions on wage inequality. It is up to the readers,
and the policy-makers, to place a normative judgment on this issue and decide whether the
findings of this paper are a cause for celebration or a reason to despair.

56
VI. References
• American Federated Labor – Congress of Industrial Organizations (AFL-CIO). Union Pay Is Higher In Nearly All Occupational Groups. Available from http://www.aflcio.org/aboutunions/joinunions/whyjoin/uniondifference/uniondiff5.cfm, [accessed Mar 9, 2005], 2005.
• Baldwin, Robert E. Decline of US Labor Unions and the Role of Trade, Washington D.C.: Institute for International Economics, 2003.
• Card, David. “The Impact of Deregulation on the Employment and Wages of Airline Mechanics,” Industrial and Labor Relations Review, Vol. 39. (July 1986): pp. 527-538.
• Card, David. “The Effect of Unions on Wage Inequality in the U.S. Labor Market.” Industrial and Labor Relations Review 54, (Jan 2001): pp. 296-315.
• Card, David and John DiNardo. “Skill-biased Technological Change and Rising Wage Inequality: Some Problems and Puzzles.” Journal of Labor Economics 20, (Oct 2002): pp. 733-783
• Card, David, Thomas Lemieux and W. Craig Riddell. “Unions and the Wage Structure.” in John T. Addison and Claus Schnabel, eds. The International Handbook of Trade Unions, Cheltenham: Edward Elgar, 2003.
• Dickens, William T., Jonathan S. Leonard. “Accounting for the Decline in Union Membership, 1950-1980.” Industrial and Labor Relations Review 38, (Apr, 1985): pp. 323-334.
• DiNardo, John, Nicole Fortin, and Thomas Lemieux. “Labor Market Instituions and the Distribution of Wages, 1973- 1992: A Semi-Parametric Appriach.” Econometrica, Vol 64 (Sept 1996): pp. 1001-1044.
• DiNardo, John and Thomas Lemieux. “Diverging Male Wage Inequality in the United States and Canada, 1981-88: Do Institutions Explain the Difference?” Industrial and Labor Relations Review 50, (Jul. 1997): pp. 629-651.
• Farber, Henry S. “The Recent Decline of Unionization in the United States.” Science, New Series, Vol. 238. (Nov. 1987): pp. 915-920.
• Farber, Henry S. “The Decline of Unionization in the United States: What can be Learned from Recent Experience?” Journal of Labor Economics, Vol. 8 (Jan 1990): pp. S75-S105.
• Fortin, Nicole M. and Thomas Lemieux. “Institutional Changes and Rising Wage Inequality: Is there a Linkage?” Journal of Economic Perspectives, Vol. 11 (Mar 1997): pp. 75-96
• Freeman, Richard B. “Unionism and the Dispersion of Wages.” Industrial and Labor Relations Review 34, (Oct 1980): pp. 3-23.
• Freeman, Richard B. “Union Wage Practices and Wage Dispersion Within Establishments.” Industrial and Labor Relations Review 36, (Oct 1982): pp. 3-21.

57
• Freeman, Richard B. “Longitudinal Analyses of the Effects of the Trade Unions.” Journal of Labor Economics 2, (Jan 1984): pp. 1-26.
• Freeman, Richard B. “Contraction and Expansion: The Divergence of Private Sector and Public Sector Unionism in the United States.” The Journal of Economic Perspectives, Vol. 2 (Apr 1988): pp. 63-88.
• Freeman, Richard B. “How Much Has De-Unionization Contributed to the Rise in Male Earnings Inequality?” in S. Danziger and P. Gottschalk, eds. Uneven Tides: Rising Inequality in America. New York: Russell Sage Foundation, 1993.
• Freeman, Richard B. and James L. Medoff. What Do Unions Do? New York: Basic Books, 1984.
• Friedman, Milton. Capitalism and Freedom, Chicago: University of Chicago Press, 1962.
• Goldin, Claudia and Robert Margo. “The Great Compression: The Wage Structure in the United States at Mid-Century,” Quarterly Journal of Economics, Vol. 107 (Feb 1992): pp. 1-34
• Hirsch, Barry T. and Edward J. Schumacher. “Match Bias in Wage Gap Estimates Due to Earnings Imputation.” Journal of Labor Economics, Vol. 22, No. 3, (July 2004): pp. 689-722
• Hirsch, Barry T. and David A. Macpherson, Union Membership and Earnings Data Book: Compilations from the Current Population Survey (2003 Edition). Washington, DC: Bureau of National Affairs, 2003.
• Johnson, George E. and Kenwood C. Youmans. “Union Relative Wage Effects by Age and Education,” Industrial and Labor Relations Review 24, (Jul. 1971): pp. 171-179.
• Johnson, George E. “Economic Analysis of Trade Unionism.” The American Economic Review, Vol. 65 (May, 1975): pp. 23-28.
• Juhn, Chinhui, Kevin M. Murphy and Brooks Pierce. “Wage Inequality and the Rise in Returns to Skill.” The Journal of Political Economy, Vol. 101 (Jun 1993): pp 410-442.
• Katz, Lawrence F., and David H. Autor. “Inequality in the Labor Market.” In Orley Ashenfelter and David Card, eds. Handbook of Labour Economics, Amsterdam and New York; North Holland, 1999.
• Lewis, H. Gregg. Unionism and Relative Wages in United Staes: An Empirical Inquiry. Chicago: University of Chicago Press, 1963.
• Lewis, H. Gregg. Unionism and Relative Wage Effects: A Survey. Chicago: University of Chicago Press, 1986.
• Gosling, Amanda and Thomas Lemieux. “Labor Market Reforms and Changes in Wage Inequality in the United Kingdom and the United States,” NBER Working Paper 8413. Cambridge, Mass.:National Bureau of Economic Research, 2001.
• Mishel, Lawrence and Matthew Walters. “How Unions Help All Workers.” Briefing Paper, Economic Policy Institute, (Aug, 1993)

58
• Ozanne, Robert. “A Century of Occupational Differentials in Manufacturing.” The Review of Economics and Statistics, Vol. 44, No. 3. (Aug., 1962): pp. 292-299.
• Reynolds, Lloyd G. and Cynthia H. Taft. The Evolution of Wage Structure. New Haven, Conn.: Yale University Press, 1956.
• Rosen, Sherwin. “Unionism and the Occupational Wage Structure in the United States” International Economic Review, Vol. 11, No. 2. (Jun., 1970): pp. 269-286.

59
VII. Notes 1. Let Var(X) be denoted by 2σ .
[ ]( )22 E X E Xσ = −
If there was no dispersion of variable X, all observations of X would be equal and no inequality would be present. Therefore, E[X] = X. Resultantly, E[02] = 0 and Var(X) = 0.
2. To preserve space, let W | I=i, T=t, U=1 be written as W | i, t, U=1 and let W | I=i, T=t, U=0
be written as W | i, t, U=0 and so forth. This applies to other analogous expressions also. Using the law of iterated expectations,
( )( ) ( ) ( )( )
( ) ( ) ( )( )
( ) ( ) ( ) ( )( )
( )( )
2 22
2
2
2
| | , , 1 1 | | , , 0
| , , 1 | , , 1 | | , , 1
1 | , , 0 | , , 0 | | , , 0
| , , 1 | , , 1
t it it it iti i
it iti
it iti
it iti
P E W E W t i t U P E W E W t i t U
P E W E W i t U E W i t U E W t i t U
P E W E W i t U E W i t U E W t i t U
P E W E W i t U i t U
σ µ µ
µ
µ
µ
= − = + − − =
= − = + = − =
+ − − = + = − =
= − = =
∑ ∑
∑
∑
∑
( ) ( )( )
( )( ) ( ) ( )( )
( ) ( )( )
( ) ( ) ( )( )
( )
2
2
2
| , , 1 | | , , 1
2 | , , 1 | , , 1 | | , , 1
1 | , , 0 | , , 0
1 | , , 0 | | , , 0
2 1 | ,
it iti
it iti
it iti
it iti
it iti
P E E W i t U E W t i t U
P E W E W i t U E W i t U E W t i t U
P E W E W i t U i t U
P E E W i t U E W t i t U
P E W E W i t
µ
µ
µ
µ
µ
+ = − =
+ − = = − =
+ − − = =
+ − = − =
+ − −
∑
∑
∑
∑
∑ ( )( ) ( ) ( )( )
( ) ( ) ( )( )
( ) ( ) ( ) ( ) ( )( )
( ) ( ) ( )( )
2
2
2 22 2
, 0 | , , 0 | | , , 0
| , , 1 | , , 1 |
1 | , , 0 1 | , , 0 |
1 1
it it it iti i
it it it iti i
t tit it Uit it it Uit it it Nit it it Niti i i i
U E W i t U E W t i t U
P Var W i t U P E W i t U E W t
P Var W i t U P E W i t U E W t
P P W W P P W W
µ µ
µ µ
µ σ µ µ σ µ
= = − =
= = + = −
+ − = + − = −
= + − + − + − −
∑ ∑
∑ ∑
∑ ∑ ∑ ∑
This happens because: ( )( ) ( ) ( )( ) | , , 1 | , , 1 | | , , 1E W E W i t U E W i t U E W t i t U − = = − =

60
( )( ) ( ) ( )( )
( ) ( ) ( ) ( )( )
| , , 1 | , , 1 | , , 1 |
| , , 1 | , , 1 | , , 1 | 0
E W E W i t U i t U E W i t U E W t
E W i t U E W i t U E W i t U E W t
= − = = = −
= = − = = − =
3. This happens because:
( ) ( ) ( )( )( ) [ ] ( )( )
( ) ( ) [ ] ( ) ( )
( ) ( )[ ]
2 22 2 2
2 22 2
22 22 2 2
22 2
1 1
1 (1 ) 1 (1 )
1 1 1
1 1
t tt t Ut t Ut t Nt t Nt
t Ut t Nt t Ut t Ut t Nt t Nt t Ut t Nt
t Ut t Nt t t Ut Nt t t Ut Nt
t Ut t Nt t t Ut Nt
W W W W
W W W W W W
W W W W
W W
σ µσ µ µ σ µ
µσ µ σ µ µ µ µ µ µ
µσ µ σ µ µ µ µ
µσ µ σ µ µ
= + − + − + − −
= + − + − − − + − − − −
= + − + − − + − −
= + − + − −
4. The difference 2 2t τσ σ− can be expressed as follows:
2 2 2 2 2 2
2 2 2 2
( ) (1 ) ( ) (1 )( )
( ) (1 ) ( ) (1 )( )
Uit t Nit tt it it Uit it it Nit it it it iti i i i
Ui Nii i Ui i i Ni i i i ii i i i
P P P W W P W W
P P P W W P W W
τ
τ τ τ ττ τ τ τ τ τ τ τ τ τ
σ σ µ σ µ σ µ µ
µ σ µ σ µ µ
− = + − + − + − −
− + − + − + − −
∑ ∑ ∑ ∑
∑ ∑ ∑ ∑
2 2 2 2
2 2 2 2
( ) (1 ) ( ) (1 )( )
( ) (1 ) ( ) (1 )( )
Uit t Nit tit it Uit it it Nit it it it iti i i i
Ui Nii it Ui i it Ni i it i iti i i i
P P P W W P W W
P P P W W P W Wτ τ τ ττ τ τ τ τ τ
µ σ µ σ µ µ
µ σ µ σ µ µ
+ − + − + − − =
− + − + − + − −
∑ ∑ ∑ ∑
∑ ∑ ∑ ∑
2 2 2 2
2 2 2 2
( ) (1 ) ( ) (1 )( )
( ) (1 ) ( ) (1 )( )
Ui Nii it Ui i it Ni i it i iti i i i
Ui Nii i Ui i i Ni i i i ii i i i
P P P W W P W W
P P P W W P W W
τ τ τ ττ τ τ τ τ τ
τ τ τ ττ τ τ τ τ τ τ τ τ τ
µ σ µ σ µ µ
µ σ µ σ µ µ
+ − + − + − − +
− + − + − + − −
∑ ∑ ∑ ∑
∑ ∑ ∑ ∑
The first bracketed term represents changes in wage inequality if between time t and time τ, unionization rate remains constant and changes were observed only in industrial composition. The second bracketed represents the change in wage dispersion due to changes in the union sector. Using Jhun, Murphy and Pierce (1993), we can further decompose the first bracketed term:
2 2 2 2
2 2 2 2
( ) (1 ) ( ) (1 )( )
( ) (1 ) ( ) (1 )( )
Uit t Nit tit it Uit it it Nit it it it iti i i i
Ui Nii it Ui i it Ni i it i iti i i i
P P P W W P W W
P P P W W P W Wτ τ τ ττ τ τ τ τ τ
µ σ µ σ µ µ
µ σ µ σ µ µ
+ − + − + − −
− + − + − + − −
∑ ∑ ∑ ∑
∑ ∑ ∑ ∑

61
2 2 2 2
2 2 2 2
2 2
( ) (1 ) ( ) (1 )
( ) ( ) (1 ) (1 )
( ) ( )
it it Uit it it Nit i it Ui i it Nii i i i
i it Uit i it Uit i it Nit i it Niti i i i
Uit t Uit ti it i iti i
P P P P
P P P P
P W W P W W
P
τ τ τ τ
τ τ τ τ
τ τ
µ σ µ σ µ σ µ σ
µ σ µ σ µ σ µ σ
µ µ
= + − − − −
+ − + − − −
+ − − −
+
∑ ∑ ∑ ∑
∑ ∑ ∑ ∑
∑ ∑
( ) ( )
2 2
2 2
2 2
2 2
2
(1 )( ) (1 )( )
( ) (1 )( )
( ) (1 )( )
( ) (1 )
+ (
Nit t Nit ti it i iti i
Uit t Nit tit it it iti i
Ui Nii it i iti i
it i it Uit it i it Niti i
i it Uit Ui
W W P W W
P W W P W W
P W W P W W
P P P P
P
τ τ
τ τ τ ττ τ
τ τ
τ
µ µ
µ µ
µ µ
µ σ µ σ
µ σ σ
− − − − −
+ − + − −
− − − − −
= − + − −
−
∑ ∑
∑ ∑
∑ ∑
∑ ∑
∑
( ) ( )
2 2 2
2 2
2 2 2 2
) (1 )( )
( ) (1 )( )
( ) ( ) (1 ) ( ) ( )
i i it Nit Nii
Uit t Nit tit i it it i iti i
Uit t Ui Nit t Nii it i iti i
P
P P W W P P W W
P W W W W P W W W W
τ τ τ
τ τ
τ τ τ ττ τ
µ σ σ
µ µ
µ µ
+ − −
+ − − + − − −
+ − − − + − − − −
∑
∑ ∑
∑ ∑
The second term can be written as follows:
( ) ( )
2 2 2 2
2 2 2 2
2
( ) (1 ) ( ) (1 )( )
( ) (1 ) ( ) (1 )( )
( ) 1 1
Ui Nii it Ui i it Ni i it i iti i i i
Ui Nii i Ui i i Ni i i i ii i i i
it i i Ui it i ii i
P P P W W P W W
P P P W W P W W
P P
τ τ τ ττ τ τ τ τ τ
τ τ τ ττ τ τ τ τ τ τ τ τ τ
τ τ τ τ τ
µ σ µ σ µ µ
µ σ µ σ µ µ
µ µ σ µ µ
+ − + − + − −
− + − + − + − −
= − + − − +
∑ ∑ ∑ ∑
∑ ∑ ∑ ∑
∑ ∑
( ) ( )
( ) ( )
2
2 2
2 2 2 2
( ) 1 1 ( )
( ) ( ) ( )
Ni
Ui Niit i i it i ii i
Ui Niit i i Ui Ni it i ii i
P W W P W W
P P W W W W
τ
τ τ τ ττ τ τ τ
τ τ τ ττ τ τ τ τ τ
σ
µ µ µ µ
µ µ σ σ µ µ
+ − − + − − + −
= − − + − − − −
∑ ∑
∑ ∑
5. Card authored a largely identical paper, “Falling Union Membership and Rising Wage
Inequality: What’s the Connection?” as part of the National Bureau of Economic Research

62
Working Paper Series (Working Paper 6520), in 1998. However, the 2001 study is the one most-oft cited and referred to in publications.
6. The regional division of states are as follows: West Montana Idaho Wyoming Colorado New Mexico Arizona Utah Nevada Washington Oregon California Alaska Hawaii
Midwest Ohio Indiana Illinois Michigan Wisconsin Minnesota Iowa Missouri South Dakota North Dakota Nebraska Kansas
South Delaware Maryland D.C. Virginia West Virginia North Carolina South Carolina Georgia Florida Kentucky Tennessee Alabama Mississippi Arkansas Louisiana Oklahoma Texas
Northeast Maine New Hampshire Vermont Massachusetts Rhode Island Connecticut New York New Jersey Pennsylvania
7. Note that a concentration of union membership within the higher paid workers does not
necessarily mean that unions are most effective in raising the wages of those already being paid the most. In fact, Lewis (1986) argues that unions raise wages of low wage workers more than unions raise wages of high wage workers.
8. In dealing with wages, log(wage) is conventionally used by economists because an x point change in log(wage) approximates to an x% change in wage. Ex: log(wage) increases from 2.31 to 2.33 approximates to a 2% change in wage.


